Growth and CO2 Emissions: How do Different Countries...
38
Growth and CO2 Emissions: How do Different Countries Fare? Environment Department The World Bank October 2007
-
Upload
phunghuong -
Category
Documents
-
view
215 -
download
0
Transcript of Growth and CO2 Emissions: How do Different Countries...
Growth and CO2 Emissions: How do Different Countries Fare?
Environment Department The World Bank
October 2007
Contents
Executive summary ..............................................................................................................................ii Background ..........................................................................................................................................1
The technique of decomposition analysis ........................................................................................2 Previous studies on the decomposition of CO2 emissions from fossil fuels ...................................4 Variables and data sources ...............................................................................................................5 Emissions levels and decomposition of emissions changes between 1994 and 2004......................6
Conclusions ........................................................................................................................................23 Annex 1 ..............................................................................................................................................26
Decomposition of CO2 emissions for India comparing EIA and Government of India data ........26 Annex 2 ..............................................................................................................................................28 Bibliography.......................................................................................................................................32
Tables
Table 1: CO2 Emissions in 2004 (in million metric tons) ..................................................................7 Table 2: The Ratio of fossil fuel CO2 emissions to total GHG emissions in 2000 ..........................10 Table 3: Emissions per unit of GDP and GDP per capita in 2004 * .................................................12 Table 4: Emissions per capita (tons per person) and GDP per capita (2000 US$ PPP) in 2004 ......13 Table 5: Decomposition of the change in CO2 emissions between 1994 and 2004 (million metric tons)*..................................................................................................................................................15 Table 6: Coefficients of Offsetting for Decomposition of Emissions 1994 – 2004...........................18 Table 7: Offsetting and changes in emissions 1994–1999 and 1999–2004 ......................................21
Figures
Figure 1: Top Twenty Countries Ranked by Percentage Growth in Emissions between 1994 and 2004......................................................................................................................................................9 Figure 2: Emissions per unit of GDP measured at PPP and at MER in 2004 (tonnes/2000$ million)............................................................................................................................................................11 Figure 3: Emissions per capita and GDP per capita in 2004.............................................................14 Figure 4: Decomposition for “Negative Offsetting” Countries: 1994 – 2004 ..................................20
The paper is prepared by a World Bank team comprising Robert W. Bacon (lead author), Soma Bhattacharya, Richard Damania, Masami Kojima and Kseniya Lvovsky. Valuable comments were provided by peer reviewers Govinda Timilsina of the World Bank and Joe Roop of Pacific Northwest Labs (US), and by Stene Jorgensen, Charles Di Leva, Laszlo Lovei, Alan Miller, and Sachiko Morito of the World Bank Group. The authors appreciate guidance and support by Gary Stuggins and Warren Evans.
ii
Executive summary The recent International Panel on Climate Change Fourth Assessment report (2007) has deepened understanding of the magnitude of climate change, its consequences and possible policies to reduce and mitigate its effects. The combustion of fossil fuels is the largest single contributor to carbon dioxide (CO2) and total greenhouse gas (GHG) emissions and, of all major sources, has grown the most rapidly over the period 1970 to the present. Furthermore, the IPCC 2007 report shows that a long-observed trend in declining global CO2 emission intensity per unit of GDP reversed around the year 2000. This means that, with world economic growth the strongest in decades, global CO2 emissions are growing faster than at any time since 1970. The growth of CO2 emissions over time has shown substantial variation among countries, and there is considerable interest as to which countries have recently experienced rapid growth of emissions and why. The relation between this growth and changes in various structural factors in the economies, such as the energy intensity and the share of fossil fuels in total energy consumption, as well as of the growth of the economy itself, has been the focus of a number of studies. This report:
1. Provides comparative data on a number of measures of emissions for a wide range of countries, allowing comparisons to be made among the different measures. The main data sources are the Energy Information Administration of the US Department of Energy and the World Resources Institute.
2. Provides a decomposition of the change in fossil fuel CO2 emissions between 1994 and 2004 into changes in five factors: the average emission per unit of fossil fuel consumed (the carbon intensity of fossil fuel); the share of fossil fuel consumption in total energy consumption (including fossil fuel consumption and non-fossil fuel power production, but not solar heating of water, etc.); total energy consumption per unit of GDP (energy intensity); GDP per capita; and population. This analysis excludes the use of biomass, for which there is not comparable data available
3. Carries out this decomposition for the top 70 countries in terms of 2004 emissions of CO2 from fossil fuels. Half of these are developing countries. This provides a much wider coverage of emissions and their decomposition than given in previous studies.
4. Bases the decomposition on changes in emissions and the related factors between 1994 and 2004, providing a more up to date study than others currently available. This update is important because of significant changes observed in the growth of CO2 emissions for a number of countries around the year 2000.
5. Splits the decade into two five year sub-periods (1994-1999, 1999-2004) in order to identify how the relative importance of the different factors changed during the period.
The principal findings of the report are:
1. The 70 largest emitters of CO2 from fossil fuels in 2004 covered 95 % of the global total. In terms of the country level of emissions, the largest emitters were largely drawn from higher income developed countries, but it also included all the G+5 countries. In addition, several large oil producing countries were in the top thirty. During the period 1994-2004, some fifteen countries experienced a fall in CO2 emissions from fossil fuel consumption, and this group comprised mainly former Soviet Union and Eastern European countries. The
iii
percentage growth in emissions during the decade showed considerable variation among countries, with some large emitters experiencing large growth, and others relatively low growth.
2. The ratio of CO2 emissions from consumption of fossil fuels to the total GHG emissions is more than 50% for 55 of the countries, and rises to more than 80% for 14 countries. The group of countries where the ratio is particularly low includes those where the most effective policies to reduce GHG emissions are likely to be distinct from those designed to reduce CO2 emissions from fossil fuels.
3. The inter-country distribution of emissions per unit of GDP per capita (emissions intensity) was measured using GDP at purchasing power parity (PPP) and at market exchange rates (MER). The emissions intensity was for most countries very much lower on the former measure. The ranking of countries by emissions intensity also changed substantially relative to the ranking by total emissions, and was not systematically related to GDP per capita.. Since the ratio of the measure of GDP at PPP to GDP at MER stayed constant throughout the decade, the percentage change in emissions per unit of GDP was identical for the two measures, and the analysis of changes in emissions utilized the PPP measure.
4. The ranking of countries by emissions intensity changed substantially relative to the ranking by total CO2 emissions. The G+5 countries, with the exception of South Africa, ranked very much lower on emissions intensity than on total emissions among the group of 70 countries studied. Several middle-income countries were amongst those with the highest rankings.
5. Emissions per capita were positively but only moderately correlated with GDP per capita and showed no evidence of an eventual decline in emissions per capita at higher per capita income (the Environmental Kuznets Curve phenomenon). The rankings relative to those for total emissions, or emissions per unit of GDP were quite different. Some countries with large populations, such as India and Indonesia, moved almost to the bottom of the ranking based on this measure, while some countries with small populations moved to the top of the rankings.
6. The decomposition analysis related the change in emissions during the decade to changes in the five factors. For the group of countries as a whole, GDP per capita was the dominant variable linked to the growth in total emissions, with population being only one half as important. However, the decrease in energy intensity was so large that it offset about forty percent of the combined influence of these two factors. The fossil fuel mix showed a small negative effect on the change in emissions, while the share of fossil fuels in total energy consumption contributed a small increase to the change in emissions.
7. The relative importance of the three factors that could be directly linked to policies to slow down the growth of emissions (fossil fuel mix, share of fossil fuels in total energy and energy intensity of GDP) to the positive effects of GDP growth is measured by the “offsetting” coefficient. For the decade as a whole, fifteen countries more than offset the combined impacts of GDP and population growth. This group consisted mainly of former Soviet Union and Eastern European countries, but also included two Scandinavian countries, whose policies towards emissions may give important clues for other countries wishing to slow the growth of emissions. There were also a group of nineteen countries where the changes in the potential offsetting factors actually led to a further increase in emissions beyond that which would have been expected from the growth of GDP (“negative offsetting”). The group included several oil producers, but also some non-oil producing high income developed countries.
8. Among countries with the largest absolute emissions, the USA was able to offset a sizeable fraction of its growth in emissions but, given the size of the economy, the increment was
iv
still large. By contrast, Japan, with relatively low income and population growth, experienced negative offsetting, but the total increment was relatively small. Russia fully offset the growth in emissions related to income and population during this period but, given that population decline and massive changes in sectoral structure and energy efficiency were stimulated by the political changes during this period, a similar performance may be difficult to maintain in the coming decade. China and India, while enjoying rapid growth during the decade, were also able to offset significant portions of the potential growth in emissions.
9. When the data was split into two five-year sub-periods, it became apparent that for some countries large shifts in structure had taken place in the course of the decade. For one group of countries, the coefficient of offsetting increased substantially – this group included several developing countries. An important group of thirteen countries experienced negative offsetting in both sub-periods, indicating that this was a longer-term trend – the group included some major oil producers, and some high income non-oil producing countries. Six countries moved from positive to negative offsetting between the two sub-periods, indicating that they had actually seen emissions rise faster relative to GDP. The experiences of the largest emitters across the two sub-periods were quite different. The USA and India both experienced substantial offsetting throughout the period, while China and Russia both experienced high offsetting in the first period, but much reduced offsetting in the second. For the group as a whole, there was no apparent correlation between the improvement in offsetting and the level of GDP, indicating that during the period studied higher income countries had not performed better in slowing the growth of emissions relative to GDP.
10. However, a number of countries did experience improved performance of emissions relative to GDP, suggesting that there need not be a negative trade-off between slowing the growth of emissions and maintaining high growth rates of the economy. Countries that were particularly successful in achieving high offsetting could well serve as case studies for how this might be achieved. On the other hand, the experience of several countries also makes it clear that, without active policies to curb the emissions intensity of the economy, emissions can actually increase faster than GDP, even when GDP has reached a high level. More detailed analysis could shed further light on the factors determining aggregate energy intensity for an economy, since this factor appears to have accounted for the largest differences in performance between economies, once the growth of GDP is allowed for. In particular, the distinction between changes due to sectoral composition and changes due to improvements in energy efficiency may be helpful in giving clues as to the future course of emissions, and the possibilities of finding policies that could make a substantial difference to global CO2 emissions.
1
Background The recent International Panel on Climate Change Fourth Assessment report (2007) has deepened understanding of the magnitude of climate change, its consequences and possible policies to reduce and mitigate its effects. The combustion of fossil fuels is the largest single contributor to carbon dioxide (CO2) and total greenhouse gas (GHG) emissions and, of all major sources, has grown the most rapidly over the period 1970 to the present. Furthermore, the IPCC 2007 report shows that a long-observed trend in declining global CO2 emission intensity per unit of gross domestic product (GDP) has reversed around the year 2000, meaning that, with strongest economic growth of the world economy in decades, global CO2 emissions are growing faster than at any time since 1970. The growth of CO2 emissions over time has shown substantial variation among countries, and there is considerable interest as to which countries have recently experienced rapid growth of emissions. The relation between this growth and changes in various factors, such as the energy intensity and the share of fossil fuels in total energy consumption, as well as the growth of the economy itself, has been the focus of a number of studies. The primary purpose of this report is to provide a comparative baseline analysis of the change in fossil fuel emissions of a large number of countries that can serve as a starting point for detailed country by country investigation, and to provide focus on the key factors that are amenable to policy interventions. The principal tool for describing the relationship between the growth of emissions and changes in various related factors is “decomposition analysis”. Although there is substantial literature that applies this technique to fossil fuel emissions of CO2, much of this concentrates on high income countries, with one or two large developing countries also being covered. Studies covering a slightly wider range of countries have used data from 2002 or older so recent important developments are not reflected in these studies. This report is designed to serve several purposes:
1. It provides a statistical decomposition or breakdown of fossil fuel CO2 emissions into five factors: the average emission per unit of fossil fuel consumed (the carbon intensity of fossil fuel); the share of fossil fuel consumption in total energy consumption (including fossil fuel consumption and non-fossil fuel power production, but not solar heating of water, etc.); total energy consumption per unit of GDP (energy intensity); GDP per capita; and population. This analysis excludes the use of biomass, for which there is no comparable data available.
2. The decomposition is carried out for the top 70 countries in terms of 2004 emissions of CO2 from fossil fuels. Half of these are developing countries. This provides a much wider coverage of emissions and their decomposition than have been analyzed in previous studies.
3. The decomposition is based on changes in emissions and the related factors between 1994 and 2004, providing a more up to date study than others currently available. This update is important because of significant changes observed in the growth of CO2 emissions for a number of countries around the year 2000, which is explored through splitting the decomposition into two five-year sub-periods. The analysis compares annual emissions at these two points in time and relates the change in these emissions to changes in a number of variables over the same period.
2
The report begins with an account of the technique of statistical decomposition analysis and briefly mentions some other studies which have used it. This is followed by a discussion of the model used in the present report and the data sources. Countries in the study are then ranked in terms of various measures of emissions including: total CO2 fossil fuel emissions; emissions per capita; and emissions per unit of GDP. This is followed by the five factor decomposition and discussion of the results found.
The technique of decomposition analysis The decomposition of fossil fuel CO2 emissions into related factors dates back to a series of studies undertaken in the 1980s, mainly at industry level for a single industrialized country. Kaya (1990) was influential in proposing an identity around which a decomposition of emissions related to four factors could be based: CO2 emissions from energy ≡ CO2 emissions per unit of energy consumed
× energy consumed per unit of GDP × GDP per capita
× population (1) This has subsequently been expanded: CO2 emissions from energy ≡ CO2 emissions per unit of fossil fuel consumed
× fossil fuel consumed per unit of energy consumed × energy consumed per unit of GDP
× GDP per capita × population (2)
These identities focus on CO2 emissions from the combustion of fossil fuels (oil, gas and coal). Although these are identities that must always be satisfied by the data, and are not based on an estimated model of causal links between the variables, the movements of the components provide an important guide to changes in factors influencing CO2 emissions from energy use. Because the variable of interest, emissions from the consumption of energy, is related to the product of several factors, the change in emissions cannot simply be expressed as the sum of absolute changes in the five factors. Various solutions to providing a satisfactory and complete decomposition of the changes in emissions, related to the sum of a measure of changes of the factors, have been reviewed by Ang (2004) and a widely used solution is based on the so called logarithmic mean Divisia index (LMDI 1) as explained by Ang (2005). According to Lee and Oh (2006), equation (2) can be rewritten as follows: E = the amount of CO2 emissions from the consumption of fossil fuel FEC = the amount of fossil fuel consumption TEC = the total primary energy consumption GDP = gross domestic product POP = population.
3
Hence emissions in country i can be expressed as: Ei ≡ (Ei / FECi) × (FECi /TECi) × (TECi / GDPi) × (GDPi /POPi) × (POPi) (3) ≡ Ci Si Ii Gi Pi (4) The change in a country’s emissions (∆Ei) between a base year 0 and an end year T can be decomposed into the effects of : (i) the change in C (the emissions per unit of fossil fuel, termed the coefficient effect, Ceff) ; (ii) the change in S (the share of fossil fuels in total energy, termed the substitution effect, Seff); (iii) the change in E (the energy intensity effect, Ieff); the change in GDP per capita (Geff); and (v) the change in population (Peff). ∆Ei ≡ Ei(T) – Ei(0) ≡ Ceff + Seff + Ieff + Geff + Peff (5) The effects, in turn, can be calculated from the following formula using LMDI1: Ceff = [Ei(T) – Ei(0)] { ln [ Ci(T) / Ci(0) ] / ln [ Ei(T) / Ei(0) ] } (6) Other effects (Seff, Ieff, Geff ,Peff) can also be derived from similar formulae. With data on all the variables for a common base year and terminal year, the decomposition of the change in emissions can be calculated according to equation (6). The change in emissions will reflect changes in the five factors because of the nature of the identity linking them. To interpret these links, it is necessary to consider the circumstances under which the factors that can be directly influenced by emissions related policies will change. The carbon emissions per unit of total fossil fuel consumption will rise if there is a relative shift to higher emitting fuels (for example, the share of coal rising relative to the share of gas). This could occur even if the total quantity of fossil fuels consumed stayed constant. The ratio of fossil fuels consumed to total energy consumed will rise if the share of non-fossil fuels (hydro, nuclear and renewables) falls relative to the share of fossil fuels consumed. The energy of intensity of the economy will fall if the use of energy increases more slowly than the level of GDP. This can occur for two main reasons. Firstly, if the sector structure of GDP changes towards sectors that are less energy intensive, without any other changes, the average use of energy in total GDP would fall. Secondly, if energy efficiency increased in one or more sectors, without any structural shifts, the overall energy intensity would fall. The aggregate form of decomposition analysis used in this paper does not distinguish between these two effects. The exclusion of non-commercial use of biomass fuel limits the generality of analysis, especially as its utilization varies greatly among countries. If users switch from non-commercial biomass to commercial fuels, this would produce an increase in measured energy intensity. It could also alter the coefficient of fossil fuel emissions and the share of fossil fuels in total energy use, depending on which energy source replaced biomass. However, its omission will not have a large effect on the level of total CO2 emissions because the use of biomass is carbon-neutral.
1 For small changes in the factors, this formula shares the total change in emissions by the ratio of the growth rate of each factor to the growth rate of emissions
4
Previous studies on the decomposition of CO2 emissions from fossil fuels A large number of studies using decomposition analysis now exist. Those of the greatest interest in relation to this report are ones that make a comparative analysis using several countries, especially those including a wide range of income levels. Some of the most recent and related studies are briefly mentioned below. These studies do not all utilize the LMDI decomposition but, since the principles are similar in each case, this aspect is not reported.
1. Ang and Zhang (1999) used the five factor decomposition for groupings of countries in 1993 to decompose the differences between regions of the emissions from fossil fuel use. The regions included three OECD groupings, the former Soviet Union and Central and Eastern Europe, and the rest of the world. Differences in GDP and energy intensity were the dominant factors in explaining the large differences found between regions.
2. Viguier (1999) used a four factor decomposition for the period 1980 – 1990 and for 1990-1994 for six countries (USSR, USA, Hungary, France, UK and Poland). The study covered emissions of NOx and SO2 as well as CO2. The reduction of emissions intensity in Western countries was accompanied by a reduction in energy intensity, while in the other countries the energy intensity rose. However, changes in fuel mix, especially in Russia, provided some offset to the increase in energy intensity.
3. Paul and Bhattacharya (2004) used a four factor decomposition for the four major sectors (agriculture, industry, residential and other) for India between 1980 and 1996. They separated the energy intensity effect from a structure effect by analyzing the emissions of each sector and the GDP of each sector. Allowing for this refinement, they showed that the GDP effect was dominant, but that the structure effect was associated with an increase in emissions, as the economy shifted relatively into sectors with higher emissions per unit of GDP. Changes in energy intensity for each sector were of relatively low importance once structural changes had been factored into the decomposition.
4. Nag and Parikh (2005) analyzed the decomposition of total emissions from the Indian power sector between 1974 and 1998 using a sector based identity similar to that based at an economy level as explained above. They produced scenarios of emissions until 2015 based on assumptions about changes in the various coefficients identified in the decomposition.
5. Wang, Chen and Zou (2005) carried out a five factor decomposition analysis for the People’s Republic of China for the periods 1957–1979, and 1979–2000. They showed that the change in economic policy in 1979 was associated with a large change in the importance of the different factors, with the reduction in energy intensity post 1979 playing a large role in holding back the growth in emissions.
6. Lise (2006) used a four factor decomposition for Turkey for the period 1980-2003. Again this study identified a structural (composition) effect for the changing shares of sectors in GDP. The GDP (scale) effect, structure effect, and carbon intensity effect (the coefficient effect plus substitution effect) were all associated with substantial increases in emissions, while energy intensity was associated with a small reduction in emissions.
7. Ebohon and Ikeme (2006) derived a three factor decomposition for nine non-oil producing and six oil producing countries in Africa between 1971 and 1981. The results were very different for oil producers and non-oil producers, with much larger effects observed for non-oil producers. The aggregate results were dominated by Nigeria in the oil producing group and South Africa in the non-oil producing group. In both groups several countries experienced a fall in energy intensity during this period.
5
8. Lee and Oh (2006) produced a five factor decomposition for 15 countries in the Asia Pacific Economic Cooperation region (APEC) between 1980 and 1998. This group includes high, middle and lower income representatives. Although GDP and population were strong factors associated with an increase in emissions in all cases, in the high income countries falls in energy intensity and the share of fossil fuels, and a change in the fossil fuel mix all contributed to partially offsetting the impacts of the growth in the economies. The group of lower income countries was dominated by China which, in this period, experienced a large fall in energy intensity, offsetting nearly half the impacts of the increase in income and population.
9. Herzog, Baumert and Pershing (2006) produced a four factor decomposition for a selection of eight countries between 1990 and 2002. The selection included the USA, China, the Republic of Korea, Brazil, Thailand, France, UK, and Ukraine. In most countries, the changing fuel mix was associated with a reduction in emissions, as was the decline in energy intensity, but GDP and population effects outweighed these in all cases except for the UK and Ukraine.
10. Liu and Ang (2007) reviewed a large number of studies using various approaches to decomposition analysis and discussed their strengths and weaknesses. They concluded that recently the LMDI 1 methodology has become the most widely accepted approach.
Variables and data sources To undertake a comparative analysis of a large number of countries it is important to work with a common data source for each series that covers all the countries in the sample, in order to ensure that a common methodology has been followed in compiling the data. This may minimize the chance that larger variations between observations are introduced solely because of the use of different assumptions in compiling the data. The period of 1994 to 2004 was chosen so as to permit a wide coverage of countries (data coverage is less full for earlier years) while focusing on the most recent data available for a sufficiently lengthy period to identify important changes in the relation between emissions and the various factors utilized. The definitions and sources are explained below.
The emission of CO2 from fossil fuel consumption (million metric tons) The data source for emissions of fossil fuel consumption was the US Department of Energy website2, produced by the Energy Information Administration (EIA). To arrive at the total emissions from all fossil fuels, it is necessary to aggregate the emissions from the three fuels involved (coal, oil, and natural gas) into common units. This is provided by the EIA through a two stage calculation. First, consumption of each fuel measured in physical units is converted into British thermal units (Btu) as a common energy unit that can be aggregated to provide a measure of total fossil fuel consumption3. The second step is to derive emissions of CO2 for each fossil fuel. Different fuels require an individual conversion factor from energy available to emissions produced, and the conversion factor for coal depends on the quality of coal consumed. Details of these conversion factors are not provided on the USDOE website. Data in million metric tons of CO2 emitted are provided for a list of 163 countries for every year in our data period and from these, the 70 countries with the largest CO2 emissions in 2004 were selected for further study.
2 http://www.eia.doe.gov/emeu/international/contents.html 3 For coal, which comes in various qualities ranging from lignite to hard coal, the conversion factor depends strongly on the type and quality of the coal consumed and can be a source of differences among various estimates of emissions.
6
The consumption of fossil fuels (quadrillion Btu) The EIA website provides consumption data for the three fossil fuels measured in Btu, and these are aggregated to provide the total fossil fuel consumption. The ratio of fossil fuel emissions to the consumption of fossil fuels provides the value of C (the fossil fuel coefficient of emissions). The consumption of primary commercial energy (quadrillion Btu) The EIA figures for the consumption of primary commercial energy includes oil, dry gas, coal, net hydro production, net nuclear production, and renewable sources of electricity supplied to the grid (net geothermal, solar, wind, and wood and waste). It does not include biomass or solar consumed outside of the power sector. The ratio of the consumption of fossil fuels to the total consumption of primary energy provides the value of S (the share of fossil fuels in total energy). The level of GDP (US$2000 at purchasing power parity) Data on the level of GDP is taken from the World Development Indicators, published by the World Bank. The data chosen was in constant $US 2000, valued according to purchasing power parity (PPP). Data valued at market exchange rates (MER) in constant $US was also investigated. Data valued at MER showed, in virtually every case, the same percentage increase between 1994 and 2004 as the data in PPP. This indicated that for each country, the ratio between exchange rate based and PPP based figures was constant throughout this period because of the lack of updating of the PPP calculations. The ranking of countries by energy intensity (energy consumption per unit of GDP) does change markedly when the calculation is shifted from PPP to MER, but this does not affect the decomposition analysis which focuses on changes in emission during the period. The ratio of total energy consumption to GDP (I) provides the measure of energy intensity.
The population of the country (millions) Data on population is taken from the UN Population Fund (UNFPA) and is based on extrapolations from the most recent census data available. The ratio of GDP to population (G) provides the measure of GDP per capita.
Although the data are taken from well established sources, where updating and regular publication are observed, there are clearly possibilities of differences between the common source and government’s own statistics. Differences in definition, differences in assumptions about conversion factors to energy equivalents and CO2 emissions, and lags in publications can all lead to divergences in figures given for the decomposition, as well as in the basic data used. Inferences made about individual country results are limited by the accuracy of the data available. Although it was not possible to undertake a country-by-country cross check on data, this was possible for India as part of the World Bank’s India Low Carbon Growth Study, and the results are discussed in Annex 1.
Emissions levels and decomposition of emissions changes between 1994 and 2004 This section begins with a description of the level of emissions in each country, measured as total emissions, emissions per unit of GDP and emissions per capita. This is followed by the
7
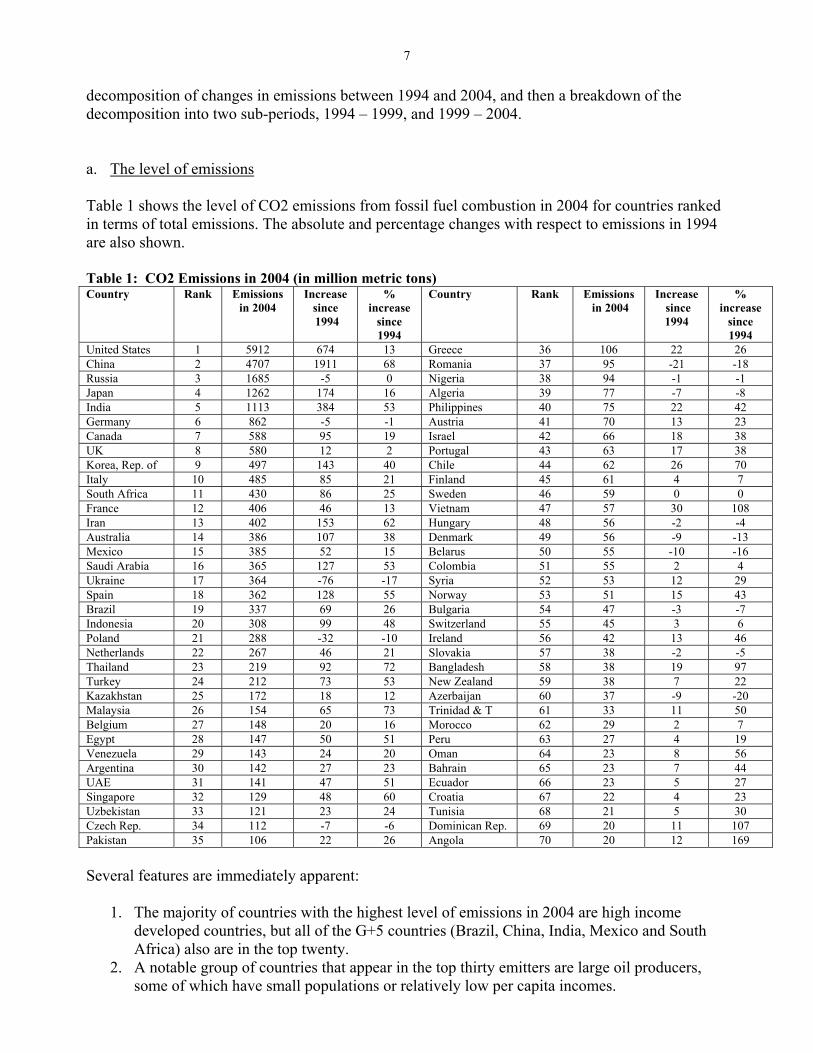
decomposition of changes in emissions between 1994 and 2004, and then a breakdown of the decomposition into two sub-periods, 1994 – 1999, and 1999 – 2004. a. The level of emissions Table 1 shows the level of CO2 emissions from fossil fuel combustion in 2004 for countries ranked in terms of total emissions. The absolute and percentage changes with respect to emissions in 1994 are also shown.
Table 1: CO2 Emissions in 2004 (in million metric tons) Country Rank Emissions
in 2004 Increase
since 1994
% increase
since 1994
Country Rank Emissions in 2004
Increase since 1994
% increase
since 1994
United States 1 5912 674 13 Greece 36 106 22 26 China 2 4707 1911 68 Romania 37 95 -21 -18 Russia 3 1685 -5 0 Nigeria 38 94 -1 -1 Japan 4 1262 174 16 Algeria 39 77 -7 -8 India 5 1113 384 53 Philippines 40 75 22 42 Germany 6 862 -5 -1 Austria 41 70 13 23 Canada 7 588 95 19 Israel 42 66 18 38 UK 8 580 12 2 Portugal 43 63 17 38 Korea, Rep. of 9 497 143 40 Chile 44 62 26 70 Italy 10 485 85 21 Finland 45 61 4 7 South Africa 11 430 86 25 Sweden 46 59 0 0 France 12 406 46 13 Vietnam 47 57 30 108 Iran 13 402 153 62 Hungary 48 56 -2 -4 Australia 14 386 107 38 Denmark 49 56 -9 -13 Mexico 15 385 52 15 Belarus 50 55 -10 -16 Saudi Arabia 16 365 127 53 Colombia 51 55 2 4 Ukraine 17 364 -76 -17 Syria 52 53 12 29 Spain 18 362 128 55 Norway 53 51 15 43 Brazil 19 337 69 26 Bulgaria 54 47 -3 -7 Indonesia 20 308 99 48 Switzerland 55 45 3 6 Poland 21 288 -32 -10 Ireland 56 42 13 46 Netherlands 22 267 46 21 Slovakia 57 38 -2 -5 Thailand 23 219 92 72 Bangladesh 58 38 19 97 Turkey 24 212 73 53 New Zealand 59 38 7 22 Kazakhstan 25 172 18 12 Azerbaijan 60 37 -9 -20 Malaysia 26 154 65 73 Trinidad & T 61 33 11 50 Belgium 27 148 20 16 Morocco 62 29 2 7 Egypt 28 147 50 51 Peru 63 27 4 19 Venezuela 29 143 24 20 Oman 64 23 8 56 Argentina 30 142 27 23 Bahrain 65 23 7 44 UAE 31 141 47 51 Ecuador 66 23 5 27 Singapore 32 129 48 60 Croatia 67 22 4 23 Uzbekistan 33 121 23 24 Tunisia 68 21 5 30 Czech Rep. 34 112 -7 -6 Dominican Rep. 69 20 11 107 Pakistan 35 106 22 26 Angola 70 20 12 169 Several features are immediately apparent:
1. The majority of countries with the highest level of emissions in 2004 are high income developed countries, but all of the G+5 countries (Brazil, China, India, Mexico and South Africa) also are in the top twenty.
2. A notable group of countries that appear in the top thirty emitters are large oil producers, some of which have small populations or relatively low per capita incomes.
8
3. Fifteen countries experienced absolute falls in emissions during the period, and these include several former Soviet Union and Eastern European countries, which underwent major transformations of the economy during the period.
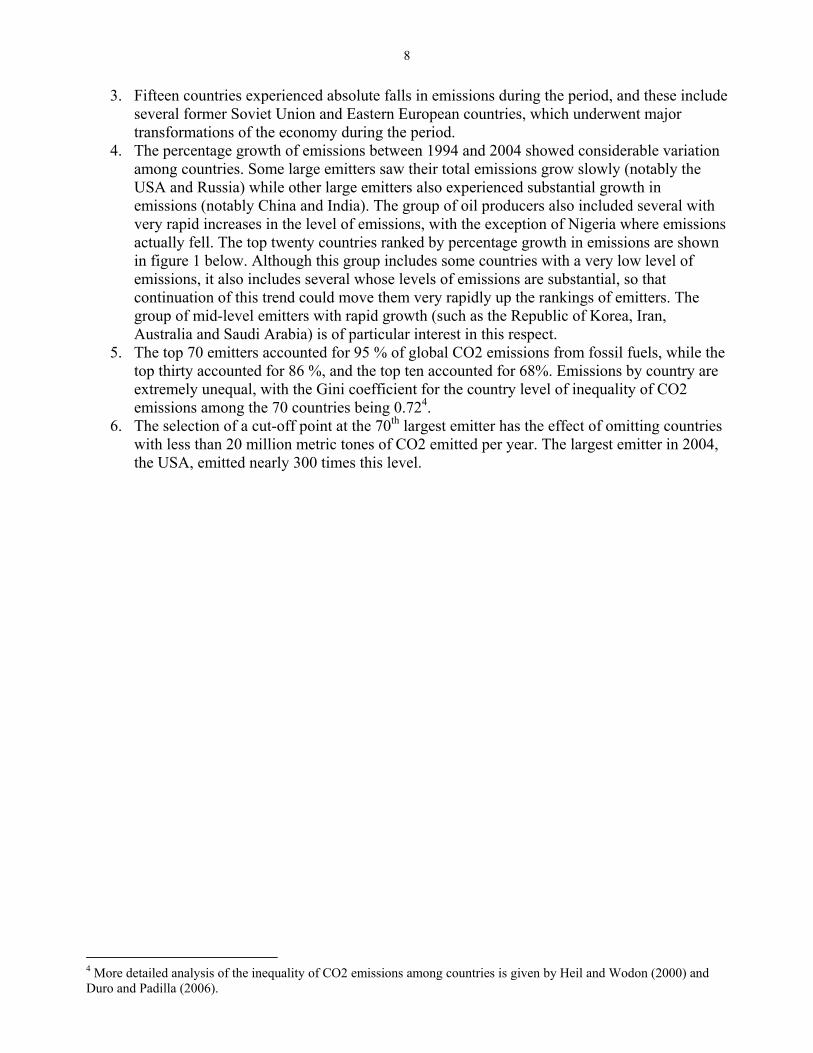
4. The percentage growth of emissions between 1994 and 2004 showed considerable variation among countries. Some large emitters saw their total emissions grow slowly (notably the USA and Russia) while other large emitters also experienced substantial growth in emissions (notably China and India). The group of oil producers also included several with very rapid increases in the level of emissions, with the exception of Nigeria where emissions actually fell. The top twenty countries ranked by percentage growth in emissions are shown in figure 1 below. Although this group includes some countries with a very low level of emissions, it also includes several whose levels of emissions are substantial, so that continuation of this trend could move them very rapidly up the rankings of emitters. The group of mid-level emitters with rapid growth (such as the Republic of Korea, Iran, Australia and Saudi Arabia) is of particular interest in this respect.
5. The top 70 emitters accounted for 95 % of global CO2 emissions from fossil fuels, while the top thirty accounted for 86 %, and the top ten accounted for 68%. Emissions by country are extremely unequal, with the Gini coefficient for the country level of inequality of CO2 emissions among the 70 countries being 0.724.
6. The selection of a cut-off point at the 70th largest emitter has the effect of omitting countries with less than 20 million metric tones of CO2 emitted per year. The largest emitter in 2004, the USA, emitted nearly 300 times this level.
4 More detailed analysis of the inequality of CO2 emissions among countries is given by Heil and Wodon (2000) and Duro and Padilla (2006).
9
Figure 1: Top Twenty Countries Ranked by Percentage Growth in Emissions between 1994 and 2004
PERCENTAGE INCREASE IN EMISSIONS: 1994-2004
0
20
40
60
80
100
120
140
160
180
Angola
Vietna
m
Domini
can R
epub
lic
Bangla
desh
Malays
ia
Thaila
ndChil
eChin
aIra
n
Singap
oreOman
Spain
Saudi
Arabia
Turkey
India
Egypt
United
Arab E
mirates
Trinida
d and
Tobag
o
Indon
esia
Irelan
d
Perc
ent
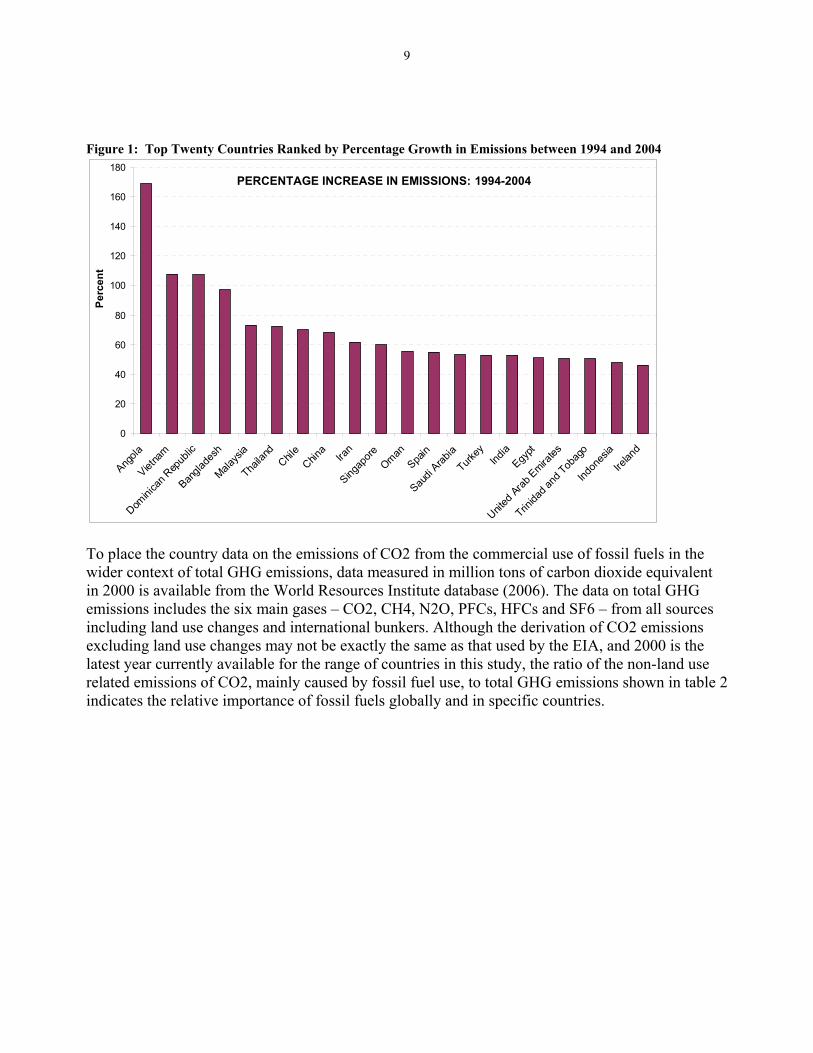
To place the country data on the emissions of CO2 from the commercial use of fossil fuels in the wider context of total GHG emissions, data measured in million tons of carbon dioxide equivalent in 2000 is available from the World Resources Institute database (2006). The data on total GHG emissions includes the six main gases – CO2, CH4, N2O, PFCs, HFCs and SF6 – from all sources including land use changes and international bunkers. Although the derivation of CO2 emissions excluding land use changes may not be exactly the same as that used by the EIA, and 2000 is the latest year currently available for the range of countries in this study, the ratio of the non-land use related emissions of CO2, mainly caused by fossil fuel use, to total GHG emissions shown in table 2 indicates the relative importance of fossil fuels globally and in specific countries.
10
Table 2: The Ratio of fossil fuel CO2 emissions to total GHG emissions in 2000
Country % CO2 to GHG Emissions Country % CO2 to GHG Emissions
Indonesia 9.6 Canada 70.1 Peru 10.9 Norway 70.1 Angola 13.8 Sweden 70.1 Malaysia 14.2 China 70.4 Brazil 15.1 Greece 70.5 Nigeria 20.2 Denmark 70.7 Ecuador 22.4 Belgium 73.1 Colombia 23.5 Romania 73.4 Bangladesh 26.3 Croatia 73.8 Pakistan 33.0 Bulgaria 74.1 Philippines 33.2 Syria 74.6 Venezuela 36.0 Hungary 74.9 New Zealand 40.7 Azerbaijan 76.0 Argentina 40.8 Spain 76.1 Singapore 43.0 Slovak Republic 76.6 Morocco 51.3 Israel 76.7 Thailand 54.1 Switzerland 76.8 United Arab Emirates 54.9 Russia 76.9 India 56.8 Kazakhstan 78.2 Tunisia 57.9 Saudi Arabia 78.8 Chile 58.8 Finland 78.9 Turkey 58.9 Austria 80.3 Vietnam 59.8 Bahrain 80.7 Mexico 60.6 United Kingdom 80.9 Ireland 62.9 Poland 81.1 Ukraine 64.9 Oman 81.1 Netherlands 65.1 South Africa 81.2 Australia 65.7 Italy 81.5 Egypt 66.3 Trinidad and Tobago 82.3 Uzbekistan 66.9 Germany 82.4 Algeria 67.3 Portugal 83.8 Dominican Republic 68.5 Korea, Republic of 86.0 Iran 68.5 Czech Republic 86.2 France 68.7 United States 87.5 Belarus 69.4 Japan 89.1 The ratio of fossil fuel CO2 emissions to total GHG emissions varies substantially among countries, but for the majority in the sample, fossil fuel CO2 is responsible for more than 50 percent of the total. For certain countries, such as Indonesia and Brazil, where other sources of GHG emissions are predominant, policies to reduce total emissions need to focus more intensively on non fossil fuel sources. A different perspective is provided by tabulating CO2 emissions per unit of GDP (the emissions intensity). Table 3 provides the information based on GDP measured at purchasing power parity
11
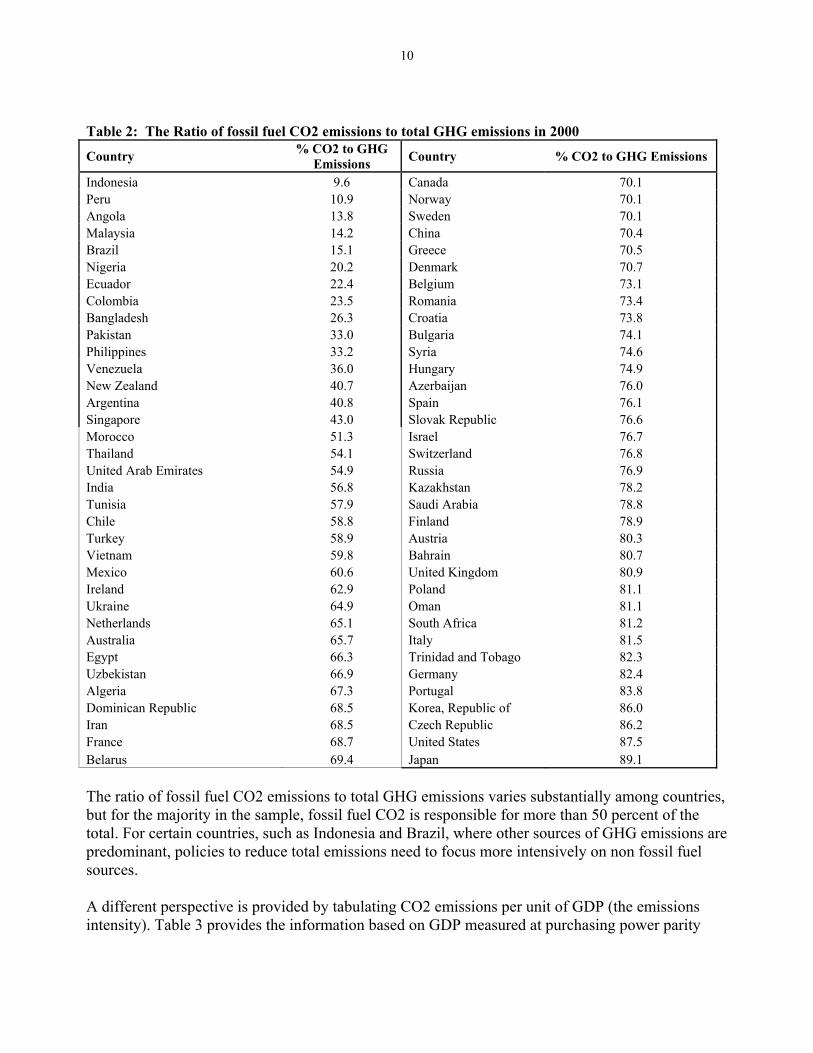
(PPP) and measured at market exchange rates (MER)5. The values of GDP per capita are also provided, and the list of countries is ranked by emissions per unit of GDP at PPP. Although the correlation between the two measures of GDP per capita is extremely high (R2 =0.92) most countries have rather different values on the two measures. For virtually all, the value at PPP is much higher than at MER, while just a few high income countries have GDP at MER slightly higher than at PPP. Accordingly, emissions per unit of GDP are generally very much lower when measured at PPP. Figure 2 shows a scatterplot of emissions per unit of GDP in 2004 based on the two measures.
Figure 2: Emissions per unit of GDP measured at PPP and at MER in 2004 (tonnes/2000$ million)
0
1000
2000
3000
4000
5000
6000
7000
8000
9000
0 500 1000 1500 2000 2500 3000
Emissions / GDP at PPP
Emission
s / G
DP
at M
ER
The data in table 3 indicates that the ranking of countries according to emissions per unit of GDP per capita at PPP is rather different from that for total emissions – with some low population countries appearing at the top of the ranking. Oil producers are again well represented in the top group. Of the G+5 countries, South Africa continues to score high on emissions per unit of GDP, but China and especially India, Brazil and Mexico move a long way down the list. Two major emitters, the USA and Japan, move well down the list of countries when ranked by emissions per unit of GDP. Higher and lower income countries are scattered throughout the table, suggesting that there is little evidence that there is a systematic relationship between emissions per unit of GDP and the level of GDP. The relationships between emission intensity and the measures of GDP per capita are negative - the squared correlation at MER is statistically significant at 21%, but that at PPP is statistically insignificant at 4%.
5 The choice between using GDP at market exchange rates and purchasing power parity to calculate emissions intensity is discussed by Stern (2006) and by Holtsmark and Alfsen (2004).
12
Table 3: Emissions per unit of GDP and GDP per capita in 2004 *
Country E/G PPP
E/GMER
GDP pc PP
GDP pc MER
Country E/G PPP
E/G MER
GDP pc PPP
GDP Pc MER
Uzbekistan 2686 7204 1712 639 Israel 437 548 22950 18319 Trinidad & T 2054 2938 12181 8516 Croatia 437 973 10890 4891 Kazakhstan 1785 6309 6504 1840 Indonesia 431 1564 3245 894 Bahrain 1749 2292 18148 13852 New Zealand 423 614 22423 15425 UAE 1488 1470 22135 22405 Turkey 422 923 6951 3175 Ukraine 1300 8254 5949 937 Finland 418 465 28078 25239 Russia 1298 5124 9018 2285 Germany 403 442 25905 23627 Azerbaijan 1240 4683 3551 940 Mexico 402 624 9061 5847 Saudi Arabia 1204 1698 12661 8977 Algeria 392 1161 6058 2046 Singapore 1202 1227 25209 24689 Chile 378 707 10168 5436 Venezuela 995 1188 5457 4568 Hungary 366 1017 15228 5474 South Africa 972 2821 9362 3226 Japan 364 259 27080 38041 Belarus 877 3308 6425 1704 India 362 1887 2831 542 Iran 867 3163 6738 1847 Spain 357 552 23782 15372 Syria 861 2484 3304 1145 Denmark 350 334 29338 30685 Bulgaria 799 3101 7577 1953 Pakistan 349 1235 1969 556 Nigeria 762 1663 959 439 Dominican Rep. 341 948 6786 2442 Angola 719 1594 1772 799 Portugal 332 548 18278 11096 Australia 690 848 28049 22846 UK 331 364 29406 26741 Oman 663 1027 13881 8961 Italy 326 428 25641 19527 China 661 2745 5441 1311 Argentina 316 495 11750 7486 Malaysia 658 1437 9374 4296 Ireland 314 359 33102 28981 Czech Rep. 638 1758 17233 6251 Norway 307 283 36234 39302 Poland 632 1497 11797 4983 Tunisia 290 897 7170 2322 Canada 631 747 29164 24618 Austria 288 340 29675 25087 Netherlands 569 670 28918 24560 Vietnam 274 1394 2520 496 Romania 569 2030 7688 2154 France 249 287 26989 23456 United States 552 552 36234 36234 Brazil 247 514 7406 3564 Korea, Rep. of 546 810 19108 12879 Morocco 243 727 3875 1297 Egypt 541 1286 3747 1577 Sweden 232 224 28226 29219 Slovakia 536 1589 13282 4479 Philippines 207 836 4431 1094 Belgium 499 599 28437 23681 Colombia 196 586 6275 2099 Greece 476 774 20077 12354 Switzerland 194 177 31958 35060 Ecuador 463 1154 3740 1501 Peru 194 445 5122 2227 Thailand 460 1457 7453 2356 Bangladesh 155 655 1756 416
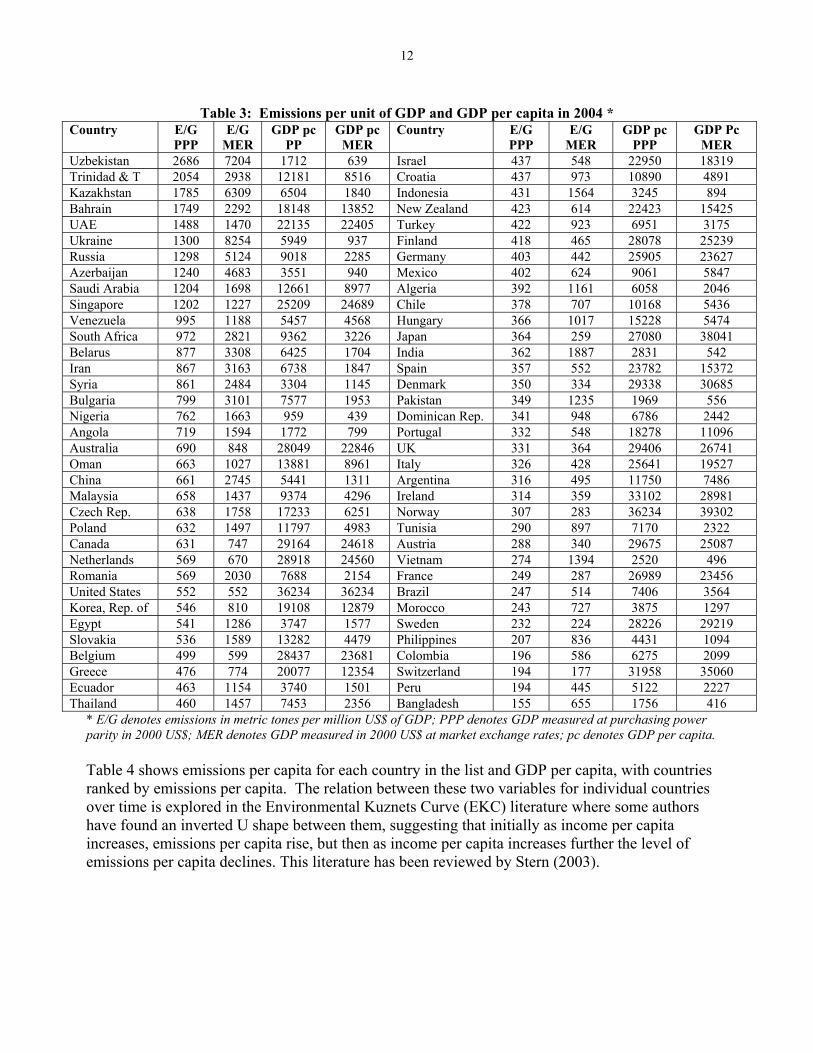
* E/G denotes emissions in metric tones per million US$ of GDP; PPP denotes GDP measured at purchasing power parity in 2000 US$; MER denotes GDP measured in 2000 US$ at market exchange rates; pc denotes GDP per capita. Table 4 shows emissions per capita for each country in the list and GDP per capita, with countries ranked by emissions per capita. The relation between these two variables for individual countries over time is explored in the Environmental Kuznets Curve (EKC) literature where some authors have found an inverted U shape between them, suggesting that initially as income per capita increases, emissions per capita rise, but then as income per capita increases further the level of emissions per capita declines. This literature has been reviewed by Stern (2003).
13
Table 4: Emissions per capita (tons per person) and GDP per capita (2000 US$ PPP) in 2004 Country Emissions
per capita GDP per
capita Country Emissions
per capita GDP per
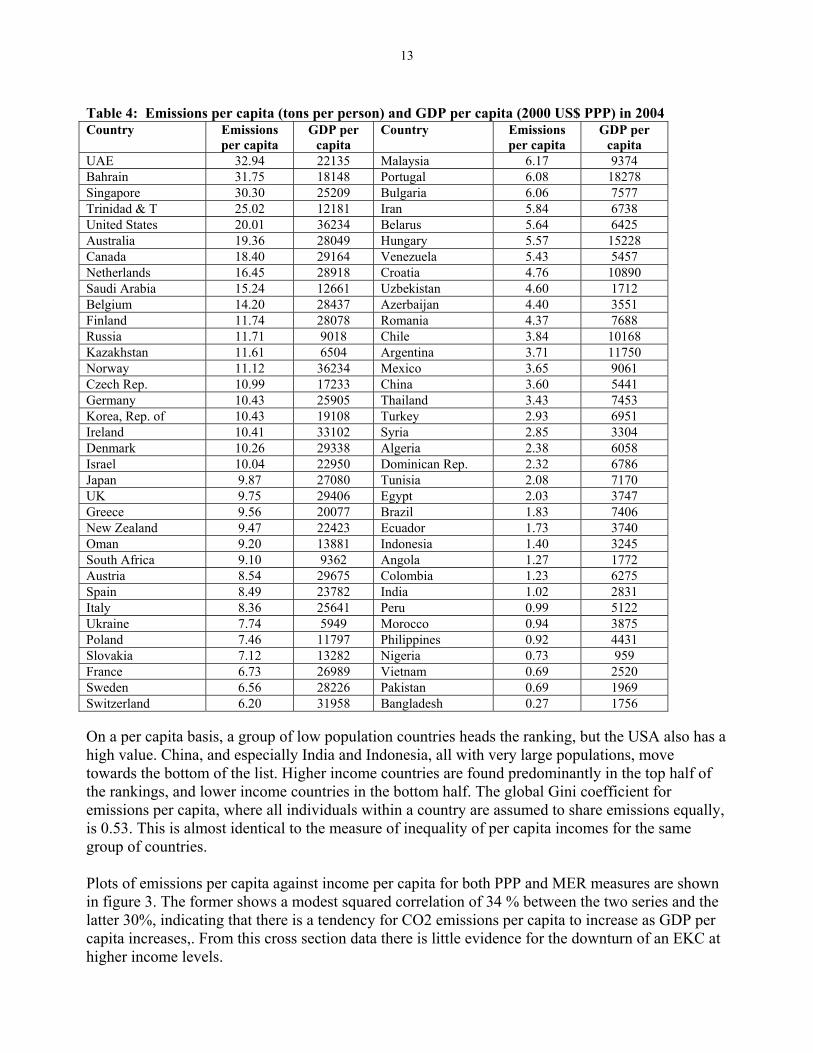
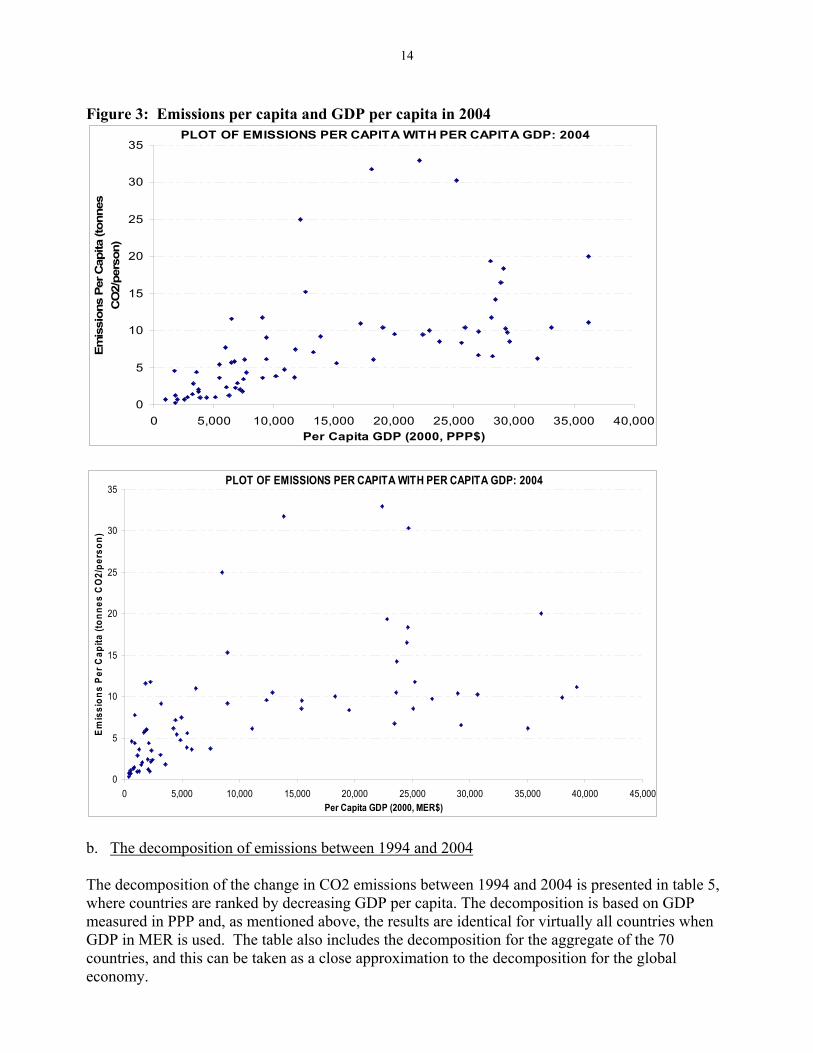
capita UAE 32.94 22135 Malaysia 6.17 9374 Bahrain 31.75 18148 Portugal 6.08 18278 Singapore 30.30 25209 Bulgaria 6.06 7577 Trinidad & T 25.02 12181 Iran 5.84 6738 United States 20.01 36234 Belarus 5.64 6425 Australia 19.36 28049 Hungary 5.57 15228 Canada 18.40 29164 Venezuela 5.43 5457 Netherlands 16.45 28918 Croatia 4.76 10890 Saudi Arabia 15.24 12661 Uzbekistan 4.60 1712 Belgium 14.20 28437 Azerbaijan 4.40 3551 Finland 11.74 28078 Romania 4.37 7688 Russia 11.71 9018 Chile 3.84 10168 Kazakhstan 11.61 6504 Argentina 3.71 11750 Norway 11.12 36234 Mexico 3.65 9061 Czech Rep. 10.99 17233 China 3.60 5441 Germany 10.43 25905 Thailand 3.43 7453 Korea, Rep. of 10.43 19108 Turkey 2.93 6951 Ireland 10.41 33102 Syria 2.85 3304 Denmark 10.26 29338 Algeria 2.38 6058 Israel 10.04 22950 Dominican Rep. 2.32 6786 Japan 9.87 27080 Tunisia 2.08 7170 UK 9.75 29406 Egypt 2.03 3747 Greece 9.56 20077 Brazil 1.83 7406 New Zealand 9.47 22423 Ecuador 1.73 3740 Oman 9.20 13881 Indonesia 1.40 3245 South Africa 9.10 9362 Angola 1.27 1772 Austria 8.54 29675 Colombia 1.23 6275 Spain 8.49 23782 India 1.02 2831 Italy 8.36 25641 Peru 0.99 5122 Ukraine 7.74 5949 Morocco 0.94 3875 Poland 7.46 11797 Philippines 0.92 4431 Slovakia 7.12 13282 Nigeria 0.73 959 France 6.73 26989 Vietnam 0.69 2520 Sweden 6.56 28226 Pakistan 0.69 1969 Switzerland 6.20 31958 Bangladesh 0.27 1756 On a per capita basis, a group of low population countries heads the ranking, but the USA also has a high value. China, and especially India and Indonesia, all with very large populations, move towards the bottom of the list. Higher income countries are found predominantly in the top half of the rankings, and lower income countries in the bottom half. The global Gini coefficient for emissions per capita, where all individuals within a country are assumed to share emissions equally, is 0.53. This is almost identical to the measure of inequality of per capita incomes for the same group of countries. Plots of emissions per capita against income per capita for both PPP and MER measures are shown in figure 3. The former shows a modest squared correlation of 34 % between the two series and the latter 30%, indicating that there is a tendency for CO2 emissions per capita to increase as GDP per capita increases,. From this cross section data there is little evidence for the downturn of an EKC at higher income levels.
14
Figure 3: Emissions per capita and GDP per capita in 2004
PLOT OF EMISSIONS PER CAPITA WITH PER CAPITA GDP: 2004
0
5
10
15
20
25
30
35
0 5,000 10,000 15,000 20,000 25,000 30,000 35,000 40,000Per Capita GDP (2000, PPP$)
Emis
sion
s Pe
r Cap
ita (t
onne
s C
O2/
pers
on)
PLOT OF EMISSIONS PER CAPITA WITH PER CAPITA GDP: 2004
0
5
10
15
20
25
30
35
0 5,000 10,000 15,000 20,000 25,000 30,000 35,000 40,000 45,000Per Capita GDP (2000, MER$)
Emis
sion
s Pe
r Cap
ita (t
onne
s C
O2/
pers
on)
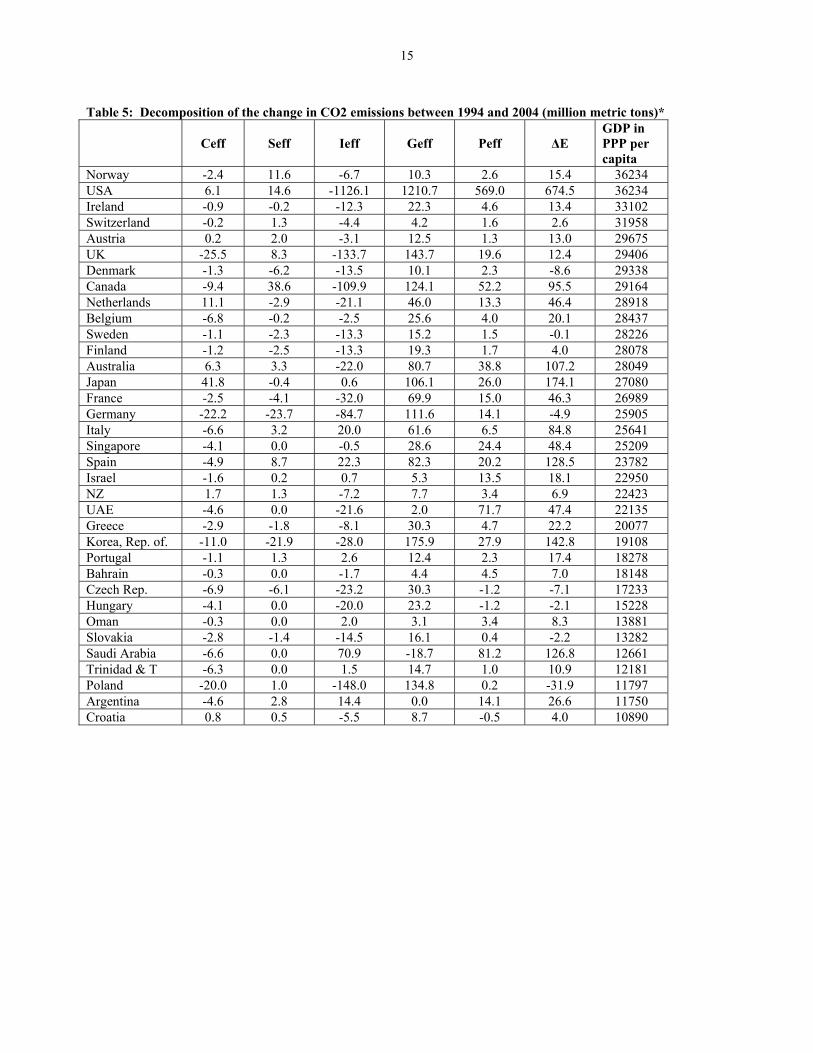
b. The decomposition of emissions between 1994 and 2004 The decomposition of the change in CO2 emissions between 1994 and 2004 is presented in table 5, where countries are ranked by decreasing GDP per capita. The decomposition is based on GDP measured in PPP and, as mentioned above, the results are identical for virtually all countries when GDP in MER is used. The table also includes the decomposition for the aggregate of the 70 countries, and this can be taken as a close approximation to the decomposition for the global economy.
15
Table 5: Decomposition of the change in CO2 emissions between 1994 and 2004 (million metric tons)*
Ceff Seff Ieff Geff Peff ∆E GDP in PPP per capita
Norway -2.4 11.6 -6.7 10.3 2.6 15.4 36234 USA 6.1 14.6 -1126.1 1210.7 569.0 674.5 36234 Ireland -0.9 -0.2 -12.3 22.3 4.6 13.4 33102 Switzerland -0.2 1.3 -4.4 4.2 1.6 2.6 31958 Austria 0.2 2.0 -3.1 12.5 1.3 13.0 29675 UK -25.5 8.3 -133.7 143.7 19.6 12.4 29406 Denmark -1.3 -6.2 -13.5 10.1 2.3 -8.6 29338 Canada -9.4 38.6 -109.9 124.1 52.2 95.5 29164 Netherlands 11.1 -2.9 -21.1 46.0 13.3 46.4 28918 Belgium -6.8 -0.2 -2.5 25.6 4.0 20.1 28437 Sweden -1.1 -2.3 -13.3 15.2 1.5 -0.1 28226 Finland -1.2 -2.5 -13.3 19.3 1.7 4.0 28078 Australia 6.3 3.3 -22.0 80.7 38.8 107.2 28049 Japan 41.8 -0.4 0.6 106.1 26.0 174.1 27080 France -2.5 -4.1 -32.0 69.9 15.0 46.3 26989 Germany -22.2 -23.7 -84.7 111.6 14.1 -4.9 25905 Italy -6.6 3.2 20.0 61.6 6.5 84.8 25641 Singapore -4.1 0.0 -0.5 28.6 24.4 48.4 25209 Spain -4.9 8.7 22.3 82.3 20.2 128.5 23782 Israel -1.6 0.2 0.7 5.3 13.5 18.1 22950 NZ 1.7 1.3 -7.2 7.7 3.4 6.9 22423 UAE -4.6 0.0 -21.6 2.0 71.7 47.4 22135 Greece -2.9 -1.8 -8.1 30.3 4.7 22.2 20077 Korea, Rep. of. -11.0 -21.9 -28.0 175.9 27.9 142.8 19108 Portugal -1.1 1.3 2.6 12.4 2.3 17.4 18278 Bahrain -0.3 0.0 -1.7 4.4 4.5 7.0 18148 Czech Rep. -6.9 -6.1 -23.2 30.3 -1.2 -7.1 17233 Hungary -4.1 0.0 -20.0 23.2 -1.2 -2.1 15228 Oman -0.3 0.0 2.0 3.1 3.4 8.3 13881 Slovakia -2.8 -1.4 -14.5 16.1 0.4 -2.2 13282 Saudi Arabia -6.6 0.0 70.9 -18.7 81.2 126.8 12661 Trinidad & T -6.3 0.0 1.5 14.7 1.0 10.9 12181 Poland -20.0 1.0 -148.0 134.8 0.2 -31.9 11797 Argentina -4.6 2.8 14.4 0.0 14.1 26.6 11750 Croatia 0.8 0.5 -5.5 8.7 -0.5 4.0 10890
16
Table 5: (continued): Decomposition of the change in CO2 emissions between 1994 and 2004 (million metric tons)*
Ceff Seff Ieff Geff Peff ∆E
GDP in PPP per capita
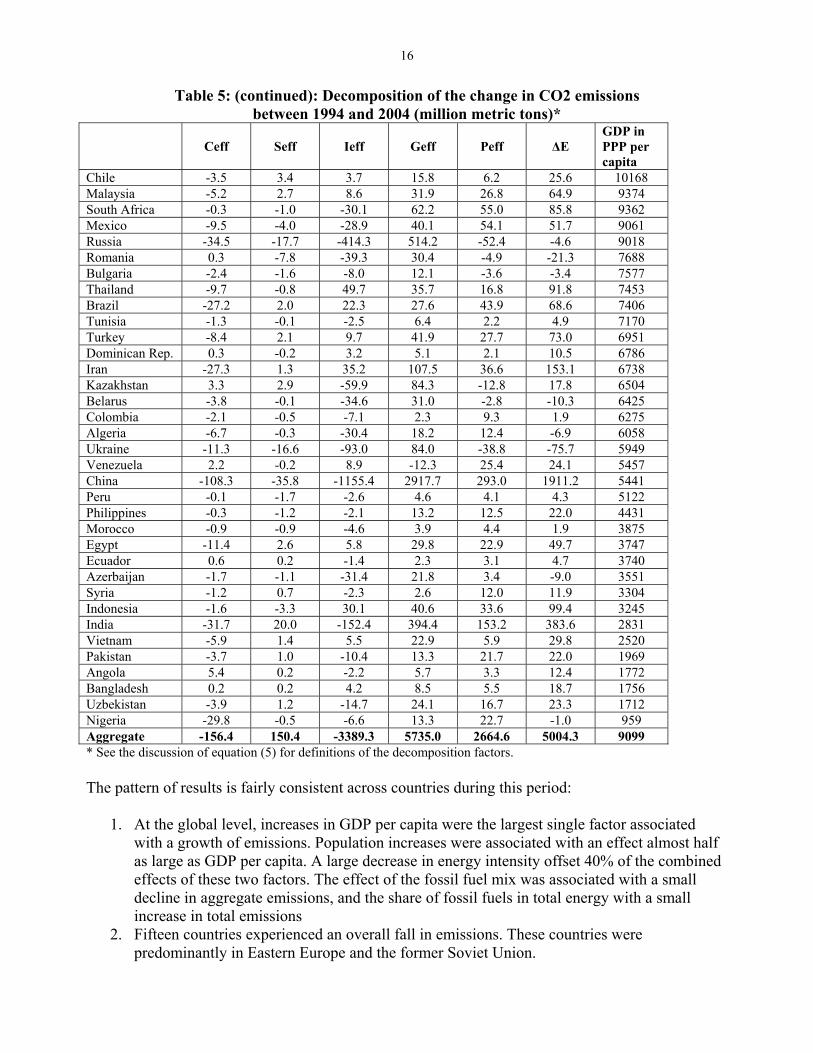
Chile -3.5 3.4 3.7 15.8 6.2 25.6 10168 Malaysia -5.2 2.7 8.6 31.9 26.8 64.9 9374 South Africa -0.3 -1.0 -30.1 62.2 55.0 85.8 9362 Mexico -9.5 -4.0 -28.9 40.1 54.1 51.7 9061 Russia -34.5 -17.7 -414.3 514.2 -52.4 -4.6 9018 Romania 0.3 -7.8 -39.3 30.4 -4.9 -21.3 7688 Bulgaria -2.4 -1.6 -8.0 12.1 -3.6 -3.4 7577 Thailand -9.7 -0.8 49.7 35.7 16.8 91.8 7453 Brazil -27.2 2.0 22.3 27.6 43.9 68.6 7406 Tunisia -1.3 -0.1 -2.5 6.4 2.2 4.9 7170 Turkey -8.4 2.1 9.7 41.9 27.7 73.0 6951 Dominican Rep. 0.3 -0.2 3.2 5.1 2.1 10.5 6786 Iran -27.3 1.3 35.2 107.5 36.6 153.1 6738 Kazakhstan 3.3 2.9 -59.9 84.3 -12.8 17.8 6504 Belarus -3.8 -0.1 -34.6 31.0 -2.8 -10.3 6425 Colombia -2.1 -0.5 -7.1 2.3 9.3 1.9 6275 Algeria -6.7 -0.3 -30.4 18.2 12.4 -6.9 6058 Ukraine -11.3 -16.6 -93.0 84.0 -38.8 -75.7 5949 Venezuela 2.2 -0.2 8.9 -12.3 25.4 24.1 5457 China -108.3 -35.8 -1155.4 2917.7 293.0 1911.2 5441 Peru -0.1 -1.7 -2.6 4.6 4.1 4.3 5122 Philippines -0.3 -1.2 -2.1 13.2 12.5 22.0 4431 Morocco -0.9 -0.9 -4.6 3.9 4.4 1.9 3875 Egypt -11.4 2.6 5.8 29.8 22.9 49.7 3747 Ecuador 0.6 0.2 -1.4 2.3 3.1 4.7 3740 Azerbaijan -1.7 -1.1 -31.4 21.8 3.4 -9.0 3551 Syria -1.2 0.7 -2.3 2.6 12.0 11.9 3304 Indonesia -1.6 -3.3 30.1 40.6 33.6 99.4 3245 India -31.7 20.0 -152.4 394.4 153.2 383.6 2831 Vietnam -5.9 1.4 5.5 22.9 5.9 29.8 2520 Pakistan -3.7 1.0 -10.4 13.3 21.7 22.0 1969 Angola 5.4 0.2 -2.2 5.7 3.3 12.4 1772 Bangladesh 0.2 0.2 4.2 8.5 5.5 18.7 1756 Uzbekistan -3.9 1.2 -14.7 24.1 16.7 23.3 1712 Nigeria -29.8 -0.5 -6.6 13.3 22.7 -1.0 959 Aggregate -156.4 150.4 -3389.3 5735.0 2664.6 5004.3 9099 * See the discussion of equation (5) for definitions of the decomposition factors. The pattern of results is fairly consistent across countries during this period:
1. At the global level, increases in GDP per capita were the largest single factor associated with a growth of emissions. Population increases were associated with an effect almost half as large as GDP per capita. A large decrease in energy intensity offset 40% of the combined effects of these two factors. The effect of the fossil fuel mix was associated with a small decline in aggregate emissions, and the share of fossil fuels in total energy with a small increase in total emissions
2. Fifteen countries experienced an overall fall in emissions. These countries were predominantly in Eastern Europe and the former Soviet Union.
17
3. Fifty six countries experienced a negative value for the coefficient effect – that is, the emissions per unit of fossil fuel used declined. This was probably due to a faster increase in the use of gas (especially) and oil than of coal. Nigeria and Brazil are examples where this effect was dominant in the total change of emissions, while Japan was one of the few countries where an increase in this factor was a major contributor to the overall growth in emissions.
4. In the majority of countries, the substitution effect (the change in the share of fossil fuels in total energy consumption), whether positive or negative, was small. Norway and Canada experienced increases in the share of fossil fuels in total energy consumed that made a large contribution to the overall increase of emissions, while Germany and Ukraine experienced declines in the share of fossil fuel that were substantial in relation to the total change in emissions.
5. Forty nine countries experienced a reduction in energy intensity, and in several cases this made a contribution that was significant in relation to the size of the total change in emissions. This group included some high income countries (notably the USA, UK, Germany and Canada); Russia, Ukraine and Eastern European countries (Hungary, Poland) benefiting from the restructuring of their economies; and China6 and India where substantial contributions from a reduction in energy intensity in relation to the size of the total change in emissions were experienced.
6. In several of the oil producing countries, energy intensity increased during the period, adding to the effects of growth in income and population.
7. To understand the decomposition for an individual country, it would be necessary to undertake a more detailed analysis of policy and structural changes during the period. However, the broad patterns established give a guide to relative importance of the five factors utilized in the decomposition.
One useful way to summarize the decomposition analysis is to compare the impacts due to income and population growth, which are virtually always positive7, and are outside direct interventions that might be expected to moderate emissions, and the three other factors which had the potential through policy interventions to reduce emissions. To this end a coefficient of “offsetting” is defined: Coefficient of offsetting = - [ sum of changes due to emissions per unit of fossil fuel, fossil fuel
consumption relative to total energy consumption, and energy intensity of GDP] / [changes due to GDP per capita and population] (7)
A score of 100 % indicates that the total increase in emissions attributed to GDP per capita growth and population growth was exactly offset by improvements in the three other factors. A negative score indicates that emissions increased faster than would have been accounted for by the growth of GDP and population. For the aggregate of 70 countries, 40% of the potential growth in emissions due to GDP and population growth was offset by the three factors. For individual countries, the offsetting coefficients, ranked by size of coefficient, are shown in table 6.
6 The very large fluctuation in China’s energy intensity, which declined until 2002 but then started to increase, has been the stimulus for a detailed analysis of changes in the country’s economic structure. See: Ma and Stern (2006), Liao, Fan and Wei (2007) and Hoffman and Labar (2007). 7 The exceptions are Saudi Arabia where per capita income fell during the period, and Russia and other countries in the former Soviet Union and Eastern Europe where changed political boundaries led to falls in population.
18
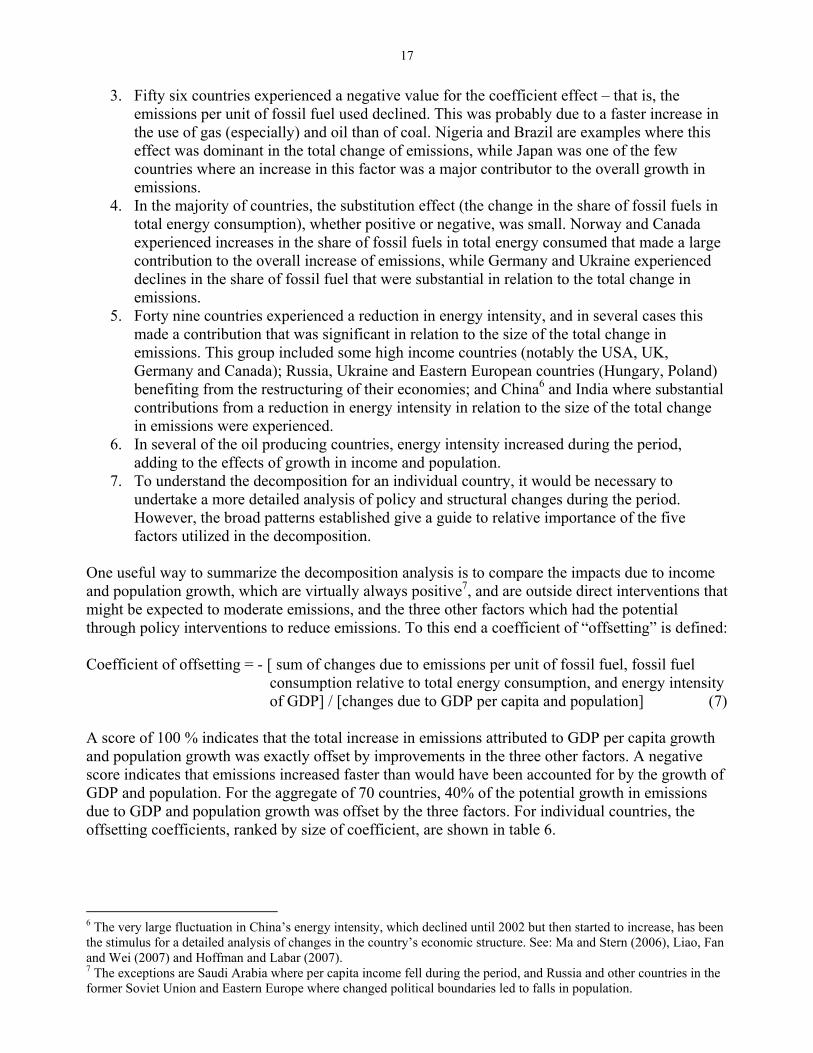
Table 6: Coefficients of Offsetting for Decomposition of Emissions 1994 – 2004 Country Offsetting Country Offsetting Ukraine 267.4 Belgium 32.0 Romania 183.6 Trinidad and Tobago 30.4 Denmark 169.1 India 30.0 Bulgaria 140.3 Korea, Rep. of 29.9 Belarus 136.4 South Africa 26.8 Azerbaijan 135.5 Netherlands 21.7 Czech Republic 124.4 Bahrain 21.5 Poland 123.7 Syria 19.0 Algeria 122.6 Philippines 14.2 Slovakia 113.5 Ecuador 12.4 Hungary 109.5 Australia 10.3 Germany 103.9 Singapore 8.8 Nigeria 102.7 Austria 6.0 Russia 101.0 Egypt 5.7 Sweden 100.4 Brazil 4.0 United Kingdom 92.4 Israel 3.5 Colombia 83.6 Vietnam -3.3 Finland 80.7 Turkey -4.9 Morocco 77.3 Iran -6.3 Kazakhstan 75.0 Malaysia -10.5 United States 62.1 Chile -16.2 Switzerland 56.7 Portugal -18.6 Croatia 51.5 Norway -19.5 Peru 50.6 Italy -24.4 Ireland 50.2 Spain -25.4 Canada 45.8 Oman -26.9 France 45.5 Japan -31.9 Mexico 45.1 Bangladesh -33.2 Tunisia 43.8 Indonesia -33.9 Uzbekistan 42.8 Angola -38.6 China 40.5 Dominican Republic -45.6 New Zealand 37.9 Thailand -74.6 Pakistan 37.1 Venezuela -83.8 Greece 36.5 Argentina -89.8 United Arab Emirates 35.7 Saudi Arabia -102.8 The table of offsetting coefficients highlights a number of features:
1. The range of offsetting experienced during the period was wide, with fifteen countries more than fully offsetting the potential increase in emissions due to income and population growth. A group of nineteen countries experienced “negative offsetting” in that movements in the three factors (emissions per unit of fossil fuel, fossil fuel consumption relative to total energy consumption, and energy intensity of GDP) added to the increase in emissions due to income and population growth.
2. This group of countries with full offsetting included several Eastern European and former Soviet Union countries, where massive changes in sector structure may have been responsible for shifting the economies to lower energy intensity. However, it also included Denmark and Sweden, where market forces alone would have been unlikely to bring about large scale sectoral adjustment and improvements in energy efficiency. The detailed routes by which Denmark and Sweden achieved this performance may be instructive for other high income countries considering how to reduce the total level of their CO2 emissions.
19
The group also included Algeria and Nigeria, both of which are major hydrocarbon producers. Algeria experienced a major decline in energy intensity, while Nigeria experienced a large fall in emissions per unit of fossil fuel consumed.
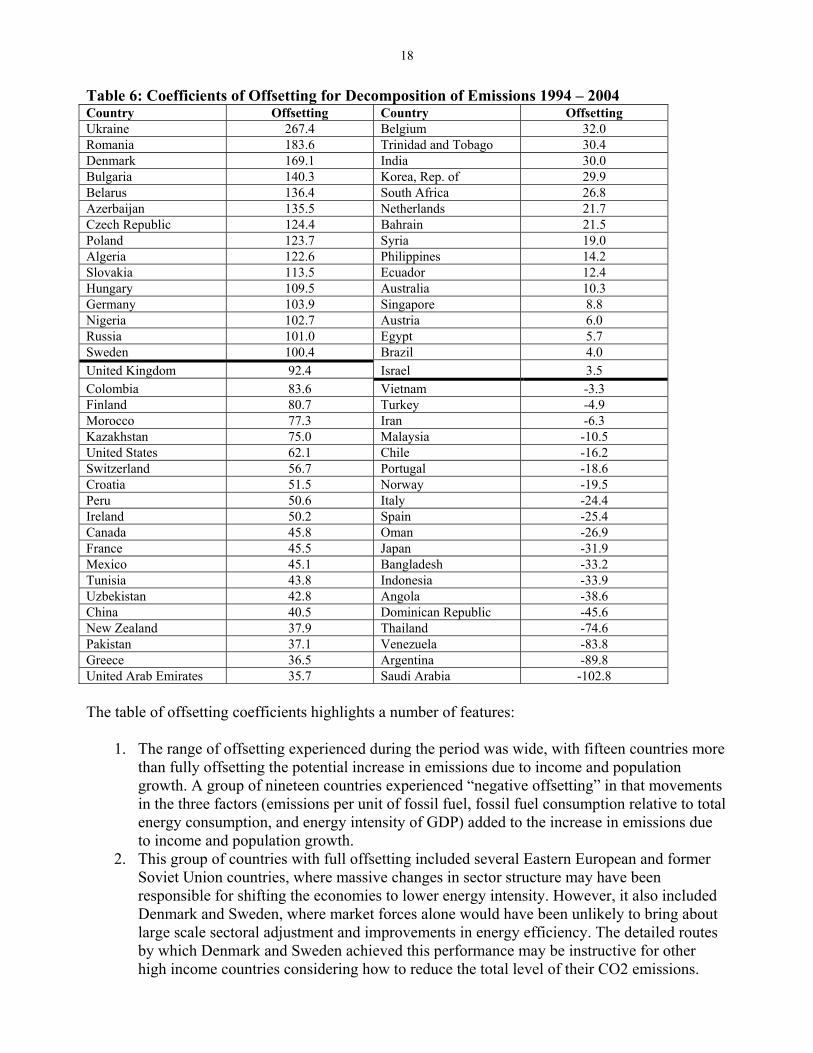
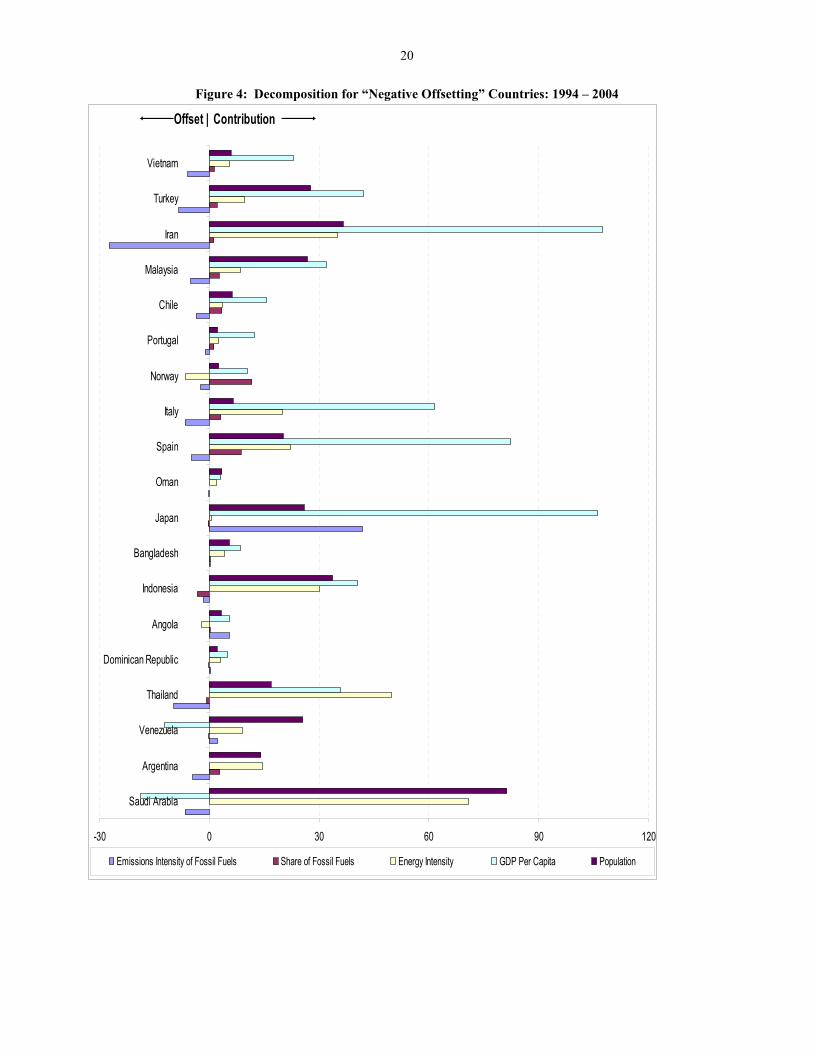
3. The group of countries with negative offsetting are mixed in type, including high income developed countries such as Japan, Italy and Spain, several oil producers (including Saudi Arabia, Indonesia, Venezuela) that may have adopted a very energy intensive growth strategy, and some low income countries (Dominican Republic, Bangladesh). There does not appear to be a common link between these countries, except for the group of oil producers, and country level studies would be needed to understand the causes of their performance. The components of the decomposition for the group of countries with negative offsetting are shown in figure 4 below.
4. Among countries with the largest absolute emissions, the USA was able to offset a sizeable fraction of its growth in emissions but, given the size of the economy, the increment was still large. By contrast, Japan, with relatively low income and population growth, experienced negative offsetting, but the total increment was relatively small. Russia fully offset the growth in emissions related to income and population during this period but, given that population decline and massive changes in sectoral structure and energy efficiency were stimulated by the political changes during this period, a similar performance may be difficult to maintain in the coming decade. China and India, while enjoying rapid growth during the decade, were also able to offset significant portions of the potential growth in emissions.
5. Looking across the list of countries as a whole, it is noticeable that the coefficient of offsetting is not correlated with income levels. Although high income countries may have been best able to carry out policies that would have reduced emissions growth, it does not appear that during the decade studied, there was a systematic worldwide link between the degree of offsetting and the level of per capita income.
20
Figure 4: Decomposition for “Negative Offsetting” Countries: 1994 – 2004
-30 0 30 60 90 120
Saudi Arabia
Argentina
Venezuela
Thailand
Dominican Republic
Angola
Indonesia
Bangladesh
Japan
Oman
Spain
Italy
Norway
Portugal
Chile
Malaysia
Iran
Turkey
Vietnam
Emissions Intensity of Fossil Fuels Share of Fossil Fuels Energy Intensity GDP Per Capita Population
Offset | Contribution
21
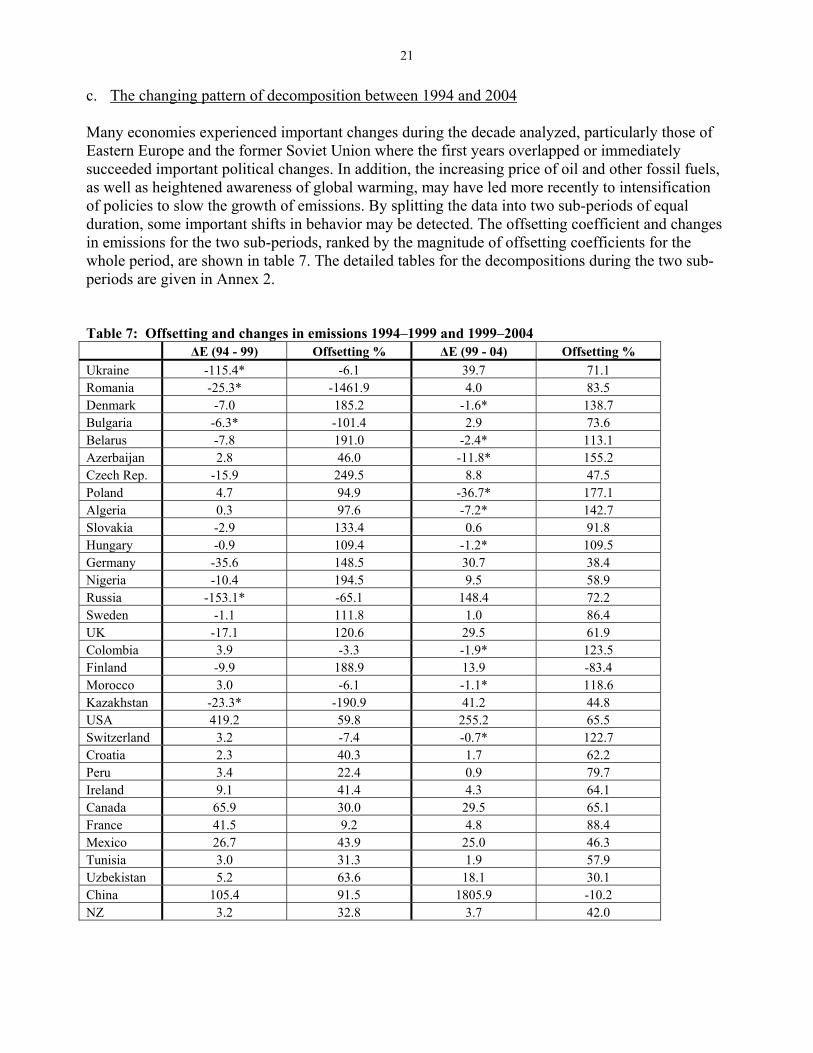
c. The changing pattern of decomposition between 1994 and 2004 Many economies experienced important changes during the decade analyzed, particularly those of Eastern Europe and the former Soviet Union where the first years overlapped or immediately succeeded important political changes. In addition, the increasing price of oil and other fossil fuels, as well as heightened awareness of global warming, may have led more recently to intensification of policies to slow the growth of emissions. By splitting the data into two sub-periods of equal duration, some important shifts in behavior may be detected. The offsetting coefficient and changes in emissions for the two sub-periods, ranked by the magnitude of offsetting coefficients for the whole period, are shown in table 7. The detailed tables for the decompositions during the two sub-periods are given in Annex 2.
Table 7: Offsetting and changes in emissions 1994–1999 and 1999–2004 ∆E (94 - 99) Offsetting % ∆E (99 - 04) Offsetting % Ukraine -115.4* -6.1 39.7 71.1 Romania -25.3* -1461.9 4.0 83.5 Denmark -7.0 185.2 -1.6* 138.7 Bulgaria -6.3* -101.4 2.9 73.6 Belarus -7.8 191.0 -2.4* 113.1 Azerbaijan 2.8 46.0 -11.8* 155.2 Czech Rep. -15.9 249.5 8.8 47.5 Poland 4.7 94.9 -36.7* 177.1 Algeria 0.3 97.6 -7.2* 142.7 Slovakia -2.9 133.4 0.6 91.8 Hungary -0.9 109.4 -1.2* 109.5 Germany -35.6 148.5 30.7 38.4 Nigeria -10.4 194.5 9.5 58.9 Russia -153.1* -65.1 148.4 72.2 Sweden -1.1 111.8 1.0 86.4 UK -17.1 120.6 29.5 61.9 Colombia 3.9 -3.3 -1.9* 123.5 Finland -9.9 188.9 13.9 -83.4 Morocco 3.0 -6.1 -1.1* 118.6 Kazakhstan -23.3* -190.9 41.2 44.8 USA 419.2 59.8 255.2 65.5 Switzerland 3.2 -7.4 -0.7* 122.7 Croatia 2.3 40.3 1.7 62.2 Peru 3.4 22.4 0.9 79.7 Ireland 9.1 41.4 4.3 64.1 Canada 65.9 30.0 29.5 65.1 France 41.5 9.2 4.8 88.4 Mexico 26.7 43.9 25.0 46.3 Tunisia 3.0 31.3 1.9 57.9 Uzbekistan 5.2 63.6 18.1 30.1 China 105.4 91.5 1805.9 -10.2 NZ 3.2 32.8 3.7 42.0
22
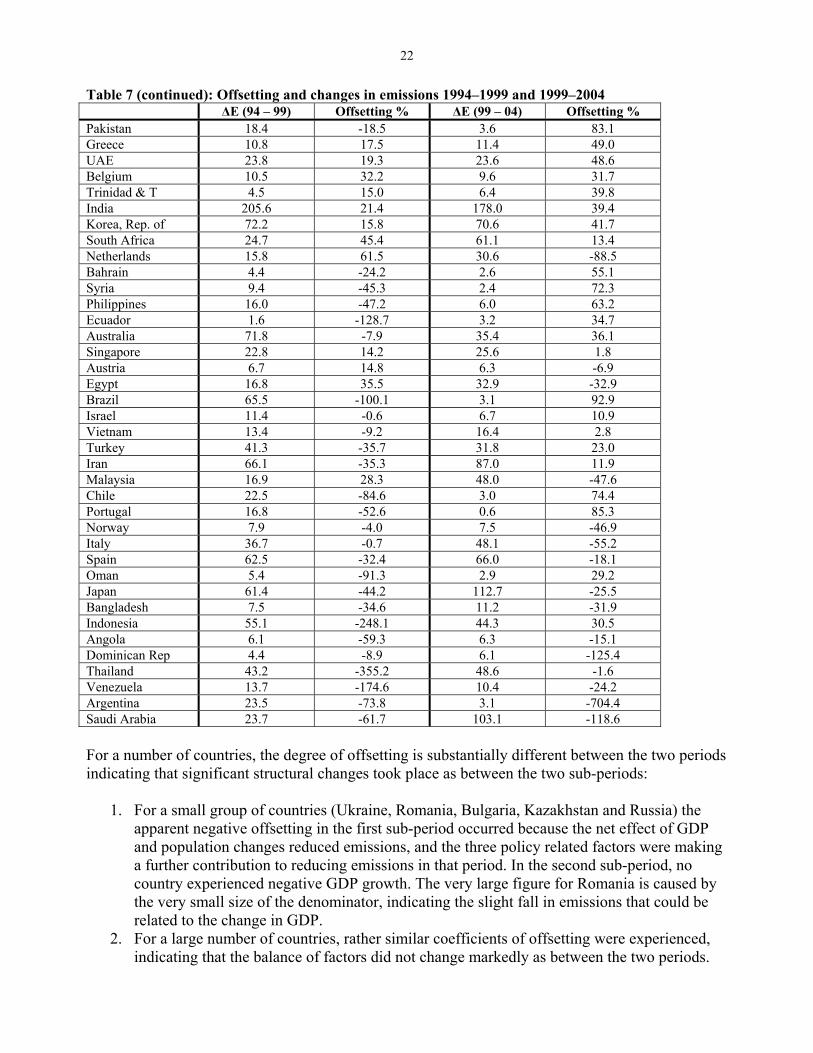
Table 7 (continued): Offsetting and changes in emissions 1994–1999 and 1999–2004 ∆E (94 – 99) Offsetting % ∆E (99 – 04) Offsetting % Pakistan 18.4 -18.5 3.6 83.1 Greece 10.8 17.5 11.4 49.0 UAE 23.8 19.3 23.6 48.6 Belgium 10.5 32.2 9.6 31.7 Trinidad & T 4.5 15.0 6.4 39.8 India 205.6 21.4 178.0 39.4 Korea, Rep. of 72.2 15.8 70.6 41.7 South Africa 24.7 45.4 61.1 13.4 Netherlands 15.8 61.5 30.6 -88.5 Bahrain 4.4 -24.2 2.6 55.1 Syria 9.4 -45.3 2.4 72.3 Philippines 16.0 -47.2 6.0 63.2 Ecuador 1.6 -128.7 3.2 34.7 Australia 71.8 -7.9 35.4 36.1 Singapore 22.8 14.2 25.6 1.8 Austria 6.7 14.8 6.3 -6.9 Egypt 16.8 35.5 32.9 -32.9 Brazil 65.5 -100.1 3.1 92.9 Israel 11.4 -0.6 6.7 10.9 Vietnam 13.4 -9.2 16.4 2.8 Turkey 41.3 -35.7 31.8 23.0 Iran 66.1 -35.3 87.0 11.9 Malaysia 16.9 28.3 48.0 -47.6 Chile 22.5 -84.6 3.0 74.4 Portugal 16.8 -52.6 0.6 85.3 Norway 7.9 -4.0 7.5 -46.9 Italy 36.7 -0.7 48.1 -55.2 Spain 62.5 -32.4 66.0 -18.1 Oman 5.4 -91.3 2.9 29.2 Japan 61.4 -44.2 112.7 -25.5 Bangladesh 7.5 -34.6 11.2 -31.9 Indonesia 55.1 -248.1 44.3 30.5 Angola 6.1 -59.3 6.3 -15.1 Dominican Rep 4.4 -8.9 6.1 -125.4 Thailand 43.2 -355.2 48.6 -1.6 Venezuela 13.7 -174.6 10.4 -24.2 Argentina 23.5 -73.8 3.1 -704.4 Saudi Arabia 23.7 -61.7 103.1 -118.6 For a number of countries, the degree of offsetting is substantially different between the two periods indicating that significant structural changes took place as between the two sub-periods:
1. For a small group of countries (Ukraine, Romania, Bulgaria, Kazakhstan and Russia) the apparent negative offsetting in the first sub-period occurred because the net effect of GDP and population changes reduced emissions, and the three policy related factors were making a further contribution to reducing emissions in that period. In the second sub-period, no country experienced negative GDP growth. The very large figure for Romania is caused by the very small size of the denominator, indicating the slight fall in emissions that could be related to the change in GDP.
2. For a large number of countries, rather similar coefficients of offsetting were experienced, indicating that the balance of factors did not change markedly as between the two periods.
23
3. For a third group of countries, the coefficient of offsetting increased substantially, indicating a move towards slowing down the growth or even reducing the level of emissions relative to the growth of GDP and population. This group of countries includes a number of lower income countries that experienced negative offsetting during the first sub-period, but moved to partial positive offsetting in the second period. This latter group included Pakistan, Syria, the Philippines, Ecuador, Australia, Brazil, Turkey, Iran and Indonesia.
4. There is a group of thirteen countries that experienced negative offsetting in both sub-periods. As well as some large oil producers (Norway, Venezuela, Angola and Saudi Arabia) the group included some high income non-oil producers (Japan, Italy and Spain).
5. Six countries moved from partial positive offsetting in the first sub-period to negative offsetting in the second sub-period, indicating that the policy related factors had ameliorated the effects of growth earlier, but added to it in the latter period. This group included Colombia, China, the Netherlands, Austria, Egypt and Malaysia.
6. The experience of countries with the largest absolute emissions during the two sub-periods was quite different. The USA experienced growth in emissions during both periods, but in both offset a substantial fraction of the effects of the growth in income. China experienced little growth in emissions in the first sub-period, partly thanks to high offsetting, but in the second sub-period experienced a very large growth in emissions, when the effects of very rapid growth were slightly compounded by negative offsetting. Japan experienced modest increases in emissions during both periods, partly related to negative offsetting in both. Russia experienced a substantial fall in emissions during the first period, but then experienced a sizeable growth in emissions during the second period, despite a high degree of offsetting. Finally, India experienced similar growth of emissions during the two sub-periods, with the slightly lower increase in the second period being associated with higher offsetting.
Conclusions
1. The report focuses on the 70 top ranking countries in terms of their CO2 emissions from fossil fuels in 2004, covering 95 percent of the global total CO2 emissions. The list of the top 20 contributors to global CO2 emissions from fossil fuels was mainly drawn from higher income developed countries, but it also included all the G+5 countries. In addition, several large oil producing countries were in the top thirty. During the period 1994-2004, some fifteen countries experienced a fall in emissions, and this group comprised mainly former Soviet Union and Eastern European countries that had undergone major structural change during the period. The percentage growth in emissions during the decade showed considerable variation among countries, with some large emitters experiencing significant growth, and others relatively low growth. The degree of inequality between countries with respect to total CO2 emissions is extremely high, with a Gini coefficient of 0.72.
2. The inter-country distribution of emissions per unit of GDP per capita (emissions intensity) was measured using GDP at purchasing power parity and at market exchange rates. The emissions intensity was for most countries very much lower on the former measure. The ranking of countries by emissions intensity also changed substantially relative to the ranking by total emissions. Emissions intensity was not systematically related to GDP per capita, nor to the share of manufacturing in GDP, but did show a positive correlation with the ratio of the volume of oil production to GDP, probably reflecting strategies to benefit from the revenues from oil, and attempts to use it extensively for domestic sectors.
24
3. The ranking of countries by emissions intensity changed substantially relative to the ranking by total CO2 emissions. The G+5 countries, with the exception of South Africa, ranked very much lower on emissions intensity than on total emissions among the group of 70 countries studied. Several middle-income countries were amongst those with the highest rankings.
4. Emissions per capita were positively but only moderately correlated with GDP per capita and showed no evidence of an eventual decline in emissions per capita at higher per capita income (the Environmental Kuznets Curve phenomenon). The global per capita measure of inequality of emissions was much lower than that for the country level inequality, and was very similar to the measure of income inequality. Some countries with large populations, such as India and Indonesia, moved almost to the bottom of the ranking based on this measure.
5. The decomposition analysis related to the change in emissions during the decade to changes in five factors (emissions per unit of fossil fuel, fossil fuel consumption relative to total energy consumption, and energy intensity of GDP, GDP per capita, and population). For the group of countries as a whole, GDP per capita was the dominant variable linked to the growth in total emissions, with population being only one half as important. However, the decrease in energy intensity was so large that it offset about forty percent of the combined influence of these two factors. The fossil fuel mix showed a small negative effect on the change in emissions, while the share of fossil fuels in total energy consumption contributed a small increase to the change in emissions.
6. The relative importance of the three factors that could be directly linked to policies to slow down the growth of emissions (fossil fuel mix, share of fossil fuels in total energy and energy intensity of GDP) to the positive effects of GDP growth is measured by the “offsetting” coefficient. For the decade as a whole fifteen countries more than offset the combined impacts of GDP and population growth. This group consisted mainly of former Soviet Union and Eastern European countries, but also included two Scandinavian countries, whose policies towards emissions may give important clues for other countries wishing to slow the growth of emissions. There were also a group of nineteen countries where the potential offsetting factors had actually led to a further increase in emissions beyond that which would have been expected from the growth of GDP (“negative offsetting”). The group included several oil producers, but also some non-oil producing high income developed countries. Two developing countries with the largest populations and CO2 emissions, China and India, had offsetting coefficients near to the global average for the period.
7. When the data was split into two five year sub-periods it become apparent that for some countries large changes had taken place in the course of the decade. For one group of countries the coefficient of offsetting increased substantially – this group included several developing countries. An important group of thirteen countries experienced negative offsetting in both sub-periods, indicating that this was a longer term trend – the group included some major oil producers, and some high income non-oil producing countries. Six countries moved from positive to negative offsetting between the two sub-periods, indicating that they had actually seen emissions rise faster relative to GDP. The experiences of countries with the largest absolute emissions across the two sub-periods were quite different. The USA and India both experienced substantial offsetting throughout the period, while China and Russia both experienced high offsetting in the first period, but much reduced offsetting in the second. For the group as a whole there was no apparent correlation between the improvement in offsetting and the level of GDP, indicating that during the period studied higher income countries had not performed better in slowing the growth of emissions relative to GDP.
25
8. However, several countries did experience improved performance of emissions relative to GDP, suggesting that there need not be a negative trade-off between slowing the growth of emissions and maintaining high growth rates of the economy. Countries that were particularly successful in achieving high offsetting could well serve as case studies for how this might be achieved. On the other hand, the experience of several countries also makes it clear that, without active policies to curb the emissions intensity of the economy, emissions can actually increase faster than GDP, even when GDP has reached a high level. Further and more detailed analysis could shed further light on the factors determining aggregate energy intensity for an economy, since this factor appears to have accounted for the largest differences in performance between economies, once the growth of GDP is allowed for. In particular, the distinction between changes due to sectoral composition and energy efficiency may be helpful in giving clues as to the future course of emissions, and the possibilities of finding policies that could make a substantial difference to global CO2 emissions.
9. The magnitude of the decline in energy intensity in many countries suggests that further work to understand why this has happened would be important. In particular, a further decomposition into changes in sector structure ( the shares of agriculture, manufacturing and services) and changes in energy intensity at sector levels would provide information on the extent to which changes in the sector mix, that are related to economic growth and development, have been responsible for changes in overall emissions.
26
Annex 1
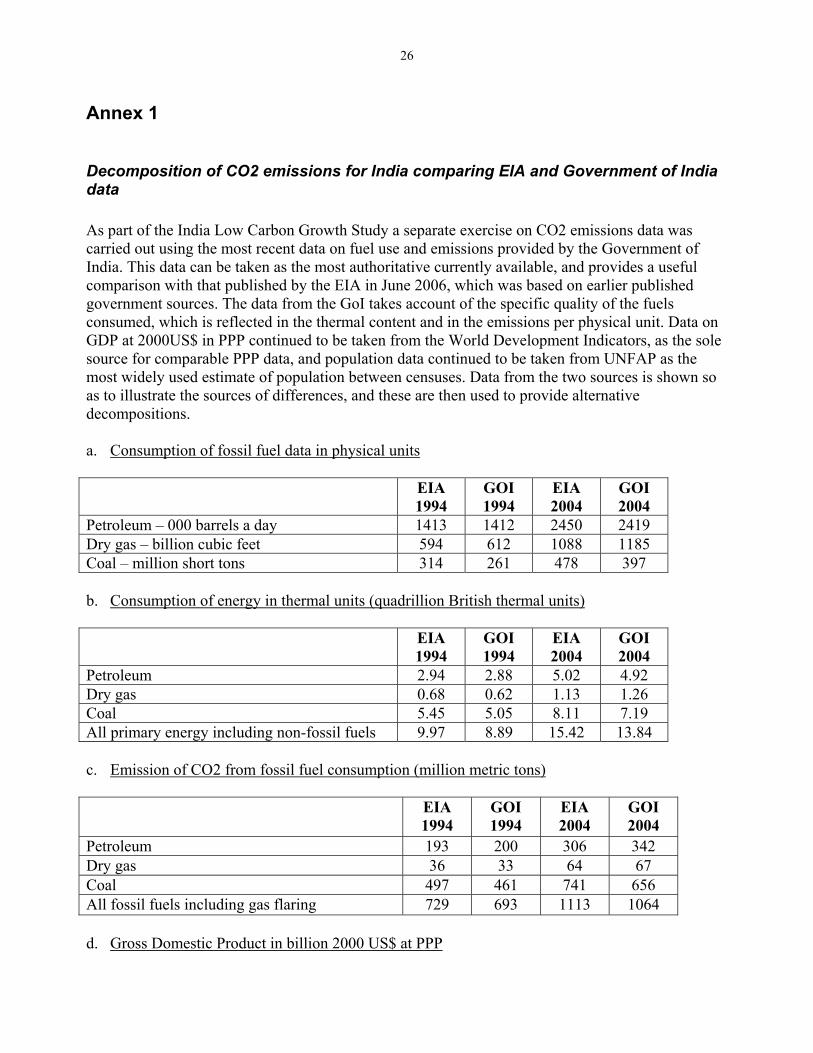
Decomposition of CO2 emissions for India comparing EIA and Government of India data As part of the India Low Carbon Growth Study a separate exercise on CO2 emissions data was carried out using the most recent data on fuel use and emissions provided by the Government of India. This data can be taken as the most authoritative currently available, and provides a useful comparison with that published by the EIA in June 2006, which was based on earlier published government sources. The data from the GoI takes account of the specific quality of the fuels consumed, which is reflected in the thermal content and in the emissions per physical unit. Data on GDP at 2000US$ in PPP continued to be taken from the World Development Indicators, as the sole source for comparable PPP data, and population data continued to be taken from UNFAP as the most widely used estimate of population between censuses. Data from the two sources is shown so as to illustrate the sources of differences, and these are then used to provide alternative decompositions. a. Consumption of fossil fuel data in physical units EIA
1994 GOI 1994
EIA 2004
GOI 2004
Petroleum – 000 barrels a day 1413 1412 2450 2419 Dry gas – billion cubic feet 594 612 1088 1185 Coal – million short tons 314 261 478 397 b. Consumption of energy in thermal units (quadrillion British thermal units) EIA
1994 GOI 1994
EIA 2004
GOI 2004
Petroleum 2.94 2.88 5.02 4.92 Dry gas 0.68 0.62 1.13 1.26 Coal 5.45 5.05 8.11 7.19 All primary energy including non-fossil fuels 9.97 8.89 15.42 13.84 c. Emission of CO2 from fossil fuel consumption (million metric tons) EIA
1994 GOI 1994
EIA 2004
GOI 2004
Petroleum 193 200 306 342 Dry gas 36 33 64 67 Coal 497 461 741 656 All fossil fuels including gas flaring 729 693 1113 1064 d. Gross Domestic Product in billion 2000 US$ at PPP
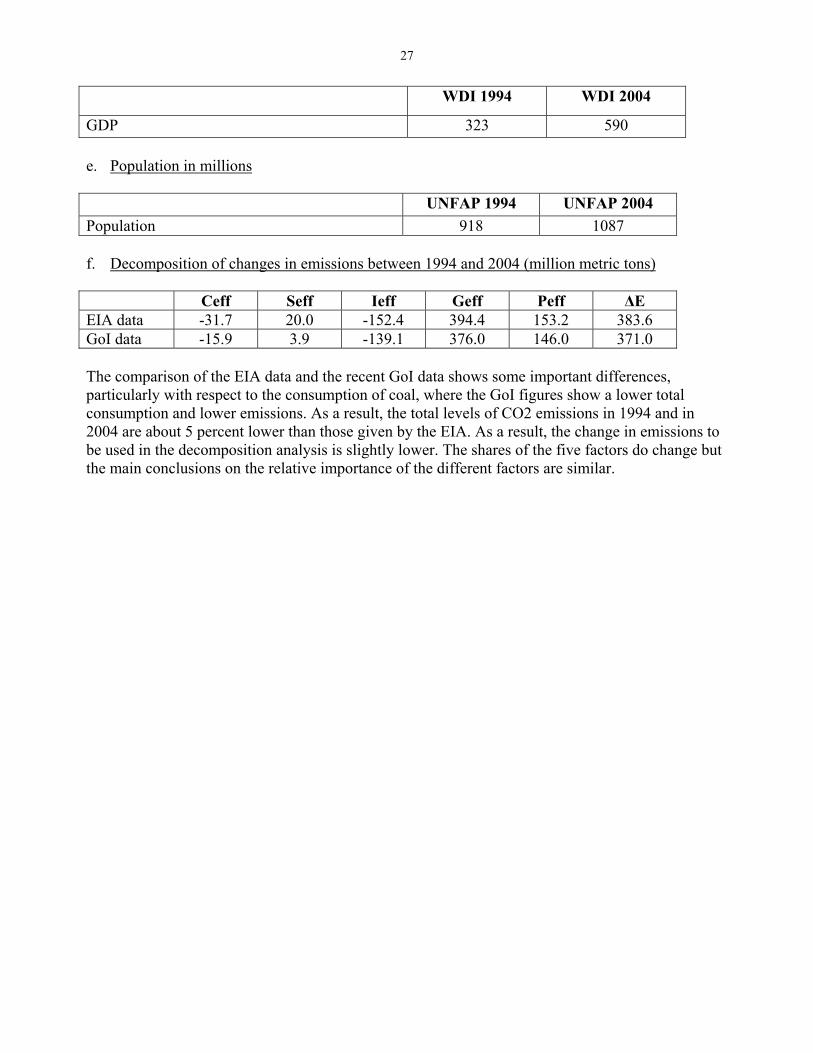
27
WDI 1994 WDI 2004
GDP 323 590 e. Population in millions UNFAP 1994 UNFAP 2004 Population 918 1087 f. Decomposition of changes in emissions between 1994 and 2004 (million metric tons) Ceff Seff Ieff Geff Peff ∆E EIA data -31.7 20.0 -152.4 394.4 153.2 383.6 GoI data -15.9 3.9 -139.1 376.0 146.0 371.0 The comparison of the EIA data and the recent GoI data shows some important differences, particularly with respect to the consumption of coal, where the GoI figures show a lower total consumption and lower emissions. As a result, the total levels of CO2 emissions in 1994 and in 2004 are about 5 percent lower than those given by the EIA. As a result, the change in emissions to be used in the decomposition analysis is slightly lower. The shares of the five factors do change but the main conclusions on the relative importance of the different factors are similar.
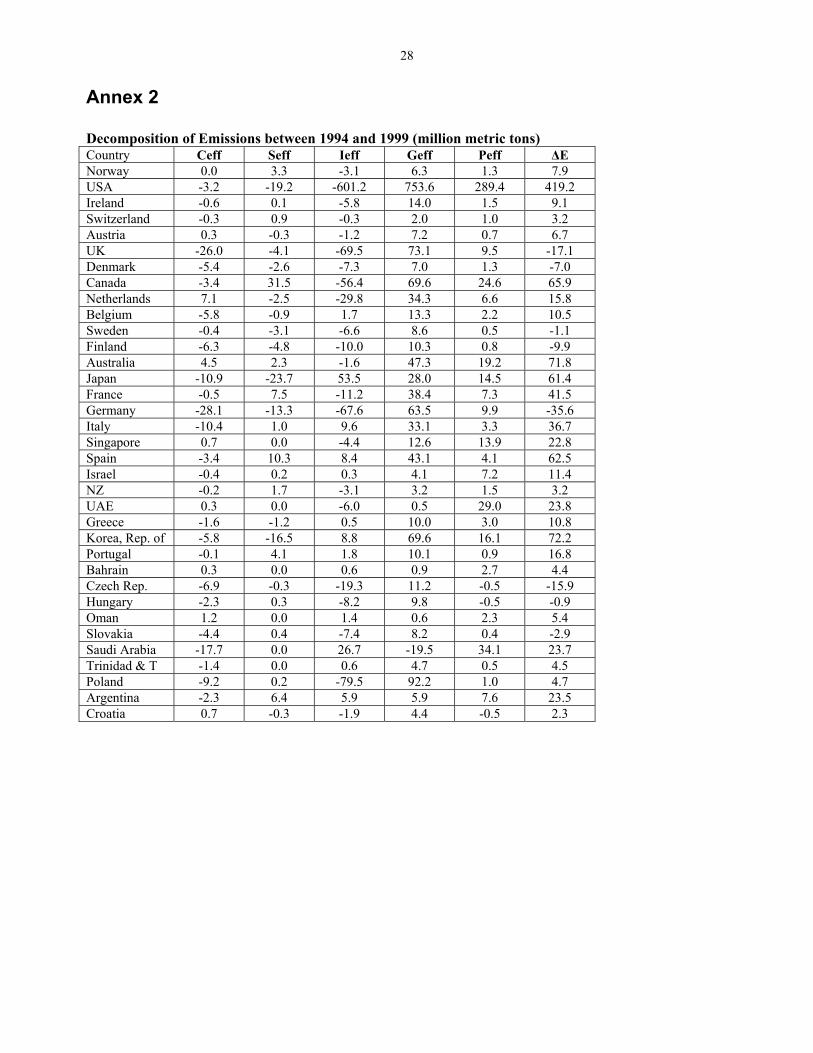
28
Annex 2 Decomposition of Emissions between 1994 and 1999 (million metric tons) Country Ceff Seff Ieff Geff Peff ∆E Norway 0.0 3.3 -3.1 6.3 1.3 7.9 USA -3.2 -19.2 -601.2 753.6 289.4 419.2 Ireland -0.6 0.1 -5.8 14.0 1.5 9.1 Switzerland -0.3 0.9 -0.3 2.0 1.0 3.2 Austria 0.3 -0.3 -1.2 7.2 0.7 6.7 UK -26.0 -4.1 -69.5 73.1 9.5 -17.1 Denmark -5.4 -2.6 -7.3 7.0 1.3 -7.0 Canada -3.4 31.5 -56.4 69.6 24.6 65.9 Netherlands 7.1 -2.5 -29.8 34.3 6.6 15.8 Belgium -5.8 -0.9 1.7 13.3 2.2 10.5 Sweden -0.4 -3.1 -6.6 8.6 0.5 -1.1 Finland -6.3 -4.8 -10.0 10.3 0.8 -9.9 Australia 4.5 2.3 -1.6 47.3 19.2 71.8 Japan -10.9 -23.7 53.5 28.0 14.5 61.4 France -0.5 7.5 -11.2 38.4 7.3 41.5 Germany -28.1 -13.3 -67.6 63.5 9.9 -35.6 Italy -10.4 1.0 9.6 33.1 3.3 36.7 Singapore 0.7 0.0 -4.4 12.6 13.9 22.8 Spain -3.4 10.3 8.4 43.1 4.1 62.5 Israel -0.4 0.2 0.3 4.1 7.2 11.4 NZ -0.2 1.7 -3.1 3.2 1.5 3.2 UAE 0.3 0.0 -6.0 0.5 29.0 23.8 Greece -1.6 -1.2 0.5 10.0 3.0 10.8 Korea, Rep. of -5.8 -16.5 8.8 69.6 16.1 72.2 Portugal -0.1 4.1 1.8 10.1 0.9 16.8 Bahrain 0.3 0.0 0.6 0.9 2.7 4.4 Czech Rep. -6.9 -0.3 -19.3 11.2 -0.5 -15.9 Hungary -2.3 0.3 -8.2 9.8 -0.5 -0.9 Oman 1.2 0.0 1.4 0.6 2.3 5.4 Slovakia -4.4 0.4 -7.4 8.2 0.4 -2.9 Saudi Arabia -17.7 0.0 26.7 -19.5 34.1 23.7 Trinidad & T -1.4 0.0 0.6 4.7 0.5 4.5 Poland -9.2 0.2 -79.5 92.2 1.0 4.7 Argentina -2.3 6.4 5.9 5.9 7.6 23.5 Croatia 0.7 -0.3 -1.9 4.4 -0.5 2.3
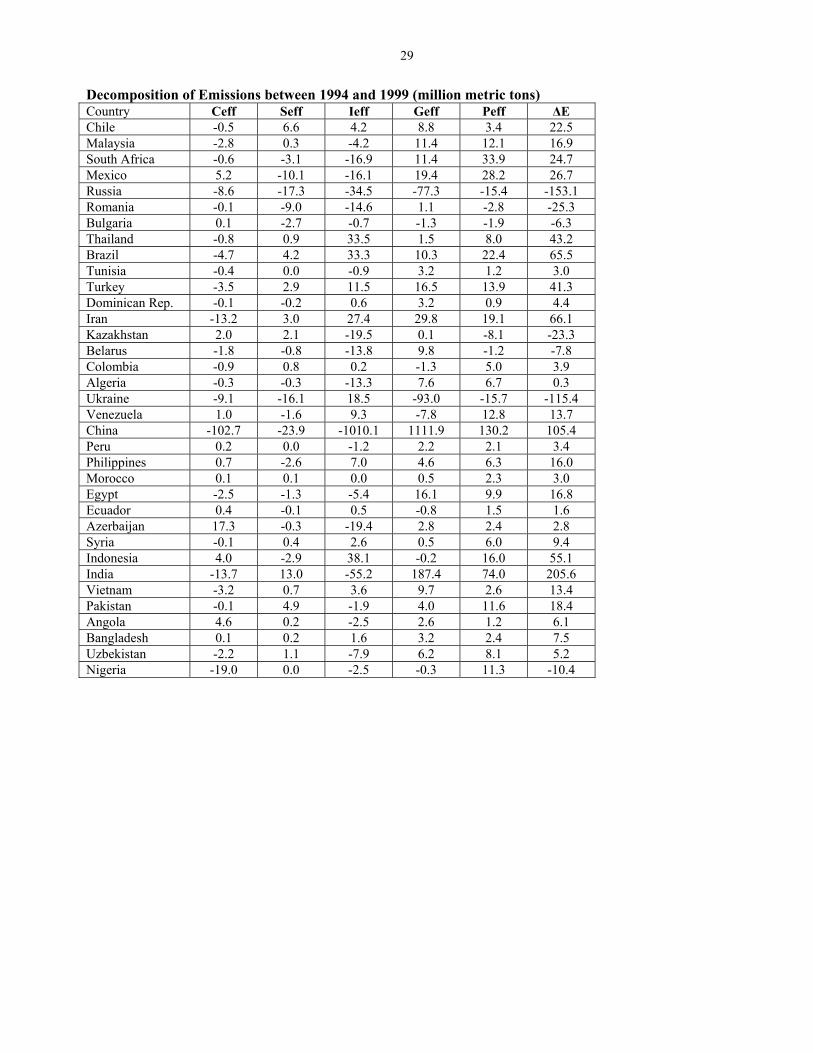
29
Decomposition of Emissions between 1994 and 1999 (million metric tons) Country Ceff Seff Ieff Geff Peff ∆E Chile -0.5 6.6 4.2 8.8 3.4 22.5 Malaysia -2.8 0.3 -4.2 11.4 12.1 16.9 South Africa -0.6 -3.1 -16.9 11.4 33.9 24.7 Mexico 5.2 -10.1 -16.1 19.4 28.2 26.7 Russia -8.6 -17.3 -34.5 -77.3 -15.4 -153.1 Romania -0.1 -9.0 -14.6 1.1 -2.8 -25.3 Bulgaria 0.1 -2.7 -0.7 -1.3 -1.9 -6.3 Thailand -0.8 0.9 33.5 1.5 8.0 43.2 Brazil -4.7 4.2 33.3 10.3 22.4 65.5 Tunisia -0.4 0.0 -0.9 3.2 1.2 3.0 Turkey -3.5 2.9 11.5 16.5 13.9 41.3 Dominican Rep. -0.1 -0.2 0.6 3.2 0.9 4.4 Iran -13.2 3.0 27.4 29.8 19.1 66.1 Kazakhstan 2.0 2.1 -19.5 0.1 -8.1 -23.3 Belarus -1.8 -0.8 -13.8 9.8 -1.2 -7.8 Colombia -0.9 0.8 0.2 -1.3 5.0 3.9 Algeria -0.3 -0.3 -13.3 7.6 6.7 0.3 Ukraine -9.1 -16.1 18.5 -93.0 -15.7 -115.4 Venezuela 1.0 -1.6 9.3 -7.8 12.8 13.7 China -102.7 -23.9 -1010.1 1111.9 130.2 105.4 Peru 0.2 0.0 -1.2 2.2 2.1 3.4 Philippines 0.7 -2.6 7.0 4.6 6.3 16.0 Morocco 0.1 0.1 0.0 0.5 2.3 3.0 Egypt -2.5 -1.3 -5.4 16.1 9.9 16.8 Ecuador 0.4 -0.1 0.5 -0.8 1.5 1.6 Azerbaijan 17.3 -0.3 -19.4 2.8 2.4 2.8 Syria -0.1 0.4 2.6 0.5 6.0 9.4 Indonesia 4.0 -2.9 38.1 -0.2 16.0 55.1 India -13.7 13.0 -55.2 187.4 74.0 205.6 Vietnam -3.2 0.7 3.6 9.7 2.6 13.4 Pakistan -0.1 4.9 -1.9 4.0 11.6 18.4 Angola 4.6 0.2 -2.5 2.6 1.2 6.1 Bangladesh 0.1 0.2 1.6 3.2 2.4 7.5 Uzbekistan -2.2 1.1 -7.9 6.2 8.1 5.2 Nigeria -19.0 0.0 -2.5 -0.3 11.3 -10.4
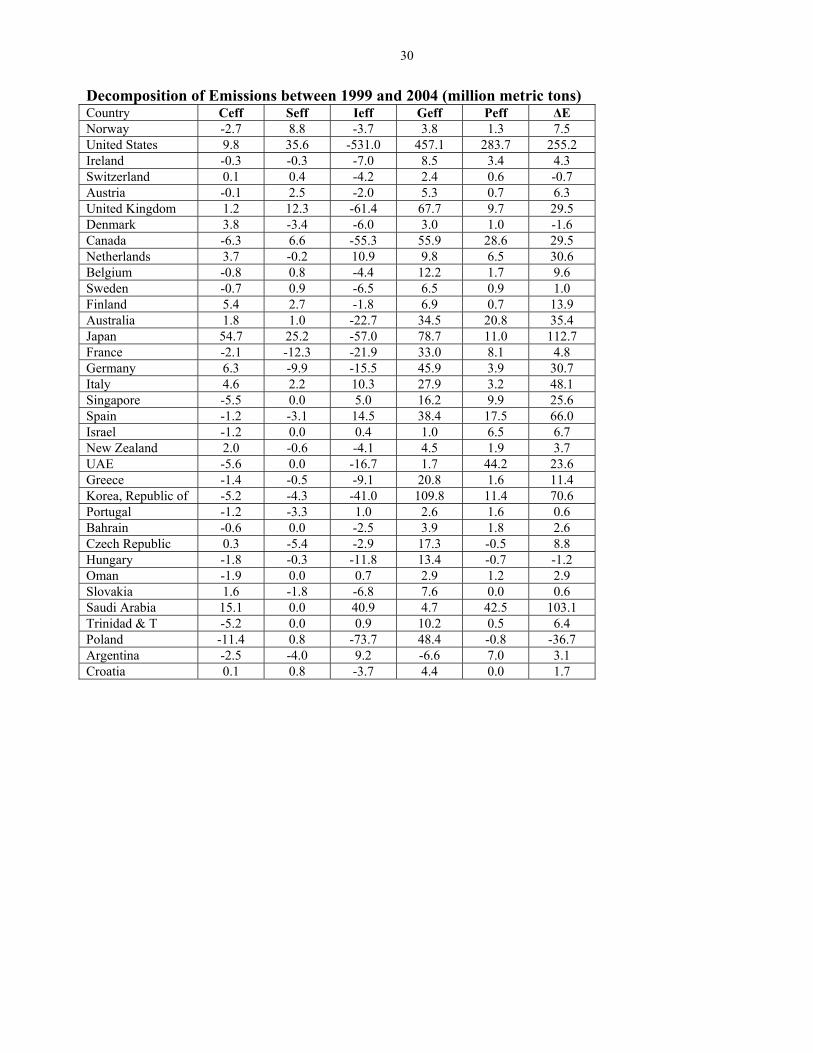
30
Decomposition of Emissions between 1999 and 2004 (million metric tons) Country Ceff Seff Ieff Geff Peff ∆E Norway -2.7 8.8 -3.7 3.8 1.3 7.5 United States 9.8 35.6 -531.0 457.1 283.7 255.2 Ireland -0.3 -0.3 -7.0 8.5 3.4 4.3 Switzerland 0.1 0.4 -4.2 2.4 0.6 -0.7 Austria -0.1 2.5 -2.0 5.3 0.7 6.3 United Kingdom 1.2 12.3 -61.4 67.7 9.7 29.5 Denmark 3.8 -3.4 -6.0 3.0 1.0 -1.6 Canada -6.3 6.6 -55.3 55.9 28.6 29.5 Netherlands 3.7 -0.2 10.9 9.8 6.5 30.6 Belgium -0.8 0.8 -4.4 12.2 1.7 9.6 Sweden -0.7 0.9 -6.5 6.5 0.9 1.0 Finland 5.4 2.7 -1.8 6.9 0.7 13.9 Australia 1.8 1.0 -22.7 34.5 20.8 35.4 Japan 54.7 25.2 -57.0 78.7 11.0 112.7 France -2.1 -12.3 -21.9 33.0 8.1 4.8 Germany 6.3 -9.9 -15.5 45.9 3.9 30.7 Italy 4.6 2.2 10.3 27.9 3.2 48.1 Singapore -5.5 0.0 5.0 16.2 9.9 25.6 Spain -1.2 -3.1 14.5 38.4 17.5 66.0 Israel -1.2 0.0 0.4 1.0 6.5 6.7 New Zealand 2.0 -0.6 -4.1 4.5 1.9 3.7 UAE -5.6 0.0 -16.7 1.7 44.2 23.6 Greece -1.4 -0.5 -9.1 20.8 1.6 11.4 Korea, Republic of -5.2 -4.3 -41.0 109.8 11.4 70.6 Portugal -1.2 -3.3 1.0 2.6 1.6 0.6 Bahrain -0.6 0.0 -2.5 3.9 1.8 2.6 Czech Republic 0.3 -5.4 -2.9 17.3 -0.5 8.8 Hungary -1.8 -0.3 -11.8 13.4 -0.7 -1.2 Oman -1.9 0.0 0.7 2.9 1.2 2.9 Slovakia 1.6 -1.8 -6.8 7.6 0.0 0.6 Saudi Arabia 15.1 0.0 40.9 4.7 42.5 103.1 Trinidad & T -5.2 0.0 0.9 10.2 0.5 6.4 Poland -11.4 0.8 -73.7 48.4 -0.8 -36.7 Argentina -2.5 -4.0 9.2 -6.6 7.0 3.1 Croatia 0.1 0.8 -3.7 4.4 0.0 1.7
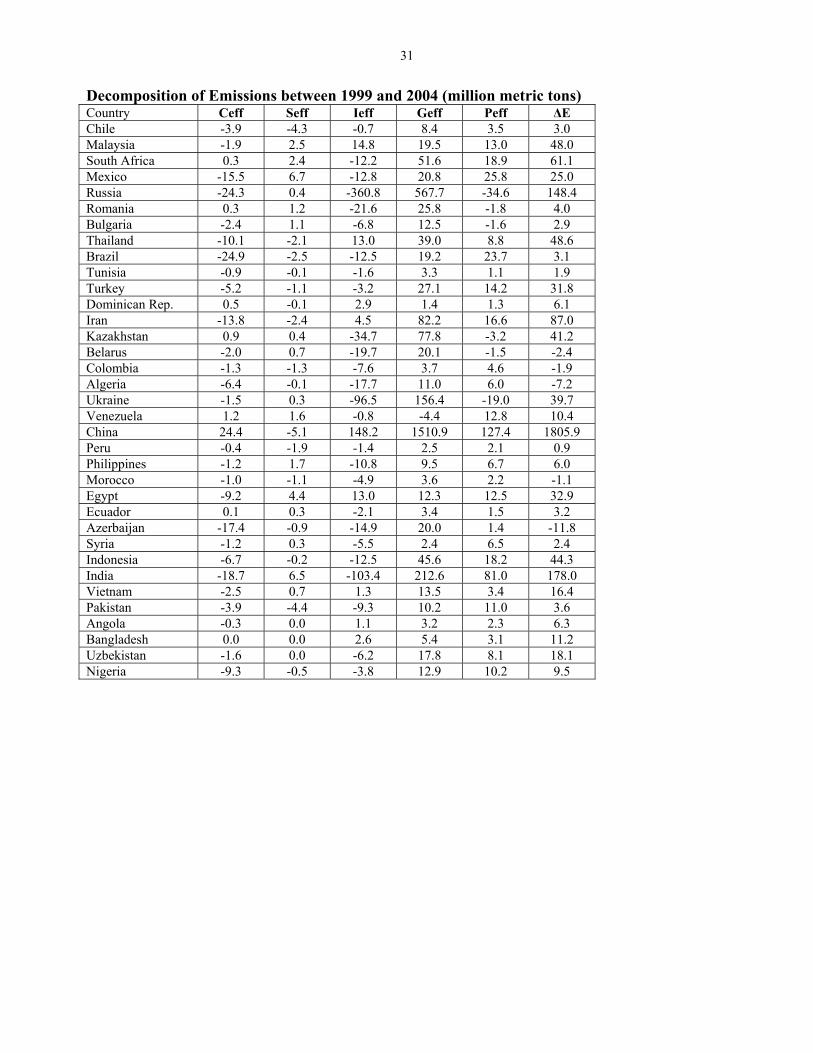
31
Decomposition of Emissions between 1999 and 2004 (million metric tons) Country Ceff Seff Ieff Geff Peff ∆E Chile -3.9 -4.3 -0.7 8.4 3.5 3.0 Malaysia -1.9 2.5 14.8 19.5 13.0 48.0 South Africa 0.3 2.4 -12.2 51.6 18.9 61.1 Mexico -15.5 6.7 -12.8 20.8 25.8 25.0 Russia -24.3 0.4 -360.8 567.7 -34.6 148.4 Romania 0.3 1.2 -21.6 25.8 -1.8 4.0 Bulgaria -2.4 1.1 -6.8 12.5 -1.6 2.9 Thailand -10.1 -2.1 13.0 39.0 8.8 48.6 Brazil -24.9 -2.5 -12.5 19.2 23.7 3.1 Tunisia -0.9 -0.1 -1.6 3.3 1.1 1.9 Turkey -5.2 -1.1 -3.2 27.1 14.2 31.8 Dominican Rep. 0.5 -0.1 2.9 1.4 1.3 6.1 Iran -13.8 -2.4 4.5 82.2 16.6 87.0 Kazakhstan 0.9 0.4 -34.7 77.8 -3.2 41.2 Belarus -2.0 0.7 -19.7 20.1 -1.5 -2.4 Colombia -1.3 -1.3 -7.6 3.7 4.6 -1.9 Algeria -6.4 -0.1 -17.7 11.0 6.0 -7.2 Ukraine -1.5 0.3 -96.5 156.4 -19.0 39.7 Venezuela 1.2 1.6 -0.8 -4.4 12.8 10.4 China 24.4 -5.1 148.2 1510.9 127.4 1805.9 Peru -0.4 -1.9 -1.4 2.5 2.1 0.9 Philippines -1.2 1.7 -10.8 9.5 6.7 6.0 Morocco -1.0 -1.1 -4.9 3.6 2.2 -1.1 Egypt -9.2 4.4 13.0 12.3 12.5 32.9 Ecuador 0.1 0.3 -2.1 3.4 1.5 3.2 Azerbaijan -17.4 -0.9 -14.9 20.0 1.4 -11.8 Syria -1.2 0.3 -5.5 2.4 6.5 2.4 Indonesia -6.7 -0.2 -12.5 45.6 18.2 44.3 India -18.7 6.5 -103.4 212.6 81.0 178.0 Vietnam -2.5 0.7 1.3 13.5 3.4 16.4 Pakistan -3.9 -4.4 -9.3 10.2 11.0 3.6 Angola -0.3 0.0 1.1 3.2 2.3 6.3 Bangladesh 0.0 0.0 2.6 5.4 3.1 11.2 Uzbekistan -1.6 0.0 -6.2 17.8 8.1 18.1 Nigeria -9.3 -0.5 -3.8 12.9 10.2 9.5
32
Bibliography Ang, B.W. (2004). “Decomposition analysis for policymaking in energy: which is the preferred
method?” Energy Policy 32: 1131-39. Ang, B.W. (2005). “The LMDI approach to decomposition analysis: a practical guide.” Energy
Policy 33: 867-71. Ang, B.W. and F.Q. Zhang. (1999). “Inter-regional comparisons of energy-related CO2 emissions
using the decomposition technique.” Energy 24: 297-304. Duro, J.A. and E. Padilla. (2006). “International inequalities in per capita CO2 emissions: A
decomposition methodology by Kaya factors.” Energy Economics 28: 170-87. Ebohon, O.J. and A.J. Ikeme. (2006). “Decomposition analysis of CO2 emission intensity between
oil-producing and non-oil producing sub-Saharan African countries.” Energy Policy 34: 3599-3611.
Heil, M.T. and Q.T. Wodon. (2000). “Future Inequality in CO2 Emissions and the Impact of Abatement Proposals.” Environmental and Resource Economics 17: 163-81.
Herzog, T., K.A. Baumert, and J. Pershing. (2006). “Target Intensity. An Analysis of Greenhouse Gas Intensity Targets.” World Resources Institute, Washington D.C.
Hoffman, B. and K. Labar. (2007). “Structural Change and Energy Use: Evidence from China’s Provinces.” The World Bank, China Working Paper Series: 6.
Holtsmark B.J. and K.H. Alfsen. (2004). “PPP correction of the IPCC emission scenarios – does it matter?” Statistics Norway, Research Department, Discussion Papers: 366.
Intergovernmental Panel on Climate Change. (2007). “Climate Change 2007: Mitigation of Climate Change.” Working Group III Contribution to the IPCC Fourth Assessment Report: Summary for Policymakers. UNEP.
Kaya, Y. (1990). “Impact of carbon dioxide emission control on GNP growth: interpretation of proposed scenarios.” Paper presented to IPCC Energy and Industry Sub-group, Response Strategies Working Group.
Lee, K. and W. Oh. (2006). “Analysis of CO2 emissions in APEC countries: a time-series and a cross-sectional decomposition using the log mean Divisia method.” Energy Policy 34: 2779-87.
Liao, H., Y. Fan and Y. Wei. (2007). “What induced China’s energy intensity to fluctuate: 1997-2006?” Energy Policy: forthcoming.
Lise, W. (2006). “Decomposition of CO2 emissions over 1980-2003 in Turkey.” Energy Policy 34: 1841-52.
Liu N. and B. Ang. (2007). “Factors shaping aggregate energy intensity trend for industry: Energy intensity versus product mix.” Energy Economics 29:609-35.
Ma, C. and D.I. Stern. (2006). “China’s Changing Energy Intensity Trend: A Decomposition Analysis.” Rensselaer Polytechnic Institute, Working Papers in Economics: 0615.
Nag, B. and J.K. Parikh. (2005). “Carbon emission coefficient of power consumption in India: baseline determination from the demand side.” Energy Policy 33: 777-86.
Paul, S. and R. N. Bhattacharya. (2004). “CO2 emission from energy use in India: a decomposition analysis.” Energy Policy 32: 585-93.
Stern, D.I. (2003). “The Environmental Kuznets Curve.” Internet Encyclopaedia of Ecological Economics. http://www.ecoeco.org/pdf/stern.pdf
Viguier, L. (1999). “Emissions of SO2, NOx and CO2 in Transition Economies: Emissions Inventories and Divisia Index Analysis.” The Energy Journal 20: 59-87.
Wang, C., J. Chen and J. Zou. (2005). “Decomposition of energy-related CO2 emission in China: 1957–2000.” Energy 30: 73-83.

33
World Resources Institute. (2006) Climate Analysis Indicators Tool. Version 3.0 Washington D.C. http://cait.wri.org