GROWING PAINS: CHILDCARE IN CANADA€¦ · GROWING PAINS: CHILDCARE IN CANADA SUNIL JOHAL & THOMAS...
26
RENEWING CANADA’S SOCIAL ARCHITECTURE GROWING PAINS: CHILDCARE IN CANADA SUNIL JOHAL & THOMAS GRANOFSKY JUNE 2015
Transcript of GROWING PAINS: CHILDCARE IN CANADA€¦ · GROWING PAINS: CHILDCARE IN CANADA SUNIL JOHAL & THOMAS...

RENEWING CANADA’SSOCIAL ARCHITECTURE
GROWING PAINS: CHILDCARE IN CANADA
SUNIL JOHAL & THOMAS GRANOFSKY
JUNE 2015


Contents
Problem statement 1
PoliCy objeCtive 1
Drivers oF CHanGe 3
Current status 5
ComParative Case stuDies 11
oPtions 15
ConClusion 20

1
re
ne
win
g c
an
ad
a’s
so
cia
l a
rc
hit
ec
tu
re
Problem Statement
There is strong evidence that effective childcare policies boost employment, reduce gender inequality and promote child development, particularly for struggling families.1 Despite this value proposition, and with some exceptions, governments in Canada have not invested significantly nor paid serious policy attention to childcare.
A 2008 UNICEF study ranked Canada last among 25 industrialized countries in early childhood services.2 Fewer than one in four children in Canada have access to regulated childcare spaces. The spaces that do exist are often unaffordable. The quality of care children receive in private, public and informal care settings is inconsistent.
Canada’s political parties are currently staking out their positions on childcare in advance of the 2015 federal election, ranging from enhancements to the Universal Child Care Benefit to a universal childcare plan. This paper provides an overview of the policy opportunities and challenges in the childcare realm, and proposes options to improve upon current approaches that are flexible enough to meet the diverse needs of Canadian families.
Policy objective
Governments should ensure that Canadians have childcare options that are affordable, accessible, promote early childhood development and provide parents with the flexibility to work.
1 See for example: Pierre Lefebvre and Philip Merrigan. 2008. Child-case policy and the labour supply of mothers with young children: a natural experiment from Canada. Journal of Labour Economics 26 (3); W. Steven Barnett and Debora J. Ackerman. 2006. Costs, benefits and long-term effects of early care and education programs: recommendations and cautions for community developers. Journal of the Community
Development Society 37 (2); HighScope. 2005. Lifetime effects: The HighScope Perry Preschool Study through
age 40. Accessed online at: http://www.highscope.org/content.asp?contentid=219; Royal College of Physicians and Surgeons of Canada. 2014. Early childhood development: Royal College position statement. Accessed online at: http://www.royalcollege.ca/portal/page/portal/rc/common/documents/advocacy/EBBDEL_statement_e.pdf; E. Akbari and K. McCuaig. 2014. Early childhood education report 2014. Ontario Institute for Studies in Education. Accessed online at: http://timeforpreschool.ca/en/full-report/. 2 UNICEF. 2008. The child care transition. Innocenti Report Card 8. Accessed online at: http://www.unicef-irc.org/publications/pdf/rc8_eng.pdf.
What iS childcare?
¬ Childcare includes home-based care, centre-based care and preschool. The focus of this paper is care for children under the age of 5.
Who’S involved in childcare Policy and delivery?
¬ Childcare is under provincial/territorial jurisdiction and service delivery is often handled by municipalities. Private sector providers and unlicensed care (e.g., by family members) also are key elements of the delivery network.
¬ The federal government plays a role in funding social services through transfers to governments and individuals.
Who iS affected?
¬ 5.6 million children under age 14 living in private households.3
¬ In 2012, 1.37 million children aged zero to five had employed mothers.4
¬ In 2012, there were nearly one million regulated full or part-time childcare spaces in Canada, or enough regulated centre-based childcare spaces for 22.5 per cent of children aged zero to five. Available capacity ranges from 46.5 per cent in PEI to 11.5 per cent in Saskatchewan.5
hoW much doeS childcare coSt governmentS and familieS?
¬ Infant spaces (for children under 18 months), which are the most expensive, cost families in Toronto $1,676 a month in 2014, St. Johns $1,394 a month and are as low as $152 a month in the province of Quebec.6 Median fees for infants average $761 per month.7
¬ Average childcare costs for parents in Ontario for 2012 range from $835 to $1,152 per month.8
¬ Government spending on regulated childcare in 2011-2012 in Canada totaled $3.7 billion – Quebec accounts for two-thirds of spending.9
¬ More broadly, the federal government will spend more than $13 billion in 2014-15 on transfers to families meant to help pay for child-related costs such as childcare – including the Universal Child Care Benefit, which currently cost the federal government $2.8 billion per year, and will rise to $4.4 billion in 2015-16.10
3 Statistics Canada. 2014. Portrait of Families and Living Arrangements in Canada. Accessed online at: http://www12.statcan.ca/census-recensement/2011/as-sa/98-312-x/98-312-x2011001-eng.cfm; Maire Sinha. 2014. Child care in Canada. Statistics Canada Analytical Paper.4 Martha Friendly, Shani Halfon, Jane Beach and Barry Forer. 2013. Early childhood education and care in Canada 2012. Childcare Research and Resource Unit. Accessed online at: http://childcarecanada.org/sites/default/files/CRRU_ECEC_2012_revised_dec2013.pdf.5 Friendly et al., 2013.6 David Macdonald and Martha Friendly. 2014. The parent trap: child care fees in Canada’s biggest cities. Canadian Centre for Policy Alternatives. Accessed online at: https://www.policyalternatives.ca/sites/default/files/uploads/publications/National%20Office/2014/11/Parent_Trap.pdf.7 Friendly et al., 2013.8 Friendly et al., 2013.9 Friendly et al., 2013.10 Government of Canada. 2014. Federal Budget 2014. Accessed online at: http://www.budget.gc.ca/2014/docs/plan/ch4-2-eng.html; Department of Finance Canada. 2014. Backgrounder: Helping Families Prosper. Accessed online at: http://www.fin.gc.ca/n14/data/14-155_1-eng.asp.

3
re
ne
win
g c
an
ad
a’s
so
cia
l a
rc
hit
ec
tu
re
Drivers oF CHanGe
Canada’s labour market, demographics and family form have shifted tremendously since the 1950s and ’60s. The traditional “male-breadwinner” division of labour, which assumes that men provide the majority of family income and women take on the majority of family caregiving responsibility, no longer conforms to reality. While inflation-adjusted median family incomes remained virtually flat from 1976 ($55,200) to 2011 ($57,000), women’s employment rates went up by roughly 40 per cent in the same time period. In essence, households in Canada now rely on two people to earn what one earned in 1976.11
For the growing number of lone-parent households — 80 per cent of which are female-led — employment often isn’t even an option without childcare, and as a result, women and children are more vulnerable to poverty in Canada.12 In 2011 and 2012 respectively, more than 500,000 women in lone-parent households (36.5 per cent of all lone-parent households) and 1.3 million children (19 per cent of all children) were living in poverty in Canada.13
Consequently, insufficient access to childcare is a more pressing issue now than in the past. There are a number of related trends that also bear mentioning:
1. Women, in addition to being far more likely to participate in the labour market than in the past, now outnumber men in post-secondary education enrollment while still performing the majority of household labour.14
2. Insufficient childcare policies can lead to a ‘motherhood penalty’, wherein women who take time off to care for children will struggle with not only
11 Thomas Granofsky, Miles Corak, Sunil Johal and Noah Zon. 2015. Renewing Canada’s Social Architecture. Mowat Centre. Accessed online at: http://social-architecture.ca/wp-content/uploads/FramingPaper.pdf.12 Statistics Canada. 2014. Portrait of Families and Living Arrangements in Canada. Accessed online at: http://www12.statcan.ca/census-recensement/2011/as-sa/98-312-x/98-312-x2011001-eng.cfm; Sinha, 2014. 13 Statistics for lone-parent households from 2011, using the After-tax Low-Income Measure. Cansim Tables 202-0803 and 202-0804; Statistics for child poverty based on After-tax Low Income Measure. Campaign 2000. 2014. 2014 Report on Child and Family Poverty in Canada.
14 Labour force participation of males has declined slightly and stood at 90.7 per cent in 2013. Statistics Canada. 2011. Women in Canada: A gender-based statistical report. Accessed online at: http://www.statcan.gc.ca/pub/89-503-x/89-503-x2010001-eng.htm.

4
Gr
ow
inG
pa
ins
: c
hil
dc
ar
e i
n c
an
ad
a
higher unemployment and poverty rates but also an earnings gap when compared to women who do not take time off to care for children.15
3. In some cities in Canada, one-third of a woman’s median income goes towards childcare fees.16
As a result, demand for childcare has increased dramatically yet parents struggle to afford it. Despite the increase in dual-earner households, couples do not earn much more than previous generations that relied on a single paycheque. These financial pressures force some families to choose between paying for childcare or removing one parent from the labour market, with potentially scarring long-term effects on employment prospects and wages.
15 Michelle Budig, Joya Misra and Irene Böckmann. 2010. The motherhood penalty in cross-national
perspective: the importance of work-family policies and cultural attitudes. Luxembourg Income Study Working Paper Series, No. 542.16 Macdonald and Friendly, 2014.

5
re
ne
win
g c
an
ad
a’s
so
cia
l a
rc
hit
ec
tu
re
Current StAtuS
In response to the growth in demand for childcare, provinces, territories and municipalities have taken varying approaches to addressing this need. As a result, the availability, quality and price of childcare differ depending on where someone lives. While the federal government notionally invests in families and children through transfers and tax refunds, there has been limited national coordination of services, nor a concerted effort to tie transfers and benefits directly to childcare. While this flexibility has its benefits for parents who can use the extra money to meet their weekly food budget or pay utility bills (or provinces seeking to fund other priority areas), it does next to nothing to address the issue of creating new childcare spaces.
As a result, childcare affordability, for those who can’t rely on informal, inexpensive care from relatives or friends, remains a challenge — too many people are seeking not enough spots, creating a significant pressure on the supply of available, affordable spaces. This is a particular issue for many low and middle-income parents who must face the choice of working to cover childcare costs or staying at home and foregoing valuable incremental income. Though low-income families may qualify for subsidized childcare spaces, where they are available, high demand for these spaces often results in long wait-lists and unmet needs.
investments in CHilDCare anD CanaDian Families
Several provinces and municipalities have made significant investments in childcare and early-learning programs but significant gaps in service exist in many parts of the country. Overall, Canada has one of the lowest levels of investment in childcare and early education in the OECD and ranks well below the OECD average in supports for families — spending 1.55 per cent of GDP on services (including childcare and parental support), tax breaks and cash benefits for families with children. It should be noted that this data is hard to compare across jurisdictions, as much of Canada’s spending on kindergarten is not included, lowering the measured level of spending when compared to some countries which operate more integrated early childhood programs.17
17 Based on 2009 data. OECD Social Expenditure Database. Accessed online at: http://www.oecd.org/els/social/expenditure.

6
Gr
ow
inG
pa
ins
: c
hil
dc
ar
e i
n c
an
ad
a
figure 1: SPending on family benefitS aS Percentage of gdP in Selected oecd countrieS, 2009
Notes: Data is based on support exclusively for families (e.g. child payments and allowances, parental leave and childcare services)
Source: OECD Social Expenditure Database. Accessed online at: http://www.oecd.org/els/social/expenditure.
The federal government contributes to childcare programming through transfers to provinces — approximately 10 per cent or $1.2 billion (in 2012-13) of the Canada Social Transfer is notionally allocated for the “support of children,” of which $700 million is theoretically earmarked to support the creation of new childcare spaces.18 It is important to note that this notional transfer does not necessarily flow directly into childcare programs, as provincial governments retain broad discretion over how to allocate this funding and can choose to spend it on other program priorities.
18 Department of Finance Canada. Federal Support for Child care. Accessed online at: http://www.fin.gc.ca/fedprov/fsc-eng.asp.
0.0
0.5
1.0
1.5
2.0
2.5
3.0
3.5
4.0
4.5
Tax breaks towards families Services Cash
Kor
ea
Mex
ico
Uni
ted
Stat
es
Japa
n
Pol
and
Can
ada
Ital
y
Slov
enia
Slov
ak R
epub
lic
Net
herl
ands
Aus
tral
ia
Ger
man
y
Nor
way
Bel
gium
Swed
en
Icel
and
Fran
ce
Uni
ted
Kin
gdom
Irel
and
OECD- 33 average = 2.6%

7
re
ne
win
g c
an
ad
a’s
so
cia
l a
rc
hit
ec
tu
re
All levels of government spend a combined total of $3.7 billion per year — or 0.25 per cent of GDP — on regulated childcare, including subsidies for low-income families and daycare and home-based care operating costs.19
The bulk of spending to help families in Canada access childcare comes in the form of general cash transfers to families. In 2014-15, the federal government will spend $13.2 billion combined on the Canada Child Tax Benefit, the National Child Benefit Supplement and the Universal Child Care Benefit.20 The Universal Child Care Benefit, at an annual cost of around $2.8 billion (rising to $7 billion in 2015-16), is a taxable payment of $100 per month (rising to $160 in 2015-16) to families with children less than six years old.21 Families are also eligible to deduct up to $8,000 in childcare expenses from taxable income for children under seven years and $4,000 for children aged seven to 16.22 Ken Battle’s paper on child benefits, which is a part of this series, delves more deeply into these issues.23
These transfers can help to reduce poverty and improve families’ ability to pay for services such as childcare. But the system is complex, difficult to navigate and too often works at cross-purposes. Some programs, such as the Working Income Tax Benefit, encourage people to enter the labour market. Meanwhile the marginal effective tax rate and design of other programs, including the Universal Child Care Benefit, which is explicitly intended to offset childcare costs, actually discourage labour market participation.24
CHilDCare serviCes in CanaDa — aCCessibility anD
aFForDability issues
There is a critical lack of affordable and high-quality childcare spaces in Canada. While the total number of regulated childcare spaces in Canada has grown from 370,000 in 1992 to 980,000 in 2012, the majority of that growth has occurred in Quebec and the province now accounts for 40 per cent (400,000) of all regulated childcare spaces in Canada for children up to twelve years of age.25 Overall,
19 Martha Friendly. 2013. The 17.5 billion question: Has the universal childcare benefit given families
‘choice in child care’? Childcare Resource and Research Unit, Briefing note. Accessed online at: http://childcarecanada.org/sites/default/files/BN_UCCB_10_13_0.pdf.20 Department of Finance Canada. Budget Plan 2014. Accessed online at: http://www.budget.gc.ca/2014/docs/plan/pdf/budget2014-eng.pdf.21 Martha Friendly. 2014. Getting less bang for the child care buck – all $6.8 billion of them. Childcare Resource and Research Unit, Briefing note. Accessed online at: http://childcarecanada.org/sites/default/files/GettinglessbangforthechildcarebuckBN.pdf. 22 Friendly, 2014. 23 Ken Battle. 2015. Child benefits in Canada: politics versus policy. Caledon Institute of Social Policy. Accessed online at: http://social-architecture.ca/wp-content/uploads/ChildBenefitsInCanada.pdf.24 Tammy Schirle. 2013. The Effect of Universal Child Benefits on Labour Supply. Forthcoming in the Canadian Journal of Economics. Accessed online at: http://tammyschirle.org/research/CLSRN_125_Schirle.pdf. 25 Friendly et al., 2013.
8
Gr
ow
inG
pa
ins
: c
hil
dc
ar
e i
n c
an
ad
a
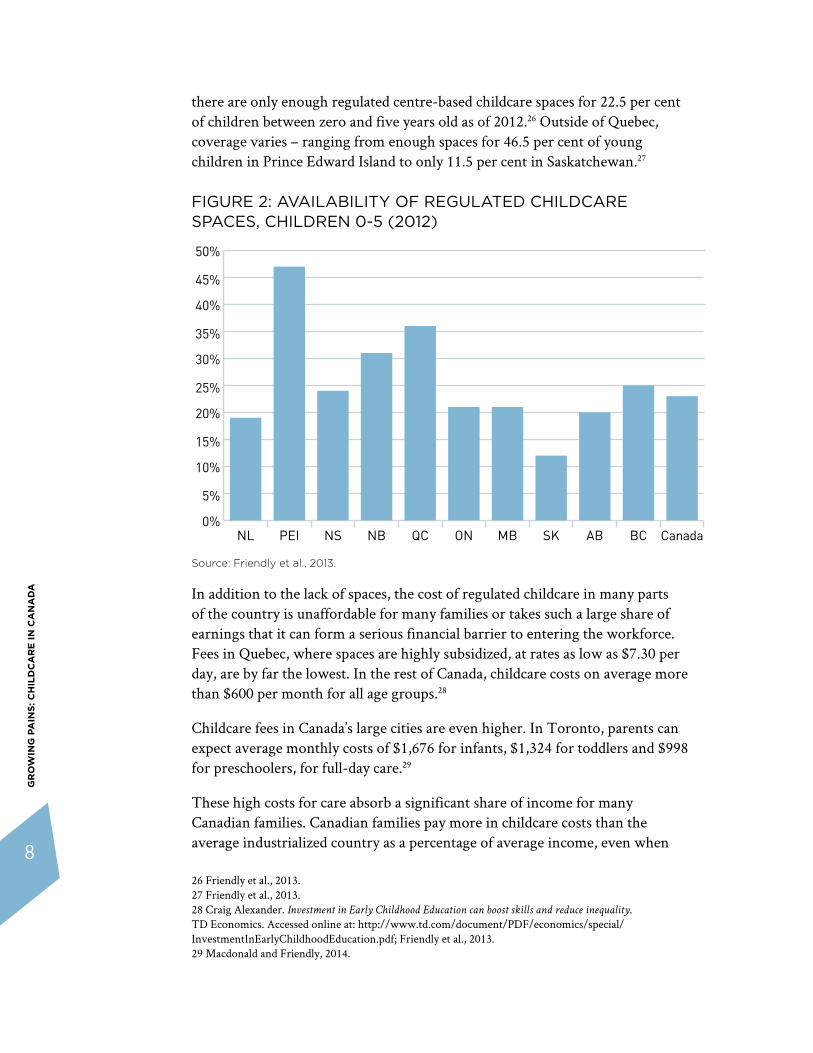
there are only enough regulated centre-based childcare spaces for 22.5 per cent of children between zero and five years old as of 2012.26 Outside of Quebec, coverage varies – ranging from enough spaces for 46.5 per cent of young children in Prince Edward Island to only 11.5 per cent in Saskatchewan.27
figure 2: availability of regulated childcare SPaceS, children 0-5 (2012)
Source: Friendly et al., 2013.
In addition to the lack of spaces, the cost of regulated childcare in many parts of the country is unaffordable for many families or takes such a large share of earnings that it can form a serious financial barrier to entering the workforce. Fees in Quebec, where spaces are highly subsidized, at rates as low as $7.30 per day, are by far the lowest. In the rest of Canada, childcare costs on average more than $600 per month for all age groups.28
Childcare fees in Canada’s large cities are even higher. In Toronto, parents can expect average monthly costs of $1,676 for infants, $1,324 for toddlers and $998 for preschoolers, for full-day care.29
These high costs for care absorb a significant share of income for many Canadian families. Canadian families pay more in childcare costs than the average industrialized country as a percentage of average income, even when
26 Friendly et al., 2013. 27 Friendly et al., 2013. 28 Craig Alexander. Investment in Early Childhood Education can boost skills and reduce inequality. TD Economics. Accessed online at: http://www.td.com/document/PDF/economics/special/InvestmentInEarlyChildhoodEducation.pdf; Friendly et al., 2013. 29 Macdonald and Friendly, 2014.
0%
5%
10%
15%
20%
25%
30%
35%
40%
45%
50%
CanadaBCABSKMBONQCNBNSPEINL

9
re
ne
win
g c
an
ad
a’s
so
cia
l a
rc
hit
ec
tu
re
figure 3: median full-time monthly feeS for full-day centreS by age grouP
Source: Friendly et al., 2013.
benefits and tax rebates are taken into account.30 For example, in 2012, a couple in Ontario with dual-earned annual income of $140,820 could expect childcare fees to absorb 22 per cent of net family income (or $30,980) to pay for full-time regulated care for two children, aged two and three.31
Recent changes to federal tax measures and benefits — including the increase in the Universal Child Care Benefit, expansion of the Child Care Expense Deduction and introduction of the Family Tax Cut — do not adequately improve the ability of many families to afford childcare.
Many low and middle-income families, particularly single-parents, are unlikely to qualify for the Family Tax Cut and the $160 monthly Universal Child Care Benefit is insufficient to significantly offset the cost of a regulated childcare space.
For a family with income near the poverty line, a regulated space, assuming there are no subsidized spaces available, would consume as much as half of all family income.32 Higher-income families, which can more easily absorb the costs of childcare, are far more likely to access childcare services — those with incomes over $100,000 are twice as likely to use childcare services as families with income below $40,000.33
30 OECD Family Database. Accessed online at: http://www.oecd.org/social/family/database.htm. 31 OECD Family Database. 32 OECD Family Database. 33 Sinha, 2014.
$0
$200
$400
$600
$800
$1,000
$1,200
$1,400
Pre-SchoolersToddlersInfants
CanadaBCABSKMBONQCNBNSPEINL

10
Gr
ow
inG
pa
ins
: c
hil
dc
ar
e i
n c
an
ad
a
The high cost of care leads some families to seek alternative forms of care — unlicensed and even illegal childcare centres have become a popular solution for cash-strapped parents of young children. Unlicensed care could mean a grandparent or a neighbour, or someone who is taking in a small number of children as a full-time job. In Ontario, the number of children in unlicensed care is estimated to be double the number in licensed facilities.34 Because these services are less stringently monitored the quality of care can be very poor — the recent death of several infants in unlicensed facilities in Ontario has been linked to a lack of oversight. 35
Quality oF Care — early-learninG anD CHilDren’s
outComes
The quality of care provided by childcare services has a significant impact on children’s developmental outcomes — childcare has the potential for both positive and negative impacts on children. Quality of care depends on a number of factors including staff-child ratios, level of staff qualifications and the types of engagement staff have with children.
There is a growing consensus that childcare paired with high-quality early-learning programming — which requires highly-qualified (and therefore well-paid) staff — delivers the best outcomes for children. A number of studies have found that early-learning programs are positively associated with cognitive and social development and progress in school.36 For vulnerable children, gains from early-learning are even more pronounced. Programs targeted at vulnerable children have been demonstrated to improve future employment prospects and therefore increase social mobility and reduce inequality of opportunity.37 Studies in the United States have shown a return of between $4 and $17 for each dollar invested in preschool programs.38
Provinces and territories have increased early-learning investments in recent years. Several provinces, including Ontario and Quebec now offer full-day kindergarten and a number of provinces have begun integrating education and care.39 However, Canada still ranks below the OECD average in terms of early-education enrollment and investment and most jurisdictions in Canada require only a minimal amount of formal early-learning training for workers and offer low-wages to early-childhood educators and childcare staff.40
34 Andre Marin. 2014. Careless about Child Care: Investigation into how the Ministry of Education responds
to complaints and concerns relating to unlicensed daycare providers. Ombudsman Report. Accessed online at: https://ombudsman.on.ca/Files/sitemedia/Documents/CarelessAboutChildCareEN_1.pdf.35 Marin, 2014. 36 Kerry McCuaig, Jane Bertrand and Stuart Shanker. 2012. Trends in Early Education and Child Care. Atkinson Centre for Society and Child Development, OISE. Accessed online at: http://www.oise.utoronto.ca/atkinson/UserFiles/File/Publications/TrendsinEarlyEducationandChildCare_Jul2012.pdf. 37 James J. Heckman. The case for investing in disadvantaged young children. Accessed online at: http://www.heckmanequation.org/content/resource/case-investing-disadvantaged-young-children 38 Royal College of Physicians and Surgeons of Canada, 2014. 39 Gordon Cleveland and Susan Colley. 2013. Integration of Child Care and Education in Canada: A Comparison with Sweden, New Zealand, England and Wales. International Journal of Early Childhood. 45(2): 167–189.40 Akbari and McCuaig, 2014.

11
re
ne
win
g c
an
ad
a’s
so
cia
l a
rc
hit
ec
tu
re
ComParative Case stuDies
QuebeC’s universal CHilDCare ProGram
Quebec’s investments in childcare have made its system by far the most accessible in the country. The province now provides enough regulated childcare spaces for half of all children under age five, at a cost ranging from $7.30 per day to $20 per day, depending on a family income (until January 2015 the program covered all children at a flat rate). The number of spaces has increased to 230,000, up from 77,000 before the system was introduced. The program also includes full-day kindergarten for children age five and more childcare spaces for school-aged children.
The program, launched in 1997, has resulted in significant increases in women’s participation in the labour force — in Quebec, women with children are now more likely to be employed and working more hours, compared to the rest of Canada.41 Quebec’s fertility rate has also risen faster than in other provinces — in 2000, rates were 1.45 in Quebec and 1.49 in Ontario, by 2009, Ontario’s had risen to 1.56 while Quebec’s was at 1.74.42
These gains come with a price-tag — Quebec’s childcare system costs $2.3 billion per year or about $10,000 per space. But the program is estimated to pay for itself and even earn a small return through increased economic activity and tax revenue.43 In 2008, Quebec’s childcare program is estimated to have been responsible for 70,000 additional Quebec women working, which led to a $5 billion increase in provincial GDP.44
However, the pace of growth has led to inconsistent quality of care and mixed, at best, outcomes for children and families.45 Supply of high-quality childcare
41 Roderic Beaujot, Ching Jiangqin Du and Zenaida Ravanera. 2013. Family Policies in Quebec and the Rest of Canada: Implications for Fertility, Child-Care, Women’s Paid Work, and Child Development Indicators. Canadian Public Policy. 39(2): 221-239.42 Beaujot et al., 2013. 43 Pierre Fortin, Luc Godbout, Suzie St-Cerny. 2012. Impact of Quebec’s Universal Low Fee Childcare
Program on Female Labour Force Participation, Domestic Income and Government Budgets. Chaire de Recherche en fiscalité et finances publiques Working Paper. Université de Sherbrooke. 44 Fortin et al., 2012. 45 Michael J. Kottelenberg and Steven F. Lehrer. 2013. New Evidence on the Impacts of Access to and Attending Universal Child-Care in Canada. Canadian Public Policy. 39(2): 263-285; Pierre Lefebvre, Philip Merrigan and Francis Roy-Desrosiers. 2011. Quebec’s childcare universal low fees policy 10 years after: effects,
costs and benefits. CIRPÉE Working Paper No. 11-01.

12
Gr
ow
inG
pa
ins
: c
hil
dc
ar
e i
n c
an
ad
a
spaces, such as those provided by the non-profit Centres de la Petite Enfance, has not been able to keep up with demand. Some of the subsidized spaces in Quebec are of lower quality and developmental and behavioural outcomes for children in the province have not been strong.46 Another issue has been that children from vulnerable populations — who have the most to gain from high-quality care — have been underserved by the system.47 Usage of childcare in Quebec, as in the rest of Canada, rises along with a mother’s education and income level.48
Cost
¬ The program cost $2.3 billion (approximately 0.75 per cent of GDP) in 2013-14, with the government subsidizing 86.5 per cent of the cost of care.49 The recent changes to introduce a sliding fee scale based on family income will increase parental contributions to 20 per cent of the overall program cost.50
outComes
¬ The participation rate in the workforce for women in Quebec grew faster than the national average after the introduction of their childcare program — closing a gap in women’s labour force participation between Quebec and the rest of Canada by 2011.51
¬ Single mothers with young children experienced a 22 per cent increase in labour force participation between 1996 and 2008.
¬ In the same period, the number of single-parent families relying on social assistance was reduced by more than half, and real median (after-tax) incomes for single-parent families increased by 81 per cent.52
sweDen’s “Förskola”
Sweden’s preschool program is a full-day subsidized childcare program, integrated with early-learning and universally available to all children at twelve months of age. The rationale behind Sweden’s preschool program was initially to integrate women into the workforce to overcome a labour shortage in the 1960s. Current objectives of the program are to make it possible for parents to combine employment or studies with family life and to encourage child development.53
46 Michael Baker, Jonathan Gruber, Kevin Milligan. 2005. Universal Childcare, Maternal Labor Supply, and
Family Well-Being. NBER Working Paper No. 11832. 47 Beaujot et al., 2013.48 Beaujot et al., 2013.49 Finances Quebec. 2014. Budget Plan 2014-2015. Accessed online at: http://www.budget.finances.gouv.qc.ca/budget/2014-2015a/en/documents/BudgetPlan.pdf. 50 Finances Quebec. 2015. Daily daycare costs. Accessed online at: http://www.budget.finances.gouv.qc.ca/Budget/outils/garde_en.asp. 51 Fortin et al., 2012.52 Fortin et al., 2012.53 Columbia University. 2008. The Clearinghouse on International Developments in Child, Youth and Family
Policies: Sweden. Accessed online at: http://www.childpolicyintl.org/countries/sweden.html.

13
re
ne
win
g c
an
ad
a’s
so
cia
l a
rc
hit
ec
tu
re
Fees are charged on a sliding scale based on income (up to 3 per cent of a family’s monthly income) but capped at around $200 per month.54 This cost also decreases as a family has more children. Service delivery is handled by municipalities, which together with the central government cover more than 80 per cent of total costs.55
Sweden’s system is noteworthy for its flexibility. Parents may reduce working hours by using parental benefit days or decrease their working time by up to 25 per cent until their child is eight years old or finishes their first year of school.56 Sweden and other Nordic countries, also offer alternative cash-for-care systems — in addition to access to universal childcare — that give parents greater financial flexibility if they choose to keep their child at home (this scheme is more heavily used in Norway and Finland than Sweden).57
Sweden’s parental leave system is also amongst the most generous in the world. Parents can split up to 480 days of leave, at 80 per cent pay for most of that time, for their first child. If both parents take at least a month of leave, the family receives an additional month of leave (this will become two additional months in 2016) — an incentive which means that close to 90 per cent of Swedish fathers take paternity leave.
Sweden’s system has been through its challenges — lack of spaces and high fees led to protests in the 1990s — leading to a cap on fees and improvements in supply.58 Currently, municipalities are required by law to find a child a space within three months.59
Cost
¬ 3.1 per cent of GDP was spent on financial benefits for children and families in 2012, highest in the EU (which averages 2.2 per cent of GDP).60
outComes
¬ Women’s employment rate stood at 71.8 per cent in 2012.61
¬ 97 per cent of all four to five year-olds are enrolled in early education childcare and 85 per cent of two to three year-olds in early learning based childcare.62
54 European Union. 2014. Sweden: Successful reconciliation of work and family life. European Platform for Investing in Children. Accessed online at: http://europa.eu/epic/countries/sweden/index_en.htm. 55 Cleveland and Colley, 2013.56 European Union, 2014. 57 Anne L. Ellingsaeter. 2012. Cash for Childcare: Experiences from Finland, Norway and Sweden. Friedrich Ebert Foundation, International Policy Analysis. Accessed online at: http://library.fes.de/pdf-files/id/09079.pdf.58 Anita Nyberg. 2012. Gender Equity Policy in Sweden 1970s-2010s. Nordic Journal of Working Life Studies 2 (4). 59 Swedish Institute. 10 things that make Sweden family-friendly. Accessed online at: https://sweden.se/society/10-things-that-make-sweden-family-friendly/. 60 European Union, 2014.61 European Union. 2014. 62 Canadian Union of Public Employees. 2009. Public child care profile: Sweden. Accessed online at: http://cupe.ca/updir/Public_profile_Sweden.pdf.

14
Gr
ow
inG
pa
ins
: c
hil
dc
ar
e i
n c
an
ad
a
slovenia
Slovenia’s integrated and universal early education and care system begins at the end of parental leave — which provides one year of compensated maternity leave and 90 days of paternity leave. The system, modeled on the early Swedish childcare system, combines education, play and care for children in a care and preschool setting. Like many other European childcare systems, it is administered by municipalities under the national coordination of the Ministry of Education, which subsidizes both private and public facilities.63
Fees are subsidized on a sliding scale — ranging from no cost for families receiving social assistance to a maximum of 77 per cent of the cost of care for families with the highest incomes. Since 2008, to reduce costs for families with multiple children in care, fees are waived for second and subsequent children in care.64 This has led to a surge in demand and municipalities are still struggling to provide a sufficient amount of spaces.
Cost:
¬ 0.65 per cent of GDP spent on preschool system in 2010, 2.2 per cent of GDP is dedicated towards children and families.65
outComes:
¬ Coverage for one to three year-olds rose from 30 per cent in 1990 to 55 per cent in 2010, and from 60 per cent to 89 per cent for three to five year-olds.66
¬ Enrollment rates are high — with over 75 per cent of children aged one to five enrolled in 2010/11.67
¬ Slovenia has one of the lowest poverty rates in the world, sitting at 8.9 per cent in 2011.68
¬ High women’s employment rate — 81.9 per cent of mothers with children below age six were employed in 2011, compared to 93.3 per cent of men.69
63 Nada Stropnik. September 16, 2011. The interplay between leave policies & early childhood services: Case study –
Slovenia. Presented at 8th International Leave Policy & Research Network seminar, Rekjavik, Iceland. 64 Stropnik, 2011. 65 Ingela Naumann, Caitlin McLean, Alison Koslowski, Kay Tisdall and Eva Lloyd. 2013. Early
Childhood Education and Care Provision: International Review of Policy, Delivery and Funding: Final
Report. Scottish Government Social Research. Accessed online at: http://www.scotland.gov.uk/Resource/0041/00416230.pdf.66 Stropnik, 2011.67 Stropnik, 2011.68 OECD. Income and Distribution and Poverty. Accessed online at: http://stats.oecd.org/Index.aspx?QueryId=47991. 69 Naumann et al., 2013.

15
re
ne
win
g c
an
ad
a’s
so
cia
l a
rc
hit
ec
tu
re
oPtions
Canadians’ access to childcare services depends on where they live. While the number of regulated childcare spaces has increased and most provinces have taken steps towards improving quality through the integration of education and childcare, the majority of new spaces have been created in Quebec, leaving residents of other provinces and territories facing severe access and affordability challenges.
Ultimately, it does not appear that the policies pursued outside of Quebec have led to any appreciable growth in the availability of public childcare spaces, despite significant demand from parents. For-profit childcare centres continue to enter the Canadian market, but they face a challenging path to profitability70 and there are questions around the quality of care and accessibility that these centres can offer when compared to publicly-funded childcare.71
Childcare is a market where quality matters — and, given the high costs of care imposed by caregiver to children ratios and other licensing and regulatory requirements, rent and supplies, it is not a space where it appears that the private sector will step in to fill the gap at an affordable price, as demonstrated by Canadian experience over the past decade.
So, what choices do Canadian governments have?
Addressing the issue of childcare affordability and the number of spaces available can be approached in two ways:
i. Through supply-side policies aimed at creating affordable childcare options; and/or
ii. Through demand-side policies, which provide families with resources to pay for childcare services
70 Gerald Dragomir. 2012. Commercial childcare in Canada: Can childcare thrive in a speculative investment
environment? Pace Accounting Inc. Accessed online at: http://cccabc.bc.ca/act/actions/NFS/files/Commercial_Child_Care_in_Canada.pdf. 71 See for example: 2011. What research says about quality in for-profit, non-profit and public child care. Childcare Resource and Research Unit, Briefing Note. Accessed online at: http://childcarecanada.org/documents/research-policy-practice/11/11/what-research-says-about-quality-profit-non-profit-and-publ.
15
re
ne
win
g C
An
Ad
A’S
So
CiA
l A
rC
hit
eC
tu
re

16
Gr
ow
inG
pa
ins
: c
hil
dc
ar
e i
n c
an
ad
a
i. suPPly-siDe PoliCy oPtions
Increasing the supply of childcare spaces could be achieved by subsidizing the cost of childcare spaces — which is how the Quebec government quickly increased the number of affordable spaces. To implement this kind of program on a national level would require a shared funding agreement between the federal government and the provinces, as well as coordination with service providers — which include municipalities, not-for-profits and private childcare centres.
Scaling up a national childcare program would be a major undertaking and meeting demand while maintaining quality would be a serious challenge, one that Quebec has struggled with. One of the main issues with ensuring quality is appropriate staff qualifications and recruiting a well-trained workforce. Ensuring that enough early childhood educators and other staff were trained and compensated adequately to incentivize them to enter into ECE programs would require close coordination between provinces and colleges.
A number of countries now tie funding to quality of care. For example, Australia uses a nation-wide quality accreditation system to evaluate a number of quality metrics and funding for government subsidies is tied to meeting certain thresholds.72 In Sweden, funding is also tied to quality measures, such as the training level of staff, nutritional content of food, area per child, staff-to-child ratios and opening hours.73
Canada has, to date, not taken a consistent approach in tying funding to quality of care, and this is a role the federal government could help fill — coordinating sufficient data-collection and evidence-based outcome measurements to assess what types of care and which providers are providing the best quality of care, so as to continuously refine and target public expenditures towards outcomes that benefit children. Longitudinal studies on the benefits of high-quality childcare, and its interplay with a complex range of other social and economic domains, would also help inform future spending decisions by governments across the country.
Governments could also promote the creation of new childcare spaces through tax incentives for private, not-for-profit or employer-based childcare providers. Since 2007, the federal government has offered employers a 25 per cent Investment Tax Credit, up to a maximum of $10,000, for each new childcare
72 OECD 2012. Starting Strong III: A Quality Toolbox for Early Childhood Education and Care. 73 Linda A. White and Martha Friendly. 2012. Public Funding, Private Delivery: States, Markets, and Early Childhood Education and Care in Liberal Welfare States – A Comparison of Australia, the UK, Quebec and New Zealand. Journal of Comparative Policy Analysis: Research and Practice 14 (4): 293.

17
re
ne
win
g c
an
ad
a’s
so
cia
l a
rc
hit
ec
tu
re
space they create, to offset capital costs.74 In 2006, the federal government offered employers $250 million in limited tax credits through the Community Child Care Investment Program. However, these programs have to date not been successful in spurring the creation of large numbers of childcare spaces.75
Changes could be contemplated to allow employers to claim the full cost of capital investments in childcare. Tax regulations could also be revised to allow employers to subsidize or fully pay for their employees’ childcare costs as a non-taxable benefit.
ii. DemanD-siDe PoliCy oPtions
Demand-side approaches address the issue of affordability by improving the ability of families to pay for childcare, which should, in theory, lead to the creation of more spaces to meet increased demand.
One immediate option is for governments to subsidize the cost of fees, and in essence share the costs with parents of providing care. Subsidization costs would hinge on the share parents are asked to pay and the quality of care. It would also depend on whether or not subsidies are targeted based on income. Introducing means-tested fees — where low-income families pay low or no fees and fees rise as a family’s income does (as recently implemented by Quebec) — would ensure access for more vulnerable families while also reducing overall public expenditures compared to a completely universal, government-funded program.
Other options include the expansion (and potential consolidation for administrative simplicity) of existing benefits and tax deductions for families. For example, the Canada Child Tax Benefit — a targeted, monthly benefit, which may also include the National Child Benefit Supplement for low-income families as well as corresponding provincial benefits — could be increased to help address financial burdens, such as childcare, for low and middle-income families.76 Given that the cost of childcare in some places in Canada is as much as rent, any increase in the National Child Benefit system would have to be substantial to effectively reduce financial barriers to care.
The same is also true for the Universal Child Care Benefit, which, while beneficial to families, is in no way tied to the cost of childcare services and has been shown to encourage women to work less, rather than more.77 The program
74 Employment and Social Development Canada. Just the Facts. Accessed online at: http://www.esdc.gc.ca/eng/about/facts.shtml. 75 Funding for the Community Child Care Investment Program was redirected to the provinces in 2007 due to lack of uptake. Julie Cool. 2007. Child Care in Canada: The Federal Role. Library of Parliament. 76 Canada Revenue Agency. 2013. Canada Child Benefits: Including related federal, provincial, and territorial
programs for the period from July 2013 to June 2014. 77 Schirle, 2013.

18
Gr
ow
inG
pa
ins
: c
hil
dc
ar
e i
n c
an
ad
a
is not targeted (and often will benefit families with no out-of-pocket childcare expenses) and recent enhancements mean it will cost $4.4 billion in 2015-16 to provide a $1,920 annual benefit for each child under age six and $720 for children aged six to seventeen.
Even without further reduction from taxes and other benefit clawbacks, the UCCB does not come close to covering a significant share of childcare costs for many families.78 According to the Parliamentary Budget Office, the majority of the benefits (51 per cent) of the 2015 UCCB and Child Care Expense Deduction enhancements will go to families with no child care expenses (e.g., those who receive subsidies or have a family member caring for children). Furthermore, as the UCCB is not indexed to keep pace with childcare expenses, households will continue to face cost pressures.79 Indexation would go some ways to stemming those pressures.
Another approach would be to further increase the Child Care Expense Deduction, which currently stands at $8,000 per year, an amount that still only covers a portion of actual expenses across much of Canada. Taxing costs (childcare fees) associated with entering the labour market goes against tax system neutrality and biases decisions against work.80 Making the full cost of childcare deductible from taxable earnings would be a simple way of lessening financial pressures on families. Consideration could also be given to recognizing the unpaid provision of childcare by extended family members, whether through tax deductions or a more targeted cash benefit.
Another option would be to modify provincial employment standards to allow flexible work arrangements for parents to better enable them to juggle the hectic balance of work and family responsibilities. In the Netherlands, France and Sweden, parents have the right to work part-time, and in the UK, parents of young children have some rights to flexible working hours.81 Some municipalities in Sweden also fund night nurseries to allow parents to work late-night shifts.82
Moreover, Canada could explore broadening maternity and parental leave provisions — both in terms of duration and benefits. Current maternity leave provisions in Canada grant paid leave for 15 of 17 to 18 weeks (depending on the province), while replacing only 55 per cent of earnings (up to a maximum
78 Department of Finance Canada. 2014. Backgrounder: Helping families prosper. Accessed online at: http://www.fin.gc.ca/n14/data/14-155_1-eng.asp. 79 Office of the Parliamentary Budget Officer. 2015. How much does the federal government spend on child
care and who benefits? Accessed online at: http://www.pbo-dpb.gc.ca/files/files/Child_Care_EN.pdf. 80 Gordon Cleveland and Michael Krashinsky. 1998. The benefits and costs of good childcare. Childcare Resource and Research Unit. Accessed online at: http://www.childcarecanada.org/sites/default/files/bc.pdf. 81 PEPSO. 2014. Working Paper 14: How to provide more appropriate childcare. 82 Linkopings Kommun. 2014. Welcome to childcare in Linkoping Municipality. Accessed online at: http://www.linkoping.se/Global/Skola%20och%20barnomsorg/Gemensamt/Policyer%20och%20riktlinjer/guidelines.pdf.
19
re
ne
win
g c
an
ad
a’s
so
cia
l a
rc
hit
ec
tu
re
insurable earnings of $49,500). Of 35 industrialized countries that provide such leave, 18 provide at least 67 per cent income replacement.83 This puts Canada out of step with the International Labour Organization’s Convention on Maternity Protection, which states that women should receive two-thirds income replacement when on leave.84
Amending Employment Insurance provisions to allow parents the flexibility to take care of their children, while maintaining two-thirds of their salary for the first 18 months of a child’s life, would mitigate the higher costs of care for infants and provide other benefits in terms of social bonds and familial ties with their children. Sweden’s generous policies in this regard provide a good model for consideration.
83 Laura Addati, Naomi Cassirer and Katherine Gilchrist. 2014. Maternity and paternity at work: law and practice across the world. International Labour Organization. Accessed online at: https://timedotcom.files.wordpress.com/2014/08/wcms_242615.pdf. 84 International Labour Organization. 2000. C183 Maternity Protection Convention. Accessed online at: http://www.ilo.org/global/standards/subjects-covered-by-international-labour-standards/maternity-protection/lang--en/index.htm.

20
Gr
ow
inG
pa
ins
: c
hil
dc
ar
e i
n c
an
ad
a
ConClusion
Canadian families live in a dramatically different world than they did a generation ago. The post-war model of a stay-at-home mother who took care of the children while the family relied on the father’s stable, steady income does not match today’s reality. Our new reality, of families requiring two paycheques to take them as far as one used to and more single-parent households, has far-ranging implications across a range of policy areas, childcare foremost among them.
Childcare is a challenge for governments, as it is not a one-size fits all policy realm. Families have their own specific needs and desires, shaped by their income, the hours they work and the division of responsibilities amongst family members. Some families can lean on relatives to help out with childcare or hire a caregiver to come to their home, while others need to turn to out-of-home regulated or non-regulated options. As children enter the school system, the need for before and after-school care remains a challenge for many families for several more years. Designing policies and programs that are flexible enough to respond to varying levels and types of need, as well as to family preferences for childcare, is a daunting task.
Improving the affordability and availability of childcare services in Canada is an enormous opportunity to close a significant gap in service. Childcare is an essential support for many families, which allows them to balance work and family responsibilities. Without access to affordable and high-quality care, Canadians are less likely to have children or more likely to incur high levels of debt caring for their children.
Better access to childcare allows more parents, particularly women, to move into the workforce, reduces family and child poverty for at-risk families, increases economic productivity and tax revenues and lowers costs for other social programs (such as social assistance). And when childcare is paired with high-quality early-learning initiatives, it can improve developmental outcomes for children, particularly those from disadvantaged backgrounds.

21
re
ne
win
g c
an
ad
a’s
so
cia
l a
rc
hit
ec
tu
re
For women, access to childcare offers a choice to have both a career and a family. Canadian governments invest heavily in educating and training women but fail to fully capitalize on their human capital. Many women wish to pursue careers or work to ensure the financial stability of their families but the lack of availability of affordable and high-quality childcare in Canada is a barrier to labour market entry and a risk to longer-term earnings and career advancement.
The federal government invests significantly in children through the Canada Social Transfer, the Universal Child Care Benefit, Canada Child Benefit/National Child Benefit, as well as other targeted programs. But our outcomes are poor when compared to our peers in terms of accessibility and affordability of childcare. Recent federal investments in children and families have focused on enhancing cash transfers to families. These benefits are poorly targeted and for most families are unlikely to significantly improve their ability to afford childcare.
These types of demand-side investments also do little to ensure that any new childcare spaces that are created are of high quality. Similar approaches have not been successful internationally. Countries such as Denmark and France that invest in the supply-side (i.e., directly creating spaces) tend to produce better outcomes than countries that spend similar amounts on cash benefits, such as the United Kingdom.85 More flexible and generous parental leave policies would also help close the gap between childcare need and availability.
Though all governments can leverage a range of options to improve access to high-quality and affordable childcare, greater national coordination to ensure improved access would be a smart starting point. Approaches to improving childcare services and affordability require cooperation between all levels of government — federal, provincial/territorial and municipal. These approaches could range from a coordinated set of quality standards, to increasing benefits to families, or to federal-provincial funding agreements for the creation of regulated spaces across the country.
The federal government — which controls a number of the critical levers that shape a family’s ability to access childcare services, such as transfers to the provinces and territories and cash benefits directed to families — is a crucial partner at the table for these discussions and decisions.
Despite regional differences, Canadian parents share similar needs. The inconsistent and inadequate provision of childcare services in Canada requires action. The federal government should work with provincial and municipal governments on developing the best system of care possible in order to position
85 OECD Family Database. 2013. Public spending on family benefits in 2009; OECD. 2009. Doing Better For
Children: Chapter 2: Comparative Child Well-Being Across the OECD.
22
Gr
ow
inG
pa
ins
: c
hil
dc
ar
e i
n c
an
ad
a
Canada as a global leader in childcare, rather than a laggard. Any policies that are pursued should also include metrics that help drive towards childcare that is more accessible, affordable and of higher quality.
A strategic, coordinated plan that focuses on closing the childcare gap through investment in, and implementation of, evidence-based approaches will deliver better results for children and their families across the country.

Renewing Canada’s Social Architecture is a collaborative project involving researchers from the Mowat Centre, the Caledon Institute for Social Policy, the Institute for Competitiveness and Prosperity and the Institute for Research on Public Policy. The purpose of the project is to advance public dialogue on our social architecture, and highlight areas where our core social programs and policies require modernization to meet Canadians’ needs. Each report contributed to the project is the responsibility of the authors alone, and does not necessarily reflect the views of the other contributors or organizations.
RENEWING CANADA’SSOCIAL ARCHITECTURE
GrowinG PainsreSearch #8 | ©2015 iSbn 978-1-77259-005-0
Social-architecture.ca
416.978.7858
439 univerSity avenue, Suite 2200,
toronto, on m5g 1y8 canada
@moWatcentre
childcare in canada