Growing Fuel, Fuelling Growth
46
Growing Fuel, Fuelling Growth Prof Diane Hildebrandt Director of MaPS Research Unit University of South Africa
Transcript of Growing Fuel, Fuelling Growth

Growing Fuel, Fuelling Growth
Prof Diane HildebrandtDirector of MaPS Research Unit University of South Africa
Introduction to UNISA• UNISA is over 140 years old• UNISA is a mega University with over
400 000 students• UNISA was a forerunner of long distance
education• began to teach exclusively through
distance learning in 1946.
Introduction to MaPSMaPS stands for the Materials and Process
Synthesis Research UnitWe research in a number of areas:
Reactor design (Attainable Regions)Separation design (Column Profile Maps)Process Design for improved process
efficiencyFischer Tropsch

THE VISION
Our vision is to change the landscape by turning waste and other under-utilised resources into fuel, electricity and jobs
through strategic partnerships.
Our work is particularly aimed at Africa and the Developing World

The potential of waste:Globally it is estimated that we annually produce :
140 billion tons of biomass waste2 billions tons of municipal waste
From this we could produce 100 billions barrels of green synthetic crude oilUsing gasification followed by Fischer Tropsch
The world currently consumes around 34 billion barrels of oil annually.
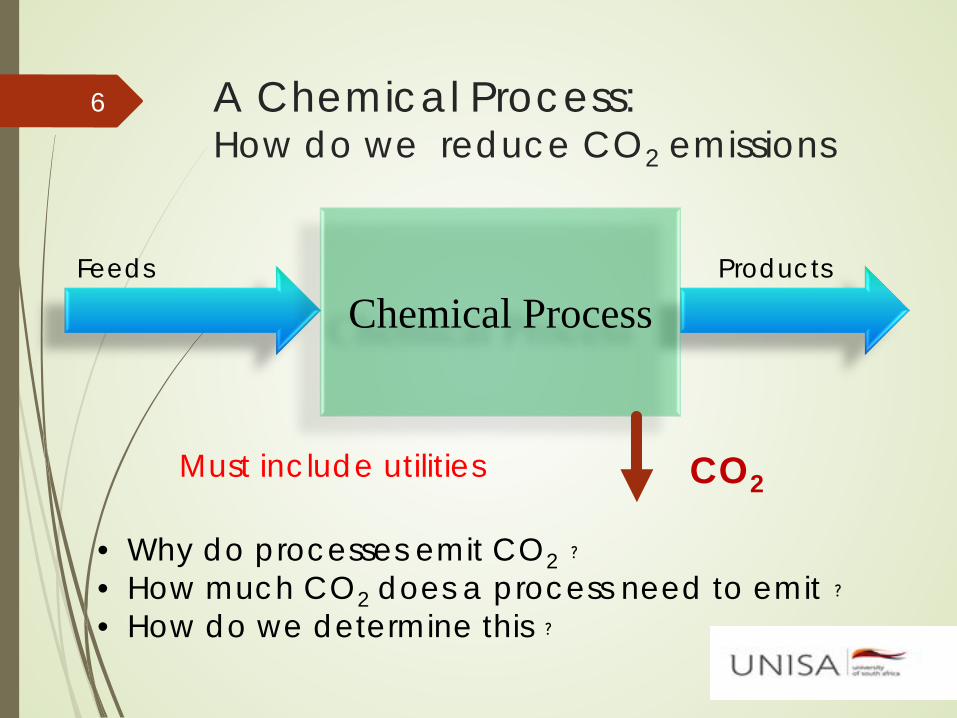
A Chemical Process: How do we reduce CO2 emissions
6
• Why do processes emit CO2﹖• How much CO2 does a process need to emit﹖• How do we determine this﹖
Chemical ProcessFeeds Products
CO2Must include utilities

Process Design: a New Approach
We look at the process macroscopically We identify the process inputs that give rise
to the desired products as well as the by-products also including utilities
Looking at a process macroscopically allows one to determine targets
A target represents the best possible performance for a process
The performance of real processes can be compared to the target to determine opportunities for improvement.
We can compare different processes (options) using their targets
7

Process Design: The Science
There are 3 tools that we use to synthesise and analyse processes: Mass BalanceEnergy Balance Entropy/Work Balance
Each of these tools can be used to determine the target performance of a process
8
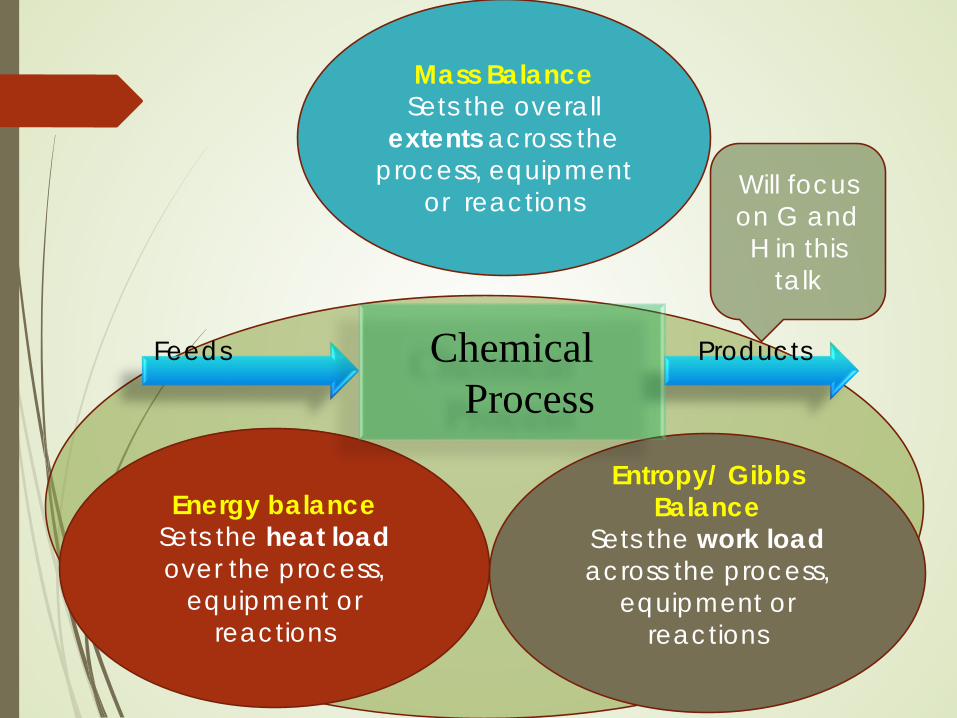
Mass BalanceSets the overall
extents across the process, equipment
or reactions
Energy balanceSets the heat load over the process,
equipment or reactions
Entropy/ Gibbs Balance
Sets the work load across the process,
equipment or reactions
Will focus on G and H in this
talk
Chemical Process
Feeds Products
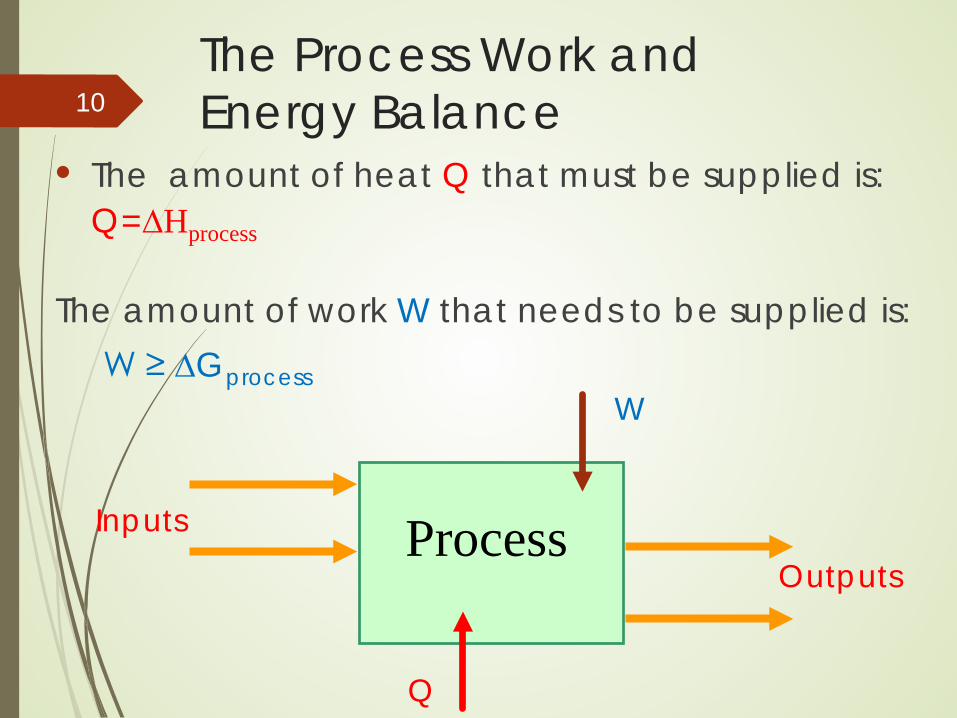
The Process Work and Energy Balance
• The amount of heat Q that must be supplied is: Q=∆Hprocess
The amount of work W that needs to be supplied is:W ≥ ∆Gprocess
10
Inputs
OutputsProcess
Q
W
Result 1A process, equipment or reaction can be represented as a vector on the GH Plot

Example: CTL
3/2C+ H2O = -CH2- +1/2CO2
ΔHprocess = 58 kJ/mol CH2
ΔGprocess = 41 kJ/mol CH2

-100 -80 -60 -40 -20 0 20 40 60 80 100
H [kJ/mol]
-100
-80
-60
-40
-20
0
20
40
60
80
100
G [k
J/m
ol]
149
179
211
249
298
372
509
899
+/--600-211-7404987119149
Work to be added = Δ Gprocess
Heat to be added = Δ Hprocess
• Putting heat in is relatively easy• But how do we put work in?
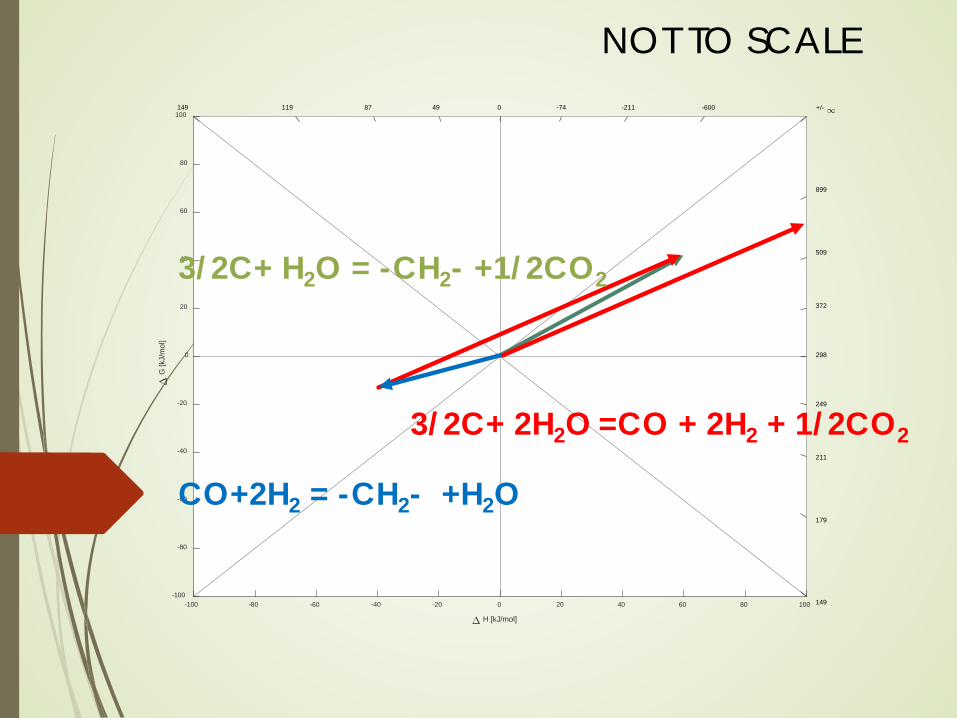
Result 2Sequencing of Processes can be represented by vector operations
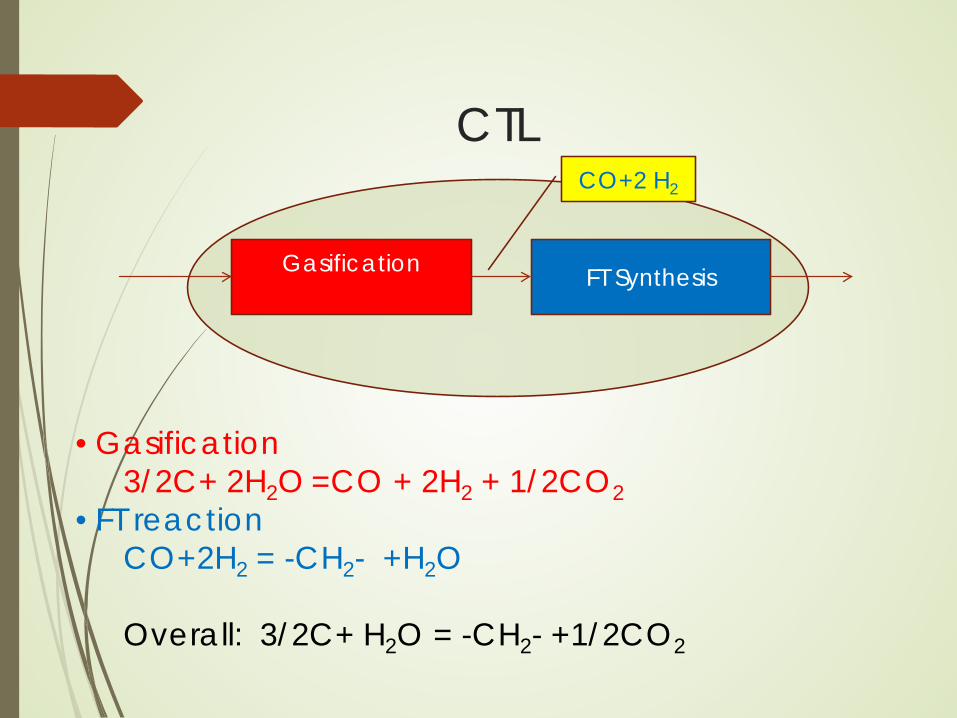
CTL
Gasification FT Synthesis
CO+2 H2
• Gasification 3/2C+ 2H2O =CO + 2H2 + 1/2CO2
• FT reactionCO+2H2 = -CH2- +H2O
Overall: 3/2C+ H2O = -CH2- +1/2CO2
-100 -80 -60 -40 -20 0 20 40 60 80 100
H [kJ/mol]
-100
-80
-60
-40
-20
0
20
40
60
80
100
G [k
J/m
ol]
149
179
211
249
298
372
509
899
+/--600-211-7404987119149
NOT TO SCALE
3/2C+ 2H2O =CO + 2H2 + 1/2CO2
CO+2H2 = -CH2- +H2O
3/2C+ H2O = -CH2- +1/2CO2

Processes to Vectors:
Process 1
Process 2
A B
A
B
1 2Processes in Parallel
Process
Larger Process
Scaling of process
Result 3:The reversible operating temperatures can be deduced from GH plot
How do we add the work to a Process?
The major way we have of supplying work to a process is by setting the temperature of the heat that is added to the process.
Can use P-V work to a lesser extent egmethanol and ammonia processes
For a reversible work addition process, there is a temperature that we call the Carnot temperature TCarnot where:W= ∆Gprocess= ∆Hprocess(1-To/TCarnot)
19

The Process Work Balance At the Carnot temperature TCarnot, the heat carries
the required amount of work into the process
20
∆GprocessWork
required by process
WcarnotVirtual work carried in by
heat
CO2Process
C
H2O CH2
Q
W

-100 -80 -60 -40 -20 0 20 40 60 80 100
H [kJ/mol]
-100
-80
-60
-40
-20
0
20
40
60
80
100
G [k
J/m
ol]
149
179
211
249
298
372
509
899
+/--600-211-7404987119149
Tc = 800 K
Tc = 370 K
All points along this line have the same Tcarnot = 800 K
If heat is added at TCarnot, the process will be reversible
All points along this line have the same Tcarnot = 370 K
Adding or rejecting heat at 370 K will make process lying on this line reversible

Result 4If work cannot be put in by heat at a single suitable temperature, then work can be put into Processes using the process as a heat engine

-100 -80 -60 -40 -20 0 20 40 60 80 100
H [kJ/mol]
-100
-80
-60
-40
-20
0
20
40
60
80
100
G [k
J/m
ol]
149
179
211
249
298
372
509
899
+/--600-211-7404987119149
Heat in at high temperature carries work in with it
Reject heat at low temperature which carries work out with it.
Gasification:1500 K
FT Synthesis:500 K and 30 bar
Not To Scale

Result 5Degree of reversibility can be seen on GH plot

-100 -80 -60 -40 -20 0 20 40 60 80 100
H [kJ/mol]
-100
-80
-60
-40
-20
0
20
40
60
80
100
G [k
J/m
ol]
149
179
211
249
298
372
509
899
+/--600-211-7404987119149
Tc = 800 K
T < Tcarnot
T>Tcarnot
Work deficient
Excess Work Added
• W deficient• Additional W will need to
be added• Compression?
Excess work added lost as irreversibility
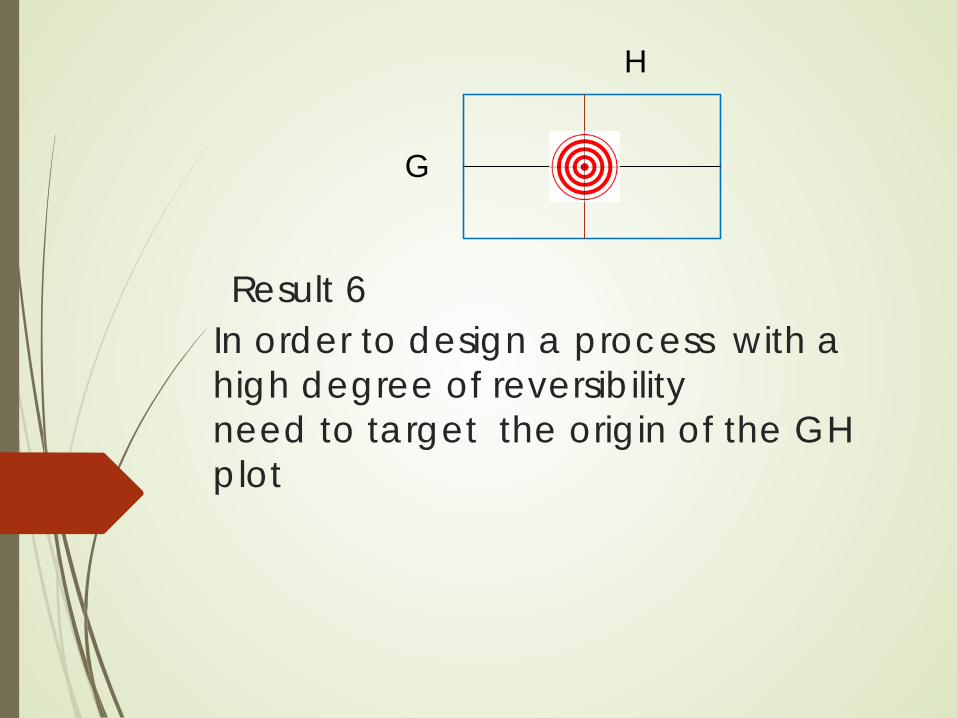
Result 6In order to design a process with a high degree of reversibilityneed to target the origin of the GH plot
G
H
• ExampleSteam Reforming:Wish to produce CO: H2 = 1:2Reduce CO2 emissions
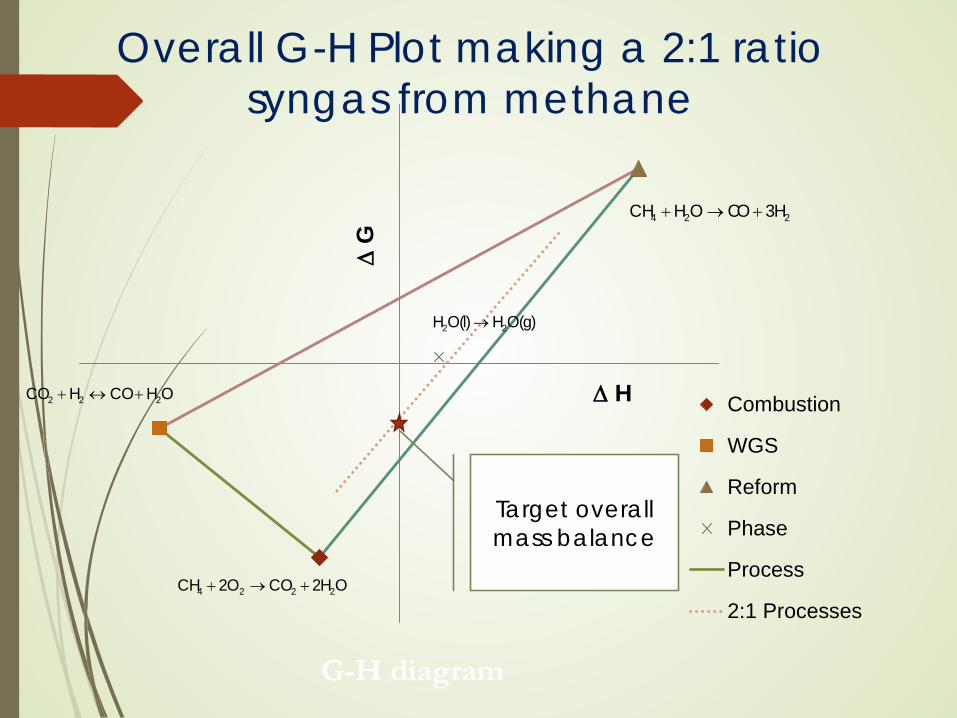
Overall G-H Plot making a 2:1 ratio syngas from methane
∆G
∆ H Combustion
WGS
Reform
Phase
Process
2:1 Processes
G-H diagram
224 H3OCOHCH +→+
OH2COO2CH 2224 +→+
OHCOHCO 222 +↔+
)g(OH)l(OH 22 →
Target overall mass balance

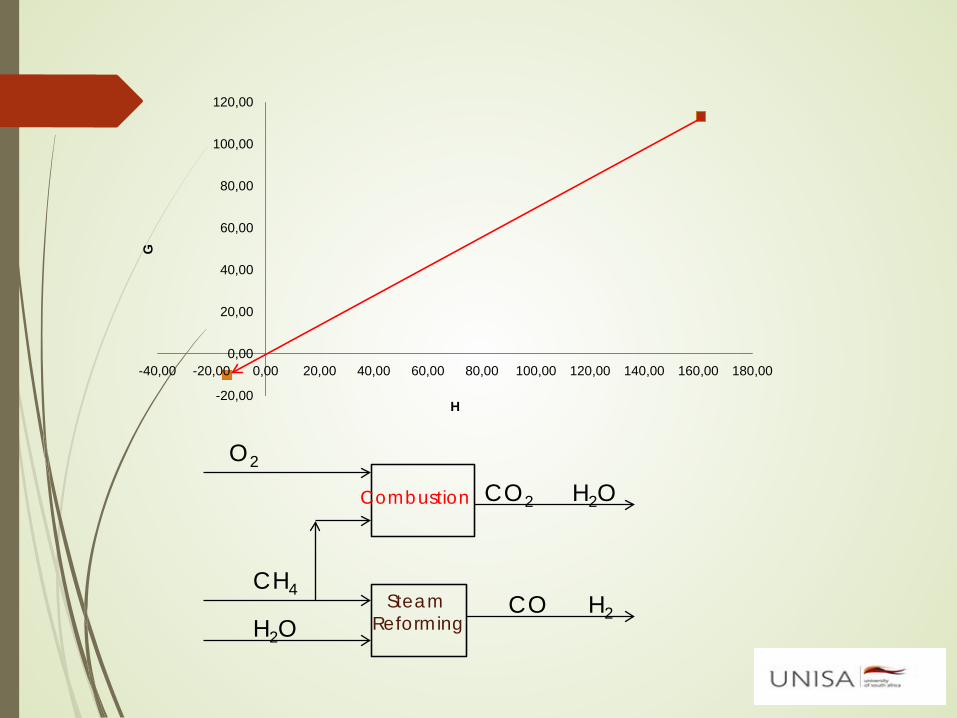
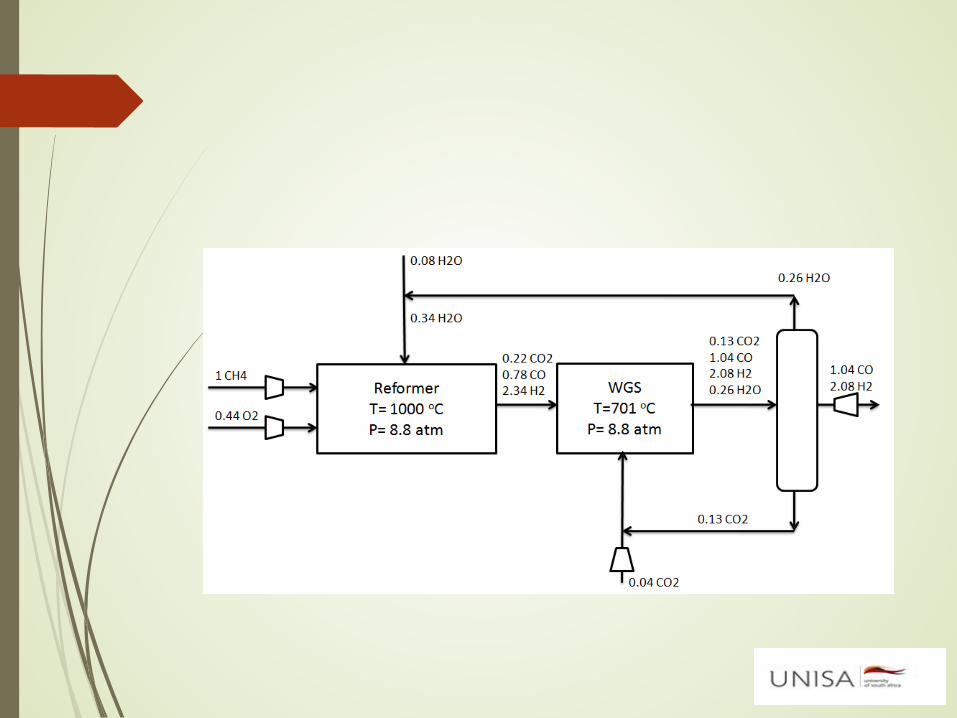
Flow sheet formulation: Steam Reforming
0,00
20,00
40,00
60,00
80,00
100,00
120,00
0,00 50,00 100,00 150,00 200,00
G
H
Reforming
CH4
H2O
CO H2SteamReforming
-20,00
0,00
20,00
40,00
60,00
80,00
100,00
120,00
-40,00 -20,00 0,00 20,00 40,00 60,00 80,00 100,00 120,00 140,00 160,00 180,00
G
H
CH4
H2OCO H2
O2
H2OCO2
SteamReforming
Combustion

-12
-10
-8
-6
-4
-2
0-16 -14 -12 -10 -8 -6 -4 -2 0
G
H
CH4
H2OCO H2
O2
H2OCO2
CO 2H2
H2O
Combustion
SteamReforming
Water Gas Shift

-3
-2,5
-2
-1,5
-1
-0,5
0-4 -3,5 -3 -2,5 -2 -1,5 -1 -0,5 0
G
H
CH4
H2OCO H2
O2
H2OCO2CO 2H2
H2O
CO 2H2
H2OSteam
Reforming
Combustion
Water Gas Shift
Sep
ara
tion

-1,8
-1,6
-1,4
-1,2
-1
-0,8
-0,6
-0,4
-0,2
0-4 -3,5 -3 -2,5 -2 -1,5 -1 -0,5 0
G
H
CH4
H2OCO H2
O2
H2OCO2CO 2H2
H2O
CO 2H2
H2OH2OSteam
Reforming
Combustion
Water Gas Shift
Sep
ara
tion
Phase Change

-0,9
-0,8
-0,7
-0,6
-0,5
-0,4
-0,3
-0,2
-0,1
0-1 -0,5 0 0,5 1
G
H
CH4
H2OCO H2
O2
H2OCO2CO 2H2
H2O
CO2H2
H2OH2OSteam
Reforming
Combustion
Water Gas Shift

Reformer1273K34atm
WGS974K
34atmSep
Meth387K1atm
1.21 CH4
0.42 O2
0.24 H2O
1.42 H2O1CO3H20.21CO2
1.76 H2O
1.76 H2O0.88 CO2
2.66 H21.33 CO
0.88 CO2
1 CO2
0.12 CO2
2.66 H21.33 CO 1.33 CH3OH
Carbon Negative Methanol Production

Waste to Energy:

Waste to Energy38
Chemical ProcessFeeds Products
These could be:• Garbage• Agricultural waste• Crops grown for
energy (bamboo, grasses etc)
• Liquid fuels• Electricity• Heating• Chemicals…
..

Constraints: Waste to Energy39
Chemical Process
• Scale of the plant has to match size of resource
• Capital costs have to match funding resources
• Bigger is not better!
Complexity of the plant has to match the application• Unskilled operators?• Difficulty maintaining
equipment?
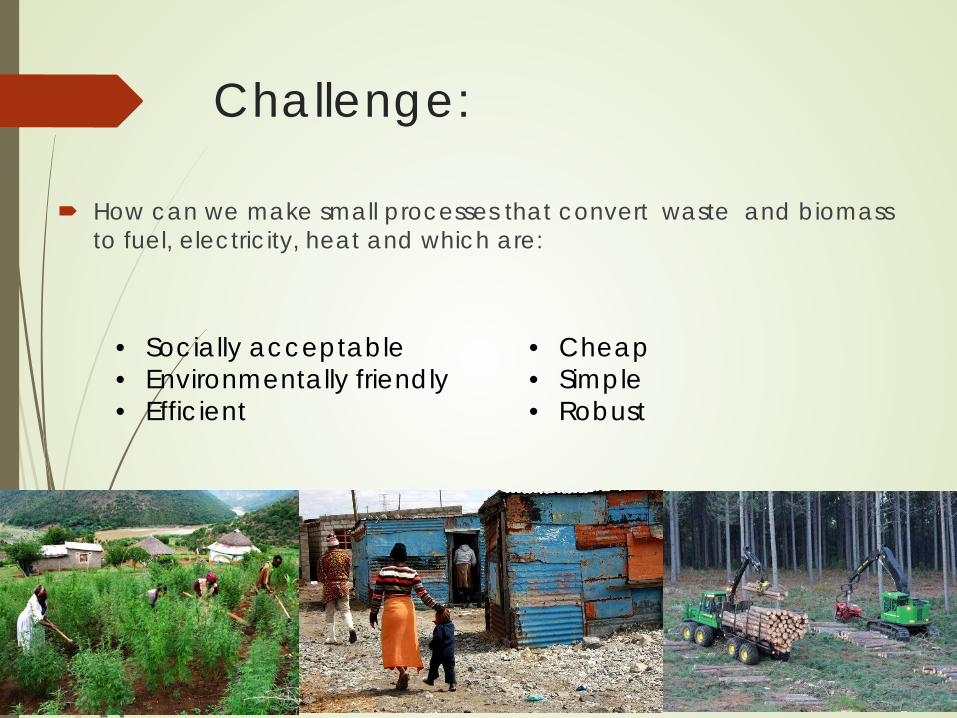
Challenge:
How can we make small processes that convert waste and biomass to fuel, electricity, heat and which are:
• Socially acceptable• Environmentally friendly• Efficient
• Cheap• Simple• Robust
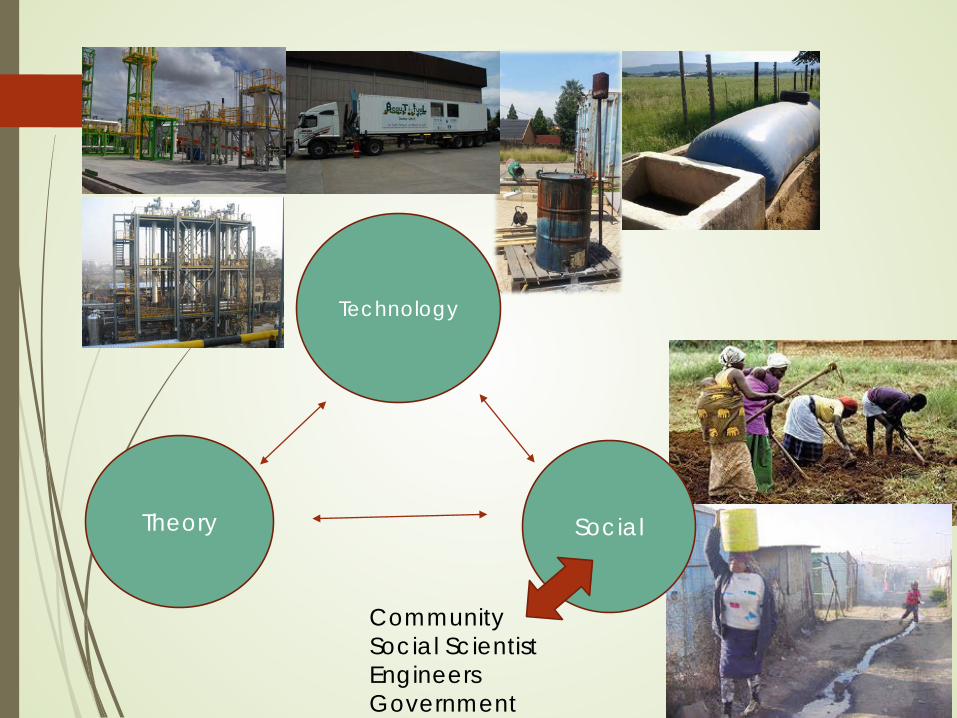
Theory Social
Technology
CommunitySocial ScientistEngineersGovernment
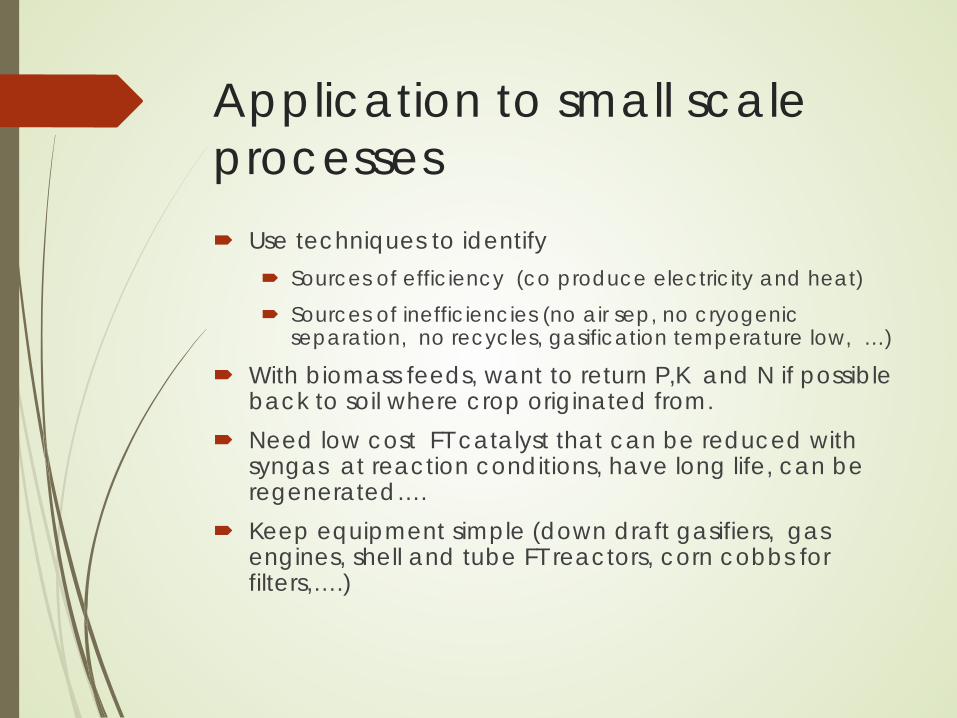
Application to small scale processes Use techniques to identify
Sources of efficiency (co produce electricity and heat) Sources of inefficiencies (no air sep, no cryogenic
separation, no recycles, gasification temperature low, …)
With biomass feeds, want to return P,K and N if possible back to soil where crop originated from.
Need low cost FT catalyst that can be reduced with syngas at reaction conditions, have long life, can be regenerated….
Keep equipment simple (down draft gasifiers, gas engines, shell and tube FT reactors, corn cobbs for filters,….)

Summary
We have shown that we have developed a way to synthesise processes
Lower efficiency effectively means increased carbon dioxide emissions
The method is based on thermodynamics, and in particular G and H
With minimal information about the details of the plant it enables us to synthesise a process and determine targets.
43

Conclusion A process, equipment or reaction can
be represented as a vector in GH space The diagram is 2 dimensional and
remains 2 dimensional no matter how complex the process
Vector maths can be used to synthesize processes
Very powerful yet very simple approach which has the potential to synthesize more efficient processes with reduced GHG emissions
Acknowledgements
Acknowledgements (in no particular order)
David Glasser
James Fox
Celestin Sempuga
All the students and colleagues who have worked on this.

Thank [email protected]