Groups' warmth is a personal matter Understanding ...
12
Contents lists available at ScienceDirect Journal of Experimental Social Psychology journal homepage: www.elsevier.com/locate/jesp Groups' warmth is a personal matter: Understanding consensus on stereotype dimensions reconciles adversarial models of social evaluation ☆,☆☆ Alex Koch a,b,⁎ , Roland Imhoff b,c , Christian Unkelbach b , Gandalf Nicolas d , Susan Fiske d , Julie Terache e , Antonin Carrier f , Vincent Yzerbyt e a University of Chicago Booth School of Business, IL, U.S b University of Cologne, Germany c University of Mainz, Germany d Princeton University, NJ, U.S e Catholic University of Louvain, Belgium f University of Bordeaux, France ABSTRACT As proponents of two theories of social evaluation, we disagree whether people spontaneously differentiate societal groups' conservative-progressive beliefs (distinct claim of the agency-beliefs-communion or ABC model) or warmth/communion (distinct claim of the stereotype content model or SCM). Our adversarial collaboration provides one way to resolve this debate. Examining people from four continents who differentiated groups in their country (N = 2356), we found lower consensus on groups' warmth/communion compared to agency/~competence and beliefs (Studies 1–4). Consensus on groups' warmth/communion was lower because people differed in self-rated agency and beliefs, and they inferred groups' warmth/communion from perceived similarity in agency and beliefs between the groups and the self (Studies 5–8). Previous ABC studies only examined consensual differentiation of groups and thereby did not find evidence for spontaneous differentiation of groups' warmth/communion. Instead, we next examined non-consensual (personal) differentiation of groups: People spontaneously differentiated groups by their agency/~competence, beliefs, and also warmth/communion (Studies 7 and 8). Based on these data, the ABC model and SCM concede that people spontaneously differentiate groups' warmth/communion and beliefs, respectively, providing one way to resolve the models' debate. 1. Introduction People use group stereotypes (Fiske & Neuberg, 1990). According to the stereotype content model (SCM; Fiske, Cuddy, Glick, & Xu, 2002; for reviews, see Fiske, 2018; Yzerbyt, 2016), people predominantly use the stereotype dimensions warmth and competence. The SCM has been challenged recently by research that brought forth agency/socio- economic status (A; related to, but not the same as, competence) and conservative-progressive beliefs (B) as the dimensions people sponta- neously use to stereotype groups when rating their similarity to one another; warmth/communion (C) was not confirmed as a sponta- neously used stereotype dimension (ABC model; Koch et al., 2016). In the spirit of curious-constructive debate, theory-driven cumulative science (Fiedler, 2017), and adversarial collaboration, as proponents of the SCM and ABC model we jointly searched for explanations of this discrepancy. After a talk of the SCM's senior author (Fiske, 2018) at the university at which most ABC model authors taught and conducted research at the time, we began discussing the discrepancy. Further discussion via email substantiated our idea that the key to resolving the discrepancy might be to distinguish between more and less consensual dimensions of group stereotypes. To build trust and at close quarters devise studies and oversee data collection, analysis, and interpretation, the first and junior author of the ABC model (Koch et al., 2016) visited the university and lab of the SCM's senior author. During and after this time, everyone contributed to hypothesizing and designing via email and was kept in the loop. We sought feedback on our interim results and conclusions at several international conferences at which we planned further scientific progress. We present the fruits of our adversarial collaboration here, discussing when and why each model is adequate for understanding how people organize groups along stereotype dimensions (see also Abele, Ellemers, Fiske, Koch, & Yzerbyt, 2020; Ellemers, Fiske, Abele, https://doi.org/10.1016/j.jesp.2020.103995 Received 25 November 2019; Received in revised form 12 April 2020; Accepted 14 April 2020 ☆ This paper has been recommended for acceptance by Jarret Crawford. ☆☆ This research was supported by a University of Cologne Advanced PostDoc Grant to Roland Imhoff. Please address correspondence to Alex Koch (alex.koch@ chicagobooth.edu). ⁎ Corresponding author at: University of Chicago Booth School of Business, IL, U.S. E-mail address: [email protected] (A. Koch). Journal of Experimental Social Psychology 89 (2020) 103995 0022-1031/ © 2020 Elsevier Inc. All rights reserved. T
Transcript of Groups' warmth is a personal matter Understanding ...

Contents lists available at ScienceDirect
Journal of Experimental Social Psychology
journal homepage: www.elsevier.com/locate/jesp
Groups' warmth is a personal matter: Understanding consensus onstereotype dimensions reconciles adversarial models of socialevaluation☆,☆☆
Alex Kocha,b,⁎, Roland Imhoffb,c, Christian Unkelbachb, Gandalf Nicolasd, Susan Fisked,Julie Terachee, Antonin Carrierf, Vincent YzerbyteaUniversity of Chicago Booth School of Business, IL, U.SbUniversity of Cologne, GermanycUniversity of Mainz, Germanyd Princeton University, NJ, U.Se Catholic University of Louvain, BelgiumfUniversity of Bordeaux, France
A B S T R A C T
As proponents of two theories of social evaluation, we disagree whether people spontaneously differentiate societal groups' conservative-progressive beliefs (distinctclaim of the agency-beliefs-communion or ABC model) or warmth/communion (distinct claim of the stereotype content model or SCM). Our adversarial collaborationprovides one way to resolve this debate. Examining people from four continents who differentiated groups in their country (N= 2356), we found lower consensus ongroups' warmth/communion compared to agency/~competence and beliefs (Studies 1–4). Consensus on groups' warmth/communion was lower because peoplediffered in self-rated agency and beliefs, and they inferred groups' warmth/communion from perceived similarity in agency and beliefs between the groups and theself (Studies 5–8). Previous ABC studies only examined consensual differentiation of groups and thereby did not find evidence for spontaneous differentiation ofgroups' warmth/communion. Instead, we next examined non-consensual (personal) differentiation of groups: People spontaneously differentiated groups by theiragency/~competence, beliefs, and also warmth/communion (Studies 7 and 8). Based on these data, the ABC model and SCM concede that people spontaneouslydifferentiate groups' warmth/communion and beliefs, respectively, providing one way to resolve the models' debate.
1. Introduction
People use group stereotypes (Fiske & Neuberg, 1990). According tothe stereotype content model (SCM; Fiske, Cuddy, Glick, & Xu, 2002;for reviews, see Fiske, 2018; Yzerbyt, 2016), people predominantly usethe stereotype dimensions warmth and competence. The SCM has beenchallenged recently by research that brought forth agency/socio-economic status (A; related to, but not the same as, competence) andconservative-progressive beliefs (B) as the dimensions people sponta-neously use to stereotype groups when rating their similarity to oneanother; warmth/communion (C) was not confirmed as a sponta-neously used stereotype dimension (ABC model; Koch et al., 2016). Inthe spirit of curious-constructive debate, theory-driven cumulativescience (Fiedler, 2017), and adversarial collaboration, as proponents ofthe SCM and ABC model we jointly searched for explanations of thisdiscrepancy.
After a talk of the SCM's senior author (Fiske, 2018) at the universityat which most ABC model authors taught and conducted research at thetime, we began discussing the discrepancy. Further discussion via emailsubstantiated our idea that the key to resolving the discrepancy mightbe to distinguish between more and less consensual dimensions ofgroup stereotypes. To build trust and at close quarters devise studiesand oversee data collection, analysis, and interpretation, the first andjunior author of the ABC model (Koch et al., 2016) visited the universityand lab of the SCM's senior author. During and after this time, everyonecontributed to hypothesizing and designing via email and was kept inthe loop. We sought feedback on our interim results and conclusions atseveral international conferences at which we planned further scientificprogress. We present the fruits of our adversarial collaboration here,discussing when and why each model is adequate for understandinghow people organize groups along stereotype dimensions (see alsoAbele, Ellemers, Fiske, Koch, & Yzerbyt, 2020; Ellemers, Fiske, Abele,
https://doi.org/10.1016/j.jesp.2020.103995Received 25 November 2019; Received in revised form 12 April 2020; Accepted 14 April 2020
☆ This paper has been recommended for acceptance by Jarret Crawford.☆☆ This research was supported by a University of Cologne Advanced PostDoc Grant to Roland Imhoff. Please address correspondence to Alex Koch (alex.koch@
chicagobooth.edu).⁎ Corresponding author at: University of Chicago Booth School of Business, IL, U.S.E-mail address: [email protected] (A. Koch).
Journal of Experimental Social Psychology 89 (2020) 103995
0022-1031/ © 2020 Elsevier Inc. All rights reserved.
T

Koch, & Yzerbyt, 2020).
1.1. The stereotype content model (SCM)
The SCM (Fiske et al., 2002) posits that people first differentiategroups on a warmth dimension ranging from harmful/suspected tohelpful/trustworthy. Thus, people stereotype groups as scoring low tohigh on warmth. This dimension appears under various labels withslightly different meanings, such as communion (e.g., Abele &Wojciszke, 2007), morality (e.g., Ellemers, 2017; Wojciszke, 1994),trustworthiness (e.g., Oosterhof & Todorov, 2008; Sutherland et al.,2013), other-profitability (e.g., Peeters, 1992), and social goodness(Rosenberg, Nelson, & Vivekananthan, 1968). Next, people secondarilydifferentiate whether groups are able to act upon their (harmful orhelpful) intentions. Thus, people stereotype groups as scoring low tohigh on competence. This dimension is also known as agency (e.g.,Abele & Wojciszke, 2007), dominance (e.g., Oosterhof & Todorov,2008; Sutherland et al., 2013), self-profitability (Peeters, 1992), andintellectual goodness (Rosenberg et al., 1968).
Several studies show that warmth and competence stereotypesmatter. First, the targets of warmth and competence stereotypes are notjust groups, but also nations (Bergsieker, Leslie, Constantine, & Fiske,2012; Cuddy et al., 2009), animals (Sevillano & Fiske, 2016), and evenbrands (Aaker, Garbinsky, & Vohs, 2012, Kervyn, Fiske, & Malone,2012). Second and more importantly, warmth and competence stereo-types influence a variety of important responses to groups, includingimagined facial appearance (Imhoff, Woelki, Hanke, & Dotsch, 2013),physiological arousal and neurological activity (Harris & Fiske, 2006;van Prooijen, Ellemers, Van Der Lee, & Scheepers, 2018), emotionalstates (admiration, envy, pity, and contempt; Cuddy, Fiske, & Glick,2007), behavioral intentions (approach and support; Becker & Asbrock,2012; Cuddy et al., 2007; Sweetman, Spears, Livingstone, & Manstead,2013), and communication (Kervyn, Bergsieker, & Fiske, 2012;Swencionis & Fiske, 2016). The priority of warmth over competencestereotypes has received support, too. Ratings of groups' warmth com-pared to competence matter more for their global evaluation(Brambilla, Sacchi, Pagliaro, & Ellemers, 2013, Brambilla, Sacchi,Rusconi, Cherubini, & Yzerbyt, 2012, Cottrell, Neuberg, & Li, 2007) andintentions to support their members (Brambilla, Hewstone, & Colucci,2013).
In sum, the SCM showed that people differentiate groups on warmthand competence, that these stereotype dimensions predict theory-driven variables (Abele & Wojciszke, 2014; Paulhus & Trapnell, 2008),and that people seem to prioritize warmth over competence (Fiske,2018). An approach focusing on spontaneous usage of stereotype di-mensions challenged this view, however.
1.2. The agency-beliefs-communion (ABC) model
Recently, Koch et al., 2016 argued that participants in studiestesting the SCM could rate groups on dimensions related to warmth andcompetence only. Thus, these studies did not show that warmth andcompetence are fundamental dimensions in the sense that peoplespontaneously use them to stereotype groups. Koch et al., 2016 argued
for studying spontaneous usage of stereotype dimensions.These authors started by having participants name groups that to-
gether form society, to arrive at an ecologically valid sample (Brunswik,1955, 1956). (The SCM used a similar technique.) Other participantsthen rated the similarity of the most frequently named groups. The logicbehind these similarity ratings is that people must construe similaritywith respect to one or another dimension before they rate it. For ex-ample, people may construe the similarity of doctors and bankers withrespect to warmth, competence, or any other desired dimension. Ifpeople use warmth, they might rate the occupations' similarity as low; ifthey use competence, their might rate their similarity as high. Becausepeople can rate group similarity with respect to any desired dimension(s), similarity ratings provide access to the dimensions people sponta-neously use to stereotype groups.
To extract the dimensions participants had spontaneously used tostereotype the groups, a mean similarity rating was computed for eachgroup pair. These mean similarity ratings were visualized in a statisti-cally well-fitting two-dimensional (2D) space (for a review of multi-dimensional scaling, see Hout, Papesh, and Goldinger, 2013). In thisspace, groups' mean similarity was given by their Euclidean closeness.To identify the two stereotype dimensions that spanned the 2D space,new participants rated the groups on more than twenty candidate di-mensions including warmth and competence. A principal componentanalysis of groups' mean ratings on the candidate dimensions sum-marized these in the three dimensions (see Table 1) agency/socio-economic success (A; ~ competence), conservative-progressive beliefs(B), and communion(C)/warmth.
To test whether agency/~competence, beliefs, and communion/warmth stereotypes spanned the similarity space, a dimension was ro-tated around the center of the space. At every rotation angle, groups'coordinates on the rotated dimension were correlated with the groups'mean ratings in agency. The rotation stopped at the angle at which thegroups' coordinates on the rotated dimension correlated highest withthe groups' mean ratings in agency, and agency was mapped onto thespace where the dimension stopped rotating. Mean beliefs and com-munion were mapped in the same way, an analysis called propertyfitting (e.g., Koch, Kervyn, Kervyn, & Imhoff, 2018; Lammers et al.,2017).
Groups' mean ratings in agency and beliefs but not communioncorrelated almost perfectly with the groups' coordinates on a rotation ofthe dimension. So, agency and beliefs but not communion spanned the2D space (see Fig. 1), suggesting that participants had spontaneouslyused agency and beliefs to rate the similarity of the groups. In the ABCview, agency/~competence and beliefs are thus fundamental stereo-types, whereas communion/warmth is not, apparently contradictingthe SCM (Fiske et al., 2002).
However, there was a substantial correlation between groups'proximity to the center of the space and the groups' mean ratings oncommunion/warmth. Thus, communion emerged as centrality in thespace spanned by agency and beliefs, suggesting that the relation be-tween agency and communion, and between beliefs and communion, iscurvilinear. That is, groups seen as average in agency and beliefs areseen as high in communion, whereas groups seen as extreme in agencyand/or beliefs are seen as low in communion. This 2D ABC model of
Table 1ABC of stereotypes about social groups.
A(agency/socioeconomic success)
B(conservative-progressive beliefs)
C(communion)
Powerless – Powerful Traditional – Modern Untrustworthy – TrustworthyLow status – High status Religious – Science-oriented Dishonest – SincereDominated – Dominant Conventional – Alternative Cold – WarmPoor – Wealthy Conservative – Liberal Threatening – BenevolentUnconfident – Confident Repellent – LikableUnassertive – Assertive Egoistic – Altruistic
A. Koch, et al. Journal of Experimental Social Psychology 89 (2020) 103995
2

fundamental stereotypes generalized across four samples of groups lo-cated in eight spaces computed based on similarity rated in two ways by>4000 participants (Koch et al., 2016; for related models of funda-mental values and traits, see Peabody, 1967, 1985; Peeters, 2008;Schwartz, 1994; Schwartz & Bilsky, 1987). Imhoff and Koch (2017)generalized the curvilinear relation between agency and communionfrom mean ratings for U.S. and German group samples to mean ratingsfor 30+ group samples from 20+ countries (see Durante et al., 2013),and to individual ratings for German groups, persons, and animals.Thus, like the SCM, the ABC model has strong empirical support.
1.3. Explaining the Discrepancy: Warmth/Communion Stereotypes may beLess Consensual
The SCM and ABC model overviews highlight their main dis-crepancy: The SCM's primary warmth/communion dimension is not aspontaneously used dimension according to the ABC model but ratheremerges as centrality (i.e., averageness) in the 2D similarity spacespanned by the two spontaneously used dimensions agency and beliefs.And the ABC model's spontaneous beliefs dimension is not fundamentalaccording the SCM. To probe this discrepancy, our adversarial colla-boration proposes that agency and beliefs stereotypes are more con-sensual, whereas warmth stereotypes are more personal.
First, the ABC model (Koch et al., 2016) examined the U.S. groupslisted most often (i.e., consensually) in response to “[…] what varioustypes of people do you think today's [U.S.] society categorizes intogroups?” Most of these consensual groups can be partially to fully de-fined by low or high agency and/or conservative or progressive beliefs(see Table 2). So, people may use agency and beliefs to consensuallycompose society (i.e., A and B stereotypes are societal). Further, becausethe main purpose of language is shared reality and mutual under-standing, definition entails consensus. Thus, agency and beliefs ste-reotypes may be more consensual because most consensual groups canbe partially to fully defined by their agency and/or beliefs.
Second, consistent with ‘similarity breeds trust/liking’ (Alves, Koch,& Unkelbach, 2017, 2018; Montoya, Horton, & Kirchner, 2008), peoplemay use warmth stereotypes to navigate through society's structure(i.e., agency and beliefs) by stereotyping groups they see as morecompatible with their own identity, values, and goals (i.e., groupsperceived as more similar to the self in agency and beliefs) as warmer.That is, warmth stereotypes may be more relational. If people who differin self-rated agency infer groups' warmth from perceived self-groupsimilarity in agency, people who rate the self as low versus averageversus high in agency should disagree on groups' warmth. And if peoplewho differ in self-rated beliefs and infer groups' warmth from perceivedself-group similarity in beliefs, people who rate the self as conservativeversus moderate versus progressive in beliefs should also disagree ongroups' warmth. This lack of consensus was shown for beliefs andprejudice (Brandt, 2017; Brandt, Reyna, Chambers, Crawford, &Wetherell, 2014; Brandt & Van Tongeren, 2017; Chambers, Schlenker,& Collisson, 2013; Crawford & Brandt, 2019), which is related towarmth. Thus, raters' stereotypes about groups' warmth compared toagency and beliefs may be more personal/less consensual.
Crucially, averaging across participants averages out lack of con-sensus. For example, if rater #1 scores the groups “men” and” women”“0″ and “100″, and if rater #2 scores “men” and “women” “100″ and“0″, both groups' average rating would be the same: 50. If warmthstereotypes are less consensual than agency and beliefs stereotypes, andif an equal number of people spontaneously use agency, beliefs, andwarmth stereotypes to rate groups' similarity, groups' perceived simi-larity averaged across participants would contain less variance in meanperceived warmth compared to mean perceived agency and beliefs. TheABC model's 2D visualization of groups' mean perceived similarity ex-tracted dimensions in the order of high to low variance. Thus, this 2Dspace (see Fig. 1) may be spanned by groups' mean perceived agencyand beliefs and not so much their mean perceived warmth even thoughan equal number of people spontaneously used agency, beliefs, andwarmth stereotypes to rate the groups' similarity in the first place.
Fig. 1. How consensual/mean-level agency (A), beliefs (B), and communion (C) stereotypes mapped onto consensual/mean-level similarity in Koch et al., 2016.
A. Koch, et al. Journal of Experimental Social Psychology 89 (2020) 103995
3

Thus, due to averaging out individual-level variance in groups'perceived warmth, the ABC research so far (Koch et al., 2016) may haveoverlooked warmth as a spontaneously used, fundamental stereotypedimension as claimed by the SCM (Fiske, 2018). Perhaps modeling in-dividual-level variance in groups' perceived similarity based on in-dividual-level variance in groups' perceived agency, beliefs, andwarmth shows evidence for spontaneous usage of all three dimensions.If true, the ABC model and SCM would concede that warmth and beliefscan be spontaneously used stereotype dimensions, respectively. In sum,we propose that one key to reconciling the ABC model and SCM lies indistinguishing between more consensual agency and beliefs stereotypesand less consensual warmth stereotypes.
We are not the first to make this distinction (Ashmore & Del Boca,1979, 1981). The social relations model literature (e.g., Kenny, 1994,2004; Kenny, Albright, Malloy, & Kashy, 1994; Kenny & West, 2011)also distinguishes between more consensual impressions of individuals'personality (e.g., extraversion and openness to experiences) and lessconsensual impressions of individuals' likability. We generalize thedistinction to impressions of groups (for impressions of faces, seeHehman, Sutherland, Flake, & Slepian, 2017; Sutherland, Rhodes,Burton, & Young, 2019), and we show that it reconciles the ABC modelwith the SCM.
1.4. The present research
We claim that impressions of groups' agency/socioeconomic success(A) and conservative-progressive beliefs (B) are more consensual,whereas impressions of groups' warmth/communion (C) are less con-sensual, more personal (Hypothesis #1). Studies 1–4 test the generalityof this effect by examining hundreds of people from four continentswho rated dozens of groups in their country (U.S., Germany, TamilNadu in India, and South Africa). One reason for less consensus ongroups' communion compared to agency and beliefs may be that peoplediffer in self-rated agency and beliefs, and they infer groups' commu-nion from perceived self-group similarity in agency and beliefs(Hypothesis #2, see Studies 5 and 6). As illustrated above, mean ratingsof groups' similarity may overlook that individuals spontaneously usecommunion (vs. agency and beliefs) to rate groups' similarity becauseimpressions of groups' communion (vs. agency and beliefs) are lessconsensual. If this is true, then modeling individual ratings of groups'similarity based on individual ratings of groups' agency, beliefs, andcommunion should reveal that people spontaneously use agency, be-liefs, and communion to rate groups' similarity (Hypothesis #3 tested inStudies 7 and 8). Based on this finding, the ABC model would concedespontaneous usage of warmth/communion, and the SCM would con-cede spontaneous beliefs stereotypes, at least for rating groups' simi-larity. This would provide one way to reconcile the SCM (Fiske, 2018;Fiske et al., 2002) with the ABC model (Koch et al., 2016).
From the set of conducted studies, we omit two studies for reasonsof brevity. These studies were similar to, and confirmed the results of,Studies 3 and 6. For all studies in this article, we obtained ethics ap-proval where required (Study 6; the other studies were conducted inGermany where obtaining ethics approval is neither required nor astandard practice). We did not pre-register the studies. We report allconditions, measures, and exclusions, and all materials, data, code, andresults are available online (https://osf.io/bvpk4/). For all studies inthis article, sample size was determined before any data analysis.
Table 2Most frequently named groups in Studies 1–4.
U.S. (N = 213) Germany (N = 178) Tamil Nadu(N = 148)
South Africa(N = 111)
Blacks (50%) Students (70%) Gounder (65%) Coloureds (50%)Whites (41%) Children (58%) Chettiar (56%) Zulu (45%)Poor (37%) Employed (56%) Iyer (55%) IndianMiddle class
(34%)Unemployed Nadar (53%) Whites (44%)
Rich (33%) Young (47%) Vanniyar (52%) Xhosa (43%)Hispanics (31%) Pupils (46%) Mukkulathor
(48%)Sotho (38%)
Asians (29%) Pensioners (44%) Kallar (41%) Afrikaaners (35%)Democrats Muslims (38%) Mudaliar Venda (30%)Republicans Officials (37%) Vellalar (39%) Blacks (28%)Gays (27%) Workers (36%) Paraiyar (33%) Tswana (24%)Christians (26%) Athletes (34%) Iyengar (30%) Ndebele (21%)Liberals Politicians (33%) Narikurava
(29%)English (20%)
Conservatives Migrants Reddiar (28%) PoorWorking class
(22%)Artists (31%) Vannar Swazi
Transgender(21%)
Middle class Udayar (23%) Christians (19%)
Elderly (20%) Punks (30%) Desigar (20%) RichStudents (19%) Elderly Agamudayar
(20%)Muslims (18%)
Lesbians (17%) Disabled (29%) Konar Tsonga (17%)Women (16%) Rich Badagas (19%) Chinese (15%)Upper class
(15%)Homeless (28%) Adi Dravida
(17%)Asians (14%)
Muslims Christians (27%) Arunthathiyar(16%)
Pedi (13%)
Athletes Foreigners Koravar Middle class(12%)
Parents Religious Brahmin (15%) Young (11%)Nerds (14%) Academics (26%) Irula Politicians (9%)Hippies Homosexuals Pallar GaysImmigrants Musicians Scheduled castes EducatedAtheists (13%) Jews (24%) Iluvar (14%) Africans (8%)Blue collar Trainees Paliyan (14%) BusinesspeopleReligious Parents (23%) Devanga (13%) Uneducated (7%)Men (12%) Vegans (22%) Muslims Hindu (6%)Teenagers Hipsters Sengunthar Working classWhite collar Singles Naidu (12%) ForeignersPoliticians Teachers (21%) Reddy JewsJocks (11%) Atheists Jains (11%)Hipsters Vegetarians (20%) KapuCelebrities Poor TelguguDrug addicts Urban ChristiansHomosexuals
(10%)Doctors Maravar
Homeless Heterosexuals ParavarJews Families PillaiGoths AdultsLower class Drug addicts
Catholics (19%)ConservativesSelf-employed (18%)Welfare recipientsCriminalsLower class (16%)Upper classLeftistsRuralLibertariansEmployersCar drivers (15%)NerdsEducatedBuddhistsHippiesEnvironmentalists
Note. Percentage in parentheses is proportion of participants who sponta-neously named the respective group as part of the respective society. Proportionof participants for groups without percentage in parentheses is equal to the nextgroup with percentage in parentheses shown above the respective group
without percentage in parentheses. To keep number of groups per study/societybetween 30 and 60, the inclusion criterion was stricter in Germany (15%) andmore lax in South Africa (6%) compared to the U.S. (10%) and Tamil Nadu inIndia (10%).
A. Koch, et al. Journal of Experimental Social Psychology 89 (2020) 103995
4

2. Studies 1–4: Groups' communion/warmth is less consensual(more personal) than groups' agency/socioeconomic status andconservative-progressive beliefs
We first report the methods of Studies 1–4, and then report theirresults and discussion. Studies 1–4 examined raters and groups from theU.S., Germany, the state of Tamil Nadu in India, and South Africa, re-spectively. Within each country as well as across countries, we usedlinear mixed models to compare the size of consensual differences be-tween groups' perceived agency/socioeconomic success (A), con-servative-progressive beliefs (B), and communion (C), and to comparethe size of non-consensual differences between groups' perceived agency,beliefs, and communion. In linear mixed models, statistical power de-pends on both participants and stimuli (Judd, Westfall, & Kenny, 2017).Across countries, we sampled > = 200 raters per dimension (i.e., perbetween-subjects condition) and 174 groups, achieving statisticalpower of 1-β = .99 to detect medium-size effects (d = .5) based onnon-overlapping bootstrapped 95% confidence intervals (i.e., withα = .007; Cummings & Finch, 2005). We predicted greater consensualdifferences between groups' agency and beliefs (vs. communion) andgreater non-consensual (personal) differences between groups' com-munion (vs. agency and beliefs). To anticipate our results, the largegaps between the respective 95% confidence intervals (CIs) in Table 3,all ps < = .001, all ds > = .57, show the robustness of these two keyfindings of Studies 1–4.
2.1. Methods
2.1.1. Study 1: Groups and raters from the U.S.We paid 201 U.S. American MTurkers (100 women, 100 men, 1
prefer not to say; M = 37.93 years, SD = 12.93) $1 to “rate 42 groupson a dimension twice.” Raters scored all 42 U.S. groups named by atleast 10% of participants in Study 5 in Koch et al., 2016. Participants'instructions in this earlier study were “Off the top of your head, whatvarious types of people do you think today's society categorizes intogroups?” This instruction was based on Fiske et al. (2002, p. 883), ex-cept that the phrase “based on ethnicity, race, gender, occupation,ability, etc.” was dropped to avoid priming groups. Table 2 shows the
42 groups. Raters used bipolar 0–10 slider scales to score the groupsone atop the other on agency only, beliefs only, or communion only inrandom order. Figs. S1–S3 in the online supplementary materials showthe verbatim rating instructions. The endpoints of the A, B, and C scaleswere as shown in Table 1. After rating the groups on one of the threedimensions, raters scored the groups again in random order on the samedimension. Finally, raters provided demographic information.
2.1.2. Studies 2, 3, and 4: Groups and raters from Germany, India, andSouth Africa
Except for country, the methods of Studies 1–4 were almost thesame (see Text S1).
2.1.3. Quantifying consensual and non-consensual differences betweengroups' perceived agency, beliefs, and communion
We used the R package lme4 (Bates, Maechler, Bolker, & Walker,2015) to predict groups' perceived agency, beliefs, and communion inseparate linear mixed models (Judd, Westfall, & Kenny, 2012;Raudenbush & Bryk, 2002) without fixed effects but with group, rater,and group*rater interaction as random intercepts. As in numerouscontributions of the social relations model (Kenny, 1994; Kenny, 2004;Kenny et al., 1994; Kenny & West, 2011), these models partitioned totalvariance in groups' perceived agency, beliefs, and communion into (1)group variance (i.e., variance of group means obtained by averagingimpressions across raters separately for each group), (2) rater variance(i.e., variance of rater means obtained by averaging impressions acrossgroups separately for each rater), (3) group*rater variance (i.e., var-iance of unique group-rater combination means that is independent ofboth group and rater variance), and (4) error variance (i.e., variance ofthe two assessments around the mean of the respective unique group-rater combination). Each rater assessed each group twice becauseotherwise it would not have been possible to separate group*ratervariance from error variance.
Group variance quantified consensual differences between groups(e.g., across raters, “celebrities” scored higher in A compared to“homeless”). Rater variance (e.g., across groups, rater #1 assignedhigher A scores compared to rater #2) was not relevant for our hy-pothesis. Group*rater variance quantified non-consensual differencesbetween groups (e.g., “academics” compared to “white collar” scoredhigher in A for rater #1, but lower in A for rater #2). Finally, errorvariance (e.g., rater #1's first compared to second A score for “celeb-rities” was higher) was not relevant for our hypothesis. Across andwithin countries, we compared between dimensions the relative size oftwo of these variance components, namely group σ2 and group*rater σ2
(for the utility of this variance partitioning approach to understandingface perception, see Hehman et al., 2017; Hönekopp, 2006; Xie, Flake,& Hehman, 2020). Our central predictions were greater consensual(agreed-upon) differences between groups' agency and beliefs com-pared to communion (see group σ2 in Table 3), and greater non-con-sensual (disagreed-upon, i.e., personal) differences between groups'communion compared to agency and beliefs (see group*rater σ2 inTable 3).
2.2. Results
We bootstrapped 95% CIs around the variances indicating con-sensual differences between groups (group σ2), non-consensus on so-ciety as a whole and/or scale usage (rater σ2), non-consensus on dif-ferences between groups (group*rater σ2), and inconsistency in scoringgroups (error σ2; for code and instructions, see Xie et al., 2020). Forbrevity, Table 3 only shows (95% CIs around) group variance andgroup*rater variance (the other two σ2s were irrelevant for our hy-potheses; see Table S1 for comparing all non-error σ2s).
For brevity and rigor, we interpreted non-overlapping 95% CIs (i.e.,p < .007; Cummings & Finch, 2005) as a statistically meaningful dif-ference. Across countries and within most countries, samples confirmed
Table 3Greater consensual differences between groups' perceived agency and beliefs,greater non-consensual (personal) differences between groups' communion.
Group σ2
(in % of total σ2)Group*rater σ2
(in % of total σ2)
Study 1 (U.S.; N = 201)Agency 0.55 [0.45, 0.67] 0.28 [0.21, 0.34]Beliefs 0.46 [0.36, 0.57] 0.38 [0.30, 0.45]Communion 0.16 [0.10, 0.23] 0.47 [0.41, 0.53]
Study 2 (Germany; N = 142)Agency 0.55 [0.46, 0.65] 0.31 [0.24, 0.37]Beliefs 0.54 [0.45, 0.64] 0.26 [0.20, 0.31]Communion 0.17 [0.12, 0.23] 0.42 [0.37, 0.47]
Study 3 (Tamil Nadu; N = 180)Agency 0.36 [0.26, 0.47] 0.37 [0.30, 0.43]Beliefs 0.13 [0.07, 0.20] 0.43 [0.36, 0.50]Communion 0.06 [0.03, 0.09] 0.55 [0.49, 0.61]
Study 4 (South Africa; N = 192)Agency 0.30 [0.20, 0.42] 0.35 [0.29, 0.41]Beliefs 0.31 [0.21, 0.42] 0.35 [0.28, 0.41]Communion 0.10 [0.05, 0.15] 0.48 [0.42, 0.53]
Across countriesAgency 0.45 [0.40, 0.51] 0.32 [0.28, 0.35]Beliefs 0.37 [0.32, 0.43] 0.36 [0.33, 0.39]Communion 0.12 [0.10, 0.15] 0.48 [0.45, 0.51]
Note. 95% CIs in brackets. We predicted bold values to turn out as higher withincontext (i.e., U.S., Germany, Tamil Nadu, South Africa, and across countries)and variance component (i.e., relative group σ2 and relative group*rater σ2).
A. Koch, et al. Journal of Experimental Social Psychology 89 (2020) 103995
5
greater consensual differences between groups' agency and beliefscompared to communion (compare 95% CIs around group σ2 inTable 3), as well as greater non-consensual differences between groups'communion compared to agency and beliefs (compare 95% CIs aroundgroup*rater σ2 in Table 3).
2.3. Discussion
Studies 1–4 examined raters around the world (from the U.S.,Germany, Tamil Nadu in India, and South Africa) who stereotypedentirely different groups (e.g., Blacks, Whites, employed, punks,Gounder, Chettiar, Coloureds, and Zulu, see Table 2). Consistent withthe social relations model literature (Kenny, 1994; Kenny, 2004), thestudies' key findings are that agency and beliefs (vs. communion) aremore consensual stereotype dimensions, whereas communion (vs.agency and beliefs) is a more personal, less consensual stereotype di-mension.
3. Study 5: Groups' communion/warmth may be less consensual(more personal) because people infer it from perceived self-groupsimilarity in agency and beliefs
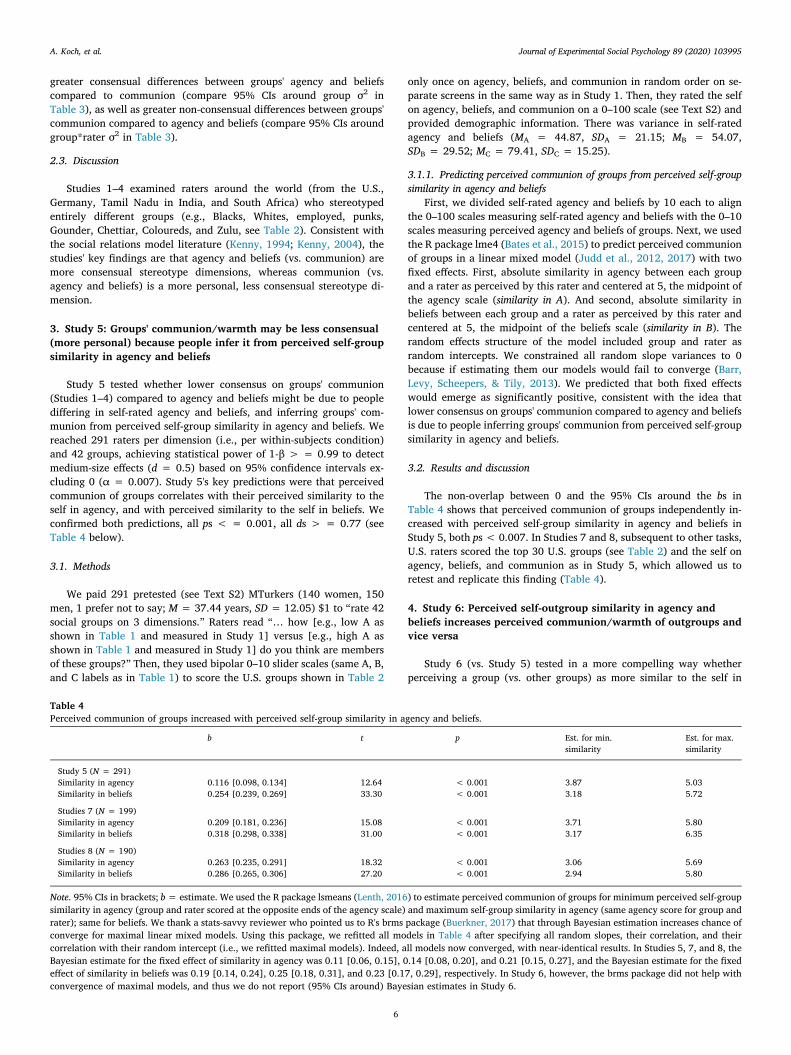
Study 5 tested whether lower consensus on groups' communion(Studies 1–4) compared to agency and beliefs might be due to peoplediffering in self-rated agency and beliefs, and inferring groups' com-munion from perceived self-group similarity in agency and beliefs. Wereached 291 raters per dimension (i.e., per within-subjects condition)and 42 groups, achieving statistical power of 1-β > = 0.99 to detectmedium-size effects (d = 0.5) based on 95% confidence intervals ex-cluding 0 (α = 0.007). Study 5's key predictions were that perceivedcommunion of groups correlates with their perceived similarity to theself in agency, and with perceived similarity to the self in beliefs. Weconfirmed both predictions, all ps < = 0.001, all ds > = 0.77 (seeTable 4 below).
3.1. Methods
We paid 291 pretested (see Text S2) MTurkers (140 women, 150men, 1 prefer not to say; M = 37.44 years, SD = 12.05) $1 to “rate 42social groups on 3 dimensions.” Raters read “… how [e.g., low A asshown in Table 1 and measured in Study 1] versus [e.g., high A asshown in Table 1 and measured in Study 1] do you think are membersof these groups?” Then, they used bipolar 0–10 slider scales (same A, B,and C labels as in Table 1) to score the U.S. groups shown in Table 2
only once on agency, beliefs, and communion in random order on se-parate screens in the same way as in Study 1. Then, they rated the selfon agency, beliefs, and communion on a 0–100 scale (see Text S2) andprovided demographic information. There was variance in self-ratedagency and beliefs (MA = 44.87, SDA = 21.15; MB = 54.07,SDB = 29.52; MC = 79.41, SDC = 15.25).
3.1.1. Predicting perceived communion of groups from perceived self-groupsimilarity in agency and beliefs
First, we divided self-rated agency and beliefs by 10 each to alignthe 0–100 scales measuring self-rated agency and beliefs with the 0–10scales measuring perceived agency and beliefs of groups. Next, we usedthe R package lme4 (Bates et al., 2015) to predict perceived communionof groups in a linear mixed model (Judd et al., 2012, 2017) with twofixed effects. First, absolute similarity in agency between each groupand a rater as perceived by this rater and centered at 5, the midpoint ofthe agency scale (similarity in A). And second, absolute similarity inbeliefs between each group and a rater as perceived by this rater andcentered at 5, the midpoint of the beliefs scale (similarity in B). Therandom effects structure of the model included group and rater asrandom intercepts. We constrained all random slope variances to 0because if estimating them our models would fail to converge (Barr,Levy, Scheepers, & Tily, 2013). We predicted that both fixed effectswould emerge as significantly positive, consistent with the idea thatlower consensus on groups' communion compared to agency and beliefsis due to people inferring groups' communion from perceived self-groupsimilarity in agency and beliefs.
3.2. Results and discussion
The non-overlap between 0 and the 95% CIs around the bs inTable 4 shows that perceived communion of groups independently in-creased with perceived self-group similarity in agency and beliefs inStudy 5, both ps < 0.007. In Studies 7 and 8, subsequent to other tasks,U.S. raters scored the top 30 U.S. groups (see Table 2) and the self onagency, beliefs, and communion as in Study 5, which allowed us toretest and replicate this finding (Table 4).
4. Study 6: Perceived self-outgroup similarity in agency andbeliefs increases perceived communion/warmth of outgroups andvice versa
Study 6 (vs. Study 5) tested in a more compelling way whetherperceiving a group (vs. other groups) as more similar to the self in
Table 4Perceived communion of groups increased with perceived self-group similarity in agency and beliefs.
b t p Est. for min.similarity
Est. for max.similarity
Study 5 (N = 291)Similarity in agency 0.116 [0.098, 0.134] 12.64 < 0.001 3.87 5.03Similarity in beliefs 0.254 [0.239, 0.269] 33.30 < 0.001 3.18 5.72
Studies 7 (N = 199)Similarity in agency 0.209 [0.181, 0.236] 15.08 < 0.001 3.71 5.80Similarity in beliefs 0.318 [0.298, 0.338] 31.00 < 0.001 3.17 6.35
Studies 8 (N = 190)Similarity in agency 0.263 [0.235, 0.291] 18.32 < 0.001 3.06 5.69Similarity in beliefs 0.286 [0.265, 0.306] 27.20 < 0.001 2.94 5.80
Note. 95% CIs in brackets; b= estimate. We used the R package lsmeans (Lenth, 2016) to estimate perceived communion of groups for minimum perceived self-groupsimilarity in agency (group and rater scored at the opposite ends of the agency scale) and maximum self-group similarity in agency (same agency score for group andrater); same for beliefs. We thank a stats-savvy reviewer who pointed us to R's brms package (Buerkner, 2017) that through Bayesian estimation increases chance ofconverge for maximal linear mixed models. Using this package, we refitted all models in Table 4 after specifying all random slopes, their correlation, and theircorrelation with their random intercept (i.e., we refitted maximal models). Indeed, all models now converged, with near-identical results. In Studies 5, 7, and 8, theBayesian estimate for the fixed effect of similarity in agency was 0.11 [0.06, 0.15], 0.14 [0.08, 0.20], and 0.21 [0.15, 0.27], and the Bayesian estimate for the fixedeffect of similarity in beliefs was 0.19 [0.14, 0.24], 0.25 [0.18, 0.31], and 0.23 [0.17, 0.29], respectively. In Study 6, however, the brms package did not help withconvergence of maximal models, and thus we do not report (95% CIs around) Bayesian estimates in Study 6.
A. Koch, et al. Journal of Experimental Social Psychology 89 (2020) 103995
6
agency and beliefs causes people to infer that this group is higher incommunion/warmth. Study 5 showed positive correlations betweenperceived self-group similarity in agency and beliefs and perceivedcommunion of groups. Thus, it could be that perceived self-group si-milarity in agency and beliefs does not cause people to infer highercommunion of groups. In this case, perceived self-group similarity inagency and beliefs does not explain the lower consensus on groups'communion we found in Studies 1–4. To provide more compellingevidence that perceived self-group similarity in agency and beliefs ex-plains lower consensus on groups' communion, Study 6 manipulatedperceived self-group similarity in agency and beliefs before measuringperceived communion of groups.
In one condition, people listed one outgroup downright low inagency, another outgroup slightly low in agency, another outgroupslightly high in agency, and another outgroup downright high in agencybefore they rated all four groups and the self on agency. Computingabsolute similarity in agency between each outgroup and rater trans-formed this manipulation of perceived agency of outgroup into a ma-nipulation of perceived self-outgroup similarity in agency. In a secondcondition, people listed one outgroup downright conservative in beliefs,another outgroup slightly conservative in beliefs, another outgroupslightly progressive in beliefs, and another outgroup downright pro-gressive in beliefs before they rated all four outgroup and the self onbeliefs. Computing absolute similarity in beliefs between each outgroupand rater transformed this manipulation of perceived beliefs of out-group into a manipulation of perceived self-outgroup similarity in be-liefs.
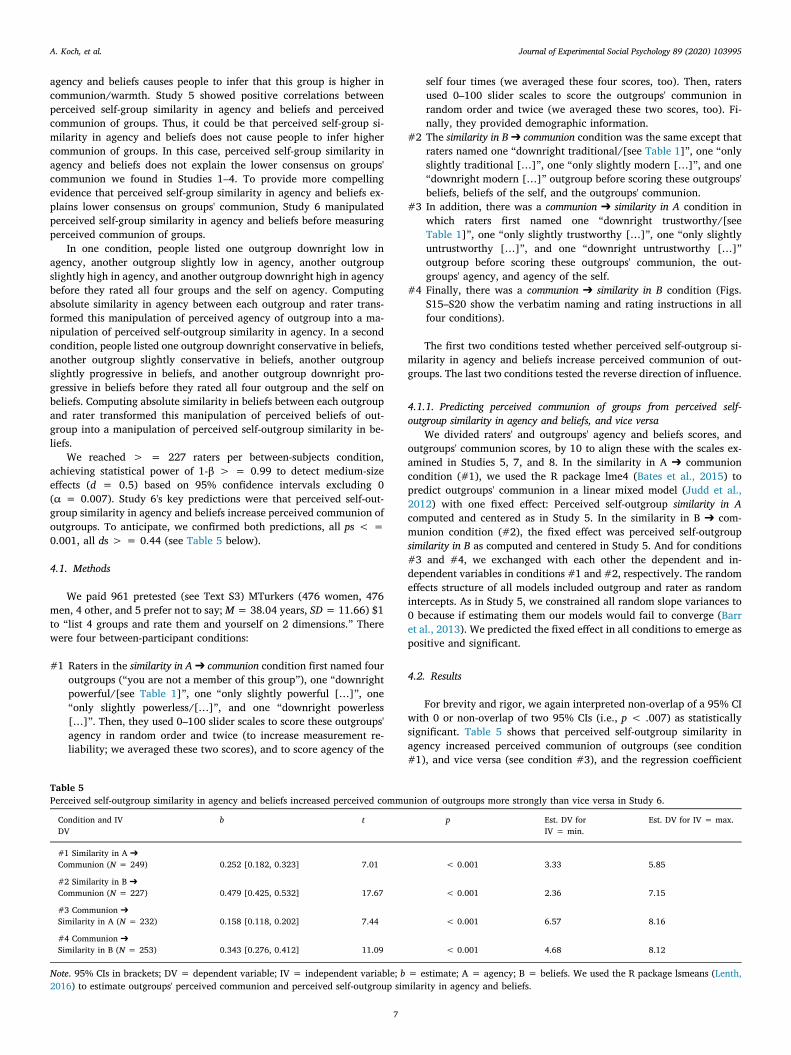
We reached > = 227 raters per between-subjects condition,achieving statistical power of 1-β > = 0.99 to detect medium-sizeeffects (d = 0.5) based on 95% confidence intervals excluding 0(α = 0.007). Study 6's key predictions were that perceived self-out-group similarity in agency and beliefs increase perceived communion ofoutgroups. To anticipate, we confirmed both predictions, all ps < =0.001, all ds > = 0.44 (see Table 5 below).
4.1. Methods
We paid 961 pretested (see Text S3) MTurkers (476 women, 476men, 4 other, and 5 prefer not to say;M= 38.04 years, SD= 11.66) $1to “list 4 groups and rate them and yourself on 2 dimensions.” Therewere four between-participant conditions:
#1 Raters in the similarity in A➔ communion condition first named fouroutgroups (“you are not a member of this group”), one “downrightpowerful/[see Table 1]”, one “only slightly powerful […]”, one“only slightly powerless/[…]”, and one “downright powerless[…]”. Then, they used 0–100 slider scales to score these outgroups'agency in random order and twice (to increase measurement re-liability; we averaged these two scores), and to score agency of the
self four times (we averaged these four scores, too). Then, ratersused 0–100 slider scales to score the outgroups' communion inrandom order and twice (we averaged these two scores, too). Fi-nally, they provided demographic information.
#2 The similarity in B➔ communion condition was the same except thatraters named one “downright traditional/[see Table 1]”, one “onlyslightly traditional […]”, one “only slightly modern […]”, and one“downright modern […]” outgroup before scoring these outgroups'beliefs, beliefs of the self, and the outgroups' communion.
#3 In addition, there was a communion ➔ similarity in A condition inwhich raters first named one “downright trustworthy/[seeTable 1]”, one “only slightly trustworthy […]”, one “only slightlyuntrustworthy […]”, and one “downright untrustworthy […]”outgroup before scoring these outgroups' communion, the out-groups' agency, and agency of the self.
#4 Finally, there was a communion ➔ similarity in B condition (Figs.S15–S20 show the verbatim naming and rating instructions in allfour conditions).
The first two conditions tested whether perceived self-outgroup si-milarity in agency and beliefs increase perceived communion of out-groups. The last two conditions tested the reverse direction of influence.
4.1.1. Predicting perceived communion of groups from perceived self-outgroup similarity in agency and beliefs, and vice versa
We divided raters' and outgroups' agency and beliefs scores, andoutgroups' communion scores, by 10 to align these with the scales ex-amined in Studies 5, 7, and 8. In the similarity in A ➔ communioncondition (#1), we used the R package lme4 (Bates et al., 2015) topredict outgroups' communion in a linear mixed model (Judd et al.,2012) with one fixed effect: Perceived self-outgroup similarity in Acomputed and centered as in Study 5. In the similarity in B ➔ com-munion condition (#2), the fixed effect was perceived self-outgroupsimilarity in B as computed and centered in Study 5. And for conditions#3 and #4, we exchanged with each other the dependent and in-dependent variables in conditions #1 and #2, respectively. The randomeffects structure of all models included outgroup and rater as randomintercepts. As in Study 5, we constrained all random slope variances to0 because if estimating them our models would fail to converge (Barret al., 2013). We predicted the fixed effect in all conditions to emerge aspositive and significant.
4.2. Results
For brevity and rigor, we again interpreted non-overlap of a 95% CIwith 0 or non-overlap of two 95% CIs (i.e., p < .007) as statisticallysignificant. Table 5 shows that perceived self-outgroup similarity inagency increased perceived communion of outgroups (see condition#1), and vice versa (see condition #3), and the regression coefficient
Table 5Perceived self-outgroup similarity in agency and beliefs increased perceived communion of outgroups more strongly than vice versa in Study 6.
Condition and IVDV
b t p Est. DV forIV = min.
Est. DV for IV = max.
#1 Similarity in A ➔Communion (N = 249) 0.252 [0.182, 0.323] 7.01 < 0.001 3.33 5.85
#2 Similarity in B ➔Communion (N = 227) 0.479 [0.425, 0.532] 17.67 < 0.001 2.36 7.15
#3 Communion ➔Similarity in A (N = 232) 0.158 [0.118, 0.202] 7.44 < 0.001 6.57 8.16
#4 Communion ➔Similarity in B (N = 253) 0.343 [0.276, 0.412] 11.09 < 0.001 4.68 8.12
Note. 95% CIs in brackets; DV = dependent variable; IV = independent variable; b = estimate; A = agency; B = beliefs. We used the R package lsmeans (Lenth,2016) to estimate outgroups' perceived communion and perceived self-outgroup similarity in agency and beliefs.
A. Koch, et al. Journal of Experimental Social Psychology 89 (2020) 103995
7

bsimilarity in A ➔ communion was statistically equal in size compared to theregression coefficient bcommunion ➔ similarity in A. So, our manipulation ofperceived self-outgroup similarity in agency increased perceived com-munion of outgroups, and the reverse manipulation had a descriptivelybut not statistically (p = .027) smaller effect. Furthermore, self-out-group similarity in beliefs increased perceived communion of outgroups(see condition #2), and vice versa (see condition #4), and the regres-sion coefficient bsimilarity in B ➔ communion was statistically greater in sizecompared to the regression coefficient bcommunion ➔ similarity in B. That is,our manipulation of self-outgroup similarity in beliefs increased out-groups' perceived communion, and the reverse manipulation had asignificantly (p = .001) smaller effect.
4.3. Discussion
Study 6 showed that perceived self-outgroup similarity in agencyand beliefs increased perceived communion of outgroups. Thus, lowerconsensus on groups' communion compared to agency and beliefs (asshown in Studies 1–4) can indeed be explained in terms of raters in-ferring groups' communion from perceived self-group similarity inagency and beliefs (as suggested in Study 5).
5. Studies 7 and 8: Rediscovering spontaneous usage ofcommunion/warmth stereotypes, reconfirming spontaneous usageof agency and beliefs stereotypes
After establishing and explaining lower consensus on groups'warmth/communion (C) compared to agency/socioeconomic success(A) and conservative-progressive beliefs (B), Studies 7 and 8 aimed toshow that reverse-engineering individual-level (vs. mean-level) ratingsof groups' similarity based on individual-level (vs. mean-level) ratingsof groups' agency, beliefs, and communion provides one way to re-concile the ABC model (Koch et al., 2016) with the SCM (Fiske, 2018;Yzerbyt, 2016).
The SCM (Fiske, 2018) posits that communion is a fundamentalstereotype dimension. In contrast, the ABC model (Koch et al., 2016)posits that people do not spontaneously use communion to rate groups'similarity, and thus communion is not fundamental. In the ABC re-search so far, some raters mapped subjectively more similar groupscloser together on the computer screen, and other raters scored thesegroups' agency, beliefs, and communion. The groups' proximity on themap (i.e., similarity) was averaged across the first set of raters, and thegroups' agency, beliefs, and communion was averaged across the secondset of raters. This averaging retained consensual but deleted non-con-sensual (personal) differences between the groups' similarity, agency,beliefs, and communion. Dimensions that ran through the consensual,mean-level map of the groups' similarity predicted their consensual,mean-level agency and beliefs but not communion. The conclusion was
that the first raters had spontaneously used agency and beliefs but notcommunion to map the groups' similarity, and thus communion is notfundamental. However, evidence for spontaneous usage of communionmight have gotten lost in averaging similarity across raters (see TextS4).
The solution to this problem is to predict groups' agency, beliefs,and communion as scored by individual raters from groups' similarityas mapped by the same individual raters, and only then average evi-dence for spontaneous usage across raters separately for agency, beliefs,and communion. In Study 7 (raters mapping groups' similarity on ablank screen) and Study 8 (raters mapping groups' similarity in a 2Dcoordinate system), we applied both this alternative analysis of aver-aging correlations (i.e., modeling stereotypes at the level of individuals)and the status quo analysis of correlating averages (i.e., modeling ste-reotypes at the level of means) to the same data. For averaging corre-lations (alternative, individual-level analysis), we predicted sponta-neous usage of not just agency and beliefs but also communion. Forcorrelating averages (status quo, mean-level analysis), however, wepredicted spontaneous usage of agency and beliefs only, as has beenshown in the ABC research so far (Koch et al., 2016). These two findingswould reconcile the main discrepancy between the SCM (Fiske, 2018;Fiske et al., 2002) and ABC model if the two models concede that inaddition to agency/~competence, people may spontaneously usecommunion (concession of the ABC model) and beliefs (concession ofthe SCM) stereotypes to organize groups by rating their similarity toone another.
In Studies 7 and 8, 199 and 190 raters mapped 30 groups' similarityand then scored their agency, beliefs, and communion (i.e., 199 and190 per within-subjects condition), respectively, achieving statisticalpower of 1-β > = 0.99 to detect medium-size effects (d = 0.5) withα = 0.007 as in Studies 1–6. Our key predictions were stronger evi-dence for spontaneous usage of communion when modeling stereotypesat the level of individuals rather than means. To anticipate, we con-firmed this prediction in both studies, all ps < = 0.001, all ds > =1.28 (see Table 6 below).
5.1. Methods
5.1.1. Study 7: Group mapping (on a blank screen) and scoring by the sameraters
We paid 199 MTurk workers (85 women, 113 men, 1 prefer not tosay; M = 34.41 years, SD = 10.79) $2 to “sort 30 social groups on thescreen and rate them on 3 dimensions.” On the first slide, people read“[…] Your task is to sort 30 social groups on the computer screen ac-cording to how similar or dissimilar you perceive these groups to be.[…] Please sort the groups as follows: 1) Use the entire screen; 2) placemore similar groups closer together; 3) place more dissimilar groupsfurther apart […, for the verbatim instructions, see Figure S21].” People
Table 6Correlating averages (i.e., consensual/mean-level data) versus averaging correlations (i.e., individual-level data) in Studies 7 (N = 199) and 8 (N = 190).
Correlating averages Averaging correlations
M Koch et al., 2016 Study 7 Study 8 Study 7 Study 8
DimensionR(A dim.) 0.84 0.89 0.97 0.49 [0.46,0.52] 0.59 [0.55,0.63]R(B dim.) 0.88 0.97 0.97 0.54 [0.50,0.57] 0.55 [0.51,0.59]R(C dim.) 0.21 0.59 0.39 0.46 [0.43,0.49] 0.53 [0.49,0.56]r(A cent.) 0.15 −0.21 −0.18 −0.03 [−0.07,0.00] −0.06 [−0.09,-0.02]r(B cent.) 0.09 0.24 0.13 0.03 [−0.01,0.07] 0.01 [−0.03,0.04]r(C cent.) 0.58 0.79 0.75 0.14 [0.10,0.18] 0.12 [0.09,0.16]
Note. 95% CIs in brackets. Bold values indicate that agency, beliefs, or communion were better modeled as a dimension (dim.) or centrality (cent.) in the respective 2Dsimilarity map(s). Correlating averages (i.e., correlating consensual, mean-level similarity with consensual, mean-level A, B, and C), communion was better modeledas centrality, and agency and beliefs were better modeled as a dimension, in Studies 7 and 8 – just as in Koch et al., 2016 ABC research. Averaging correlations (i.e.,averaging correlations of individual-level similarity with individual-level A, B, and C), all three dimensions were better modeled as a dimension in Studies 7 and 8.That is, considering (ignoring) non-consensual differences between groups revealed (missed) spontaneous usage of communion for mapping/rating groups' similarity.
A. Koch, et al. Journal of Experimental Social Psychology 89 (2020) 103995
8

mapped the top 30 U.S. groups shown in Table 2 (for an example of thisefficient spatial arrangement method [SpAM; Koch, Speckmann, &Unkelbach, 2020] to rate similarity, see Figs. S22 and S23; for valida-tions of SpAM, see Hout, Goldinger, & Ferguson, 2013; Koch, Alves,Krüger, & Unkelbach, 2016; for recent applications of SpAM, see Alves,Koch, & Unkelbach, 2016; Koch et al., 2018; Slepian & Koch, 2020).Next, people scored the groups and themselves on agency, beliefs, andcommunion (MA = 41.67, SDA = 20.52; MB = 70.70, SDB = 28.48;MC = 77.14, SDC = 18.09) as described in Study 5. Finally, they pro-vided demographic information.
5.1.2. Study 8: Group mapping (in a coordinate system) and scoring by thesame raters
We paid 190 MTurk workers (82 women, 107 men, 1 prefer not tosay; M = 33.58 years, SD = 9.69) $2 to “sort 30 social groups on thescreen and rate them on 3 dimensions.” On the first slide, people read“[…] Your first task is to rate 30 social groups on two different di-mensions of your choice. Choose the two dimensions that you think aremost relevant for distinguishing the groups. […] To give a group ahigher (lower) rating on the first dimension, move that group further tothe right (left). To give a group a higher (lower) rating on the seconddimension, move that group further up (down) […]”, for the verbatiminstructions, see Fig. S24. To help people map the groups (same as inStudy 7) on the two dimensions seemingly most relevant for distin-guishing them, the screen displayed a coordinate system (i.e., a hor-izontal and a vertical axis; the two axes crossed in the middle of thesorting screen) during the entire task (see Figs. S25 and S26).
After people had finalized the task, the groups could not be movedany further but remained visible in the coordinate system, and we in-structed people to use two text boxes at the bottom of the screen to labelthe two dimensions they had spontaneously chosen to map the groups(see Fig. S27). On the next screen, people categorized the two dimen-sion labels they had just entered as relating to high agency (“powerful”etc.), low agency (“powerless” etc.), progressive beliefs (“modern” etc.),conservative beliefs (“traditional” etc.), high communion (“sincere”etc.), low communion (“dishonest” etc., Table 1 shows all items), ornone of these (see Fig. S28). Next, people scored the 30 groups andthemselves on agency, beliefs, and communion (MA = 46.01,SDA = 19.74;MB = 68.32, SDB = 27.89;MC = 77.53, SDC = 16.53) asin Studies 5 and 6. Finally, they indicated their age and sex.
Taken together, Studies 7 and 8 were the same except that the blankspace in Study 7 left it up to people to use dimensions for spontaneouslymapping the groups, whereas the coordinate system in Study 8prompted people to choose, use, name, and categorize two relevantdimensions. We prompted people to name their dimensions after theyhad chosen and used them. The prompt thus did not influence people'schoice and usage of dimensions. In other words, Study 8 took a moreunforced, non-verbal approach, whereas Study 7 took a more forced,verbal approach to revealing people's spontaneous group stereotypes.We did not expect results to differ between Studies 7 and 8.
5.2. Results
5.2.1. Correlating averages (status quo, mean-level analysis)For each unique pair of groups mapped by each person, we recorded
the Euclidean distance between these two groups as a proportion of thegreatest possible Euclidean distance – the diagonal of the screen. A 0indicated that the two groups had been mapped to the same spot(maximum similarity). A 1 indicated that the two groups had beenmapped to diametrically opposite screen corners (minimum similarity).For each unique pair of groups, we averaged this similarity index acrossall people in the respective study. Next, separately for Studies 7 and 8we visualized groups' consensual, mean-level similarity in a statisticallywell-fitting 2D space (for an introduction to multidimensional scaling,see Hout, Papesh, & Goldinger, 2013; we used the ALSCAL algorithm/version, see Young, Takane, & Lewyckyj, 1978). The closer two groups
were in these spaces, the more similar they had, on average, beenmapped.
We proceeded with searching for the dimensional model that bestdescribed the groups' distribution in the 2D spaces. To this end, weaveraged groups' agency, beliefs, and communion scores across ratersseparately for Studies 7 and 8. Finally, we predicted groups' consensual,mean-level agency, beliefs, and communion from groups' consensual,mean-level similarity (coordinates) in the respective 2D space. Thehigher the multiple correlation (R) returned by this property fittinganalysis (Chang & Carroll, 1969), the better consensual, mean-levelagency, beliefs, or communion mapped onto the respective 2D space asa dimension. Table 6 shows that R(A dim.) and R(B dim.) approximated1 and were substantially higher than R(C dim.) in both studies. Further,consensual, mean-level agency and beliefs mapped onto the 2D spacesas almost orthogonal dimensions (Study 7: 87°, see Fig. S29; Study 8:83°, see Fig. S30). In other words, correlating averages (status quoanalysis) suggested spontaneous usage of agency and beliefs but not somuch communion for mapping groups' similarity exactly as in the ABCresearch so far (see Table 6).
Communion mapped onto Koch et al., 2016 2D spaces as centrality.To generalize this, separately for Studies 7 and 8 we predicted groups'consensual, mean-level agency, beliefs, and communion from centralityin the respective 2D group similarity space. The higher the correlation r([A, B, or C] cent.), the better consensual, mean-level agency, beliefs, orcommunion mapped onto the respective 2D space as centrality. Table 6shows that agency and beliefs each mapped better as a dimensioncompared to centrality, and communion mapped better as centralitycompared to a dimension in both studies. So, correlating averages(status quo, mean-level analysis) suggested that raters had sponta-neously used agency and beliefs but not communion to map groups'similarity. Communion was best understood as centrality (i.e., moder-ateness) in agency and beliefs. Thus, by correlating averages we fullyreplicated Koch et al., 2016 2D ABC model. Next, we reanalyzed thedata from Studies 6 and 7. Now, we considered non-consensual differ-ences between groups by averaging correlations.
5.2.2. Averaging correlations (alternative, individual-level analysis)To take into account non-consensual differences between groups'
similarity, agency, beliefs, and communion, we reran the property fit-ting analyses described above but on the level of individual raters ra-ther than means computed across raters. Specifically, for each in-dividual rater we predicted groups' agency as scored by this rater fromgroups' similarity (coordinates) as mapped by the same rater, and wepredicted groups' beliefs and communion in the same way. That is, wecomputed R(A dim.), R(B dim.), and R(C dim.) separately for each in-dividual rater before averaging any variable. Also, for each individualrater we predicted groups' agency, beliefs, and communion as scored bythis rater from groups' centrality in the same rater's 2D similarity map.That is, we computed r(A cent.), r(B cent.), and r(C cent.) separately foreach individual rater before averaging any variable. Finally, we aver-aged these six indices across raters separately for Studies 7 and 8 to testhow (i.e., as a dimension vs. centrality) and how well individual-leveldifferences between groups' agency, beliefs, and communion predictedgroups' similarity as mapped by the same individual rater.
Despite starting from the same data, the two analyses (status quo,mean-level vs. alternative, individual-level) yielded remarkably dif-ferent results (see Table 6). In both studies, individual-level (vs. con-sensual, mean-level) differences between groups' agency, beliefs, andcommunion predicted individual-level (vs. consensual, mean-level)differences between groups' similarity less well – probably because theindividual-level differences between groups' agency, beliefs, commu-nion, and similarity were noisier (e.g., two variables with a retest re-liability of 0.80 each can correlate no higher than r = 0.80 *0.80 = 0.64.).
More importantly, in both studies the 95% CIs around R(A, B, and Cdim.) ranged substantially higher, and did not overlap with, the 95%
A. Koch, et al. Journal of Experimental Social Psychology 89 (2020) 103995
9

CIs around r(A, B, and C cent.), respectively. That is, individual-levelvariance in perceived agency, beliefs, and also communion of groupsfitted better as a dimension (vs. centrality) onto individual-level var-iance in groups' similarity as mapped by the same individual rater. Also,in Study 7 the 95% CIs around R(A dim.) and R(B dim.), and around R(Adim.) and R(C dim.), overlapped, and the 95% CIs around R(B dim.) andR(C dim.) almost overlapped. In Study 8, the 95% CIs around R(A dim.),R(B dim.), and R(C dim.) all overlapped. In other words, individual-level variance in perceived agency, beliefs, and communion of groupsfitted equally well as a dimension onto individual-level variance ingroups' similarity as mapped by the same individual rater. So, modelingnon-consensual (personal) differences between groups' perceived simi-larity, agency, beliefs, and communion by averaging correlations (al-ternative, individual-level analysis), we found equal support for agency,beliefs, and communion as spontaneously used, fundamental stereotypedimensions in both Study 7 (unforced, non-verbal approach to groupstereotypes) and Study 8 (forced, verbal approach).
In Study 8, raters' categorization of self-generated labels for the twodimensions they had spontaneously used to map groups' similaritycorresponded to individual-level R(A dim.), R(B dim.), and R(C dim.).That is, R(A dim.), R(B dim.), and R(C dim.) was higher for raters whoindicated that they had (vs. had not) spontaneously used agency, be-liefs, and communion to map groups' similarity, respectively (see TextS5). 84.2% of raters indicated that they had spontaneously used at leastone of the dimensions agency, beliefs, and/or communion to mapgroups' similarity (see Table S3), consistent with agency, beliefs, andalso communion as spontaneously used, fundamental stereotype di-mensions.
5.3. Discussion
In sum, focusing on consensual, mean-level differences betweengroups by correlating averages, as in the ABC research so far (Kochet al., 2016), fully replicated the 2D ABC model claiming that agencyand beliefs are spontaneously used, fundamental stereotype dimen-sions, whereas communion is not. Taking into account non-consensual(individual-level) differences between groups, by averaging correla-tions, confirmed the spontaneous usage of all three dimensions, how-ever. Through reconfirming spontaneous usage of agency/~compe-tence and beliefs (concession of the SCM), and by rediscovering (lessconsensual but nevertheless) spontaneous usage of communion/warmth for rating groups' similarity (concession of the ABC model),Studies 7 and 8 provided one way to reconcile the main discrepancybetween the ABC model and the SCM (Fiske, 2018; Yzerbyt, 2016).
6. General discussion
People around the world organize groups along stereotype dimen-sions (Cuddy et al., 2009; Durante et al., 2013) that guide their emo-tions and behavior (Correll, Park, Judd, & Wittenbrink, 2007; Koch,Dorrough, Glöckner, & Imhoff, 2020; Unkelbach, Forgas, & Denson,2008). Identifying the number, meaning, nature, and relation of spon-taneously used stereotype dimensions is a highly relevant researchquestion. We contrasted two models that address these questions. Thestereotype content model (SCM; Fiske, 2018; Yzerbyt, 2016) claims thatwarmth and competence are fundamental stereotype dimensions. TheABC model (Koch et al., 2016; Koch & Imhoff, 2018) instead suggestsagency/socioeconomic success (A; related to, but not the same as,competence) and conservative-progressive beliefs (B) as fundamentalstereotype dimensions. The main discrepancies between the two modelsare the roles of two dimensions: in the SCM, beliefs are not funda-mental, but warmth/communion is; in the ABC model, beliefs werefound, and warmth/communion was not found, to be a spontaneouslyused dimension in the ABC model's similarity-rating task.
Our adversarial collaboration resulted in three hypotheses, whichwere supported here. First, across countries we confirmed higher
consensus on groups' agency/socioeconomic success (A) and con-servative-progressive beliefs (B) compared to warmth/communion (C).Second, lower consensus on groups' communion compared to agencyand beliefs was due to people differing in self-rated agency and beliefs,and inferring groups' communion from self-group similarity in agencyand beliefs. Third, and most importantly, averaging across raters retainsonly consensual differences between groups. Thus, previous ABC stu-dies' (Koch et al., 2016) mean-level analysis (i.e., averaging and thencorrelating) that examined only consensual differences between groupswas biased against communion compared to agency and beliefs.Switching to an individual-level analysis (i.e., correlating and thenaveraging), we confirmed spontaneous usage of agency, beliefs and alsocommunion for rating groups' similarity. That is, statistically taking intoaccount non-consensual (personal) differences between groups showedthat, in addition to agency/~competence, both beliefs and commu-nion/warmth stereotypes are necessary to explain how people sponta-neously organize groups when rating their similarity to one another(Koch et al., 2016). This provided one way to reconcile the main dis-crepancy between the ABC model and the SCM (Fiske, 2018).
6.1. Future directions
If agency and beliefs are societal stereotypes, spontaneous usage ofagency and beliefs should be more pronounced when people's goal is todescribe groups in an impartial and informative way (i.e., the lay so-ciologist perspective). This goal could be active when the groups aremany, when encountering and interacting with them is rather unlikely,or when talking to colleagues and other acquaintances whose self-rat-ings on agency and beliefs (and thus less consensual group ratings oncommunion) are not evident. Tendency for bottom-up and accurateprocessing of social information may also increase spontaneous usage ofagency and beliefs. If communion is a relational stereotype, sponta-neous usage of communion should be more pronounced when people'sgoal is to evaluate groups in a more subjective way (i.e., the lay psy-chologist perspective). This role and goal could be active when thegroups are few, when encountering and interacting with them is likely,or when talking to family and friends whose self-ratings on agency andbeliefs (and thus less consensual group ratings on communion) areknown. Tendency for top-down and speedy processing of social in-formation may also increase spontaneous usage of communion (Nicolaset al., 2020).
For sure, certain situations, motives/needs, and personality traitsshould selectively influence attention to groups' agency, beliefs, orcommunion. People's extremity (vs. averageness) on agency, beliefs,and communion, for example, may selectively increase their sponta-neous usage of agency, beliefs, and communion, respectively.Intelligence, wisdom (Grossmann, 2017), openness to experience,conscientiousness, extraversion, agreeableness, neuroticism (i.e., theBig Five; Soto & John, 2017), narcissism, Machiavellianism, and psy-chopathy (i.e., the Dark Triad; Muris, Merckelbach, Otgaar, & Meijer,2017) may also selectively influence spontaneous usage of agency,beliefs, and communion (e.g., it could be that people higher in Ma-chiavellianism pay more attention to agency and less attention tocommunion). Other moderators might include need for self-protectionand affiliation (should increase attention to communion), status/esteem(agency), mate acquisition, retention, and parenting (beliefs; Kenrick,Griskevicius, Neuberg, & Schaller, 2010), duty and intellect (agency),sociality and mating (beliefs), adversity, positivity, negativity, and de-ception (communion; Rauthmann et al., 2014).
Finally, we measured a rater's spontaneous usage of agency, beliefs,and communion to stereotype groups (when mapping their similarityon the screen) based on agency, beliefs, and communion scores for thegroups by the same rater. Agency, beliefs, and communion explainedwell how the raters mapped the groups' similarity, but this analysismight have overlooked other dimensions for which we did not obtaingroup ratings (e.g., youthfulness, attractiveness, foreignness;
A. Koch, et al. Journal of Experimental Social Psychology 89 (2020) 103995
10

Sutherland, Oldmeadow, & Young, 2016; Zou & Cheryan, 2017). Forexample, several social perception models complement warmth/com-munion (a.k.a. morality) with sociability and, just as the SCM (Fiske,2018), include competence complemented by agency/assertiveness(e.g., Abele et al., 2016; Abele, Ellemers, Fiske, Koch, & Yzerbyt, 2020;Ellemers, 2017; Leach, Ellemers, & Barreto, 2007). Future studies mayexamine the extent to which raters spontaneously use these group ste-reotypes, too, and how they relate to agency, beliefs, and communion.
7. Conclusion
People infer groups' warmth/communion (C) from perceived self-group similarity in agency/socioeconomic success (A) and perceivedself-group similarity in conservative-progressive beliefs (B). Thus,people agree less on groups' communion compared to agency and be-liefs. Further, people spontaneously use agency and beliefs (the di-mension proposed by the ABC model [Koch et al., 2016] but not SCM[Fiske, 2018; Yzerbyt, 2016; Yzerbyt, Kervyn, & Judd, 2008]) in a moreconsensual way, and communion (the dimension proposed by the SCMbut not ABC model) in less consensual ways, to stereotype societalgroups by rating their similarity to one another. This new evidence forthe spontaneous usage of all three dimensions provides one way toreconcile the main discrepancy between the ABC model and SCM.
Appendix A. Supplementary data
Supplementary data to this article can be found online at https://doi.org/10.1016/j.jesp.2020.103995.
References
Aaker, J., Garbinsky, E. N., & Vohs, K. D. (2012). Cultivating admiration in brands:Warmth, competence, and landing in the golden quadrant. Journal of ConsumerPsychology, 22, 191–194.
Abele, A., Ellemers, N., Fiske, S., Koch, A., & Yzerbyt, V. (2020). Navigating the socialworld: Shared horizontal and vertical evaluative dimensions. (Manuscript submitted forpublication).
Abele, A. E., Hauke, N., Peters, K., Louvet, E., Szymkow, A., & Duan, Y. (2016). Facets ofthe fundamental content dimensions: Agency with competence and assertiveness–communion with warmth and morality. Frontiers in Psychology, 7, 1810.
Abele, A. E., & Wojciszke, B. (2007). Agency and communion from the perspective of selfversus others. Journal of Personality and Social Psychology, 93, 751–763.
Abele, A. E., & Wojciszke, B. (2014). Communal and agentic content in social cognition: Adual perspective model. Advances in Experimental Social Psychology, 50, 195–255.
Alves, H., Koch, A., & Unkelbach, C. (2016). My friends are all alike – the relation be-tween liking and perceived similarity in person perception. Journal of ExperimentalSocial Psychology, 62, 103–117.
Alves, H., Koch, A., & Unkelbach, C. (2017). The "common good" phenomenon: Whysimilarities are positive and differences are negative. Journal of ExperimentalPsychology: General, 146, 512–528.
Alves, H., Koch, A., & Unkelbach, C. (2018). A cognitive-ecological explanation of in-tergroup biases. Psychological Science, 29, 1126–1133.
Ashmore, R. D., & Del Boca, F. K. (1979). Sex stereotypes and implicit personality theory:Toward a cognitive-social psychological conceptualization. Sex Roles, 5, 219–248.
Ashmore, R. D., & Del Boca, F. K. (1981). Conceptual approaches to stereotypes andstereotyping. In D. L. Hamilton (Ed.). Cognitive processing in stereotyping and intergroupbehavior (pp. 1 35). Hillsdale, NJ: Lawrence-Erlbaum.
Barr, D. J., Levy, R., Scheepers, C., & Tily, H. J. (2013). Random effects structure forconfirmatory hypothesis testing: Keep it maximal. Journal of Memory and Language,68, 255–278.
Bates, D., Maechler, M., Bolker, B., & Walker, S. (2015). lme4: Linear mixed-effects modelsusing Eigen and S4. R package version 1.1–7. 2015.
Becker, J. C., & Asbrock, F. (2012). What triggers helping versus harming of ambivalentgroups? Effects of the relative salience of warmth versus competence. Journal ofExperimental Social Psychology, 48, 19–27.
Bergsieker, H. B., Leslie, L. M., Constantine, V. S., & Fiske, S. T. (2012). Stereotyping byomission: Eliminate the negative, accentuate the positive. Journal of Personality andSocial Psychology, 102, 1214–1238.
Brambilla, M., Hewstone, M., & Colucci, F. P. (2013). Enhancing moral virtues: Increasedperceived outgroup morality as a mediator of intergroup contact effects. GroupProcesses & Intergroup Relations, 16, 648–657.
Brambilla, M., Sacchi, S., Pagliaro, S., & Ellemers, N. (2013). Morality and intergrouprelations: Threats to safety and group image predict the desire to interact with out-group and ingroup members. Journal of Experimental Social Psychology, 49, 811–821.
Brambilla, M., Sacchi, S., Rusconi, P., Cherubini, P., & Yzerbyt, V. Y. (2012). You want togive a good impression? Be honest! Moral traits dominate group impression
formation. British Journal of Social Psychology, 51, 149–166.Brandt, M. J. (2017). Predicting ideological prejudice. Psychological Science, 28, 713–722.Brandt, M. J., Reyna, C., Chambers, J. R., Crawford, J. T., & Wetherell, G. (2014). The
Ideological-Conflict Hypothesis: Intolerance Among Both Liberals and Conservatives.Current Directions in Psychological Science, 23, 27–34.
Brandt, M. J., & Van Tongeren, D. R. (2017). People both high and low on religiousfundamentalism are prejudiced toward dissimilar groups. Journal of Personality andSocial Psychology, 112, 76–97.
Brunswik, E. (1955). Representative design and probabilistic theory in a functional psy-chology. Psychological Review, 62, 193–217.
Brunswik, E. (1956). Perception and the representative design of psychological experiments.Berkeley: University of California Press.
Bürkner, P. C. (2017). brms: An R package for Bayesian multilevel models using Stan.Journal of Statistical Software, 80, 1–28.
Chambers, J. R., Schlenker, B. R., & Collisson, B. (2013). Ideology and prejudice: The roleof value conflicts. Psychological Science, 24, 140–149.
Chang, J. J., & Carroll, J. D. (1969). How to use PROFIT, a computer program for propertyfitting by optimizing nonlinear or linear correlation. Murray Hill, NJ: Bell TelephoneLaboratories.
Correll, J., Park, B., Judd, C. M., & Wittenbrink, B. (2007). The influence of stereotypes ondecisions to shoot. European Journal of Social Psychology, 37, 1102–1117.
Cottrell, C. A., Neuberg, S. L., & Li, N. P. (2007). What do people desire in others? Asociofunctional perspective on the importance of different valued characteristics.Journal of Personality and Social Psychology, 92, 208–231.
Crawford, J. T., & Brandt, M. J. (2019). Who Is Prejudiced, and Toward Whom? The BigFive Traits and Generalized Prejudice. Personality and Social Psychology Bulletin, 45,1455–1467.
Cuddy, A. J., Fiske, S. T., & Glick, P. (2007). The BIAS map: Behaviors from intergroupaffect and stereotypes. Journal of Personality and Social Psychology, 92, 631–648.
Cuddy, A. J., Fiske, S. T., Kwan, V. S., Glick, P., Demoulin, S., Leyens, J. P., ... Ziegler, R.(2009). Stereotype content model across cultures: Towards universal similarities andsome differences. British Journal of Social Psychology, 48, 1–33.
Cummings, G., & Finch, S. (2005). Inference by eye: Confidence intervalsand how to readpictures of data. American Psychologist, 60, 170–180.
Durante, F., Fiske, S., Kervyn, N., Cuddy, A. J. C., Akande, A., Adetoun, B. E., ... Storaric,C. (2013). Nations’ income inequality predicts ambivalence in stereotype content:How societies mind the gap. British Journal of Social Psychology, 52, 726–746.
Ellemers, N. (2017). Morality and the regulation of social behavior: Groups as moral anchors.Routledge.
Ellemers, N., Fiske, S., Abele, A., Koch, A., & Yzerbyt, V. (2020). Adversarial alignmentenables competing models to engage in cooperative theory-building, toward cumu-lative science. Proceedings of the National Academy of Sciences, 17, 7561–7567.
Fiedler, K. (2017). What constitutes strong psychological science? The (neglected) role ofdiagnosticity and a priori theorizing. Perspectives on Psychological Science, 12, 46–61.
Fiske, S. T. (2018). Stereotype content: Warmth and competence endure. CurrentDirections in Psychological Science, 27, 67–73.
Fiske, S. T., Cuddy, A. J., Glick, P., & Xu, J. (2002). A model of (often mixed) stereotypecontent: Competence and warmth respectively follow from perceived status andcompetition. Journal of Personality and Social Psychology, 82, 878–902.
Fiske, S. T., & Neuberg, S. L. (1990). A continuum of impression formation, from cate-gory-based to individuating processes: Influences of information and motivation onattention and interpretation. Advances in Experimental Social Psychology, 23, 1–74.
Grossmann, I. (2017). Wisdom in context. Perspectives on Psychological Science, 12,233–257.
Harris, L. T., & Fiske, S. T. (2006). Dehumanizing the lowest of the low: Neuro-imagingresponses to extreme outgroups. Psychological Science, 17, 847–853.
Hehman, E., Sutherland, C. A., Flake, J. K., & Slepian, M. L. (2017). The unique con-tributions of perceiver and target characteristics in person perception. Journal ofPersonality and Social Psychology, 113, 513–529.
Hout, M. C., Goldinger, S. D., & Ferguson, R. W. (2013). The versatility of SpAM: A fast,efficient, spatial method of data collection for multidimensional scaling. Journal ofExperimental Psychology: General, 142, 256–281.
Hout, M. C., Papesh, M. H., & Goldinger, S. D. (2013). Multidimensional scaling. WileyInterdisciplinary Reviews: Cognitive Science, 4, 93–103.
Hönekopp, J. (2006). Once more: is beauty in the eye of the beholder? Relative con-tributions of private and shared taste to judgments of facial attractiveness. Journal ofExperimental Psychology: Human Perception and Performance, 32, 199–209.
Imhoff, R., & Koch, A. (2017). How orthogonal are the big two of social perception? Onthe curvilinear relation between agency and communion. Perspectives on PsychologicalScience, 12, 122–137.
Imhoff, R., Woelki, J., Hanke, S., & Dotsch, R. (2013). Warmth and competence in yourface! Visual encoding of stereotype content. Frontiers in Psychology, 4(386).
Judd, C. M., Westfall, J., & Kenny, D. A. (2012). Treating stimuli as a random factor insocial psychology: A new and comprehensive solution to a pervasive but largely ig-nored problem. Journal of Personality and Social Psychology, 103, 54–69.
Judd, C. M., Westfall, J., & Kenny, D. A. (2017). Experiments with more than one randomfactor: Designs, analytic models, and statistical power. Annual Review of Psychology,68, 601–625.
Kenny, D. A. (1994). Interpersonal perception: A social relations analysis. Guilford Press.Kenny, D. A. (2004). PERSON: A general model of interpersonal perception. Personality
and Social Psychology Review, 8, 265–280.Kenny, D. A., Albright, L., Malloy, T. E., & Kashy, D. A. (1994). Consensus in interpersonal
perception: Acquaintance and the big five. Psychological Bulletin, 116, 245–258.Kenny, D. A., & West, T. V. (2011). Similarity and agreement in self and other perception:
A meta-analysis. Personality and Social Psychology Review, 14, 196–213.Kenrick, D. T., Griskevicius, V., Neuberg, S. L., & Schaller, M. (2010). Renovating the
A. Koch, et al. Journal of Experimental Social Psychology 89 (2020) 103995
11

pyramid of needs: Contemporary extensions built upon ancient foundations.Perspectives on Psychological Science, 5, 292–314.
Kervyn, N., Bergsieker, H. B., & Fiske, S. T. (2012). The innuendo effect: Hearing thepositive but inferring the negative. Journal of Experimental Social Psychology, 48,77–85.
Kervyn, N., Fiske, S. T., & Malone, C. (2012). Brands as intentional agents framework:How perceived intentions and ability can map brand perception. Journal of ConsumerPsychology, 22, 166–176.
Koch, A., Alves, H., Krüger, T., & Unkelbach, C. (2016). A general valence asymmetry insimilarity: Good is more alike than bad. Journal of Experimental Psychology: Learning,Memory, and Cognition, 42, 1171–1192.
Koch, A., Dorrough, A., Glöckner, A., & Imhoff, R. (2020). The ABC of society: Perceivedsimilarity in agency/socioeconomic success and conservative-progressive beliefs increasesintergroup cooperation. (Manuscript submitted for publication).
Koch, A., & Imhoff, R. (2018). Rethinking the nature and relation of fundamental di-mensions of meaning. In A. Abele, & B. Wojciszke (Eds.). Agency and communion insocial psychology (pp. 167–179). Abingdon, UK: Routledge.
Koch, A., Imhoff, R., Dotsch, R., Unkelbach, C., & Alves, H. (2016). The ABC of stereo-types about groups: Agency/socioeconomic success, conservative–progressive beliefs,and communion. Journal of Personality and Social Psychology, 110, 675–709.
Koch, A., Kervyn, N., Kervyn, M., & Imhoff, R. (2018). Studying the Cognitive Map of theUS States: Ideology and Prosperity Stereotypes Predict Interstate Prejudice. SocialPsychological and Personality Science, 9, 530–538.
Koch, A., Dorrough, A., Glöckner, A., & Imhoff, R. (2020). The ABC of society: Similarityin agency and beliefs predicts cooperation across groups. Journal of ExperimentalSocial Psychology.
Lammers, J., Koch, A., Conway, P., & Brandt, M. J. (2017). The political domain appearssimpler to the politically extreme than to political moderates. Social Psychological andPersonality Science, 8, 612–622.
Leach, C. W., Ellemers, N., & Barreto, M. (2007). Group virtue: The importance of mor-ality (vs. competence and sociability) in the positive evaluation of in-groups. Journalof Personality and Social Psychology, 93, 234–249.
Lenth, R. V. (2016). Least-squares means: the R package lsmeans. Journal of StatisticalSoftware, 69, 1–33.
Montoya, R. M., Horton, R. S., & Kirchner, J. (2008). Is actual similarity necessary forattraction? A meta-analysis of actual and perceived similarity. Journal of Social andPersonal Relationships, 25, 889–922.
Muris, P., Merckelbach, H., Otgaar, H., & Meijer, E. (2017). The malevolent side of humannature: A meta-analysis and critical review of the literature on the dark triad (nar-cissism, Machiavellianism, and psychopathy). Perspectives on Psychological Science, 12,183–204.
Nicolas, G., Bai, X., Fiske, S., Terache, J., Carrier, A., Yzerbyt, V., ... Unkelbach, C. (2020).Warmth is a central social cognitive dimension: Natural language analysis of intergroupinformation seeking. (Manuscript in preparation).
Oosterhof, N. N., & Todorov, A. (2008). The functional basis of face evaluation.Proceedings of the National Academy of Sciences, 105, 11087–11092.
Paulhus, D. L., & Trapnell, P. D. (2008). Sroelf-presentation of personality. Handbook ofPersonality Psychology, 19, 492–517.
Peabody, D. (1967). Trait inferences: Evaluative and descriptive aspects. Journal ofPersonality and Social Psychology, 7, 1–18.
Peabody, D. (1985). National characteristics. Editions de la Maison des Sciences del'Homme.
Peeters, G. (1992). Evaluative meanings of adjectives invitro and in context: Some the-oretical implications and practical consequences of positive-negative asymmetry andbehavioral-adaptive concepts of evaluation. Psychologica Belgica, 32, 211–231.
Peeters, G. (2008). The evaluative face of a descriptive model: Communion and agency inPeabody's tetradic model of trait organization. European Journal of Social Psychology,
38, 1066–1072.Raudenbush, S. W., & Bryk, A. S. (2002). Hierarchical linear models: Applications and data
analysis methods. Vol. 1. Sage.Rauthmann, J. F., Gallardo-Pujol, D., Guillaume, E. M., Todd, E., Nave, C. S., Sherman, R.
A., ... Funder, D. C. (2014). The Situational Eight DIAMONDS: A taxonomy of majordimensions of situation characteristics. Journal of Personality and Social Psychology,107, 677–718.
Rosenberg, S., Nelson, C., & Vivekananthan, P. S. (1968). A multidimensional approach tothe structure of personality impressions. Journal of Personality and Social Psychology,9, 283–294.
Schwartz, S. H. (1994). Are there universal aspects in the structure and contents of humanvalues? Journal of Social Issues, 50, 19–45.
Schwartz, S. H., & Bilsky, W. (1987). Toward a universal psychological structure ofhuman values. Journal of Personality and Social Psychology, 53, 550–562.
Sevillano, V., & Fiske, S. T. (2016). Warmth and competence in animals. Journal of AppliedSocial Psychology, 46, 276–293.
Slepian, M., & Koch, A. (2020). The harms of secrecy: Integrating data-driven dimensionidentification with experimental intervention to improve coping with secrecy. (Manuscriptsubmitted for publication).
Soto, C. J., & John, O. P. (2017). The next Big Five Inventory (BFI-2): Developing andassessing a hierarchical model with 15 facets to enhance bandwidth, fidelity, andpredictive power. Journal of Personality and Social Psychology, 113, 117–143.
Sutherland, C., Oldmeadow, J. A., Santos, I. M., John, T., Burt, D. M., & Young, A. (2013).Social inferences from faces: Ambient images generate a three-dimensional model.Cognition, 127, 105–118.
Sutherland, C., Rhodes, G., Burton, N., & Young, A. (2019). Do facial first impressionsreflect a shared social reality? British Journal of Psychology, 111, 215–232.
Sutherland, C. A. M., Oldmeadow, J. A., & Young, A. W. (2016). Integrating social andfacial models of person perception: Converging and diverging dimensions. Cognition,157, 257–267.
Sweetman, J., Spears, R., Livingstone, A. G., & Manstead, A. S. (2013). Admiration reg-ulates social hierarchy: Antecedents, dispositions, and effects on intergroup behavior.Journal of Experimental Social Psychology, 49, 534–542.
Swencionis, J. K., & Fiske, S. T. (2016). Promote up, ingratiate down: Status comparisonsdrive warmth-competence tradeoffs in impression management. Journal ofExperimental Social Psychology, 64, 27–34.
Unkelbach, C., Forgas, J. P., & Denson, T. F. (2008). The turban effect: The influence ofMuslim headgear and induced affect on aggressive responses in the shooter biasparadigm. Journal of Experimental Social Psychology, 44, 1409–1413.
van Prooijen, A. M., Ellemers, N., Van Der Lee, R., & Scheepers, D. T. (2018). What seemsattractive may not always work well: Evaluative and cardiovascular responses tomorality and competence levels in decision-making teams. Group Processes &Intergroup Relations, 21, 73–87.
Wojciszke, B. (1994). Multiple meanings of behavior: Construing actions in terms ofcompetence and morality. Journal of Personality and Social Psychology, 67, 222–232.
Xie, S. Y., Flake, J. K., & Hehman, E. (2019). Perceiver and target characteristics con-tribute to impression formation differently across race and gender. Journal ofPersonality and Social Psychology, 177, 364–385.
Young, F. W., Takane, Y., & Lewyckyj, R. (1978). ALSCAL: A nonmetric multidimensionalscaling program with several individual-differences options. Behavior ResearchMethods, 10, 451–453.
Yzerbyt, V. (2016). Intergroup stereotyping. Current Opinion in Psychology, 11, 90–95.Yzerbyt, V. Y., Kervyn, N., & Judd, C. M. (2008). Compensation versus halo: The unique
relations between the fundamental dimensions of social judgment. Personality andSocial Psychology Bulletin, 34, 1110–1123.
Zou, L. X., & Cheryan, S. (2017). Two axes of subordination: A new model of racial po-sition. Journal of Personality and Social Psychology, 112, 696–717.
A. Koch, et al. Journal of Experimental Social Psychology 89 (2020) 103995
12