Group Interaction
17
Section 8: Group Interaction Group Interaction Is the stiffness from a Modulus Test the same as the upper zone stiffness of group? Group Interaction Because of stress overlap, we might think that group settlement > modulus test settlement Stress overlap Let’s look at the data – Utah site: v. soft clay Group Interaction - Load Tests On a per-pier basis, modulus test results = group results 0 1000 2000 3000 Load (kN) 250 200 150 100 50 0 Settlement (mm) Measured Load From Pier Group Measured Single Pier Load Multiplied by 5 1 kN = 0.225 kips 1 mm = 0.039 in. versus Group Interaction – Load Tests Load test data: Iowa site, Short and Long Piers – Soft Clay On a per-pier basis, modulus test results = group results Short piers Long piers 0.0 0.5 1.0 1.5 2.0 2.5 3.0 3.5 0.0 4.0 8.0 12.0 Stress (ksf) Deflection (inches) Test Pier Pier Group 0.0 0.5 1.0 1.5 2.0 2.5 3.0 3.5 0.0 4.0 8.0 12.0 Stress (ksf) Deflection (inches) Test Pier Pier Group Group Interaction – Load Tests Load test data: Lacrosse WI – Loose Sand On a per-pier basis, modulus test results = group results -2 -1.5 -1 -0.5 0 0 20 40 60 80 Geopier Stress (ksf) Deflection (in) Modulus Test Full-Scale Load versus
-
Upload
geopac-geopier -
Category
Documents
-
view
221 -
download
0
description
Group Interaction
Transcript of Group Interaction

Section 8:
Group Interaction
Group Interaction
Is the stiffness from a Modulus Test the same as the
upper zone stiffness of group?
Group Interaction
Because of stress overlap, we might think that group
settlement > modulus test settlement
Stress
overlap
Let’s look at the data – Utah site: v. soft clay
Group Interaction - Load Tests
On a per-pier basis, modulus test results = group results
0 1000 2000 3000
Load (kN)
250
200
150
100
50
0
Settlement (m
m)
Measured Load From Pier Group
Measured Single Pier Load Multiplied by 5
1 kN = 0.225 kips
1 mm = 0.039 in.
versus
Group Interaction – Load Tests
Load test data: Iowa site, Short and Long Piers – Soft Clay
On a per-pier basis, modulus test results = group results
Short piers Long piers
0.0
0.5
1.0
1.5
2.0
2.5
3.0
3.5
0.0 4.0 8.0 12.0
Stress (ksf)
Deflection (inches)
Test Pier
Pier Group0.0
0.5
1.0
1.5
2.0
2.5
3.0
3.5
0.0 4.0 8.0 12.0
Stress (ksf)
Deflection (inches)
Test Pier
Pier Group
Group Interaction – Load Tests
Load test data: Lacrosse WI – Loose Sand
On a per-pier basis, modulus test
results = group results
-2
-1.5
-1
-0.5
0
0 20 40 60 80Geopier Stress (ksf)
Deflection (in)
Modulus Test
Full-Scale Load
versus
0.0
0.5
1.0
1.5
2.0
2.5
3.0
3/1/
06
3/31
/06
4/30
/06
5/30
/06
6/29
/06
7/29
/06
8/28
/06
9/27
/06
10/2
7/06
11/2
6/06
12/2
6/06
1/25
/07
2/24
/07
3/26
/07
4/25
/07
5/25
/07
6/24
/07
Date
Sett
lem
ent
(in
) )
STA 11142+00 STA 11162+00
STA 11154+00 STA 11158+00
STA 11146+00 STA 11174+00
STA 11134+00 STA 11178+00
Settlement Criterion = 2-inch
End of Fill Placement
Group Interaction – Load Tests
Load test data: Wichita RR wall – clay fill
On a per-pier basis,
modulus test results =
group results
Deflection from
modulus test
The answer to the question is found in cavity expansion
soil mechanics
Group Interaction – Soil Mechanics (theory)
Stress path
(elastic regime)
Start with normally consolidated soil:
Increase radial stress. Elastic theory:
tangential stress decrease = radial
stress increase
σσσσ’z
σσσσ’r
σσσσ’θθθθ
σσσσ’zσσσσ’r
σσσσ’z
σσσσ’θθθθ
σσσσ’θθθθ σσσσ’r
Stress paths during cavity expansion
Group Interaction – Soil Mechanics (theory)
Elastic stress path
until yield surface
Stress path
(plastic)
Increase radial stress some more. Stress
path moves up and to the left
Increase radial stress even more. Stress
path moves up the failure surface
σσσσ’z
σσσσ’r
σσσσ’θθθθ
σσσσ’θθθθ σσσσ’zσσσσ’r
σσσσ’rσσσσ’θθθθ
Group Interaction – More theory
So…. if we can measure lateral stresses, we can
test the measurements against theory to “see”
the stress zones
Plastic theory says that the
dissipation of radial
stress should decay
with radial distance as:
Elastic theory says that the
dissipation of radial
stress should decay
with radial distance as:
1
Log R
Log
Radial
stress
1 1
1- Ka 1
Extrapolate measurements to
find pressure on zero thickness
blade = in-situ lateral stress
Group Interaction – Stress Measurements
Log pressure
Group Interaction – Stress Measurements
Plastic and elastic zones recognizable
1
1- Ka
1
1

End up with three stress zones around the RAP:
Group Interaction – Theory to reality
RAP
Elastic
zone
Elastic
zone
“Plastic
Zone”
“Plastic
Zone”
Passive uplift zone
6 ft
Radial pressure in plastic zone
horizontally preloaded to 120 kPa
Start with simple (axisymmetric) model of individual piers
Group Interaction – Numerical Modeling
Applied Compressive Load per Pier [kN]
0 50 100 150 200 250 300 350 400
Settlement [m
m]
-90
-80
-70
-60
-50
-40
-30
-20
-10
0
Measured (P1)
Measured (G1)
Computed (P1)
Computed (G1)
(a)
Pier length: L = 2.79 m
Fcapacity
= 840 kN
210 kN
9.5 mm
Seating load
Applied Compressive Load per Pier [kN]
0 50 100 150 200 250 300 350 400 450 500
Settlement [m
m]
-80
-70
-60
-50
-40
-30
-20
-10
0
Measured (P2)
Measured (G2)
Computed (P2)
Computed (G2)
(b)
Pier length: L = 5.10 m
220 kN
Fcapacity
= 880 kN
10 mm
Seating load
Achieve good correspondence
with measured field results –
parameter values appropriate
(ISU and KU)
FLAC3D 3.10
Itasca Consulting Group, Inc.Minneapolis, MN USA
©2006 Itasca Consulting Group, Inc.
Step 373686 Model Perspective11:59:00 Sun Oct 07 2007
Center: X: 1.900e-001 Y: 1.900e-001 Z: -1.850e+000
Rotation: X: 360.000 Y: 0.000 Z: 0.000
Dist: 3.890e+001 Mag.: 3.81Ang.: 22.500
Surface Magfac = 1.000e+000 Live mech zones shown
Displacement Maximum = 8.509e-002 Linestyle
Surface Magfac = 1.000e+000 Live mech zones shown
Surface Magfac = 1.000e+000 Live mech zones shown
FLAC3D 3.10
Itasca Consulting Group, Inc.Minneapolis, MN USA
©2006 Itasca Consulting Group, Inc.
Step 1251206 Model Perspective22:41:07 Sun Oct 07 2007
Center: X: 2.813e-001 Y: 1.391e-001 Z: -1.627e+000
Rotation: X: 40.000 Y: 0.000 Z: 40.000
Dist: 3.898e+001 Mag.: 2.44Ang.: 22.500
Surface Magfac = 1.000e+000 Live mech zones shown
Surface Magfac = 1.000e+000 Live mech zones shown
Surface Magfac = 1.000e+000 Live mech zones shown
Surface Magfac = 1.000e+000 Live mech zones shown
Surface Magfac = 1.000e+000 Live mech zones shown
Surface
Group Interaction – Numerical Modeling
Then build 3D model of pier group
FLAC3D 3.10
Itasca Consulting Group, Inc.Minneapolis, MN USA
©2006 Itasca Consulting Group, Inc.
Step 11660 Model Perspective15:06:50 Mon Oct 15 2007
Center: X: -1.048e-002 Y: 1.674e-001 Z: -7.000e+000
Rotation: X: 90.000 Y: 0.000 Z: 0.000
Dist: 3.898e+001 Mag.: 4.77Ang.: 22.500
Surface Magfac = 1.000e+000 Live mech zones shown
Velocity Maximum = 8.946e-006 Linestyle
Expand each cavity
incrementally then apply
vertical foundation load
Group Interaction – Numerical Modeling
Achieve good correspondence with measured group
deflection for both short piers and long piers
-80.00
-70.00
-60.00
-50.00
-40.00
-30.00
-20.00
-10.00
0.00
0 200 400 600 800 1000 1200 1400 1600 1800
Applied vertical load (kN)
Dis
pla
cem
en
t a
t to
p o
f p
iers
Field
Current
-90.00
-80.00
-70.00
-60.00
-50.00
-40.00
-30.00
-20.00
-10.00
0.00
0 200 400 600 800 1000 1200 1400
Applied vertical load (kN)
Dis
pla
ce
men
t at
top
of
pie
rs (
mm
)
Field
Current
Short piers in a group Long piers in a group
Group Interaction – Numerical Modeling
Review stress paths – increasing lateral stress makes the
soil stiffer; principal stress reversal allows you to
move away from yield surface during loading
Single pier
-120
-100
-80
-60
-40
-20
0
20
40
60
80
100
120
0 20 40 60 80 100 120
mean stress, p' (kPa)
shear stress, q' (kPa)
Method 1
Method 2
-50
-40
-30
-20
-10
0
10
20
30
40
50
0 10 20 30
mean stress, p' (kPa)
shear stress, q
' (kPa)
Method 1
Method 2
Pier groupCavity
expansion:
20 kPa
Cavity
expansion:
45 kPa
Load
towards yield
surface
Load away
from yield
surface
Group Interaction – Numerical Modeling
Influence of lateral stress on preconsolidation pressure
In simpler terms: when you laterally preconsolidate
the soil, you increase the preconsolidation
pressure and increase the soil stiffness
0.55
0.60
0.65
0.70
0.75
10 100 1000
log(σ'v) - kPa
Void ratio, e
K=1.0
K=1.5
K=2.0
K=2.5
K=3.0
Data from the isotropic
consolidation test
New virgin
curvesVolume change
during lateral
consolidation
σ'v=250 ; ∆σ'v=0

Group Interaction
Lateral stress allows buildings like this to be supported
on RAP foundations (Marquee Towers, Irvine, CA)
Section 9:
Resistance to
Lateral Loads
SEISMIC (AND WIND) DESIGN
Lateral Load Resistance
PRESSUREBEARING
MATRIX SOIL
INERTIAL LOADS
GEOPIER
ELEMENT
PRESSURE
PRESSURE
EARTH
BEARINGGEOPIER
PASSIVE
UPLIFT
ANCHOR
RESISTANCESLIDING
DISPLACED
FOUNDATION
Mechanisms identical to
conventional spread footings:
1. Passive earth pressure
adjacent to footing.
2. Friction at the base
of the footing.
PRESSUREBEARING
MATRIX SOIL
Sliding Resistance
Fg FgFm
SEISMIC (AND WIND) DESIGN
1. Friction between RAP element and footing:
Fg = fg Ag
2. Friction between matrix soil and footing:
Fm = fm Am
3. Total sliding resistance at footing Base, F
F = Fg + Fm
PRESSUREBEARING
MATRIX SOIL
Sliding Resistance
RAP unit frictional resistance:
fg = qg tan φφφφ′′′′g
Matrix soil unit frictional resistance:
fs = qm tan φφφφ′′′′m
Normal stress on RAP element:
qg = {qRs / [Ra Rs +1 - Ra]}
Normal stress acting on the matrix soil:
qm = qg / Rs
SEISMIC (AND WIND) DESIGN
Sliding Resistance
Total sliding resistance (F) at footing base:
Typical RAP friction angle = 48° - 52°
Typical factor of safety = 2.0
Composite unit friction resistance (f) for footing:
SEISMIC (AND WIND) DESIGN
( )( )asa
magas
RRR
RRRqAF
−+
−+=
1
tan1tan '' φφ
( )( )
asa
magas
RRR
RRRf
−+
−+=
1
tan1tan '' φφ
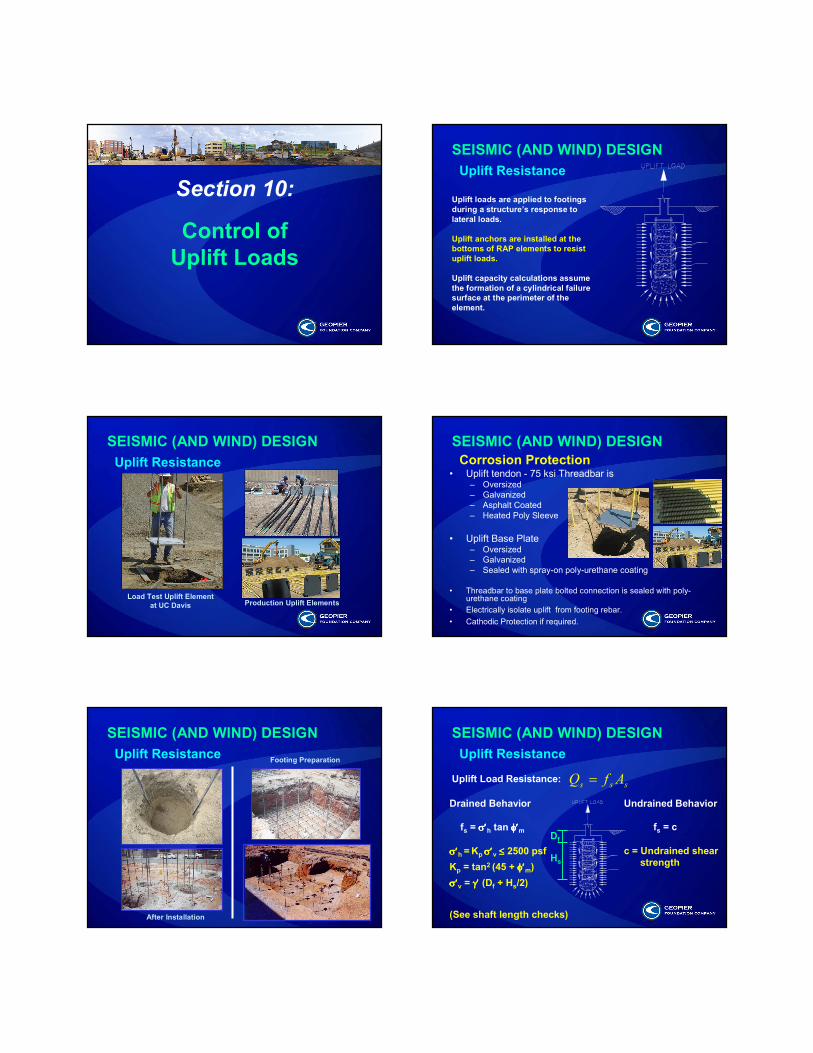
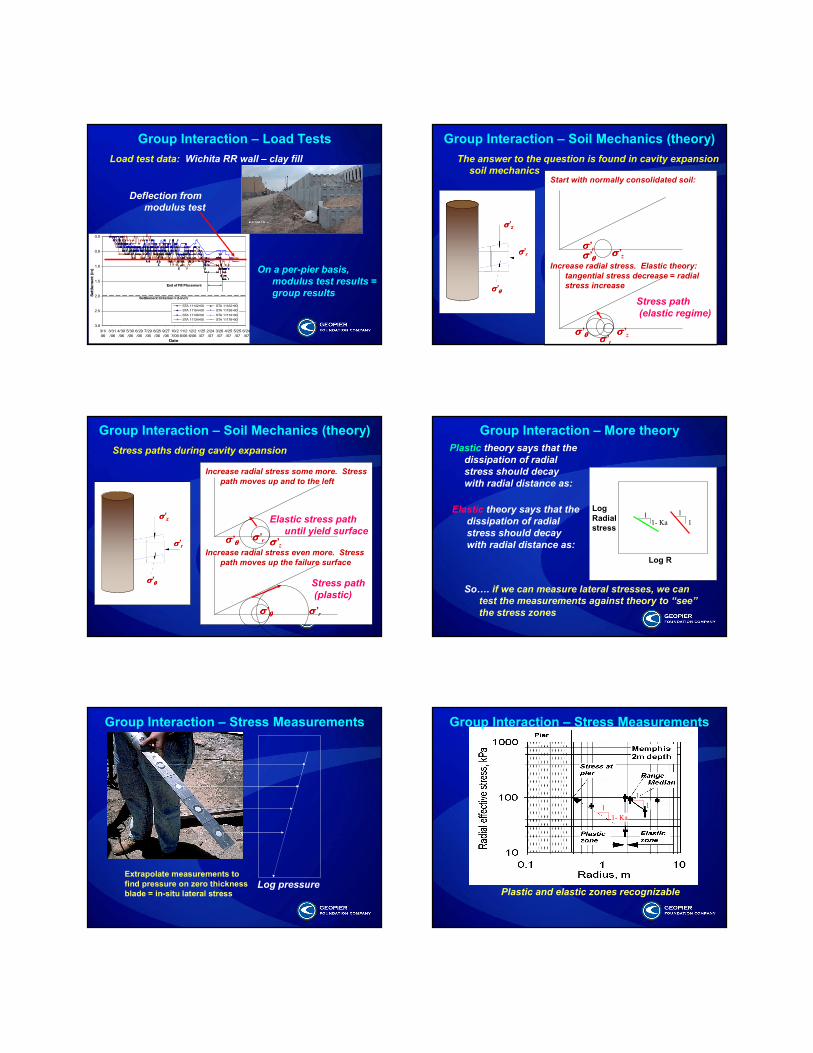
Section 10:
Control of
Uplift Loads
Uplift Resistance
Uplift loads are applied to footings
during a structure’s response to
lateral loads.
Uplift anchors are installed at the
bottoms of RAP elements to resist
uplift loads.
Uplift capacity calculations assume
the formation of a cylindrical failure
surface at the perimeter of the
element.
SEISMIC (AND WIND) DESIGN
Load Test Uplift Element
at UC Davis Production Uplift Elements
Uplift Resistance
SEISMIC (AND WIND) DESIGN
• Uplift tendon - 75 ksi Threadbar is – Oversized
– Galvanized
– Asphalt Coated
– Heated Poly Sleeve
• Uplift Base Plate– Oversized
– Galvanized
– Sealed with spray-on poly-urethane coating
• Threadbar to base plate bolted connection is sealed with poly-urethane coating
• Electrically isolate uplift from footing rebar.
• Cathodic Protection if required.
Corrosion Protection
SEISMIC (AND WIND) DESIGN
After Installation
Footing PreparationUplift Resistance
SEISMIC (AND WIND) DESIGN
Uplift Resistance
Drained Behavior
fs = σσσσ′′′′h tan φφφφ′′′′m
σσσσ′′′′h = Kp σσσσ′′′′v ≤≤≤≤ 2500 psf
Kp = tan2 (45 + φφφφ′′′′m)
σσσσ′′′′v = γγγγ′′′′ (Df + Hs/2)
(See shaft length checks)
Df
Hs
Undrained Behavior
fs = c
c = Undrained shear
strength
SEISMIC (AND WIND) DESIGN
Uplift Load Resistance: sss AfQ =

Uplift Load Test
Load Test Pier
Cribbing
Compression
RAP
Element
13 feet
6.5 feetW-Beam
W-Beam
100 ton jack
SEISMIC (AND WIND) DESIGN
Uplift load test results
SEISMIC (AND WIND) DESIGN
0.0
0.5
1.0
1.5
2.0
0 20 40 60 80 100
load, (kips)
defl
ecti
on
, (i
n)
11 Load Cycles
per test event
1x 30 kips = 50%
1x 45 kips = 75%
4x 60 kips = 100%
2x 90 kips = 150%
3x 120 kips = 200%
Time to complete 1
test event ~ 1 hour
30 minutes
Second test event
run 2 hours after
completion of first0
20
40
60
80
100
120
140
0.00 0.10 0.20 0.30 0.40 0.50 0.60 0.70 0.80 0.90 1.00
Vertical Displacement (inches)
Perc
en
t o
f A
llo
wab
le C
ap
acit
y
First Load Cycle
Second Load Cycle
Cyclic Load Testing: 33-inch by 15-foot deep Geopier Uplift Element
67%
33%
100%
133%
200%
167%
Allowable Uplift Capacity = 60 kips
Axia
l U
plift
Lo
ad
(kip
s)
.
Notice no break in
stiffness after 22
cycles
Cyclic Uplift load test results
SEISMIC (AND WIND) DESIGN
Group uplift
SEISMIC (AND WIND) DESIGN
B B
W W FsHs~4
1
Granular Cohesive
See Technical Bulletin No. 3
SEISMIC / WINDBay Area Rapid Transit Parking Garage,
Walnut Creek, CA
- 8-story parking garage
- Pmax = 2,300 kip = 1045 Ton
- Uplift loads > 1,500 kip = 680 Ton
- 30-inch diameter Geopier
- Pier lengths: 14 – 20 ft
- 4.3 - 6 meters
- 6-story Hospital
- Pmax = 1,260 kip = 573 Ton
- Uplift loads = 1,080 kip = 490 Ton
- 30-dia. Geopier up to 22 ft
- 6.7 meters
- Sustained direct hit from
Hurricane Rita in 2005!
SEISMIC / WINDMedical Center of Southeast Texas,
Port Arthur, TX

Section 11:
Liquefaction Mitigation
SEISMIC DESIGN
Liquefaction - What is it?
1. Soil liquefaction occurs when loose deposits of
saturated sand are subject to shaking. Liquefaction
requirements include:
a. Granular soils.
b. Saturation.
c. Low relative density - contraction during
densification.
d. Ground shaking strong enough to cause
densification.
e. Ground shaking long enough to sustain pore
water pressure buildup.
SEISMIC DESIGN
Liquefaction - What is it?
2. If the level of shaking is of sufficient intensity and
duration:
a. Loose sands contract,
b. Pore water pressures increase within
the saturated deposit,
c. Effective stress then decreases
d. Causing reduction in soil shear strength.
e. Liquefaction results in both a loss of soil shear
strength and then a subsequent reduction in
soil volume as the excess pore
water pressures dissipate.
(Seed and Idriss, 1982)
SEISMIC DESIGN
Impacts of Liquefaction
1. Liquefaction causes bearing capacity failure or
excessive settlement from loss of shear strength
PRESSUREBEARING
MATRIX SOIL
INERTIAL LOADS
GEOPIER
ELEMENT
PRESSURE
PRESSURE
EARTH
BEARINGGEOPIER
PASSIVE
UPLIFT
ANCHOR
RESISTANCESLIDING
DISPLACED
FOUNDATION
2. Subsequent settlement occurs from the
dissipation of excess pore pressure.
3. Piles are subject to excessive
bending moments from inertial
forces combined with the loss of
supporting liquefied materials.
Rammed Aggregate Pier systems reduce the
potential for liquefaction:
1. RAPs are too dense to liquefy.
2. Increase in horizontal stress increases liquefaction
resistance.
3. Drainage.
4. Densification (requires clean sand).
5. Shear stress distribution.
PRESSUREBEARING
MATRIX SOIL
INERTIAL LOADS
GEOPIER
ELEMENT
PRESSURE
PRESSURE
EARTH
BEARINGGEOPIER
PASSIVE
UPLIFT
ANCHOR
RESISTANCESLIDING
DISPLACED
FOUNDATION
SEISMIC DESIGN
Liquefaction Mitigation
SEISMIC DESIGN
Liquefaction Mitigation
1. Shear stresses induced in the soil mass and Geopier elements
are proportional to shear stiffness (stiff springs attract load).
2. The ratio of applied shear stress that is resisted by the existing
soil (ττττs) to the free-field shear stress (ττττ):
APPLIED
SHEAR STRESS
MATRIX SOIL
SHEAR STRESS
RESISTANCE
GEOPIER SHEAR
STRESS RESISTANCE
GEOPIER
ELEMENT
ZONE OF
HORIZONTAL
STRESS INCREASE
Figure 3. Reduction of Liquefaction Potential
ττττs
ττττ====
1
(1 - Ra + Ra Rs)

APPLIED
SHEAR STRESS
ZONE OF
HORIZONTAL
STRESS INCREASE
RAPττττm
ττττgττττm < ττττ < ττττg
ττττ
SEISMIC DESIGN
Liquefaction Mitigation
3,100+ Impact® piers installed
SEISMIC / LIQUEFACTIONMoran Asian Garden, Westminster, CA
Impact Pier Construction
SEISMIC / LIQUEFACTIONMoran Asian Garden, Westminster, CA
- 2,700,000 ft2 shipyard development
- Up to 3,100 psf slab pressures
- Improvement of soft clay and intermittent SP/SM
- Foundation support & liquefaction mitigation for
0.8g seismic event
- Over 48,000 piers
- Spacing of 6.5 o-c
SEISMIC / LIQUEFACTIONBogazici Shipyard, Altinova, Turkey
SEISMIC / LIQUEFACTIONBogazici Shipyard, Altinova, Turkey
Section 12:
Stabilization of Slopes,
Embankments & Walls
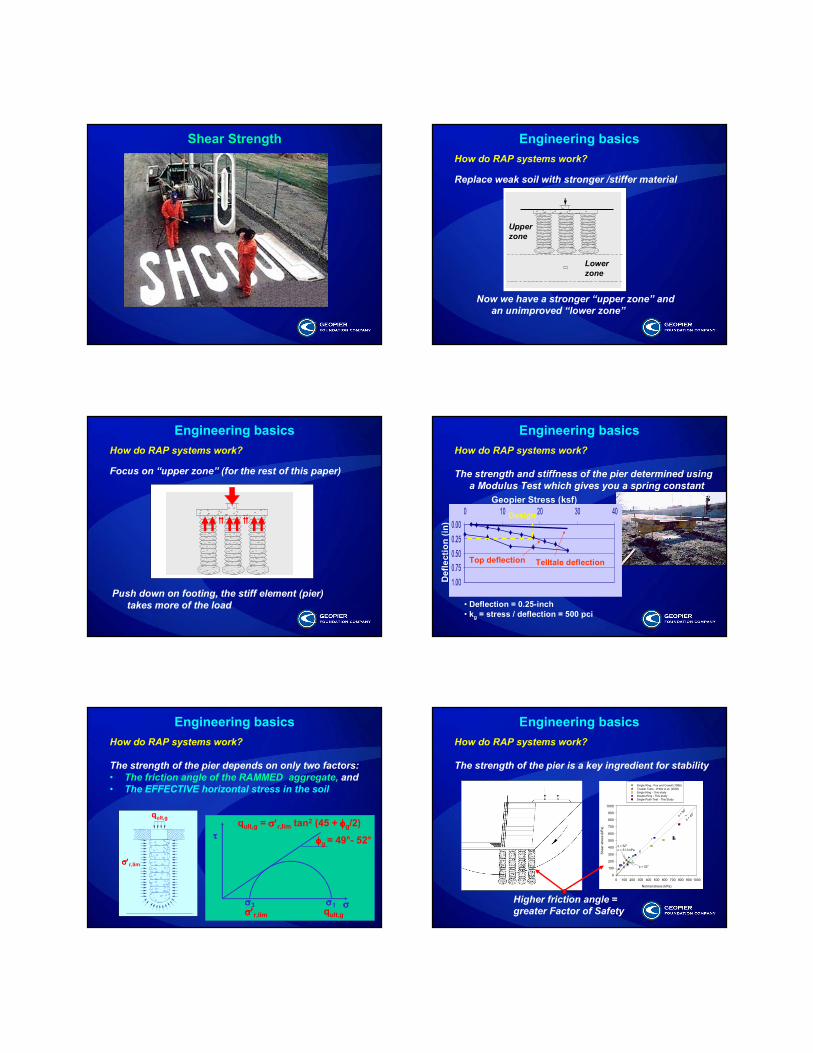
Shear Strength
How do RAP systems work?
Replace weak soil with stronger /stiffer material
Engineering basics
Now we have a stronger “upper zone” and
an unimproved “lower zone”
Upper
zone
Lower
zone
How do RAP systems work?
Focus on “upper zone” (for the rest of this paper)
Engineering basics
Push down on footing, the stiff element (pier)
takes more of the load
How do RAP systems work?
The strength and stiffness of the pier determined using
a Modulus Test which gives you a spring constant
Engineering basics
0.00
0.25
0.50
0.75
1.00
0 10 20 30 40
• Deflection = 0.25-inch
• kg = stress / deflection = 500 pci
Design
Top deflection
Geopier Stress (ksf)
Defl
ecti
on
(in
)
Telltale deflection
How do RAP systems work?
The strength of the pier depends on only two factors:
• The friction angle of the RAMMED aggregate, and
• The EFFECTIVE horizontal stress in the soil
Engineering basics
σσσσ
ττττ
σσσσ3 σσσσ1σσσσ′′′′r,lim qult,g
φφφφg = 49°- 52°
qult,g = σσσσ′′′′r,lim tan2 (45 + φφφφg/2)qult,g
σσσσ′′′′r,lim
How do RAP systems work?
The strength of the pier is a key ingredient for stability
Engineering basics
Normal stress (kPa)
0 100 200 300 400 500 600 700 800 900 1000
Shear stress (kPa)
0
100
200
300
400
500
600
700
800
900
1000
Single Ring - Fox and Cowell (1998)
Triaxial Tests - White et al. (2002)
Single Ring - This study
Double Ring - This study
Single Push Test - This Study
φ = 52o
φ = 52o
c = 51.3 kPa
φ = 45o
φ = 50o
Higher friction angle =
greater Factor of Safety

The higher the friction angle –
• The more load you can put on the piers prior to
bulging
Friction Angle of Rammed Aggregate
2. The more influence the piers have in improving
stability
Iowa State UniversityPhoto courtesy of Dr. Nat Fox
Friction Angle of Rammed Aggregate
y = 0.750x + 19.794
R2 = 0.962
0
100
200
300
400
500
600
700
800
0 200 400 600 800 1000
pf = (σv + σh)/2 (kPa)
qf = (
v - h)/2 (kPa)
1A
1B
2
3
4
5
6
7A
7B
8
9
10A
10B
11A
11B
SLOPE STABILITY
Global stabilization to control slope movements
Slopes and embankments are subject to failure if the
foundation materials are not sufficiently strong to
resist shearing caused by new embankment/wall fill
placement. In most cases, shearing occurs on
circular surfaces.
SLOPE STABILITY
The installation of RAP elements increases the
shearing strength of the foundation soils.
SLOPE STABILITY
RAP Contributions
ττττcomposite = ccomposite + σσσσ′ tan φφφφcomposite
RAP aggregate behaves as a frictional material with a
high friction angle (typically 50 degrees) and a zero
cohesion intercept. The composite shear strength
(ττττcomposite) of RAP-reinforced soil is expressed as:
SLOPE STABILITY

Composite shear strength parameters:
Ra = RAP percent area coverage
ccomp = Ra*cg + (1-Ra)*cm
φφφφcomp = arctan [Ra*tan(φφφφg)+(1-Ra)*tan(φφφφm)]
SLOPE STABILITY
Weighted average of
matrix soil and RAP
shear strengths
Example calculation:
For Ra = 0.2, cm = 500 psf, φφφφm = 0°°°°
ccomp = 0.8*500 = 400 psf
φφφφcomp = arctan [0.2*tan(50°°°°)] = 13.4°°°°
Weighted average of
matrix soil and RAP
shear strengths
SLOPE STABILITY
What’s missing?.......
Stress concentration to
stiff RAP elements
SLOPE STABILITY
0
5
10
15
20
25
30
35
40
45
1 2 3
Stress Concentration
Ratios (I-15 project)Pressure
plates
4030
Stress concentration
SLOPE STABILITY
ccomp =
φφφφcomp = arctan
Typical Rs factor for stability =
1 to 5 (flexible structures)
Including stress
concentration to stiff
RAP elements
1- Ra
RaRs-Ra+1cm
1 - Ra
RaRs-Ra+1tan(φφφφm)
Rs Ra
RaRs-Ra+1tan(φφφφg) +
RsRa
RaRs-Ra+1cg +
SLOPE STABILITY
An example….
For Ra = 0.2, Rs = 3,
cm = 500 psf, φφφφm = 0°°°°
27.113.40φφφφ (degrees)
286400500c (psf)
RAP
(with conc.)
RAP
(no conc.)
No RAPParameter
Value
SLOPE STABILITY

Slope stability calculations are performed using the
composite shearing strengths for the RAP-reinforced
layers.
SLOPE STABILITYStress Concentration – where does it go?Why is this important?
Stress concentration improves effectiveness for stability
Comparisons with FEA show that stability calculations
including SCR factors provide accurate results
Global stability
• High friction angle
• Increase in composite shear resistance
• Increases global stability and slope stability
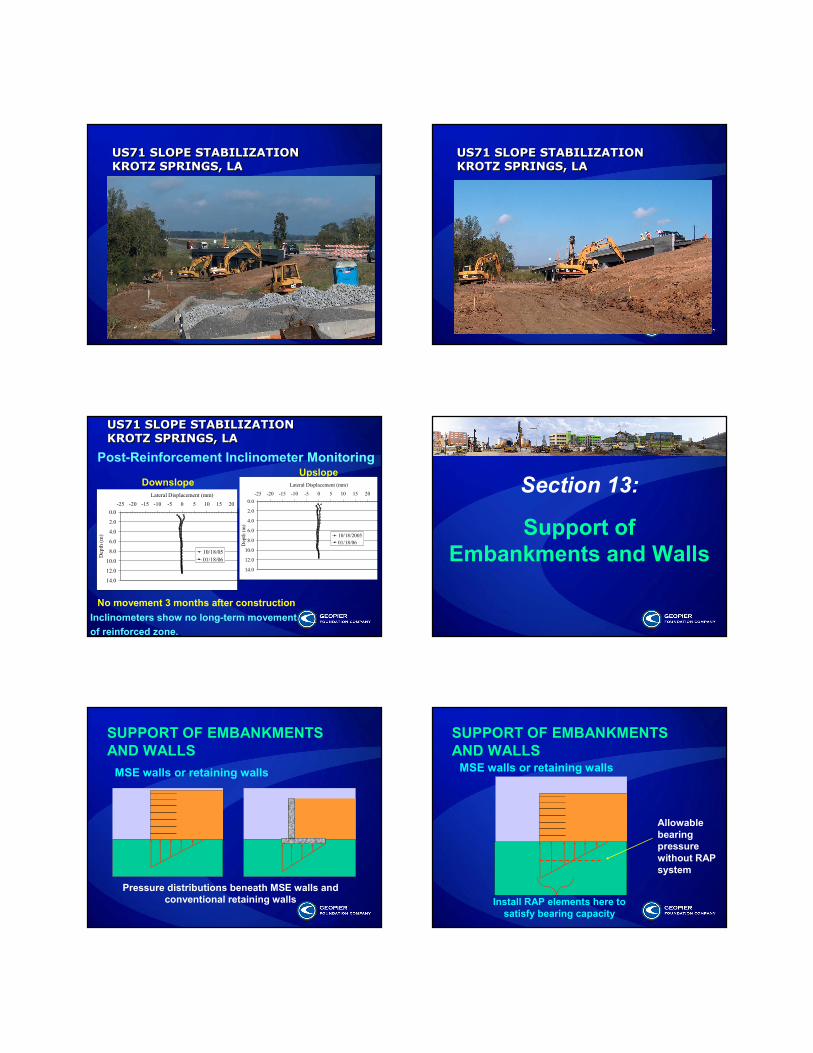
SLOPE STABILITY US71 SLOPE STABILIZATION
KROTZ SPRINGS, LA
US71 SLOPE STABILIZATION
KROTZ SPRINGS, LA
US71 SLOPE STABILIZATION
KROTZ SPRINGS, LA
US71 SLOPE STABILIZATION
KROTZ SPRINGS, LA
Extent of initial movement
US71 SLOPE STABILIZATION
KROTZ SPRINGS, LA
US71 SLOPE STABILIZATION
KROTZ SPRINGS, LA
Continued movement
(after heavy rains)

US71 SLOPE STABILIZATION
KROTZ SPRINGS, LA
US71 SLOPE STABILIZATION
KROTZ SPRINGS, LA
Continued movement
(after heavy rains)
US71 SLOPE STABILIZATION
KROTZ SPRINGS, LA
US71 SLOPE STABILIZATION
KROTZ SPRINGS, LA
Soil Conditions
40 ft
30 ft
20 ft
10 ft
B-2 B-1
CL/CH
Clay Fill
0 ft
US71
Roadway
US71 SLOPE STABILIZATION
KROTZ SPRINGS, LA
US71 SLOPE STABILIZATION
KROTZ SPRINGS, LA
InstabilityInstability
Inclinometer Data
10’
20’
20’
10’
I-1
I-2
US71 SLOPE STABILIZATION
KROTZ SPRINGS, LA
US71 SLOPE STABILIZATION
KROTZ SPRINGS, LA
Modify strength parameter values to arrive at FS = 1
FS = 1
US71 SLOPE STABILIZATION
KROTZ SPRINGS, LA
US71 SLOPE STABILIZATION
KROTZ SPRINGS, LA
Install Geopier elements to intersect
critical circle and increase FS
Geopier Zone
FS > 1.3
US71 SLOPE STABILIZATION
KROTZ SPRINGS, LA
US71 SLOPE STABILIZATION
KROTZ SPRINGS, LA
Cross-section of RAP zone
US71 SLOPE STABILIZATION
KROTZ SPRINGS, LA
US71 SLOPE STABILIZATION
KROTZ SPRINGS, LAUS71 SLOPE STABILIZATION
KROTZ SPRINGS, LA
US71 SLOPE STABILIZATION
KROTZ SPRINGS, LA
US71 SLOPE STABILIZATION
KROTZ SPRINGS, LA
US71 SLOPE STABILIZATION
KROTZ SPRINGS, LA
Post-Reinforcement Inclinometer Monitoring
DownslopeUpslope
No movement 3 months after construction
0.0
2.0
4.0
6.0
8.0
10.0
12.0
14.0
-25 -20 -15 -10 -5 0 5 10 15 20
Lateral Displacement (mm)
Depth (m)
10/18/05
01/18/06
0.0
2.0
4.0
6.0
8.0
10.0
12.0
14.0
-25 -20 -15 -10 -5 0 5 10 15 20 25
Lateral Displacement (mm)
Depth (m)
10/18/2005
01/18/06
Inclinometers show no long-term movement
of reinforced zone.
Section 13:
Support of
Embankments and Walls
MSE walls or retaining walls
Pressure distributions beneath MSE walls and
conventional retaining walls
SUPPORT OF EMBANKMENTS
AND WALLSMSE walls or retaining walls
Allowable
bearing
pressure
without RAP
system
Install RAP elements here to
satisfy bearing capacity
SUPPORT OF EMBANKMENTS
AND WALLS

MSE walls or retaining walls
RAP installation increases allowable
bearing pressure
SUPPORT OF EMBANKMENTS
AND WALLS
Design approach
Terzaghi lower
bound bearing
capacity approach
with upper bound
correction factor
(Barksdale and
Bachus 1983; Hall et
al. 2001)
SUPPORT OF EMBANKMENTS
AND WALLS
Hooke’s Law: S =
q = Applied pressure from embankment
Iσσσσ = Influence factor (~1.0 for area loading)
H = Height of reinforced zone
Ecomp = Composite stiffness in reinforced zone
q Iσσσσ H
Ecomp
Settlement in reinforced zone
SUPPORT OF EMBANKMENTS
AND WALLS
Ecomp = (1-Ra) Em + Ra * Eg
Ra = RAP area coverage ratio
Em = Matrix soil elastic modulus
Eg = RAP elastic modulus
(established with modulus test)
Composite stiffness using weighted average
SUPPORT OF EMBANKMENTS
AND WALLS
Settlement rate increase from:
Arching of
stresses to
elements
Radial drainage
SUPPORT OF EMBANKMENTS
AND WALLS
SUPPORT OF EMBANKMENTS
AND WALLS
See Tech Bulletin 6 for:
• Settlement control
• Radial drainage
• Time rate of settlement
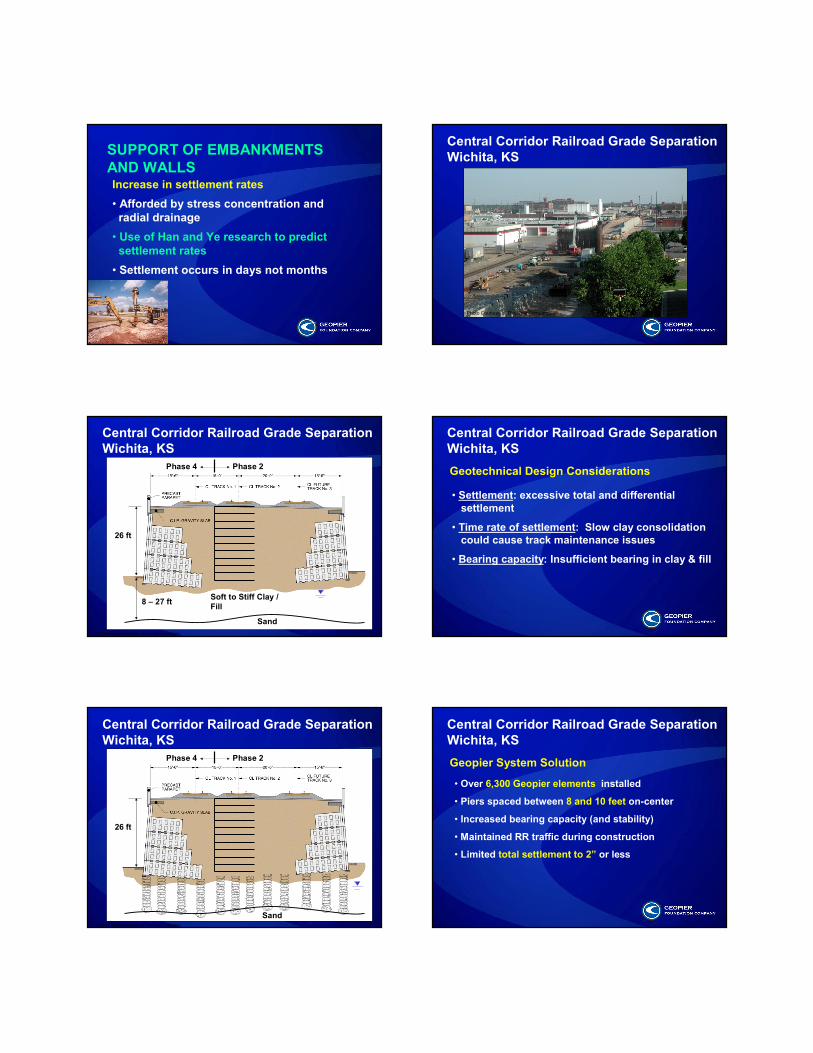
Increase in settlement rates
• Afforded by stress concentration and
radial drainage
• Use of Han and Ye research to predict
settlement rates
• Settlement occurs in days not months
SUPPORT OF EMBANKMENTS
AND WALLS
Central Corridor Railroad Grade Separation
Wichita, KS
Photo Courtesy of The Neel Company
Central Corridor Railroad Grade Separation
Wichita, KS
T-Wall Image Courtesy of The Neel Company
Phase 2Phase 4
Soft to Stiff Clay /
Fill
Sand
8 – 27 ft
26 ft
Central Corridor Railroad Grade Separation
Wichita, KS
Geotechnical Design Considerations
• Settlement: excessive total and differential
settlement
• Time rate of settlement: Slow clay consolidation
could cause track maintenance issues
• Bearing capacity: Insufficient bearing in clay & fill
Central Corridor Railroad Grade Separation
Wichita, KS
T-Wall Image Courtesy of The Neel Company
Phase 2Phase 4
Sand
26 ft
Central Corridor Railroad Grade Separation
Wichita, KS
• Over 6,300 Geopier elements installed
• Piers spaced between 8 and 10 feet on-center
• Increased bearing capacity (and stability)
• Maintained RR traffic during construction
• Limited total settlement to 2” or less
Geopier System Solution

Central Corridor Railroad Grade Separation
Wichita, KS
HNTBGeotech Eng:
Dondlinger & Sons
Construction Co.Contractor:
TranSystemsProject Manager:
City of WichitaOwner:
SIENNA PARKWAY MSE WALL
MISSOURI CITY, TX
SIENNA PARKWAY MSE WALL
MISSOURI CITY, TX
• Support of 31 ft tall MSE wall on Sienna Parkway
• Geopier RAPs installed at 7 feet o/c.
• 490 Geopier RAPs installed in < 3 weeks.
PICARDY AVENUE MSE WALL SUPPORT
BATON ROUGE, LA
PICARDY AVENUE MSE WALL SUPPORT
BATON ROUGE, LA
RAP solution using Geopier® system
PICARDY AVENUE MSE WALL SUPPORT
BATON ROUGE, LA
PICARDY AVENUE MSE WALL SUPPORT
BATON ROUGE, LA
• 37 ft tall MSE wall
• Soft to stiff clay
• Geopier elements at
5.25 to 8 feet o/c.
• Performed work on
multiple phases
RAP solution using Geopier® system