
KBC Group “Is Benelux boring?” UBS Benelux Financials Conference, September 2006.

Group Financials
RED STAR EXPRESS PLC
UNAUDITED FINANCIAL REPORT
FOR THE PERIOD ENDED 31 DECEMBER 2017
RED STAR EXPRESS PLC
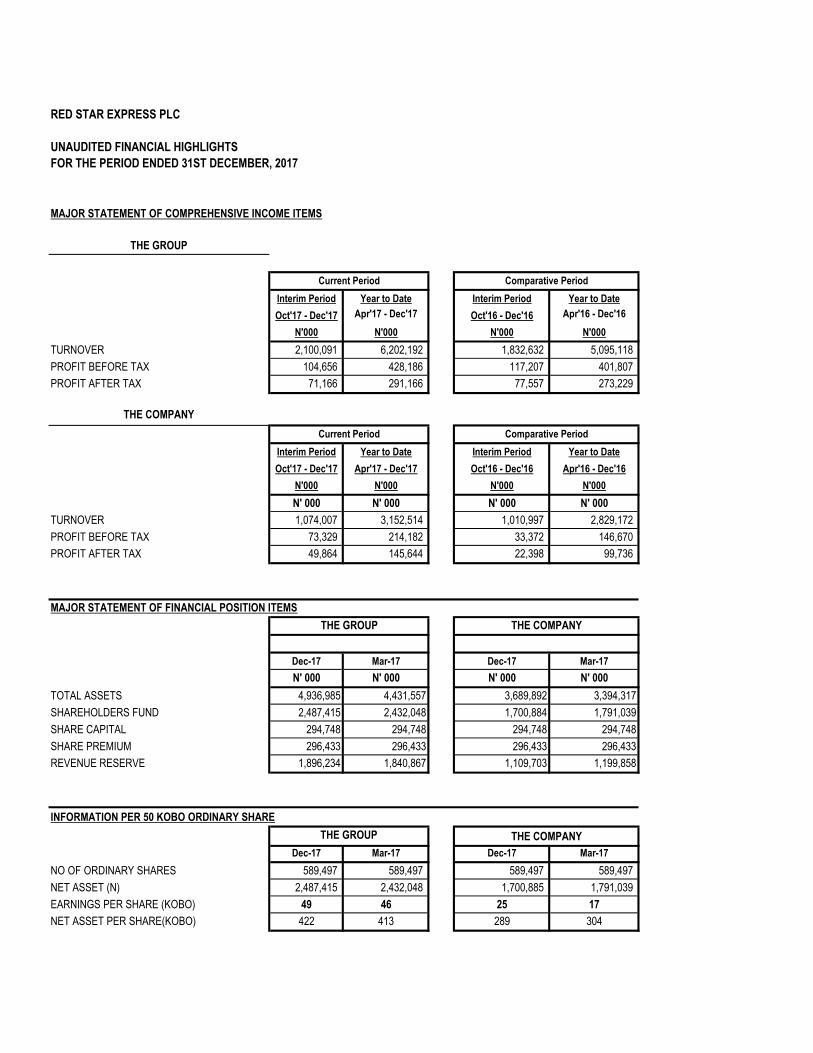
UNAUDITED FINANCIAL HIGHLIGHTS
FOR THE PERIOD ENDED 31ST DECEMBER, 2017
MAJOR STATEMENT OF COMPREHENSIVE INCOME ITEMS
Interim Period Year to Date Interim Period Year to Date
Oct'17 - Dec'17 Apr'17 - Dec'17 Oct'16 - Dec'16 Apr'16 - Dec'16
N'000 N'000 N'000 N'000
TURNOVER 2,100,091 6,202,192 1,832,632 5,095,118
PROFIT BEFORE TAX 104,656 428,186 117,207 401,807
PROFIT AFTER TAX 71,166 291,166 77,557 273,229
Interim Period Year to Date Interim Period Year to Date
Oct'17 - Dec'17 Apr'17 - Dec'17 Oct'16 - Dec'16 Apr'16 - Dec'16
N'000 N'000 N'000 N'000
N' 000 N' 000 N' 000 N' 000
TURNOVER 1,074,007 3,152,514 1,010,997 2,829,172
PROFIT BEFORE TAX 73,329 214,182 33,372 146,670
PROFIT AFTER TAX 49,864 145,644 22,398 99,736
MAJOR STATEMENT OF FINANCIAL POSITION ITEMS
Dec-17 Mar-17 Dec-17 Mar-17
N' 000 N' 000 N' 000 N' 000
TOTAL ASSETS 4,936,985 4,431,557 3,689,892 3,394,317
SHAREHOLDERS FUND 2,487,415 2,432,048 1,700,884 1,791,039
SHARE CAPITAL 294,748 294,748 294,748 294,748
SHARE PREMIUM 296,433 296,433 296,433 296,433
REVENUE RESERVE 1,896,234 1,840,867 1,109,703 1,199,858
INFORMATION PER 50 KOBO ORDINARY SHARE
Dec-17 Mar-17 Dec-17 Mar-17
NO OF ORDINARY SHARES 589,497 589,497 589,497 589,497
NET ASSET (N) 2,487,415 2,432,048 1,700,885 1,791,039
EARNINGS PER SHARE (KOBO) 49 46 25 17
NET ASSET PER SHARE(KOBO) 422 413 289 304
THE GROUP
THE COMPANY
THE COMPANYTHE GROUP
THE GROUP THE COMPANY
Current Period Comparative Period
Current Period Comparative Period
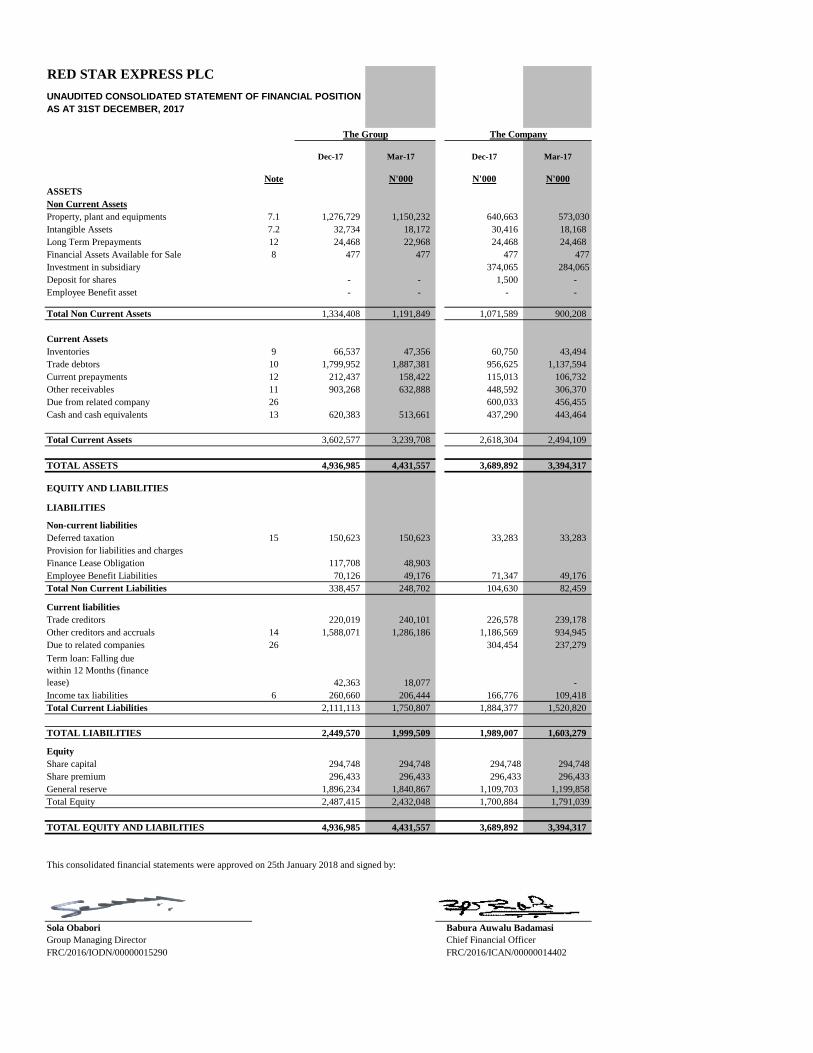
RED STAR EXPRESS PLC
UNAUDITED CONSOLIDATED STATEMENT OF FINANCIAL POSITION
AS AT 31ST DECEMBER, 2017
Dec-17 Mar-17 Dec-17 Mar-17
Note N'000 N'000 N'000
ASSETS
Non Current Assets
Property, plant and equipments 7.1 1,276,729 1,150,232 640,663 573,030
Intangible Assets 7.2 32,734 18,172 30,416 18,168
Long Term Prepayments 12 24,468 22,968 24,468 24,468
Financial Assets Available for Sale 8 477 477 477 477
Investment in subsidiary 374,065 284,065
Deposit for shares - - 1,500 -
Employee Benefit asset - - - -
Total Non Current Assets 1,334,408 1,191,849 1,071,589 900,208
Current Assets
Inventories 9 66,537 47,356 60,750 43,494
Trade debtors 10 1,799,952 1,887,381 956,625 1,137,594
Current prepayments 12 212,437 158,422 115,013 106,732
Other receivables 11 903,268 632,888 448,592 306,370
Due from related company 26 600,033 456,455
Cash and cash equivalents 13 620,383 513,661 437,290 443,464
Total Current Assets 3,602,577 3,239,708 2,618,304 2,494,109
TOTAL ASSETS 4,936,985 4,431,557 3,689,892 3,394,317
EQUITY AND LIABILITIES
LIABILITIES
Non-current liabilities
Deferred taxation 15 150,623 150,623 33,283 33,283
Provision for liabilities and charges
Finance Lease Obligation 117,708 48,903
Employee Benefit Liabilities 70,126 49,176 71,347 49,176
Total Non Current Liabilities 338,457 248,702 104,630 82,459
Current liabilities
Trade creditors 220,019 240,101 226,578 239,178
Other creditors and accruals 14 1,588,071 1,286,186 1,186,569 934,945
Due to related companies 26 304,454 237,279
Term loan: Falling due
within 12 Months (finance
lease) 42,363 18,077 -
Income tax liabilities 6 260,660 206,444 166,776 109,418
Total Current Liabilities 2,111,113 1,750,807 1,884,377 1,520,820
TOTAL LIABILITIES 2,449,570 1,999,509 1,989,007 1,603,279
Equity
Share capital 294,748 294,748 294,748 294,748
Share premium 296,433 296,433 296,433 296,433
General reserve 1,896,234 1,840,867 1,109,703 1,199,858
Total Equity 2,487,415 2,432,048 1,700,884 1,791,039
TOTAL EQUITY AND LIABILITIES 4,936,985 4,431,557 3,689,892 3,394,317
Sola Obabori Babura Auwalu Badamasi
Group Managing Director Chief Financial Officer
FRC/2016/IODN/00000015290 FRC/2016/ICAN/00000014402
The CompanyThe Group
This consolidated financial statements were approved on 25th January 2018 and signed by:
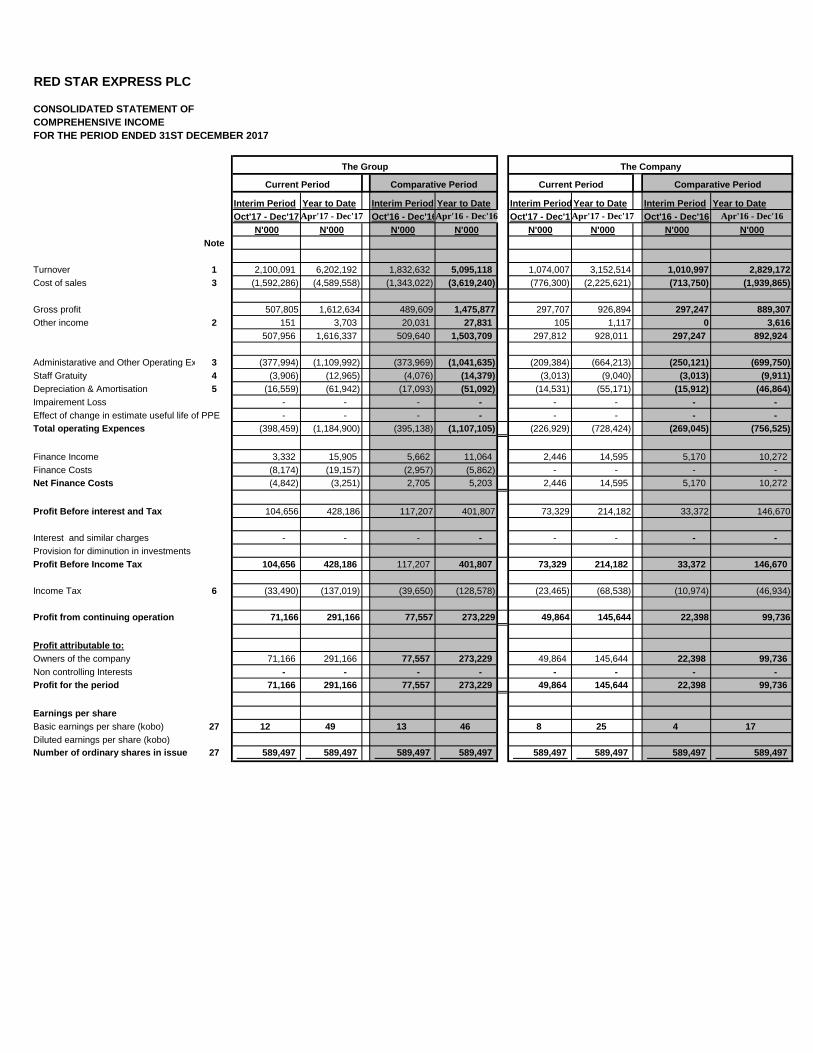
RED STAR EXPRESS PLC
CONSOLIDATED STATEMENT OF
COMPREHENSIVE INCOME
FOR THE PERIOD ENDED 31ST DECEMBER 2017
Interim Period Year to Date Interim Period Year to Date Interim PeriodYear to Date Interim Period Year to Date
Oct'17 - Dec'17 Apr'17 - Dec'17 Oct'16 - Dec'16Apr'16 - Dec'16 Oct'17 - Dec'17Apr'17 - Dec'17 Oct'16 - Dec'16 Apr'16 - Dec'16
N'000 N'000 N'000 N'000 N'000 N'000 N'000 N'000
Note
Turnover 1 2,100,091 6,202,192 1,832,632 5,095,118 1,074,007 3,152,514 1,010,997 2,829,172
Cost of sales 3 (1,592,286) (4,589,558) (1,343,022) (3,619,240) (776,300) (2,225,621) (713,750) (1,939,865)
Gross profit 507,805 1,612,634 489,609 1,475,877 297,707 926,894 297,247 889,307
Other income 2 151 3,703 20,031 27,831 105 1,117 0 3,616
507,956 1,616,337 509,640 1,503,709 297,812 928,011 297,247 892,924
Administarative and Other Operating Expences3 (377,994) (1,109,992) (373,969) (1,041,635) (209,384) (664,213) (250,121) (699,750)
Staff Gratuity 4 (3,906) (12,965) (4,076) (14,379) (3,013) (9,040) (3,013) (9,911)
Depreciation & Amortisation 5 (16,559) (61,942) (17,093) (51,092) (14,531) (55,171) (15,912) (46,864)
Impairement Loss - - - - - - - -
Effect of change in estimate useful life of PPE - - - - - - - -
Total operating Expences (398,459) (1,184,900) (395,138) (1,107,105) (226,929) (728,424) (269,045) (756,525)
Finance Income 3,332 15,905 5,662 11,064 2,446 14,595 5,170 10,272
Finance Costs (8,174) (19,157) (2,957) (5,862) - - - -
Net Finance Costs (4,842) (3,251) 2,705 5,203 2,446 14,595 5,170 10,272
Profit Before interest and Tax 104,656 428,186 117,207 401,807 73,329 214,182 33,372 146,670
Interest and similar charges - - - - - - - -
Provision for diminution in investments
Profit Before Income Tax 104,656 428,186 117,207 401,807 73,329 214,182 33,372 146,670
Income Tax 6 (33,490) (137,019) (39,650) (128,578) (23,465) (68,538) (10,974) (46,934)
Profit from continuing operation 71,166 291,166 77,557 273,229 49,864 145,644 22,398 99,736
Profit attributable to:
Owners of the company 71,166 291,166 77,557 273,229 49,864 145,644 22,398 99,736
Non controlling Interests - - - - - - - -
Profit for the period 71,166 291,166 77,557 273,229 49,864 145,644 22,398 99,736
Earnings per share
Basic earnings per share (kobo) 27 12 49 13 46 8 25 4 17
Diluted earnings per share (kobo)
Number of ordinary shares in issue 27 589,497 589,497 589,497 589,497 589,497 589,497 589,497 589,497
The Group
Current Period Comparative Period
The Company
Current Period Comparative Period
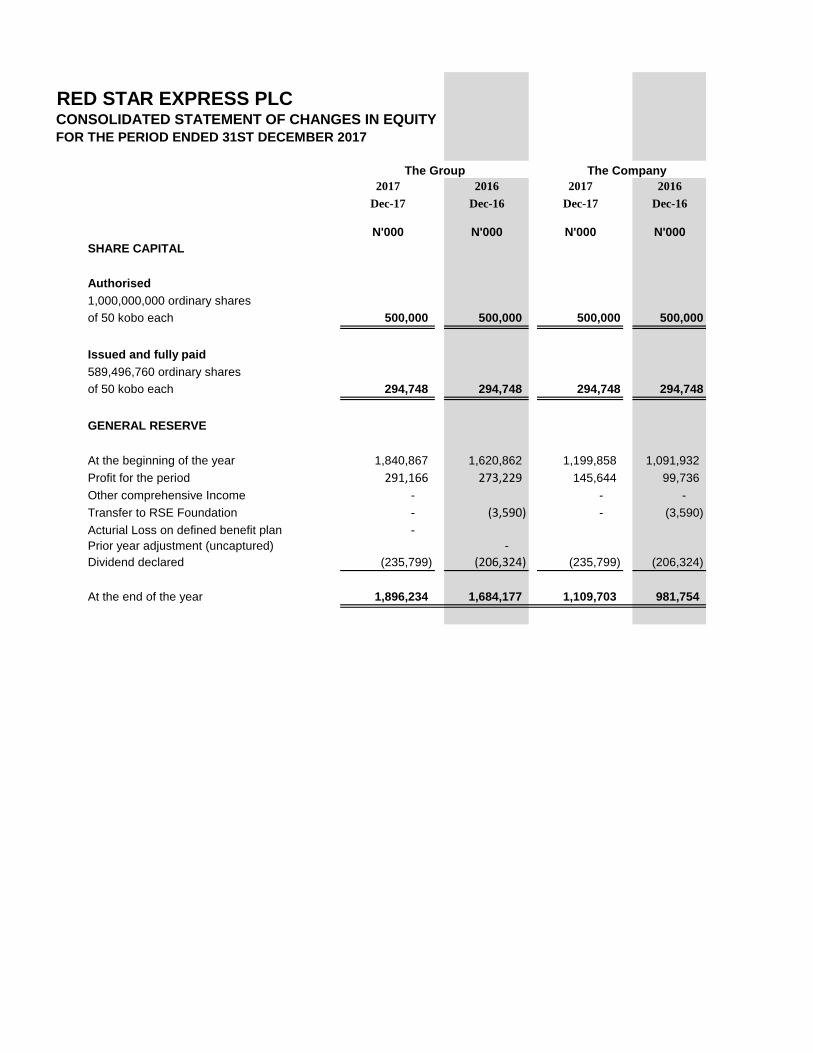
RED STAR EXPRESS PLCCONSOLIDATED STATEMENT OF CHANGES IN EQUITY
FOR THE PERIOD ENDED 31ST DECEMBER 2017
2017 2016 2017 2016
Dec-17 Dec-16 Dec-17 Dec-16
N'000 N'000 N'000 N'000
SHARE CAPITAL
Authorised
1,000,000,000 ordinary shares
of 50 kobo each 500,000 500,000 500,000 500,000
Issued and fully paid
589,496,760 ordinary shares
of 50 kobo each 294,748 294,748 294,748 294,748
GENERAL RESERVE
At the beginning of the year 1,840,867 1,620,862 1,199,858 1,091,932
Profit for the period 291,166 273,229 145,644 99,736
Other comprehensive Income - - -
Transfer to RSE Foundation - (3,590) - (3,590)
Acturial Loss on defined benefit plan -
Prior year adjustment (uncaptured) -
Dividend declared (235,799) (206,324) (235,799) (206,324)
At the end of the year 1,896,234 1,684,177 1,109,703 981,754
The Group The Company
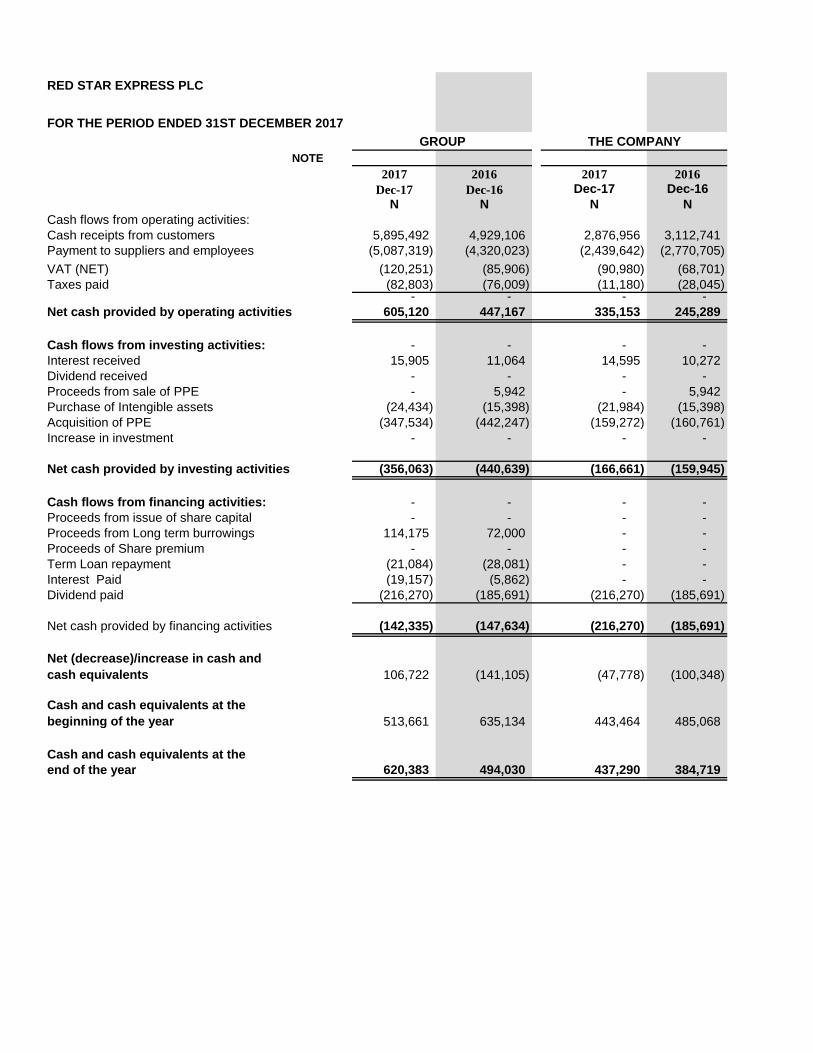
RED STAR EXPRESS PLC
FOR THE PERIOD ENDED 31ST DECEMBER 2017
NOTE
2017 2016 2017 2016
Dec-17 Dec-16 Dec-17 Dec-16
N N N N
Cash flows from operating activities:
Cash receipts from customers 5,895,492 4,929,106 2,876,956 3,112,741
Payment to suppliers and employees (5,087,319) (4,320,023) (2,439,642) (2,770,705)
VAT (NET) (120,251) (85,906) (90,980) (68,701)
Taxes paid (82,803) (76,009) (11,180) (28,045) - - - -
Net cash provided by operating activities 605,120 447,167 335,153 245,289
Cash flows from investing activities: - - - -
Interest received 15,905 11,064 14,595 10,272
Dividend received - - - -
Proceeds from sale of PPE - 5,942 - 5,942
Purchase of Intengible assets (24,434) (15,398) (21,984) (15,398)
Acquisition of PPE (347,534) (442,247) (159,272) (160,761)
Increase in investment - - - -
Net cash provided by investing activities (356,063) (440,639) (166,661) (159,945)
Cash flows from financing activities: - - - -
Proceeds from issue of share capital - - - -
Proceeds from Long term burrowings 114,175 72,000 - -
Proceeds of Share premium - - - -
Term Loan repayment (21,084) (28,081) - -
Interest Paid (19,157) (5,862) - -
Dividend paid (216,270) (185,691) (216,270) (185,691)
Net cash provided by financing activities (142,335) (147,634) (216,270) (185,691)
Net (decrease)/increase in cash and
cash equivalents 106,722 (141,105) (47,778) (100,348)
Cash and cash equivalents at the
beginning of the year 513,661 635,134 443,464 485,068
Cash and cash equivalents at the
end of the year 620,383 494,030 437,290 384,719
GROUP THE COMPANY
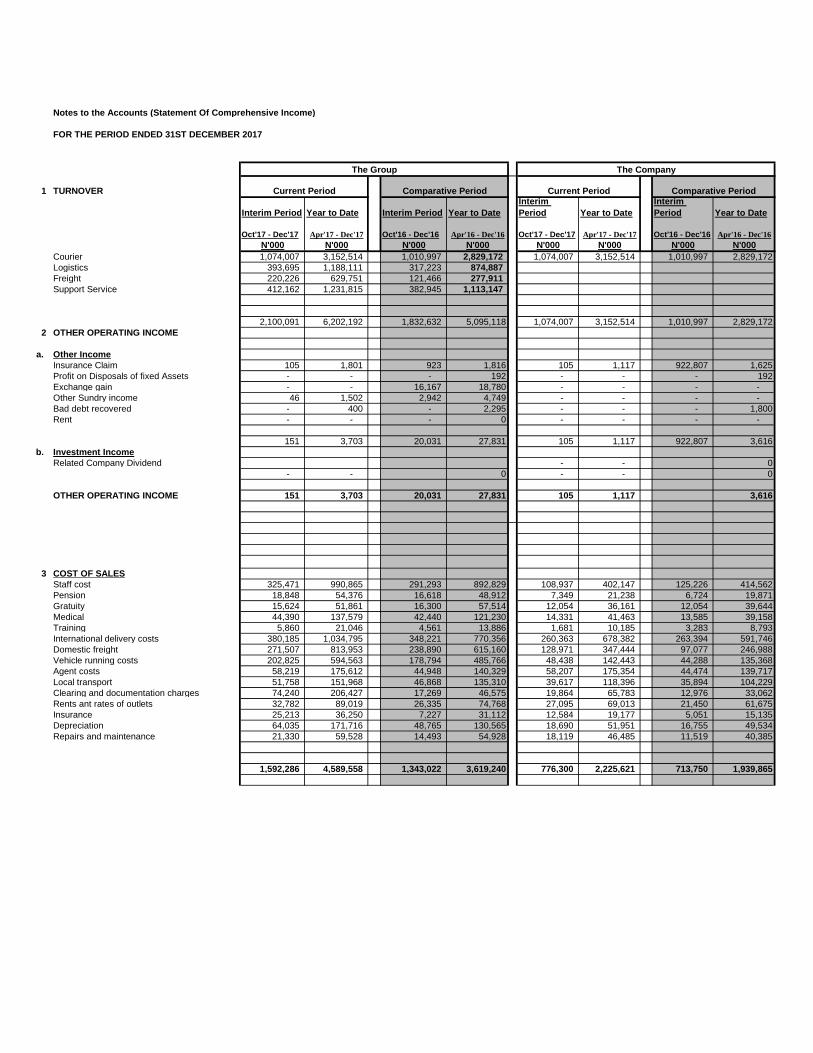
Notes to the Accounts (Statement Of Comprehensive Income)
FOR THE PERIOD ENDED 31ST DECEMBER 2017
1 TURNOVER
Interim Period Year to Date Interim Period Year to Date
Interim
Period Year to Date
Interim
Period Year to Date
Oct'17 - Dec'17 Apr'17 - Dec'17 Oct'16 - Dec'16 Apr'16 - Dec'16 Oct'17 - Dec'17 Apr'17 - Dec'17 Oct'16 - Dec'16 Apr'16 - Dec'16
N'000 N'000 N'000 N'000 N'000 N'000 N'000 N'000
Courier 1,074,007 3,152,514 1,010,997 2,829,172 1,074,007 3,152,514 1,010,997 2,829,172
Logistics 393,695 1,188,111 317,223 874,887
Freight 220,226 629,751 121,466 277,911
Support Service 412,162 1,231,815 382,945 1,113,147
2,100,091 6,202,192 1,832,632 5,095,118 1,074,007 3,152,514 1,010,997 2,829,172
2 OTHER OPERATING INCOME
a. Other Income
Insurance Claim 105 1,801 923 1,816 105 1,117 922,807 1,625
Profit on Disposals of fixed Assets - - - 192 - - - 192
Exchange gain - - 16,167 18,780 - - - -
Other Sundry income 46 1,502 2,942 4,749 - - - -
Bad debt recovered - 400 - 2,295 - - - 1,800
Rent - - - 0 - - - -
151 3,703 20,031 27,831 105 1,117 922,807 3,616
b. Investment Income
Related Company Dividend - - 0
- - 0 - - 0
OTHER OPERATING INCOME 151 3,703 20,031 27,831 105 1,117 3,616
3 COST OF SALES
Staff cost 325,471 990,865 291,293 892,829 108,937 402,147 125,226 414,562
Pension 18,848 54,376 16,618 48,912 7,349 21,238 6,724 19,871
Gratuity 15,624 51,861 16,300 57,514 12,054 36,161 12,054 39,644
Medical 44,390 137,579 42,440 121,230 14,331 41,463 13,585 39,158
Training 5,860 21,046 4,561 13,886 1,681 10,185 3,283 8,793
International delivery costs 380,185 1,034,795 348,221 770,356 260,363 678,382 263,394 591,746
Domestic freight 271,507 813,953 238,890 615,160 128,971 347,444 97,077 246,988
Vehicle running costs 202,825 594,563 178,794 485,766 48,438 142,443 44,288 135,368
Agent costs 58,219 175,612 44,948 140,329 58,207 175,354 44,474 139,717
Local transport 51,758 151,968 46,868 135,310 39,617 118,396 35,894 104,229
Clearing and documentation charges 74,240 206,427 17,269 46,575 19,864 65,783 12,976 33,062
Rents ant rates of outlets 32,782 89,019 26,335 74,768 27,095 69,013 21,450 61,675
Insurance 25,213 36,250 7,227 31,112 12,584 19,177 5,051 15,135
Depreciation 64,035 171,716 48,765 130,565 18,690 51,951 16,755 49,534
Repairs and maintenance 21,330 59,528 14,493 54,928 18,119 46,485 11,519 40,385
1,592,286 4,589,558 1,343,022 3,619,240 776,300 2,225,621 713,750 1,939,865
The Group The Company
Current Period Comparative Period Current Period Comparative Period
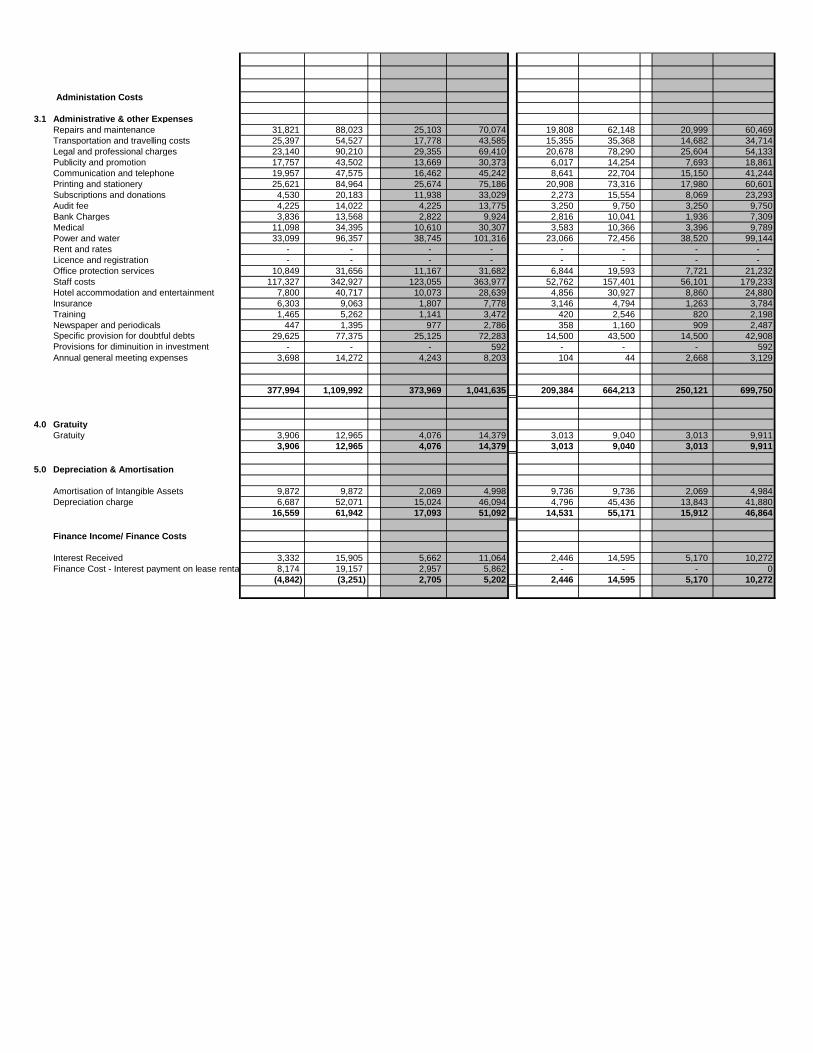
Administation Costs
3.1 Administrative & other Expenses
Repairs and maintenance 31,821 88,023 25,103 70,074 19,808 62,148 20,999 60,469
Transportation and travelling costs 25,397 54,527 17,778 43,585 15,355 35,368 14,682 34,714
Legal and professional charges 23,140 90,210 29,355 69,410 20,678 78,290 25,604 54,133
Publicity and promotion 17,757 43,502 13,669 30,373 6,017 14,254 7,693 18,861
Communication and telephone 19,957 47,575 16,462 45,242 8,641 22,704 15,150 41,244
Printing and stationery 25,621 84,964 25,674 75,186 20,908 73,316 17,980 60,601
Subscriptions and donations 4,530 20,183 11,938 33,029 2,273 15,554 8,069 23,293
Audit fee 4,225 14,022 4,225 13,775 3,250 9,750 3,250 9,750
Bank Charges 3,836 13,568 2,822 9,924 2,816 10,041 1,936 7,309
Medical 11,098 34,395 10,610 30,307 3,583 10,366 3,396 9,789
Power and water 33,099 96,357 38,745 101,316 23,066 72,456 38,520 99,144
Rent and rates - - - - - - - -
Licence and registration - - - - - - - -
Office protection services 10,849 31,656 11,167 31,682 6,844 19,593 7,721 21,232
Staff costs 117,327 342,927 123,055 363,977 52,762 157,401 56,101 179,233
Hotel accommodation and entertainment 7,800 40,717 10,073 28,639 4,856 30,927 8,860 24,880
Insurance 6,303 9,063 1,807 7,778 3,146 4,794 1,263 3,784
Training 1,465 5,262 1,141 3,472 420 2,546 820 2,198
Newspaper and periodicals 447 1,395 977 2,786 358 1,160 909 2,487
Specific provision for doubtful debts 29,625 77,375 25,125 72,283 14,500 43,500 14,500 42,908
Provisions for diminuition in investment - - - 592 - - - 592
Annual general meeting expenses 3,698 14,272 4,243 8,203 104 44 2,668 3,129
377,994 1,109,992 373,969 1,041,635 209,384 664,213 250,121 699,750
4.0 Gratuity
Gratuity 3,906 12,965 4,076 14,379 3,013 9,040 3,013 9,911
3,906 12,965 4,076 14,379 3,013 9,040 3,013 9,911
5.0 Depreciation & Amortisation
Amortisation of Intangible Assets 9,872 9,872 2,069 4,998 9,736 9,736 2,069 4,984
Depreciation charge 6,687 52,071 15,024 46,094 4,796 45,436 13,843 41,880
16,559 61,942 17,093 51,092 14,531 55,171 15,912 46,864
Finance Income/ Finance Costs
Interest Received 3,332 15,905 5,662 11,064 2,446 14,595 5,170 10,272
Finance Cost - Interest payment on lease rentals 8,174 19,157 2,957 5,862 - - - 0
(4,842) (3,251) 2,705 5,202 2,446 14,595 5,170 10,272
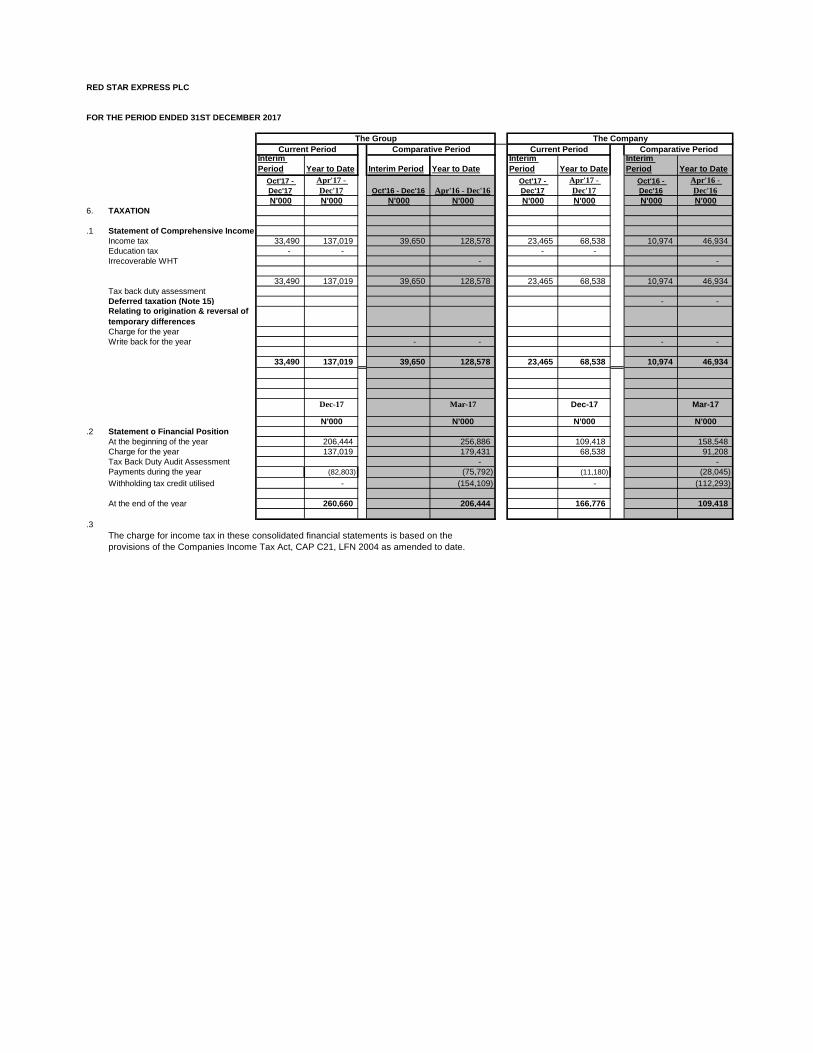
RED STAR EXPRESS PLC
FOR THE PERIOD ENDED 31ST DECEMBER 2017
Interim
Period Year to Date Interim Period Year to Date
Interim
Period Year to Date
Interim
Period Year to Date
Oct'17 -
Dec'17
Apr'17 -
Dec'17 Oct'16 - Dec'16 Apr'16 - Dec'16
Oct'17 -
Dec'17
Apr'17 -
Dec'17
Oct'16 -
Dec'16
Apr'16 -
Dec'16
N'000 N'000 N'000 N'000 N'000 N'000 N'000 N'000
6. TAXATION
.1 Statement of Comprehensive Income
Income tax 33,490 137,019 39,650 128,578 23,465 68,538 10,974 46,934
Education tax - - - -
Irrecoverable WHT - -
33,490 137,019 39,650 128,578 23,465 68,538 10,974 46,934
Tax back duty assessment
Deferred taxation (Note 15) - -
Relating to origination & reversal of
temporary differences
Charge for the year
Write back for the year - - - -
33,490 137,019 39,650 128,578 23,465 68,538 10,974 46,934
Dec-17 Mar-17 Dec-17 Mar-17
N'000 N'000 N'000 N'000
.2 Statement o Financial Position
At the beginning of the year 206,444 256,886 109,418 158,548
Charge for the year 137,019 179,431 68,538 91,208
Tax Back Duty Audit Assessment - -
Payments during the year (82,803) (75,792) (11,180) (28,045)
Withholding tax credit utilised - (154,109) - (112,293)
At the end of the year 260,660 206,444 166,776 109,418
.3
The charge for income tax in these consolidated financial statements is based on the
provisions of the Companies Income Tax Act, CAP C21, LFN 2004 as amended to date.
The Group The Company
Current Period Comparative Period Current Period Comparative Period
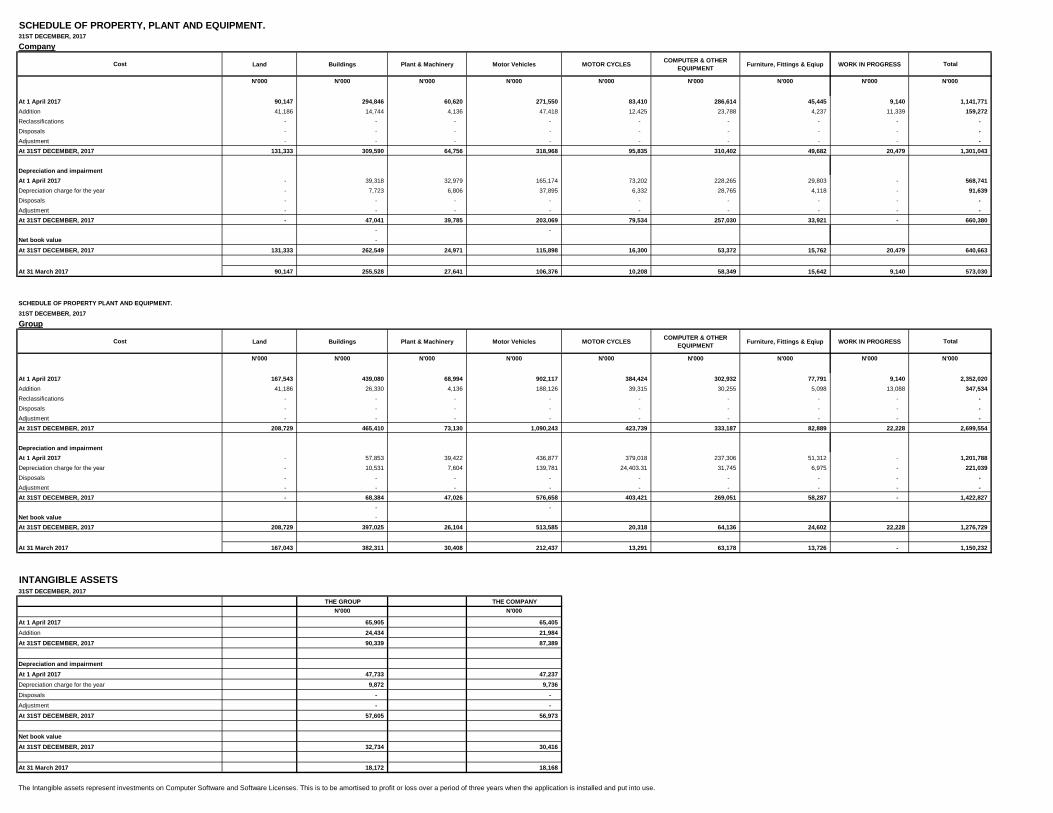
SCHEDULE OF PROPERTY, PLANT AND EQUIPMENT.31ST DECEMBER, 2017
Company
Cost Land Buildings Plant & Machinery Motor Vehicles MOTOR CYCLESCOMPUTER & OTHER
EQUIPMENTFurniture, Fittings & Eqiup WORK IN PROGRESS Total
N'000 N'000 N'000 N'000 N'000 N'000 N'000 N'000 N'000
At 1 April 2017 90,147 294,846 60,620 271,550 83,410 286,614 45,445 9,140 1,141,771
Addition 41,186 14,744 4,136 47,418 12,425 23,788 4,237 11,339 159,272
Reclassifications - - - - - - - - -
Disposals - - - - - - - - -
Adjustment - - - - - - - - -
At 31ST DECEMBER, 2017 131,333 309,590 64,756 318,968 95,835 310,402 49,682 20,479 1,301,043
Depreciation and impairment
At 1 April 2017 - 39,318 32,979 165,174 73,202 228,265 29,803 - 568,741
Depreciation charge for the year - 7,723 6,806 37,895 6,332 28,765 4,118 - 91,639
Disposals - - - - - - - - -
Adjustment - - - - - - - - -
At 31ST DECEMBER, 2017 - 47,041 39,785 203,069 79,534 257,030 33,921 - 660,380
- -
Net book value -
At 31ST DECEMBER, 2017 131,333 262,549 24,971 115,898 16,300 53,372 15,762 20,479 640,663
At 31 March 2017 90,147 255,528 27,641 106,376 10,208 58,349 15,642 9,140 573,030
2017/006
SCHEDULE OF PROPERTY PLANT AND EQUIPMENT.
31ST DECEMBER, 2017
Group
Cost Land Buildings Plant & Machinery Motor Vehicles MOTOR CYCLESCOMPUTER & OTHER
EQUIPMENTFurniture, Fittings & Eqiup WORK IN PROGRESS Total
N'000 N'000 N'000 N'000 N'000 N'000 N'000 N'000 N'000
At 1 April 2017 167,543 439,080 68,994 902,117 384,424 302,932 77,791 9,140 2,352,020
Addition 41,186 26,330 4,136 188,126 39,315 30,255 5,098 13,088 347,534
Reclassifications - - - - - - - - -
Disposals - - - - - - - - -
Adjustment - - - - - - - - -
At 31ST DECEMBER, 2017 208,729 465,410 73,130 1,090,243 423,739 333,187 82,889 22,228 2,699,554
Depreciation and impairment
At 1 April 2017 - 57,853 39,422 436,877 379,018 237,306 51,312 - 1,201,788
Depreciation charge for the year - 10,531 7,604 139,781 24,403.31 31,745 6,975 - 221,039
Disposals - - - - - - - - -
Adjustment - - - - - - - - -
At 31ST DECEMBER, 2017 - 68,384 47,026 576,658 403,421 269,051 58,287 - 1,422,827
- -
Net book value -
At 31ST DECEMBER, 2017 208,729 397,025 26,104 513,585 20,318 64,136 24,602 22,228 1,276,729
At 31 March 2017 167,043 382,311 30,408 212,437 13,291 63,178 13,726 - 1,150,232
INTANGIBLE ASSETS31ST DECEMBER, 2017
THE GROUP THE COMPANY
N'000 N'000
At 1 April 2017 65,905 65,405
Addition 24,434 21,984
At 31ST DECEMBER, 2017 90,339 87,389
Depreciation and impairment
At 1 April 2017 47,733 47,237
Depreciation charge for the year 9,872 9,736
Disposals - -
Adjustment - -
At 31ST DECEMBER, 2017 57,605 56,973
Net book value
At 31ST DECEMBER, 2017 32,734 30,416
At 31 March 2017 18,172 18,168
The Intangible assets represent investments on Computer Software and Software Licenses. This is to be amortised to profit or loss over a period of three years when the application is installed and put into use.
RED STAR EXPRESS PLC
NOTES TO THE CONSOLIDATED FINANCIAL STATEMENTS
FOR THE PERIOD ENDED 31ST DECEMBER 2017
2017 2017 2017 2017
DEC MAR DEC MAR
N'000 N'000 N'000 N'000
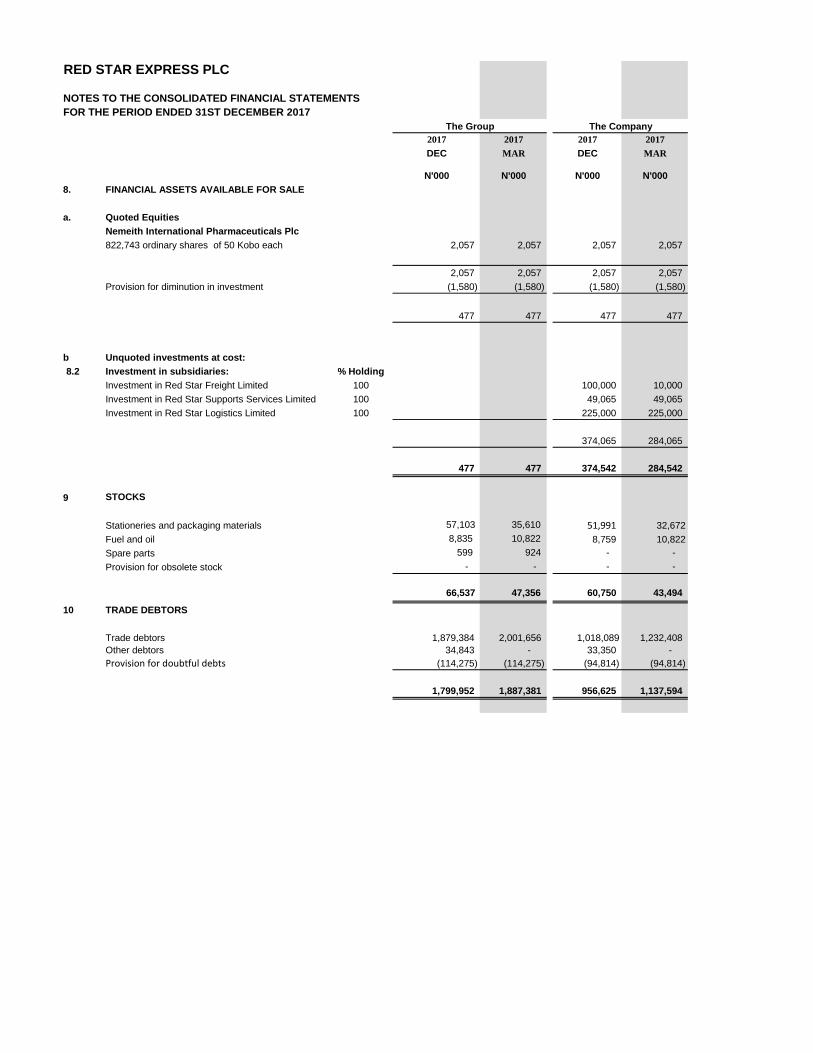
8. FINANCIAL ASSETS AVAILABLE FOR SALE
a. Quoted Equities
Nemeith International Pharmaceuticals Plc
822,743 ordinary shares of 50 Kobo each 2,057 2,057 2,057 2,057
2,057 2,057 2,057 2,057
Provision for diminution in investment (1,580) (1,580) (1,580) (1,580)
477 477 477 477
b Unquoted investments at cost:
8.2 Investment in subsidiaries: % Holding
Investment in Red Star Freight Limited 100 100,000 10,000
Investment in Red Star Supports Services Limited 100 49,065 49,065
Investment in Red Star Logistics Limited 100 225,000 225,000
374,065 284,065
477 477 374,542 284,542
9 STOCKS
Stationeries and packaging materials 57,103 35,610 51,991 32,672
Fuel and oil 8,835 10,822 8,759 10,822
Spare parts 599 924 - -
Provision for obsolete stock - - - -
66,537 47,356 60,750 43,494
10 TRADE DEBTORS
Trade debtors 1,879,384 2,001,656 1,018,089 1,232,408
Other debtors 34,843 - 33,350 -
Provision for doubtful debts (114,275) (114,275) (94,814) (94,814)
1,799,952 1,887,381 956,625 1,137,594
The Group The Company
RED STAR EXPRESS PLC
FOR THE PERIOD ENDED 31ST DECEMBER 2017
2017 2017 2017 2017
DEC MAR DEC MAR
N'000 N'000 N'000 N'000
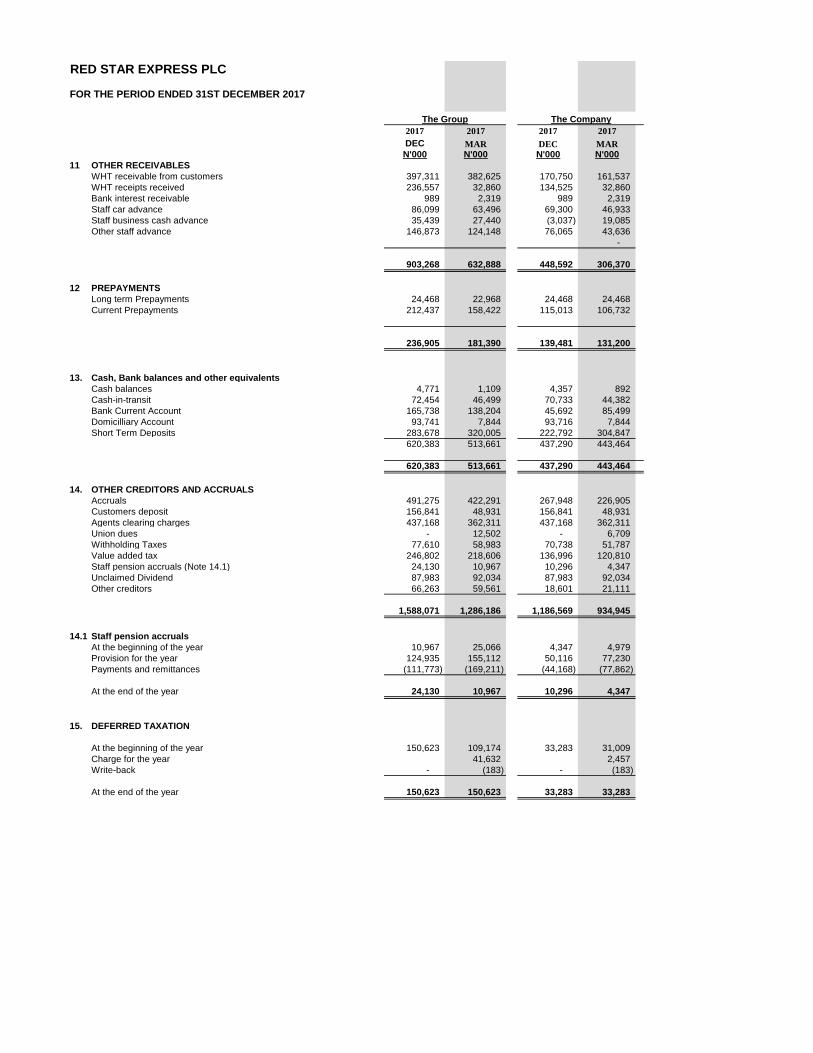
11 OTHER RECEIVABLES
WHT receivable from customers 397,311 382,625 170,750 161,537
WHT receipts received 236,557 32,860 134,525 32,860
Bank interest receivable 989 2,319 989 2,319
Staff car advance 86,099 63,496 69,300 46,933
Staff business cash advance 35,439 27,440 (3,037) 19,085
Other staff advance 146,873 124,148 76,065 43,636
-
903,268 632,888 448,592 306,370
12 PREPAYMENTS
Long term Prepayments 24,468 22,968 24,468 24,468
Current Prepayments 212,437 158,422 115,013 106,732
236,905 181,390 139,481 131,200
13. Cash, Bank balances and other equivalents
Cash balances 4,771 1,109 4,357 892
Cash-in-transit 72,454 46,499 70,733 44,382
Bank Current Account 165,738 138,204 45,692 85,499
Domicilliary Account 93,741 7,844 93,716 7,844
Short Term Deposits 283,678 320,005 222,792 304,847
620,383 513,661 437,290 443,464
620,383 513,661 437,290 443,464
14. OTHER CREDITORS AND ACCRUALS
Accruals 491,275 422,291 267,948 226,905
Customers deposit 156,841 48,931 156,841 48,931
Agents clearing charges 437,168 362,311 437,168 362,311
Union dues - 12,502 - 6,709
Withholding Taxes 77,610 58,983 70,738 51,787
Value added tax 246,802 218,606 136,996 120,810
Staff pension accruals (Note 14.1) 24,130 10,967 10,296 4,347
Unclaimed Dividend 87,983 92,034 87,983 92,034
Other creditors 66,263 59,561 18,601 21,111
1,588,071 1,286,186 1,186,569 934,945
14.1 Staff pension accruals
At the beginning of the year 10,967 25,066 4,347 4,979
Provision for the year 124,935 155,112 50,116 77,230
Payments and remittances (111,773) (169,211) (44,168) (77,862)
At the end of the year 24,130 10,967 10,296 4,347
15. DEFERRED TAXATION
At the beginning of the year 150,623 109,174 33,283 31,009
Charge for the year 41,632 2,457
Write-back - (183) - (183)
At the end of the year 150,623 150,623 33,283 33,283
The CompanyThe Group

RED STAR EXPRESS PLC
NOTES TO THE CONSOLIDATED FINANCIAL STATEMENTS
AS AT 31ST DECEMBER, 2017
2017 2016 2017 2016
Dec-17 Dec-16 Dec-17 Dec-16
N'000 N'000 N'000 N'000
19. RECONCILIATION OF NET PROFIT AFTER TAXATION
TO CASH PROVIDED BY OPERATING ACTIVITIES
Net profit after taxation 291,166 273,229 145,644 99,736
Adjustment to reconcile net income to
net cash provided by operating:
Depreciation 230,911 181,657 101,375 96,398
Interest income (15,905) (11,064) (14,595) (10,272)
Interest paid (Interest expense) 19,157 5,862 -
Provision for diminution in investments - - - -
(Profit)/loss on disposal of fixed assets - (192) - (192)
Loss on disposal of investment - - - -
Adjustment to investment - - (90,000) -
Adjustment to fixed assets - - - -
Impairment in receivables - - - -
Dividend received - - - -
Changes in assets and liabilities:
(Increase)/decrease in stocks (19,181) 315 (17,256) (2,524)
(Increase)/decrease in trade debtors 87,429 (174,045) 180,969 (39,787)
(Increase)/Decrease in other debtors and prepayments (324,395) (69,755) (213,133) (6,155)
Decrease/(increase) in due from related companies (143,578) (36,542)
Decrease/(increase) in term Loans (21,031) (43,919) - -
(Decrease)/increase in trade creditors (20,082) 44,024 (12,600) 32,813
Increase/(decrease) in other creditors and accruals 301,885 297,096 251,624 93,742
Increase/(decrease) in due to related companies 67,175 108,909
(Decrease)/increase in taxation 54,216 (101,622) 57,358 (93,404)
(Decrease)/increase in deferred taxation - 5,381 -
Increase/(decrease) in staff Pension -
Increase/(decrease) in employee benefits 20,950 44,060 22,171 39,579
313,954 173,939 189,511 145,554
Net cash provided by operating activities 605,120 447,168 335,153 245,290
The Group The Company
RED STAR EXPRESS PLC
NOTES TO THE CONSOLIDATED FINANCIAL STATEMENTS
FOR THE PERIOD ENDED 31ST DECEMBER 2017
2017 2016 2017 2016
Dec-17 Dec-16 Dec-17 Dec-16
N'000 N'000 N'000 N'000
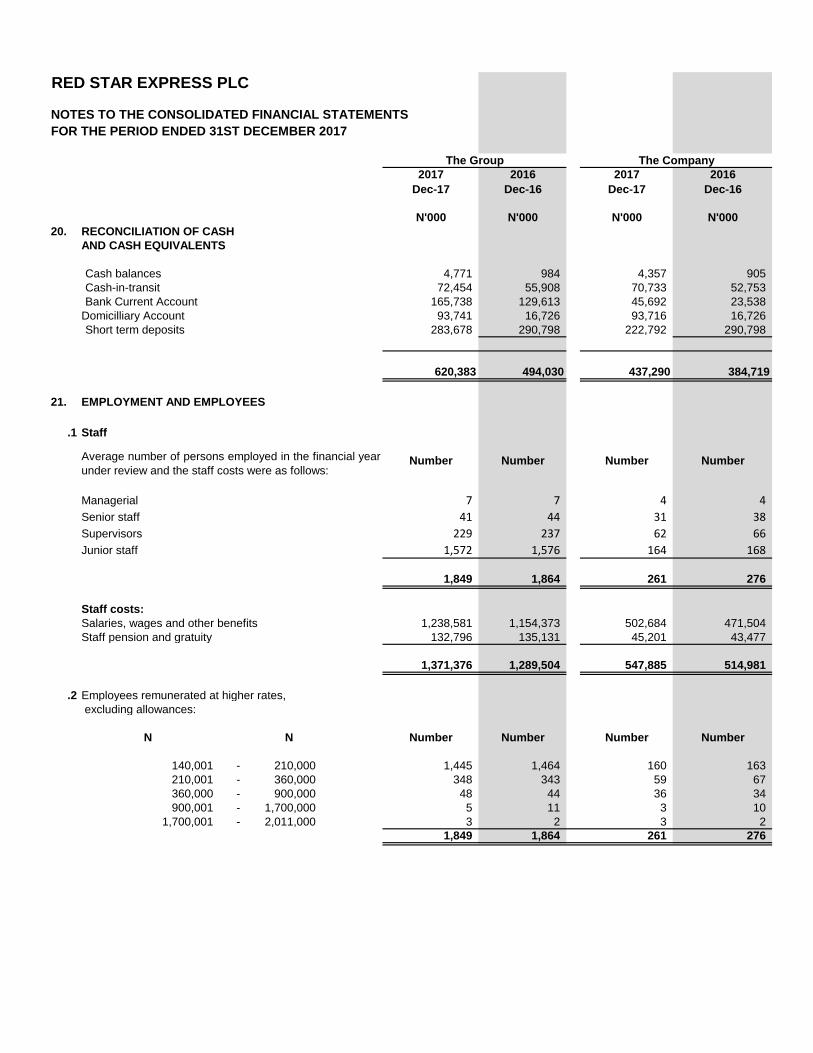
20. RECONCILIATION OF CASH
AND CASH EQUIVALENTS
Cash balances 4,771 984 4,357 905
Cash-in-transit 72,454 55,908 70,733 52,753
Bank Current Account 165,738 129,613 45,692 23,538
Domicilliary Account 93,741 16,726 93,716 16,726
Short term deposits 283,678 290,798 222,792 290,798
620,383 494,030 437,290 384,719
21. EMPLOYMENT AND EMPLOYEES
.1 Staff
Number Number Number Number
Managerial 7 7 4 4
Senior staff 41 44 31 38
Supervisors 229 237 62 66
Junior staff 1,572 1,576 164 168
1,849 1,864 261 276
Staff costs:
Salaries, wages and other benefits 1,238,581 1,154,373 502,684 471,504
Staff pension and gratuity 132,796 135,131 45,201 43,477
1,371,376 1,289,504 547,885 514,981
.2 Employees remunerated at higher rates,
excluding allowances:
N N Number Number Number Number
140,001 - 210,000 1,445 1,464 160 163
210,001 - 360,000 348 343 59 67
360,000 - 900,000 48 44 36 34
900,001 - 1,700,000 5 11 3 10
1,700,001 - 2,011,000 3 2 3 2
1,849 1,864 261 276
Average number of persons employed in the financial year
under review and the staff costs were as follows:
The Group The Company
RED STAR EXPRESS PLC
NOTES TO THE CONSOLIDATED FINANCIAL STATEMENTS
FOR THE PERIOD ENDED 31ST DECEMBER 2017
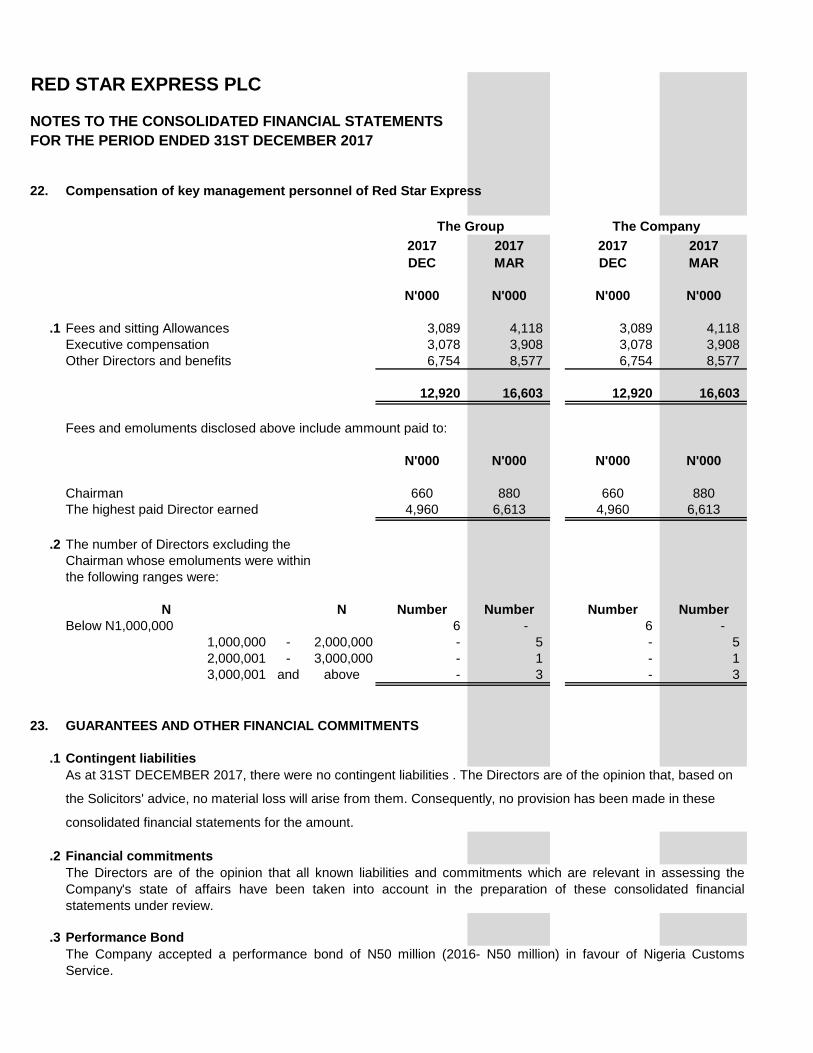
22. Compensation of key management personnel of Red Star Express
2017 2017 2017 2017
DEC MAR DEC MAR
N'000 N'000 N'000 N'000
.1 Fees and sitting Allowances 3,089 4,118 3,089 4,118
Executive compensation 3,078 3,908 3,078 3,908
Other Directors and benefits 6,754 8,577 6,754 8,577
12,920 16,603 12,920 16,603
Fees and emoluments disclosed above include ammount paid to:
N'000 N'000 N'000 N'000
Chairman 660 880 660 880
The highest paid Director earned 4,960 6,613 4,960 6,613
.2 The number of Directors excluding the
Chairman whose emoluments were within
the following ranges were:
N N Number Number Number Number
Below N1,000,000 6 - 6 -
1,000,000 - 2,000,000 - 5 - 5
2,000,001 - 3,000,000 - 1 - 1
3,000,001 and above - 3 - 3
23. GUARANTEES AND OTHER FINANCIAL COMMITMENTS
.1 Contingent liabilities
.2 Financial commitments
.3 Performance Bond
As at 31ST DECEMBER 2017, there were no contingent liabilities . The Directors are of the opinion that, based on
the Solicitors' advice, no material loss will arise from them. Consequently, no provision has been made in these
consolidated financial statements for the amount.
The Directors are of the opinion that all known liabilities and commitments which are relevant in assessing the
Company's state of affairs have been taken into account in the preparation of these consolidated financial
statements under review.
The Company accepted a performance bond of N50 million (2016- N50 million) in favour of Nigeria Customs
Service.
The CompanyThe Group
RED STAR EXPRESS PLC
NOTES TO THE CONSOLIDATED FINANCIAL STATEMENTS
FOR THE PERIOD ENDED 31ST DECEMBER 2017
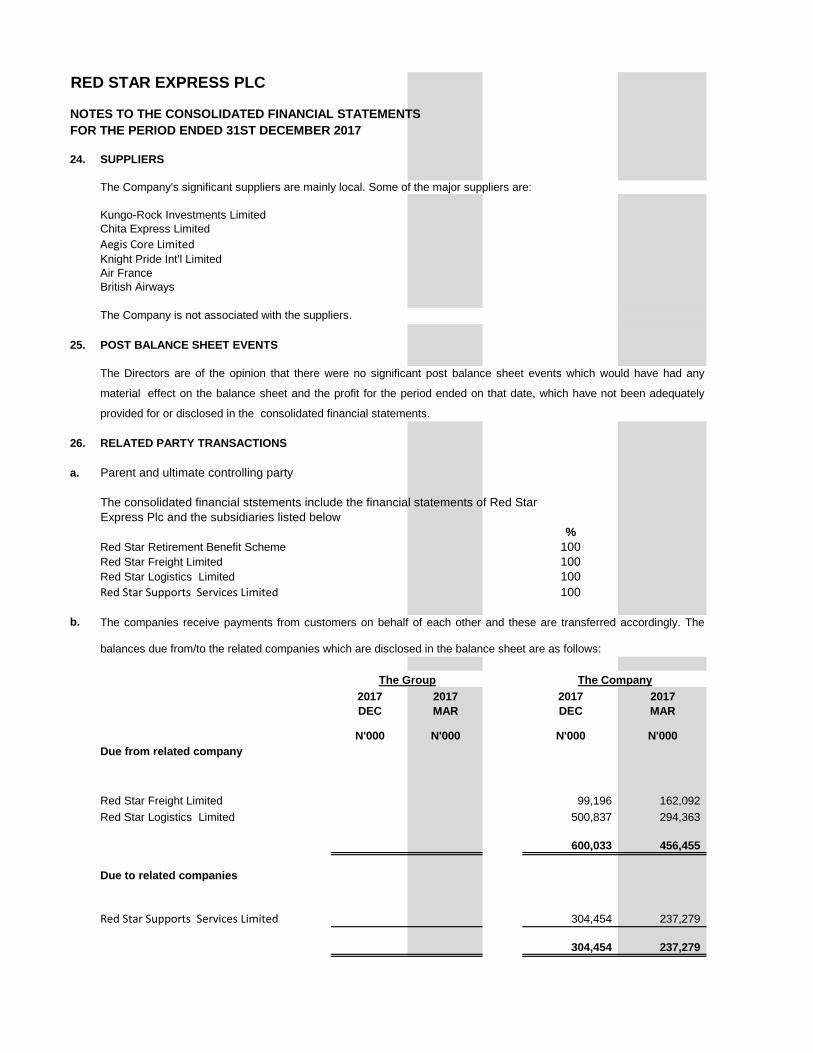
24. SUPPLIERS
Kungo-Rock Investments Limited
Chita Express Limited
Aegis Core LimitedKnight Pride Int'l Limited
Air France
British Airways
25. POST BALANCE SHEET EVENTS
26. RELATED PARTY TRANSACTIONS
a. Parent and ultimate controlling party
The consolidated financial ststements include the financial statements of Red Star
Express Plc and the subsidiaries listed below
%
Red Star Retirement Benefit Scheme 100
Red Star Freight Limited 100
Red Star Logistics Limited 100
Red Star Supports Services Limited 100
b.
2017 2017 2017 2017
DEC MAR DEC MAR
N'000 N'000 N'000 N'000
Due from related company
Red Star Freight Limited 99,196 162,092
Red Star Logistics Limited 500,837 294,363
600,033 456,455
Due to related companies
Red Star Supports Services Limited 304,454 237,279
304,454 237,279
The Company's significant suppliers are mainly local. Some of the major suppliers are:
The Company is not associated with the suppliers.
The Directors are of the opinion that there were no significant post balance sheet events which would have had any
material effect on the balance sheet and the profit for the period ended on that date, which have not been adequately
provided for or disclosed in the consolidated financial statements.
The companies receive payments from customers on behalf of each other and these are transferred accordingly. The
balances due from/to the related companies which are disclosed in the balance sheet are as follows:
The CompanyThe Group
RED STAR EXPRESS PLC
NOTES TO THE CONSOLIDATED FINANCIAL STATEMENTS
FOR THE PERIOD ENDED 31ST DECEMBER 2017
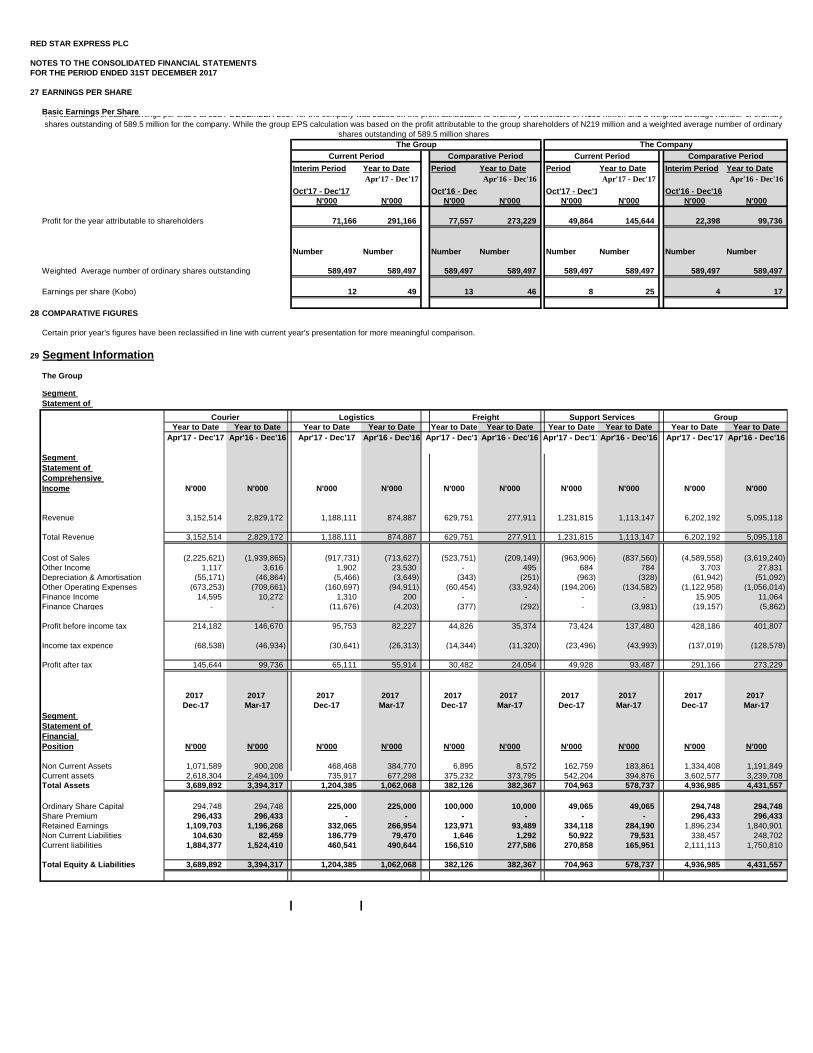
27.EARNINGS PER SHARE
Basic Earnings Per Share
Interim Period Year to Date
Interim
Period Year to Date
Interim
Period Year to Date Interim Period Year to Date
Oct'17 - Dec'17
Apr'17 - Dec'17
Oct'16 - Dec'16
Apr'16 - Dec'16
Oct'17 - Dec'17
Apr'17 - Dec'17
Oct'16 - Dec'16
Apr'16 - Dec'16
N'000 N'000 N'000 N'000 N'000 N'000 N'000 N'000
Profit for the year attributable to shareholders 71,166 291,166 77,557 273,229 49,864 145,644 22,398 99,736
Number Number Number Number Number Number Number Number
Weighted Average number of ordinary shares outstanding 589,497 589,497 589,497 589,497 589,497 589,497 589,497 589,497
Earnings per share (Kobo) 12 49 13 46 8 25 4 17
28.COMPARATIVE FIGURES
Certain prior year's figures have been reclassified in line with current year's presentation for more meaningful comparison.
29.Segment Information
The Group
Segment
Statement of
Year to Date Year to Date Year to Date Year to Date Year to Date Year to Date Year to Date Year to Date Year to Date Year to Date
Apr'17 - Dec'17 Apr'16 - Dec'16 Apr'17 - Dec'17 Apr'16 - Dec'16 Apr'17 - Dec'17Apr'16 - Dec'16 Apr'17 - Dec'17Apr'16 - Dec'16 Apr'17 - Dec'17 Apr'16 - Dec'16
Segment
Statement of
Comprehensive
Income N'000 N'000 N'000 N'000 N'000 N'000 N'000 N'000 N'000 N'000
Revenue 3,152,514 2,829,172 1,188,111 874,887 629,751 277,911 1,231,815 1,113,147 6,202,192 5,095,118
Total Revenue 3,152,514 2,829,172 1,188,111 874,887 629,751 277,911 1,231,815 1,113,147 6,202,192 5,095,118
Cost of Sales (2,225,621) (1,939,865) (917,731) (713,627) (523,751) (209,149) (963,906) (837,560) (4,589,558) (3,619,240)
Other Income 1,117 3,616 1,902 23,530 - 495 684 784 3,703 27,831
Depreciation & Amortisation (55,171) (46,864) (5,466) (3,649) (343) (251) (963) (328) (61,942) (51,092)
Other Operating Expenses (673,253) (709,661) (160,697) (94,911) (60,454) (33,924) (194,206) (134,582) (1,122,958) (1,056,014)
Finance Income 14,595 10,272 1,310 200 - - - - 15,905 11,064
Finance Charges - - (11,676) (4,203) (377) (292) - (3,981) (19,157) (5,862)
Profit before income tax 214,182 146,670 95,753 82,227 44,826 35,374 73,424 137,480 428,186 401,807
Income tax expence (68,538) (46,934) (30,641) (26,313) (14,344) (11,320) (23,496) (43,993) (137,019) (128,578)
Profit after tax 145,644 99,736 65,111 55,914 30,482 24,054 49,928 93,487 291,166 273,229
2017 2017 2017 2017 2017 2017 2017 2017 2017 2017
Dec-17 Mar-17 Dec-17 Mar-17 Dec-17 Mar-17 Dec-17 Mar-17 Dec-17 Mar-17
Segment
Statement of
Financial
Position N'000 N'000 N'000 N'000 N'000 N'000 N'000 N'000 N'000 N'000
Non Current Assets 1,071,589 900,208 468,468 384,770 6,895 8,572 162,759 183,861 1,334,408 1,191,849
Current assets 2,618,304 2,494,109 735,917 677,298 375,232 373,795 542,204 394,876 3,602,577 3,239,708
Total Assets 3,689,892 3,394,317 1,204,385 1,062,068 382,126 382,367 704,963 578,737 4,936,985 4,431,557
Ordinary Share Capital 294,748 294,748 225,000 225,000 100,000 10,000 49,065 49,065 294,748 294,748
Share Premium 296,433 296,433 - - - - - - 296,433 296,433
Retained Earnings 1,109,703 1,196,268 332,065 266,954 123,971 93,489 334,118 284,190 1,896,234 1,840,901
Non Current Liabilities 104,630 82,459 186,779 79,470 1,646 1,292 50,922 79,531 338,457 248,702
Current liabilities 1,884,377 1,524,410 460,541 490,644 156,510 277,586 270,858 165,951 2,111,113 1,750,810
Total Equity & Liabilities 3,689,892 3,394,317 1,204,385 1,062,068 382,126 382,367 704,963 578,737 4,936,985 4,431,557
Courier Logistics Freight
Current Period
The calculation of basic earnings per share at 31ST DECEMBER 2017 for the company was based on the profit attributable to ordinary shareholders of N105 million and a weighted average number of ordinary
shares outstanding of 589.5 million for the company. While the group EPS calculation was based on the profit attributable to the group shareholders of N219 million and a weighted average number of ordinary
shares outstanding of 589.5 million shares
The Group The Company
Current Period Comparative PeriodComparative Period
GroupSupport Services


![UR Financials User-Group 06-17-15.pptx [Read-Only]](https://static.fdocuments.us/doc/165x107/61c0ccf8261f4c35e77dff2a/ur-financials-user-group-06-17-15pptx-read-only.jpg)
![UR Financials User-Group 06-17-15.pptx [Read-Only] · PDF fileUR Financials User Group – June 2015 ... Kate Crowley ‐IT X X X X X X X X X X X X ... • Review UR Financials June](https://static.fdocuments.us/doc/165x107/5abe29327f8b9a7e418c8bff/ur-financials-user-group-06-17-15pptx-read-only-financials-user-group-june.jpg)