
Group and Individual Heterogeneity in a Stochastic...
28
Yip, T. L., Sun, X. Y., & Liu, J. J. (2011). Group and individual heterogeneity in a stochastic frontier model: Container terminal operators. European Journal of Operational Research, 213(3), 517-525 1 Group and Individual Heterogeneity in a Stochastic Frontier Model: Container Terminal Operators Tsz Leung Yip*, Xin Yu Sun, and John J. Liu Department of Logistics and Maritime Studies Faculty of Business The Hong Kong Polytechnic University Hung Hom, Hong Kong * Corresponding author. Tel.: +852 2766 4631; Fax: +852 2330 2704. E-mail address: [email protected] (5 January 2011) ABSTRACT Container ports are a major component of international trade and the global supply chain. Hence, the improvement of port efficiency can have a significant impact on the wider maritime economy. This paper deconstructs a representation in the existing literature that neglects the heterogeneity of individual and group-specific terminal operators. In its place, we present a hierarchical model to make a connection between efficiency and terminal operator group characteristics. The paper develops a stochastic frontier model that controls not only individual heterogeneity but also group-specific variations. The model decomposes the total stochastic derivation from the frontier into inefficiency, individual heterogeneity, group-specific variations, and noise components, with the estimation being performed using Markov chain Monte Carlo simulations. The validity of the model is tested with a panel of container terminal operator data from 1997-2004. Our findings show that terminal operator groups are important in promoting terminal efficiency at the global level, and that the operators with stevedore backgrounds show a higher efficiency than carriers. Key Words Stochastic processes; Stochastic production frontier; Markov processes; Container terminal operators; Port globalisation; Group-specific This is the Pre-Published Version.
Transcript of Group and Individual Heterogeneity in a Stochastic...
Yip, T. L., Sun, X. Y., & Liu, J. J. (2011). Group and individual heterogeneity in a stochastic frontier model: Container terminal operators. European Journal of Operational Research, 213(3), 517-525
1
Group and Individual Heterogeneity in a Stochastic Frontier Model:
Container Terminal Operators
Tsz Leung Yip*, Xin Yu Sun, and John J. Liu
Department of Logistics and Maritime Studies Faculty of Business
The Hong Kong Polytechnic University Hung Hom, Hong Kong
* Corresponding author. Tel.: +852 2766 4631; Fax: +852 2330 2704. E-mail address:
(5 January 2011)
ABSTRACT
Container ports are a major component of international trade and the global supply
chain. Hence, the improvement of port efficiency can have a significant impact on the
wider maritime economy. This paper deconstructs a representation in the existing
literature that neglects the heterogeneity of individual and group-specific terminal
operators. In its place, we present a hierarchical model to make a connection between
efficiency and terminal operator group characteristics. The paper develops a
stochastic frontier model that controls not only individual heterogeneity but also
group-specific variations. The model decomposes the total stochastic derivation from
the frontier into inefficiency, individual heterogeneity, group-specific variations, and
noise components, with the estimation being performed using Markov chain Monte
Carlo simulations. The validity of the model is tested with a panel of container
terminal operator data from 1997-2004. Our findings show that terminal operator
groups are important in promoting terminal efficiency at the global level, and that the
operators with stevedore backgrounds show a higher efficiency than carriers.
Key Words
Stochastic processes; Stochastic production frontier; Markov processes; Container
terminal operators; Port globalisation; Group-specific
This is the Pre-Published Version.

Yip, T. L., Sun, X. Y., & Liu, J. J. (2011). Group and individual heterogeneity in a stochastic frontier model: Container terminal operators. European Journal of Operational Research, 213(3), 517-525
2
Highlights
• We decompose individual and group-specific variations in frontier analysis.
• This study is at the terminal level rather than port level.
• Inefficiency is overestimated by a homogeneous frontier analysis.
• Terminal operator groups generate more terminal throughput.
• Terminal operator groups are more efficient than individual operators.
1. Introduction
1.1. Background
In recent years, operational research methods have gained considerable importance in
econometrics. The production and cost theories in economics make it possible to
estimate production and cost functions empirically, and thus to investigate changes in
both the productivity and technology of a firm. The conventional stochastic frontier
method for estimating a frontier assumes that all firms are successful in reaching the
efficient frontier (and only deviate randomly). If, however, firms are not always at
the frontier, then the conventional estimation method will not reflect the efficient
production or cost frontier against which to measure efficiency. Empirical
estimations for the port production function have been performed by Chang (1978)
and Tongzon (1993), whereas Kim and Sachis (1986), Martínez-Budría et al. (2003),
Martínez-Budría et al. (1999), and Jara-Díaz et al. (2002) estimated the cost functions
of ports for both single-output and multiple-output cases. Using a single frontier
function, Liu (1995), Notteboom et al. (2000), and Estache et al. (2002) estimated
production frontiers or cost frontiers while recognising that some ports may not be at
the efficient frontier.
Today, the port industry has a hierarchical structure. Each port has many terminals,
which are operated by one or several operators. For example, the Hong Kong Port
has 9 terminals operated by six operators. From Table 1, there are 1.8 operators and
5.0 terminals in a port on average. The operators are the firms to operate the
terminals for their own objectives. Obviously, container terminal operators are the
decision making units (DMU). As a DMU, each operator in a port makes his own
operation and technical decisions. At the terminal level, the efficiency level should be
different between different operators in a port. At the port level, different operators in
a port should have certain similarity in production efficiency because they share the
Yip, T. L., Sun, X. Y., & Liu, J. J. (2011). Group and individual heterogeneity in a stochastic frontier model: Container terminal operators. European Journal of Operational Research, 213(3), 517-525
3
same water depth and other natural conditions. At the country level, the operators
from different ports within the same country should also have certain similarity in
production efficiency because they are subject to the same government regulations
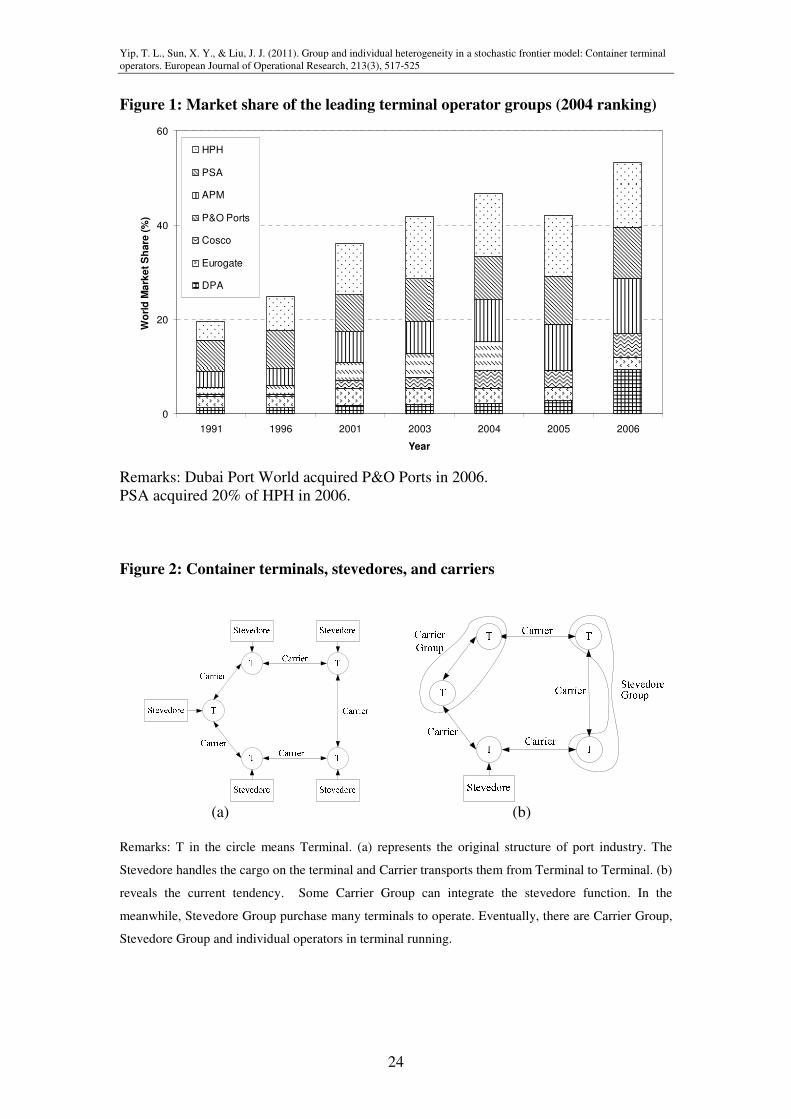
and legal systems. At the global level, most terminal operators in the world today
belong to several major terminal operator groups such as HIT, DP world, and PSA
(Figure 1). Two operators, even from different countries, should have certain
similarity in production efficiency if they belong to the same terminal operator group.
However, despite the efforts of the aforementioned studies, three fundamental issues
remain unaddressed. First, existing literature on efficiency does not address the
group-specific effects over time, providing our motivation to examine the efficiency
advancement of both groups and individuals. Instead of treating ports as the decision
making unit (DMU), this paper treats container terminal operators as the DMU, which
represents a divergence from previous port efficiency studies (e.g., Gonzalez and
Trujillo, 2009). Second, heterogeneity is generally ignored in port efficiency studies
but is mistakenly included in the stochastic error term. Unlike other industries, ports
are characterised by their geographical and operational settings. Terminal operators
from different groups, different locations, and different times are assumed to have
different characteristics. We attempt to separate the group and individual
heterogeneity from stochastic errors and this attempt leads to a substantial simulation
effort.
Third, the group-specific effect has not been studied in port efficiency studies.
Seaports are characterised by global competition in a number of dimensions. They
have sought to exploit network effects in the containerisation era, and terminal
operators have attempted to expand their line of activities through vertical and/or
horizontal integrations along the transport chain (Figure 2). Currently, several
terminal operator groups having derived competitive advantages are coming up
against one another. However, despite the importance of the port industry, there has
been little attention paid to the underlying motives of terminal operator grouping from
a scientific perspective. The aim of this paper, therefore, is to explore the efficiency
motives of globalisation of terminal operation.
1.2. Terminal operator group (TOG)

Yip, T. L., Sun, X. Y., & Liu, J. J. (2011). Group and individual heterogeneity in a stochastic frontier model: Container terminal operators. European Journal of Operational Research, 213(3), 517-525
4
The structure of the container terminal industry has changed since port privatisation
started in the 1990s. Governments contract out the ownership and management of
ports and terminals, and today container terminals are run for commercial objectives.
The port industry has a particularly global structure, and global and multinational
players, TOGs (terminal operator groups), are becoming increasingly dominant.
There are two generic globalisation strategies in the globalisation of terminal
operation: (1) Horizontal merger initiated by leading stevedores; and (2) Vertical
integration initiated by global carriers (shipping lines).
There are many reasons for the dominance of TOG, and the discussion of
multinational behaviour brings together a number of economic theories (e.g., Caves,
2007). Studies of multinational service industries have received increased attention
from researchers, e.g., multinational banks (Chang et al., 1998), hotels (Shang et al.,
2008), insurance companies (Fenn et al., 2008), and airports (Oum et al., 2008).
There has, to date, been no efficiency study concerning TOG. One reason for this is
that existing port studies are based on port data, not terminal data, while terminal
operator groups operate in several countries. Our terminal-based data collection
makes a study into terminal operation globalisation feasible. However, more
fundamentally, we argue that TOGs are more efficient because operators actually
create terminal globalisation in order to improve the efficiency of their operations.
In summary, the port industry is different from other service industries. The clients of
terminal operators are shipping lines (carriers), and container handling is highly
standardised worldwide. Terminal operators provide more-or-less the same container
handling services to carriers. In particular, operator groups prefer market
standardised services worldwide so as to reap maximum benefits from the economies
of scale that underlie their learning curve. Within this context, in this paper we
develop a rigorous econometric model to test the effects of globalisation on the
efficiency of terminal operation.
2. Literature Review
A deep knowledge of port firms’ productivity results is essential not only to decide
where, when, and how much to invest, but also to suggest optimal tariff structures.
There have been numerous productivity or efficiency studies of ports. Wanhill (1974)

Yip, T. L., Sun, X. Y., & Liu, J. J. (2011). Group and individual heterogeneity in a stochastic frontier model: Container terminal operators. European Journal of Operational Research, 213(3), 517-525
5
suggested that the productivity of ports depends on the right trade-off between the
costs of providing infrastructure (berth) and the time costs of the ship’s stay in the
port. The manual on port planning prepared by the UNCTAD (1978) for developing
countries followed the same line of work as Wahnill’s (1974) study. It relied on
Monte-Carlo simulation techniques to calculate the costs of different types of
terminals according to terminal features and ships’ stay in port. Similar works include
Jansson and Shneerson (1982), Shneerson (1981, 1983), and Fernández et al. (1999),
all of whom adopted a queuing model as the basic form of port service production
function and assumed ships’ arrival is random and follows a Poisson distribution.
Such studies are helpful for individual port planning.
As logistics and supply chains have evolved into the artery of the global economy, the
efficiency of ports has become an important factor affecting a nation's international
competitiveness. Thus, monitoring and comparing one’s ports with others in terms of
overall efficiency has become an essential part of many countries’ microeconomic
reform programs. The pressure to boost port competitiveness has triggered an
increasing number of port benchmarking studies, especially for leading container
ports.
In all efficiency studies, efficiency is measured by comparing observed and optimum
costs, production, revenue, or whatever parameter the organisation is assumed to
pursue, subject to the constraints on quantities and prices. The optimal quantity is
termed the frontier, and the efficiency is then calculated as the distance between the
observed quantity and the frontier. In empirical research, two methods are widely
used to calculate or estimate the frontier functions and thereby measure efficiency:
data envelope analysis (DEA) and stochastic frontier analysis (SFA). DEA is a
deterministic method based on linear programming and was first introduced by
Charnes et al. (1978). In contrast, SFA is an econometric method accounting for
random shocks and measurement errors, and was first proposed by Aigner et al. (1977)
and Meeusen and van den Broeck (1977). Cullinane et al. (2006) compared the
results from DEA and SFA on port efficiencies and found high correlations between
the results from the two approaches. In port literature, Hung, Lu, and Wang (2010)
introduced scale efficiency into DEA analysis, and Sharma and Yu (2010) studied
container terminals using the DEA model. Dowd and Leschine (1990) and Talley
Yip, T. L., Sun, X. Y., & Liu, J. J. (2011). Group and individual heterogeneity in a stochastic frontier model: Container terminal operators. European Journal of Operational Research, 213(3), 517-525
6
(1994) used index number approaches, which allow comparisons to be made of the
efficiency among various ports and throughout time for a single port, in order to study
ports’ productivity. Index number procedures generally construct a ratio-type
productivity/efficiency measure, without the need for statistical estimation of a
production or cost function. Many studies which have used these two methods to
study port efficiency assume the homogeneity of the global port industry. Instead, we
consider the heterogeneity of terminal operators and examine factors that explain why
terminal operator groups play their leading role in the port industry.
Heterogeneity of DMUs often exists in the presence of geographical features. Banker
et al. (1986) first discussed the idea of categorical variables which is a clustering
technique to solve the heterogeneity variations in DMUs. Cook et al. (1998) pointed
out that clustering of DMUs may appear at different levels. Doyle and Green (1994)
introduced the cross efficiency evaluation method to address the heterogeneity of
DMUs. Recently, Lee (2010) attempted the group effect with parametric models.
Previous studies have compared the temporal variations between ports (e.g., Gonzalez
and Trujillo 2009). The terminal operators should be treated as independent decision-
makers, but the existing literature considers ports as the decision-makers. Previous
efficiency studies are at the port level, but this one is at terminal level since port
globalisation exists due to terminal operators rather than port operators.
3. Methodology
3.1. Empirical analysis
In container terminals, the output is the number of containers handled, and the input is
the equipment and manpower used to handle the containers. The level of terminal
output is an important indicator of a terminal’s efficiency. As the data for container
throughputs at terminals are reliable and well documented, throughput in TEU
(twenty-foot equivalent unit) is the most frequently used indicator for container
terminals, although there are alternative indicators. The model we use incorporates
the necessary physical characteristics of container terminals, such as quay cranes,
yard equipment, and the number of berths, as inputs to container terminal production
(Table 1).

Yip, T. L., Sun, X. Y., & Liu, J. J. (2011). Group and individual heterogeneity in a stochastic frontier model: Container terminal operators. European Journal of Operational Research, 213(3), 517-525
7
The production frontier of terminal operator i at time t is parameterised as the Cobb-
Douglas function:
ititititit BXy εα +∆−+= (1)
iiit trtr ναα +++ΘΠ+= 2
21 , (2)
where
=ity the logarithm of observed output (herein Container Throughput in TEUs) of the
i-th operator at year t
=itX the matrix of the logarithm of observed inputs (e.g., cargo handling, terminal
infrastructure, and storage facilities)
=∆ it the positive random deviation from the frontier (which means inefficiency)
=itε the time-varying measurement error. It represents the measurement error with a
normal distribution independent of both operator and year, i.e., ( )2,0~ εσε Nit. Thus,
itε is the time-varying error.
=Π i the matrix of observed terminal characteristics (e.g., terminal factors, port
factors, and country factors)
=t time
=α constant
Equation (2) shows that the intercept of the logarithm production frontier varies
across both individual terminal operators and time (with time trend terms). Part of the
variation across individual operators can be explained by individual profiles denoted
as iΠΠΠΠ and part of the variation is unobserved and is thus modelled as random denoted
as iν , whose distribution is parameterised in as normal with zero mean, i.e.,
( )2,0~ νσν Ni .
Our special feature is to measure the efficiencies after controlling for the individual
heterogeneity. We achieve this by randomising the intercept of the log production
frontier and letting the distribution be conditional on observable individual profiles.
Yip, T. L., Sun, X. Y., & Liu, J. J. (2011). Group and individual heterogeneity in a stochastic frontier model: Container terminal operators. European Journal of Operational Research, 213(3), 517-525
8
In the port industry, three levels of individual profiles can be observed -- terminal,
port and country. The unobserved factors are specified by random component iν to
the intercept. Ignoring iν will bias the estimates of parameters, because the
uncontrolled individual effects will cause observations from the same individual to be
correlated.
Under our model specification, the efficiency level of an individual i at time t is
defined as ( )itith ∆−= exp , which can be understood as the percentage achieving the
production frontier. In our case, we not only want to know the inefficiency, but also
want to investigate the determinants of productivity. Many authors have previously
presented a two-step method (Zheng et al., 1998; Shao and Lin, 2002). In the first
step, the productivity measure is computed by SFA or DEA. In the second step,
analysis is conducted to examine the relationship between inefficiency and various
influential factors. However, such a method will be statistically biased since
efficiency is also an estimator. Our specification augments efficiency as a function of
determinants by )exp( iitit gZ=∆ , where itZ are the vectors of variables measuring
port observable characteristics including terminal operator group, and ig are
coefficients of inefficiency parameters. ig are distributed with ),( ΣgN , where
( )22
1 ,..., gNgdiag σσ=Σ is the diagonal matrix of variances. We thus use one step to
estimate this hierarchical model.
In contrast to previous models, our model is enhanced to quantify the effects of
operator globalisation by adding dummy variables in order to control operator group
effects (see Table 1). A recent trend in the container port industry is that global
stevedore and global carriers are investing in several terminals in the same country
and also in different countries. The operator group effects are observable only if the
individual units are container terminals, rather than ports. For the specification of our
model, the key feature is that the distribution of it∆ is conditional on itZ , the vector of
variables measuring observable port characteristics and time affecting the production
inefficiency. To analyse the two generic globalisation strategies in the port industry,
we use two dummy variables which refer to a terminal operator’s background as
carrier or stevedore. We therefore create a connection between inefficiency and

Yip, T. L., Sun, X. Y., & Liu, J. J. (2011). Group and individual heterogeneity in a stochastic frontier model: Container terminal operators. European Journal of Operational Research, 213(3), 517-525
9
terminal characteristics. Therefore, the model contains a linear trend t, quadratic
trend 2t , carrier dummy, and stevedore dummy. We include linear and quadratic time
trends in our model in order to account for technological change over time.
A typical criticism of port efficiency studies is that there are no credible data on the
labour inputs of the port or of terminal operators. Tongzon (2001) counted the
number of stevedores and other employees that work in terminals. However, because
the direct counting of labour inputs is not possible in most terminals, Yan et al. (2009)
ignored labour inputs by assuming little variation across terminal operators. Hui et al.
(2010) used housing price as a proxy variable of local labour costs of port operation.
In our study, because of the difficulty in collecting labour cost data, we include the
GDP per capita at the country level to proxy the labour costs of terminal operations.
3.2. Estimation procedure with MCMC simulation
The Markov chain Monte Carlo (MCMC) simulation is used to determine the
unknown parameters. The MCMC approach is a class of algorithms for sampling
from probability distributions based on constructing a Markov chain that has the same
desired distribution as its equilibrium distribution. The state of the chain after a large
number of steps is then used as a sample from the desired distribution, with the
quality of the sample improving as a function of the number of steps. Usually it is not
difficult to construct a Markov chain with desired properties. A more difficult
problem is to determine the number of steps needed to converge to the stationary
distribution within an acceptable error. A good Markov chain will have rapid mixing,
where the stationary distribution is reached quickly starting from an arbitrary state.
The MCMC simulation can augment and filter imperfect panel data of differential
characteristics. One application of this critical feature is to interpolate and extrapolate
statistically missing and censored diffusion data. It is inevitable that panel data
collected from industry contain missing and erroneous data entries, which must be
augmented and corrected, respectively.
Our estimation is performed based on the MCMC estimator developed in Bayesian
statistics. The unknown parameters can be represented as
( )22
21 ,,,,,,,, εν σσγγα ΣΒΘ≡Ψ g . The MCMC estimator draws from the joint posterior
Yip, T. L., Sun, X. Y., & Liu, J. J. (2011). Group and individual heterogeneity in a stochastic frontier model: Container terminal operators. European Journal of Operational Research, 213(3), 517-525
10
distribution { }( )Datagpiii ,, νΨ , with { }
iii g,ν representing the instruments of
endogenous individual effects in stochastic frontier equations. The data posterior is
expressed as:
{ }( ) ( ) ( ) ( ) ( )∏ ∏= =
ΒΘ⋅⋅Σ⋅Ψ∝ΨN
i
T
t
iiitiiiii
i
gyggDatagp1 1
22 ,,,,,,;;,;,, νσταφσνφφρν εν . (3)
Since the functional form of the data augmented posterior in Eq. (3) is complicated, it
is impossible to derive analytical properties of it. We use the Monte Carlo simulation
to take random draws from the posterior and the empirical properties of the draws will
be used to approximate the theoretical ones. Appendix of the paper presents the
details of the MCMC algorithm to take random draws from the augmented posterior
in Eq. (3).
3.3. Data collection
We consider a panel data set for the terminal operators which come from the container
ports ranked in the top 100 in 2005, with the period covered being from 1997 to 2004.
For each container terminal operator of these ports, we collected data on output,
terminal inputs, port characteristics and country features (Table 1). Most of the
information can be found in the Containerisation International Yearbooks. We also
used a subscription database, Containerisation Intelligence Online, to obtain the
addresses of the websites of each terminal from which further information was gained.
Additional useful information was also obtained from the websites of port authorities
and government agencies. The country data is obtained from the World Bank.
After we removed some missing data, a set of unbalanced panel data was created with
597 observations in total. The data covered 141 terminal operators from 78 container
ports.
3.4. Model Validation
In implementation, we employ non-informative priors on the parameters. As shown
in Figure 3, the variance of the posterior is smaller than that of prior. To confirm the
convergence, we run the Gibbs sampler from different starting values of the
parameters. For each of the runs, we plot the time-series of the generated variables
Yip, T. L., Sun, X. Y., & Liu, J. J. (2011). Group and individual heterogeneity in a stochastic frontier model: Container terminal operators. European Journal of Operational Research, 213(3), 517-525
11
such as Figure 4. The draws for parameters converge very fast and have much better
mixing properties compared with these second-layer parameters. In general, the Gibbs
draws converge after about 10,000 draws. Performing many different runs from
diverse starting points and changing priors had certain but not substantial effects on
estimates of inefficiency.
4. Empirical results and discussion
In Table 2, we show posterior means and standard deviations of coefficients of the
stochastic production frontier. The heterogeneous model is based on our model
specification and estimated by MCMC. The conventional model is that all the
operators face all the common frontiers and to ignore their heterogeneity.
4.1. Homogeneous versus heterogeneous frontiers
A conventional model does not distinguish individual heterogeneity and inefficiency.
The wide variation in terminal operation across countries introduces a considerable
amount of terminal heterogeneity. Conventional models (Figure 5) then overestimate
inefficiency by including heterogeneity in inefficiency. In our model whose results
are showed in Figure 6, we randomise the intercept of the production frontier to
account for individual heterogeneity (the so-called true random effects model in
Greene, 2008). When the operators differ in their adopted technologies, and such
differences are not well controlled, the estimated inefficiency absorbs both the
heterogeneity and inefficiency and the estimation is thus inevitably biased. Unlike the
conventional model using a convenient one-parameter distribution form (such as a
half-normal or exponential distribution) to model random inefficiency, we used a
more flexible log-normal distribution with two parameters. This specification enabled
us to interact some observable managerial inputs with inefficiency, in order to seek
policy implications.
Figures 5 and 6 plot the estimated distribution of efficiency level in different years for
the two models, respectively. Figure 5 refers to Eq. (1) by assuming the operators are
homogeneous (i.e., =itα constant), while Figure 6 is based on Eq. (1) and (2) in which
the operators are heterogeneous. The different patterns of Figure 5 and Figure 6 are
due to the different assumptions of homogeneous versus heterogeneous frontiers.

Yip, T. L., Sun, X. Y., & Liu, J. J. (2011). Group and individual heterogeneity in a stochastic frontier model: Container terminal operators. European Journal of Operational Research, 213(3), 517-525
12
Inefficiency is significantly overestimated by a conventional SFA, as shown in Figure
5 in which the individual heterogeneity in production frontiers is controlled only by
the observables. This suggests that the estimated inefficiency from the conventional
model does not allow for individual heterogeneity across terminals. In fact, the
conventional model absorbs the individual heterogeneity in the production frontier,
and thus the distribution of individual level efficiency shifts to the left. All the
terminals are measured against “the most efficient terminal” in terms of efficiency
when using the conventional model.
After controlling for the observed heterogeneity, the estimated value of 2
νσ is still
significant with large magnitude, indicating the heterogeneity in the adopted
technologies caused by many unobserved or omitted variables. The range of iv is
from -2.04 to 9.04 to show there is significant heterogeneity in operators in Figure 7.
Obviously the homogeneous stochastic frontier model cannot meet the situation of the
port industry. Every operator should have its own frontier to reveal its real
inefficiency.
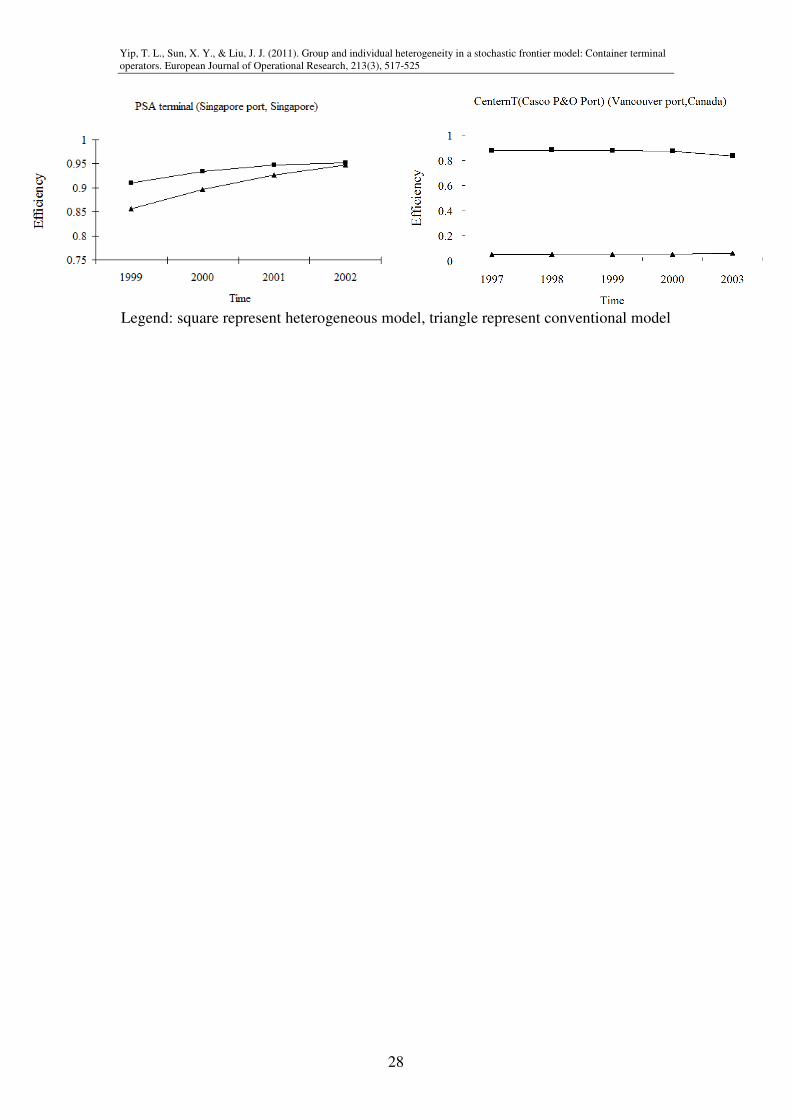
Figure 8 shows four examples of individual efficiency change of the heterogeneous
model and conventional model. The efficiency in the heterogeneous model is higher
than that in the conventional model. But the difference is not constant. The
efficiency difference in Singapore PSA terminal and Hong Kong ModernTerminals
terminal is very small compared with other two terminal comparisons. This is
because Singapore and Hong Kong terminals are well known due to their efficiency.
In the conventional model, the efficiency is measured based on the most efficient
terminals such as Singapore and Hong Kong. Therefore, the efficiency difference is
huge between poorly performing terminal operators in the heterogeneous model and
conventional model.
4.2. Trend effect
Modelling time varying inefficiency is also possible based on the model specification
used. The sign of the estimated coefficient of the linear trend effect t is negative
(Table 2); i.e., there is a declining linear effect on terminal operator throughput over
time. This reflects the fact that the productivity of equipment and technologies

Yip, T. L., Sun, X. Y., & Liu, J. J. (2011). Group and individual heterogeneity in a stochastic frontier model: Container terminal operators. European Journal of Operational Research, 213(3), 517-525
13
declines as time passes. However, as the sign of the quadratic trend t2 is positive,
there is a non-linear inference of terminal productivity over time. Within the global
port market, there is constant pressure to enhance the efficiency of terminal operation.
Effective use of technology enhances efficiency and technological advancement is
significant in terminals. New equipment is purchased, and methods of cargo handling
are changed to effectively handle the increased amount of throughput. The linear and
quadratic effects together suggest that the large productivity enhancement is a result
of the effect of the non-linear component of the trend.
4.3. Horizontal merger and vertical integration
As shown in Table 2, the heterogeneous model identifies that the terminal operator
group, Carrier Group ( 4g ) and Stevedore Group ( 5g ), in general improves terminal
efficiencies. The model provides strong evidence to explain why terminal operators
are moving towards globalisation. The model further shows that a global stevedore
background is more efficient than that of a global carrier. This is because there are
inevitable conflicts of interests between terminal and carrier operations. It is well
known that the most efficient terminal operation occurs at a higher economic scale of
throughput than that of carrier operation (e.g., McConville 1999, Chapter 13). If the
terminal is operated by a carrier, terminal efficiency will likely be compromised.
Findings show that global-carrier-based terminal operators on average outperform
local operators, while there are no negative impacts of the involvement of carriers in
the terminal business.
Small or local terminal operators, however, do not enjoy the same advantages as
terminal operator groups. As operator groups increase their market share, the small
operators are losing some of the container traffic that used to flow through them.
4.4. Group versus individual
Our model shows that group operators (Carrier Group 4g and Stevedore Group 5g ),
are advancing in efficiency more rapidly than individual operators. A possible reason
behind this observation is that groups may learn more quickly than individuals,
because experience could be shared within the group and efficiency improved by
Yip, T. L., Sun, X. Y., & Liu, J. J. (2011). Group and individual heterogeneity in a stochastic frontier model: Container terminal operators. European Journal of Operational Research, 213(3), 517-525
14
benchmarking performance against multiple terminals. However, further research is
needed into the relation of efficiency to learning curve effect.
Another important feature newly identified by the model is that Stevedore Groups
show a steady improvement in efficiency, while the Carrier Groups present a higher
fluctuation in efficiency. The stevedore operators serve multiple carriers, while
carrier operators are dedicated to one particular carrier. Thus, the stevedore operators
can easily develop a portfolio of operation for different carriers so that efficiency is
steadily improved. In contrast, carrier operators streamline their operations according
to their carriers and efficiency inevitably depends on particular carriers’ operations.
Although carrier operators can still take advantage of multiple terminal operations and
perform better than individual operators, carrier operators face a more fluctuating
efficiency. As carrier operators are more sensitive to the market, they may quit the
terminal market and later re-enter the terminal market depending on the carrier’s
strategy.
4.5. Other implications
The results of the study contribute to the quest for multiple terminal management
concepts in port research, in line with the integration that has been taking place at the
global level, and the integration of port management into the carrier. The study
identifies certain parameters perceived to be instrumental in the integration of ports in
global supply chains. Further research is required to ratify the development of a
measurement instrument for assessing vertical and horizontal integrations in
globalisation, since the lack of such an instrument has hindered research in the area.
Without a valid and reliable instrument measuring port integration in supply chains,
generalisable implications and strategies are difficult to generate.
This study identifies a positive relationship between terminal integration in the supply
chain and terminal performance. It is important for this association to be replicated
empirically using different ports and different contexts and performance measures. It
is also important for measures of competitiveness to be incorporated into the
measurement of terminal performance. The privatisation of ports and terminals,
together with the quest for competitiveness, means that conventional performance
measures such as market share, sales growth, and even profitability have become
Yip, T. L., Sun, X. Y., & Liu, J. J. (2011). Group and individual heterogeneity in a stochastic frontier model: Container terminal operators. European Journal of Operational Research, 213(3), 517-525
15
legitimate performance measures for ports. A container terminal with high efficiency
indicators may not be necessarily competitive due to the higher costs involved in
becoming more efficient.
It is likely the market share of the terminal operator groups will increase, as the port
sector is particularly sensitive to economies of scale. Container terminals are part of a
capital-intensive industry and require a volume business to sustain their business
investment.
5. Concluding remarks
In this paper, we considered a stochastic frontier model that allows for group-specific
temporal patterns, which assumes that container terminal operators from the same
operator group have the same group-specific parameter. We further studied how
operator groups compete with other groups on the basis of productivity efficiency.
The results contribute to an understanding of general group-based competition, such
as multinational companies and supermarket groups. The involvement of
international companies in the operation of container terminals has been a major
factor in boosting productivity. As the port sector becomes more internationalised,
improvements in efficiency are expected to continue.
This paper is one of the first attempts to appear in the literature to empirically
investigate whether terminal operator groups are more efficient than individual
terminal operators. As the heterogeneity of terminal operation cannot be ignored, the
heterogeneous model is developed to separate the heterogeneity from inefficiency.
The results confirm that terminal operator groups generate 35.9% and 45.4% more
throughput for carrier groups and stevedore groups, respectively. The results also
confirm the improvement of efficiency due to global grouping, and the efficiency
advancement should be a strong motive behind observed globalisation of terminal
operation. By confirming the efficiency of terminal operator groups, this study not
only highlights the contribution to terminal grouping, but also provides empirical
evidence to policy makers who design and seek to implement more efficient terminal
operation. By presenting the terminal efficiency associated with different operator
backgrounds, the study emphasises the importance of establishing regulatory actions
to regulate the globalisation of terminal operator groups.
Yip, T. L., Sun, X. Y., & Liu, J. J. (2011). Group and individual heterogeneity in a stochastic frontier model: Container terminal operators. European Journal of Operational Research, 213(3), 517-525
16
In the era of globalisation, governments have found it necessary to open up terminal
services to terminal operator groups. In general, this has resulted in increased
throughput and efficiency of container handling. Terminal operator groups have
advanced their efficiency faster than individual operators. Between the two types of
terminal operator groups, stevedore operators show more steady advancement than
carrier operators. However, to sustain and encourage efficiency achievements, further
research is needed to sustain the terminal efficiency improvements. Regarding the
economic policies, this study should be extended to consider the terminal concession
effect and how the regulations shape terminal efficiency.
Acknowledgement
This research was funded by the Hong Kong Polytechnic University under PPRI Grant #J-BB7E.
Appendix - MCMC algorithm
In order to conduct the Bayesian inference, we need to complement the likelihood
function in (3) with a prior distribution on the parameters. We choose a proper prior
distribution with the following product structure:
( ) ( ) ( ) ( ) ( ) ( )22
21,,,, εν σρσρρρρρ ⋅⋅Σ⋅⋅Θ=Ψ grrBa . (A1)
We briefly specify the priors for parameters. ( ) ( )ΛΛΘ VNrrB ,~,,,, 021α ,
( )gVgNg ,~ 0 , ( )rSrIW ,~ΣΣΣΣ ,
2,
2~
22 ννν
νσcdd
IG , and
2,
2~
22 εεεεσ
cddIG , where
( )rSrIW , and
2,
2
2ννν cdd
IG denote the inverted Wishart distribution and scaled
inverted Chi square distribution, respectively.
We separate several blocks to sample, ( )21,,,, rrBΘα , 2εσ , { }
iig , { }iiν , g , ΣΣΣΣ , and 2
νσ .
Firstly, we sample iν and ig for each operator:

Yip, T. L., Sun, X. Y., & Liu, J. J. (2011). Group and individual heterogeneity in a stochastic frontier model: Container terminal operators. European Journal of Operational Research, 213(3), 517-525
17
(a). Sampling iν for each i from
++
∑=
2222
2
1
1
1,
1
ˆ
νενε
ε
σσσσ
σ
ii
T
tit
TT
y
N
i
,
where ( )iititititit gZBXyy expˆ +−−= α .
(b). Sampling ig for each i from
( ) ( ) ( ) ( )( ) ( )( )
+
′++−Σ
′−−∝• −
iiiiiiiii gZYgZYggggDatagp expexp1
2
1exp,
2
1
εσ,
(A2)
where { }titiititi BXyY −−−= να . We cannot directly draw a sample from Eq. (A2),
being non-standard distributions. From our experience, a simple random walk
Metropolis-Hastings algorithm works very well and we choose it for our applications.
Other parameters are sampled for all operators once.
(c). Sampling ( )21,,,, rrBΘ≡Λ α from ( )DDdN , , with
1
1
2
~~1−
−
+′= ΛΛΛΛVXXD
εσ,
and 01
2
~~1ΛΛΛΛΛΛΛΛ
−+′= VYXdεσ
,
where ( ){ }tiiitiit gZyY
,exp
~+−= ν , and { }
tiiti XtX,
,,,1~
ΠΠΠΠ= .
(d). Sampling 2εσ from
++ ∑∑∑
= ==
2,
21 1
22
1
N
i
T
tit
N
ii
i
ecdTd
IGεεε
,
with ( )iitiitititit gZBXye exp+−−−= να .
(e). Sampling 2νσ from
+
+∑=
2,
21
22N
iicd
NdIG
νννν .
In our hierarchical model, the above parameters are upper level in our model.
However, g and ΣΣΣΣ are the lower level parameters since they are sampled based on
the high level parameters.
Yip, T. L., Sun, X. Y., & Liu, J. J. (2011). Group and individual heterogeneity in a stochastic frontier model: Container terminal operators. European Journal of Operational Research, 213(3), 517-525
18
(f). Sampling g from ( )DDdN , , with ( ) 111 −−− +Σ= gVND , 0
1
1
1gVgd g
N
i
i
−
=
− +Σ=∑ .
(g). Sampling ΣΣΣΣ from ( )( )
′
−−++ ggggrSNrIW ii, .
The MCMC simulation is implemented by a Metropolis sampling within Gibbs
algorithm. The above steps (a) to (g) are repeated many times after the “burn-in”
period, and the draws from the convergent distribution are used to construct the
estimates for the unknown parameters. Although we do not model directly the
individual heterogeneity across terminal operators in their cost functions, the MCMC
method is flexible enough to incorporate individual heterogeneity in the parameters.
For example, we can easily extend the model by modelling Ψ to vary across terminal
operators following a joint normal distribution, which is conditional on the ports’
characteristics. To estimate the extended model, we only need modify steps (a) to (b)
to draw for each port. Then, conditional on the draws of Ψ , we can estimate the
hyper-parameters governing the conditional distribution of Ψ as a simple
multivariate regression model. This kind of hierarchical Bayesian approach has
already shown flexibility and computational advantages in estimating models with
random parameters in recent econometrics literature.
References
Aigner A, Lovell CAK, Schmidt P. Formulation and estimation of stochastic frontier
production models. Journal of Econometrics 1977; 6(1); 21-37. Caves RE. Multinational Enterprise and Economic Analysis (3rd edition). Cambridge
University Press; 2007. Chang S. Production function and capacity utilization of the port of Mobile. Maritime
Policy and Management 1978; 5(4); 297-305. Charnes A, Cooper WW, Rhodes E. Measuring the efficiency of decision making
units. European Journal of Operational Research 1978; 2(6); 429-444. Chang CE, Hasan I, Hunter WC. Efficiency of multinational banks: An empirical
investigation. Applied Financial Economics 1998; 8(6); 689-696. Cullinane K, Wang TF, Song DW, Ji P. The technical efficiency of container ports:
Comparing data envelopment analysis and stochastic frontier analysis. Transportation Research Part A 2006; 40(4); 354-374.
Dowd TJ, Leschine TM. Container terminal productivity: A perspective. Maritime
Policy and Management 1990; 17(2); 107-112. Drewry. Annual Review of Global Container Terminal Operators. Drewry Shipping
Consultants: London; 2002. Drewry. Annual Review of Global Container Terminal Operators. Drewry Shipping
Consultants: London; 2005.

Yip, T. L., Sun, X. Y., & Liu, J. J. (2011). Group and individual heterogeneity in a stochastic frontier model: Container terminal operators. European Journal of Operational Research, 213(3), 517-525
19
Drewry. Annual Review of Global Container Terminal Operators. Drewry Shipping Consultants: London; 2007.
Estache A, Gonzalez M, Trujillo L. Efficiency gains from port reform and the potential for yardstick competition: Lessons from Mexico. World
Development 2002; 30(4); 545-560. Fenn P, Vencappa D, Diacon S, Klumpes P, O’Brien C. Market structure and the
efficiency of European insurance companies: A stochastic frontier analysis. Journal of Banking and Finance 2008; 32(1); 86-100.
Fernández JE, de Cea J, Fernández JM. Port privatization in developing countries: The case of container terminals. International Journal of Transport Economics 1999; 26(2); 292-313.
Gonzalez MM, Trujillo L. Efficiency measurement in the port industry: A survey of the empirical evidence. Journal of Transport Economics and Policy 2009; 43(2); 157-192.
Greene WH. Econometric Analysis (6th edition). Pearson Prentice-Hill: Upper Saddle River, New Jersey; 2008.
Hui ECM, Ng MH, Xu JJ, Yip TL. The cargo throughput response to factor cost differentials: An analysis for the port of Hong Kong. Transportmetrica 2010 (in press).
Hung SW, Lu WM, Wang TP. Benchmarking the operating efficiency of Asia container ports. European Journal of Operational Research 2010; 203(3); 706-713.
Jansson JO, Shneerson D. Port Economics. MIT Press: Cambridge, Mississippi; 1982.
Jara-Díaz S, Martinez-Budría E, Cortes C, Basso L. A multioutput cost function for the services of Spanish ports’ infrastructure. Transportation 2002; 29(4); 419-437.
Kim M, Sachish A. The structure of production, technical change and productivity in a port. Journal of Industrial Economics 1986; 35(2); 209-223.
Lee YH. Group-specific stochastic production frontier models with parametric specifications. European Journal of Operational Research 2010; 200(2); 508-517.
Liu Z. The comparative performance of public and private enterprises: The case of British ports. Journal of Transportation Economics and Policy 1995; 29(3); 263-274.
Martínez-Budría E, Díaz-Armas R, Navarro-Ibañez M, Ravelo-Mesa T. A study of the efficiency of Spanish port authorities using data envelopment analysis. International Journal of Transport Economics 1999; 26(2); 237-253.
Martínez-Budría E, Jara-Díaz SR, Ramos F. Adapting productivity theory to the quadratic cost function: An application to the Spanish electric sector. Journal
of Productivity Analysis 2003; 20(2); 213-229. McConville J. Economics of Maritime Transport: Theory and Practice. Witherby:
London; 1999. Meeusen W, van den Broeck J. Efficiency estimation from Cobb-Douglas production
function with composed error. International Economic Review 1977; 18(2); 435-444.
Notteboom T, Coeck C, van den Broeck J. Measuring and explaining the relative efficiency of container terminals by means of Bayesian stochastic frontier models. International Journal of Maritime Economics 2000; 2(2); 83-106.

Yip, T. L., Sun, X. Y., & Liu, J. J. (2011). Group and individual heterogeneity in a stochastic frontier model: Container terminal operators. European Journal of Operational Research, 213(3), 517-525
20
Oum TH, Yan J, Yu C. Ownership forms matter for airport efficiency: A stochastic frontier investigation of worldwide airports. Journal of Urban Economics
2008; 64(2); 422-435. Shang JK, Hung WT, Lo CF, Wang FC. Ecommerce and hotel performance: Three
stage DEA analysis. Service Industries Journal 2007; 28(4); 529-540. Shao BM, Lin WT. Technical efficiency analysis of information technology
investments: A two-stage empirical investigation. Information and
Management 2002; 39(5); 391–401. Sharma M, Yu SJ. Benchmark optimization and attribute identification for
improvement of container terminals. European Journal of Operational
Research 2010; 201(2); 568-580. Shneerson D. Investment in port systems: A case study of the Nigerian ports. Journal
of Transport Economics and Policy 1981; 15(3); 201-216. Shneerson D. Short term planning for a ports system. Maritime Policy and
Management 1983; 10(4); 217-250. Talley WK. Performance indicators and port performance evaluation. Logistics and
Transportation Review 1994; 30(4); 339-352. Tongzon JL. The Port of Melbourne Authority’s pricing policy: Its efficiency and
distribution implications. Maritime Policy and Management 1993; 20(3); 197-203.
Tongzon J. Efficiency measurement of selected Australian and other international ports using data envelopment analysis. Transportation Research Part A 2001; 35(2); 113-128.
UNCTAD. Port development. A handbook for planners in developing countries. Second edition. UNCTAD: Geneva; 1978.
UNCTAD. Port Marketing and the Challenge of the Third Generation Port. UNCTAD: Geneva; 1990.
UNCTAD. Fourth generation port. UNCTAD Ports Newsletter 1999; 19; 9-12. Wanhill SRC. A study in port planning: The example of Mina Zayed. Maritime
Policy and Management 1974; 2(1); 48-55. Yan J, Sun X, Liu JJ. Assessing container operator efficiency with heterogeneous and
time-varying production frontiers. Transportation Research Part B 2009; 43(1); 172-185.
Zheng J, Liu X, Bigsten A. Ownership structure and determinants of technical efficiency: An application of data envelopment analysis to Chinese enterprises (1986–1990). Journal of Comparative Economics 1998; 26(3); 465–484.

Yip, T. L., Sun, X. Y., & Liu, J. J. (2011). Group and individual heterogeneity in a stochastic frontier model: Container terminal operators. European Journal of Operational Research, 213(3), 517-525
21
Table 1: Summary of Variables
Variables Mean Std. Dev. Minimum Maximum
A. Terminal Output
TEU: Container Throughput in TEUs (000’s) B. Terminal Inputs
1. Cargo Handling Equipment:
Cargo handling capacity at quay in tonnage a
Cargo handling capacity at yard in tonnage b
2. Terminal Infrastructure:
Number of berths Length of quay line in meters Terminal area in squared meters (000’s)
3. Storage Facilities:
Storage capacity in number of TEUs (000’s) Number of electric reefer points
C. Individual Characteristics
1. Terminal and port level:
EDI (in fraction of total sample) Depth of water in meters Number of liners calling at the terminal Number of operators in port Number of terminals in port 2. Operator group dummies (in fraction of total sample):
Global Carrier Global Stevedore Other: not belong to any of above groups
3. Country Characteristics:
GDP in current US$ (billion) c Goods exports in US$ (billion) c
Goods imports in US$ (billion) c
GDP per capita in current US$ c 4. Continental Distribution (in fraction of total sample):
Asia Europe North America Latin America Oceania Africa
Period Number of Countries Number of Ports Number of Terminal Operators Number of Terminals Number of Observations
936.4 385.0 5,116.5 5.1 1,361.3 604.9 23.2 480.6 0.3 13.2 16.2 3.7 6.8 0.09 0.15 0.76 2,240 271 308 18,654.9 0.37 0.27 0.17 0.06 0.09 0.04 1997-2004 39 78 141 397 597
1,741.7 470.7 7,060.9 5.2 1,181.6 844.6 72.4 539.7 3.5 14.5 2.6 6.2 3,270 249 365 12,367.8
4.6 23.9 38.6 1 200 7.7 0.6 4 4.5 1 1 1 5.4 0.4 1.8 405
20,600 5,416.2 62,731.8 37 9,000 8,092 1,200 3,768 32.0 114 10 31 12,500 972 1,670 37,651
aAn aggregate of (1) Quay cranes and (2) Ship shore container gantries. bAn aggregate of (1) Gantry cranes, (2) Yard cranes, (3) Yard gantries, (4) Reachstackers, (5) Yard tractors, (6) Yard chassis trailers, (7) Forklifts, (8) Straddle carriers, (9) Container lifters, and (10) Mobile cranes. c The country data can be found at the World Bank website: http://devdata.worldbank.org/dataonline/old-default.htm

Yip, T. L., Sun, X. Y., & Liu, J. J. (2011). Group and individual heterogeneity in a stochastic frontier model: Container terminal operators. European Journal of Operational Research, 213(3), 517-525
22
Table 2: Posterior means and standard deviations of coefficients of the
Stochastic Production Frontier
Variable Heterogeneous model Conventional Model
1. Log inputs
Quay superstructure ( 1β ) 0.1815 (0.0725) 0.2142 (0.0581)
Yard equipment ( 2β ) 0.0200 (0.0361) 0.0527 (0.0315)
Berth number ( 3β ) 0.0953 (0.0509) 0.0290 (0.0576)
Quay length ( 4β ) 0.0802 (0.0507) 0.1228 (0.0589)
Terminal area ( 5β ) 0.0268 (0.0582) 0.0912 (0.0444)
Storage capacity ( 6β ) 0.0087 (0.0229) -0.0406 (0.0274)
Reefer points ( 7β ) 0.1400 (0.0355) 0.2125 (0.0320)
2. Individual intercept
Constant ( 0θ ) -0.7063 (0.3121) 0.8267 (0.3495)
2.1 Port characteristics
Water depth ( 1θ ) 0.4184 (0.2770) 0.6644 (0.2626)
Ship calls ( 2θ ) 0.1322 (0.0369) 0.1550 (0.0399)
Number of operators ( 3θ ) -0.0520 (0.0985) -0.3789 (0.0761)
Number of terminals ( 4θ ) -0.0219 (0.0886) 0.1992 (0.1039)
2.2 Country characteristics
GDP ( 5θ ) -0.3815 (0.0872) 0.2437 (0.0972)
Goods exports ( 6θ ) 0.0660 (0.1024) -0.1715 (0.0719)
Goods imports ( 7θ ) 0.3088 (0.1114) -0.0023 (0.0697)
GDP per capita ( 8θ ) -0.7931 (0.2498) -0.4889 (0.1123)
2.3 Operator Group
Carrier ( 9θ ) 0.3594 (0.2344) 0.3780 (0.1626)
Stevedore ( 10θ ) 0.4538 (0.1874) 1.6053 (0.3623)
2.4 Time trend
Time ( 1r ) -0.0719 (0.0870) -0.5350 (0.2197)
Time squared ( 2r ) 0.1031 (0.0430) 0.1553 (0.0996)
3. Variance of the constant (2
Vσ ) 0.4437 (0.0650)
4. Inefficiency parameters
Coeff. of Constant ( 1g ) -1.8584 (0.3797) 0.3517 (0.1554)
Coeff. of Time ( 2g ) -0.5967 (0.4785) -0.4790 (0.1711)
Coeff. of Time squared ( 3g ) -1.1674 (0.2398) -0.0812 (0.0913)
Coeff. of Carrier ( 4g ) -0.3961 (0.4313) 0.7357 (0.3945)
Coeff. of Stevedore ( 5g ) -1.0024 (1.0824) -0.1368 (0.2601)
Variances ( 11Σ ) 2.2743 (0.7468) 0.3327 (0.0838)
Variances ( 22Σ ) 2.0274 (0.8271) 0.2680 (0.0688)
Variances ( 33Σ ) 1.4244 (0.4569) 0.1736 (0.0386)
Variances ( 44Σ ) 1.5650 (0.9784) 0.7158 (0.4536)

Yip, T. L., Sun, X. Y., & Liu, J. J. (2011). Group and individual heterogeneity in a stochastic frontier model: Container terminal operators. European Journal of Operational Research, 213(3), 517-525
23
Variances ( 55Σ ) 1.9605 (1.1155) 0.5996 (0.2482)
5. Other parameters
Variance of noise (2
εσ ) 0.0321 (0.0029) 0.0371 (0.0034)
Numbers in parentheses are the posterior standard deviations. All the input and output variables are normalised with respect to their sample means before taking log.
Yip, T. L., Sun, X. Y., & Liu, J. J. (2011). Group and individual heterogeneity in a stochastic frontier model: Container terminal operators. European Journal of Operational Research, 213(3), 517-525
24
Figure 1: Market share of the leading terminal operator groups (2004 ranking)
0
20
40
60
1991 1996 2001 2003 2004 2005 2006
Year
Wo
rld
Ma
rke
t S
hare
(%
)HPH
PSA
APM
P&O Ports
Cosco
Eurogate
DPA
Remarks: Dubai Port World acquired P&O Ports in 2006. PSA acquired 20% of HPH in 2006. Figure 2: Container terminals, stevedores, and carriers
(a) (b)
Remarks: T in the circle means Terminal. (a) represents the original structure of port industry. The
Stevedore handles the cargo on the terminal and Carrier transports them from Terminal to Terminal. (b)
reveals the current tendency. Some Carrier Group can integrate the stevedore function. In the
meanwhile, Stevedore Group purchase many terminals to operate. Eventually, there are Carrier Group,
Stevedore Group and individual operators in terminal running.

Yip, T. L., Sun, X. Y., & Liu, J. J. (2011). Group and individual heterogeneity in a stochastic frontier model: Container terminal operators. European Journal of Operational Research, 213(3), 517-525
25
Figure 3: Distributions of Prior and Posterior of variable 1β
02
46
81
0D
en
sity
-20 -10 0 10 20Beta1
Prior Posterior
Figure 4: The converge analysis of variable 1β
-10
-8-6
-4-2
0B
eta
1
0 5000 10000 15000 20000Gibbs Draws

Yip, T. L., Sun, X. Y., & Liu, J. J. (2011). Group and individual heterogeneity in a stochastic frontier model: Container terminal operators. European Journal of Operational Research, 213(3), 517-525
26
Figure 5: Conventional Stochastic Frontier Analysis Model
Figure 6: Heterogeneous Stochastic Frontier Analysis Model

Yip, T. L., Sun, X. Y., & Liu, J. J. (2011). Group and individual heterogeneity in a stochastic frontier model: Container terminal operators. European Journal of Operational Research, 213(3), 517-525
27
Figure 7: The distribution of random variable iv
0.2
.4.6
Den
sity
-5 0 5 10Vi
Figure 8: Examples of individual efficiency change of heterogeneous model and
conventional model
Yip, T. L., Sun, X. Y., & Liu, J. J. (2011). Group and individual heterogeneity in a stochastic frontier model: Container terminal operators. European Journal of Operational Research, 213(3), 517-525
28
Legend: square represent heterogeneous model, triangle represent conventional model