Groundwater in the Okataina caldera - waikato.ac.nz · 1 Groundwater in the Okataina caldera: Model...
75
1 Groundwater in the Okataina caldera: Model of future nitrogen loads to Lake Tarawera CBER Report 94 Prepared for Environment Bay of Plenty and Lake Tarawera Ratepayers’ Association By Nicolas Gillon 1 , Paul White 2 , David Hamilton 1 and Warwick Silvester 1 1. Centre for Biodiversity and Ecology Research, School of Science and Engineering, The University of Waikato, Private Bag 3105, Hamilton 3240, New Zealand 2. Institute of Geological and Nuclear Sciences, Private Bag 2000, Taupo, 3352, New Zealand September 2009
Transcript of Groundwater in the Okataina caldera - waikato.ac.nz · 1 Groundwater in the Okataina caldera: Model...
1
Groundwater in the Okataina caldera:
Model of future nitrogen loads to Lake Tarawera
CBER Report 94
Prepared for Environment Bay of Plenty and
Lake Tarawera Ratepayers’ Association
By Nicolas Gillon1, Paul White2, David Hamilton1 and Warwick Silvester1
1. Centre for Biodiversity and Ecology Research,
School of Science and Engineering, The University of Waikato, Private Bag 3105, Hamilton 3240,
New Zealand 2. Institute of Geological and Nuclear Sciences,
Private Bag 2000, Taupo, 3352, New Zealand
September 2009

2
Table of contents
List of figures……………………………………………………………………………. 4 List of tables………………………………………………………………………………6
1. Introduction ................................................................................................... 6
2. Geomorphology and Land Use .................................................................... 7
2.1 Okataina Volcanic Centre ................................................................................................ 7
2.2 Lake Tarawera surface catchment ................................................................................... 9
3. Geology ......................................................................................................... 12
3.1 Geological history and lithological description of the Okataina Caldera complex ....... 12
3.1.1 Whakamaru Ignimbrite ......................................................................................................... 12
3.1.2 Matahina Ignimbrite ............................................................................................................. 12
3.1.3 Pokopoko-Onuku Pyroclastics .............................................................................................. 13
3.1.4 Kaingaroa Ignimbrite ........................................................................................................... 13
3.1.5 Mamaku Ignimbrite .............................................................................................................. 13
3.1.6 Rotoiti Pyroclastics ............................................................................................................... 14
3.1.7 Huka Group Sediments ......................................................................................................... 14
3.1.8 Recent Okataina Rhyolites .................................................................................................... 14
3.2 Tarawera geological model ........................................................................................... 18
4. Hydrogeology............................................................................................... 21
4.1 Aquifer layers ................................................................................................................ 21
4.2 Geothermal features ....................................................................................................... 22
5. Surface Hydrology ...................................................................................... 24
6. Water Budget .............................................................................................. 26
6.1 Okataina Caldera water budget ...................................................................................... 26
6.1.1 Lake Rerewhakaaitu catchment ........................................................................................... 27
6.1.2 Lake Okaro catchment ......................................................................................................... 29
6.1.3 Lake Rotomahana catchment ............................................................................................... 30
6.1.4 Lake Tikitapu catchment ...................................................................................................... 33
6.1.5 Lake Rotokakahi catchment ................................................................................................. 34
6.1.6 Lake Okareka catchment ..................................................................................................... 36

3
6.1.7 Lake Okataina catchment .................................................................................................... 37
6.1.8 Lake Tarawera catchment .................................................................................................... 38
6.2 Groundwater transfers between catchments ................................................................. 40
6.3 Lake Tarawera water budget ........................................................................................ 42
6.3.1 Water budget components..................................................................................................... 42
6.3.2 Water budget ......................................................................................................................... 43
7. Lake Tarawera Groundwater Flow Model .............................................. 44
7.1 Lake Tarawera sub-catchments ..................................................................................... 44
7.2 Conceptual model .......................................................................................................... 47
7.2.1 Initial properties of the proposed model .............................................................................. 47
7.2.2 Boundary conditions and inflows ......................................................................................... 47
7.3 Introduction to the FEFLOW software .......................................................................... 49
7.4 Model build.................................................................................................................... 49
7.5 Model running ............................................................................................................... 50
7.6 Steady state solution ...................................................................................................... 52
7.6.1 General results ..................................................................................................................... 52
7.6.2 Estimated groundwater flow properties .............................................................................. 53
7.6.3 Water budget analysis........................................................................................................... 53
8. Land Use Scenarios ..................................................................................... 54
Scenario 1 : Pre-historic land use ....................................................................................... 56
Scenario 2 : Current land use .............................................................................................. 58
Scenario 3: Cattle farming extension .................................................................................. 61
Scenario 4: Dairy extension ................................................................................................ 62
9. Septic Tanks ............................................................................................................. 64
Scenario 5 : Tourist development (with pasture retirement) ............................................... 64
Scenario 6 : On-site effluent treatment ................................................................................ 66
Scenario 7: Wastewater treatment plant ............................................................................. 67
10. Information gaps and recommendations .................................................. 68
11. Summary ...................................................................................................... 70
12. References .................................................................................................... 72
4
List of Figures
Figure 1 - Topographic map (MapToaster Topo NZ 1:250,000) of the Okataina Volcanic
Centre; east of Lake Rotorua. ...................................................................................... 9
Figure 2 - Lake Tarawera catchment topographic map. .......................................................... 11
Figure 3 - Land use of the Lake Tarawera catchment in 2003. ............................................... 11
Figure 4 - Geological map of the Okataina Volcanic Centre (Nairn 2002). ........................... 16
Figure 5 – Lake Tarawera catchment NW-SE cross section (New Zealand Geological Survey (1989). ........................................................................................................................ 19
Figure 6 - Three-dimensional model of Okataina Caldera complex (Pamer pers. comm.)..... 20
Figure 7 - North-south vertical geological cross section of the Lake Tarawera catchment (Pamer pers. comm.). ................................................................................................. 20
Figure 8 - Geothermal areas (in orange) in the OVC (Nairn, 2002). ...................................... 23
Figure 9 - Lake Tarawera surface flow monitoring sites ........................................................ 24
Figure 10 - Correlation between lake water level and lake volume for Lake Rerewhakaaitu. 27
Figure 11 - Correlation between lake water level and lake volume for Lake Okaro. ............. 29
Figure 12 - Correlation between lake water level and lake volume for Lake Rotomahana. ... 31
Figure 13 - Geological cross section between Lake Rotomahana and Lake Tarawera indicating the geological link between the two lakes (from the Earth Vision geological model of the OVC, Pamer, pers. comm.). ................................................ 32
Figure 14 - Correlation between lake water level and lake volume for Lake Tikitapu. .......... 33
Figure 15 - Correlation between lake water level and lake volume for Lake Rotokakahi. ..... 34
Figure 16 - Correlation between lake water level and lake volume for Lake Okareka. The lake volume change for Lake Okareka in the period 1992- 2005 was equivalent to an inflow of 1 L s-1. ......................................................................................................... 36
Figure 17 - Correlation between lake water level and lake volume for Lake Okataina. ......... 37
Figure 18 - Correlation between lake water level and lake volume for Lake Tarawera. ........ 39
Figure 19 – Location of Lake Tarawera subcatchments. ........................................................ 46
Figure 20 - 3D view of the Lake Tarawera catchment groundwater flow model. .................. 50
Figure 21 - Head elevation in the Lake Tarawera catchment. Elevations are represented by colours and the inset shows the elevation scale. ........................................................ 52
Figure 22 - Travel time of the nitrogen in the Lake Tarawera catchment for different porosity values. The minimum travel time obtained with the lowest porosity is estimated around 50 years. The more consistent results are obtained with a porosity of 0.03: steady state for the nitrogen concentration is obtained around 170 years. Thus this value was used for the model porosity. ...................................................................... 55
Figure 23 - Lake Tarawera catchment land use scenario 1: pre-historic land use. ................. 56
Figure 24 - Nitrogen evolution in the Lake Tarawera catchment scenario 1a: prehistoric land use and high nitrogen input at the boundary. ............................................................. 57
Figure 25 – Lake Tarawera catchment land use scenario 2: current land use. ........................ 58

5
List of Tables
Table 1 - Summary statistics for the lakes and land use for each surface catchment (Environment Bay of Plenty, 2003). ............................................................................ 8
Table 2 - Lake Tarawera catchment land use from 1986 (White and Cooper 1991) to 2003 (Scholes 2005). ........................................................................................................... 10
Table 3 - Estimates of nitrogen export evolution for the different surfaces of the Lake Tarawera catchment from 1986 (White and Cooper 1991) to 2003 (Scholes 2005). 10
Table 4 - Stratigraphy and chronology of Haroharo vent zone lavas and pyroclastics ........... 17
Table 5 - Stratigraphy and chronology of Tarawera Volcanic Complex lavas and pyroclastics (Nairn 2002). .............................................................................................................. 18
Table 6 - Estimated horizontal hydraulic conductivities of aquifers in the Lake Tarawera catchment. .................................................................................................................. 22
Table 7 - Assessed flows of the permanent streams and springs of Lake Tarawera. .............. 25
Table 8 - Estimation of the groundwater flow between OVC catchments and from OVC catchments to other catchments. ................................................................................ 41
Table 9 Groundwater outflow to the east from the Lake Tarawera catchment with ............... 41
Table 10 - Lake Tarawera water budget. ................................................................................. 44
Table 11 - Average rainfall recharge for Lake Tarawera sub-catchments. ............................. 48
Table 12 - Data used for the Lake Tarawera hydrogeological model. .................................... 49
Table 13 - Water budget calculation for Lake Tarawera sub-catchments. .............................. 53
Table 14 - Nitrogen export to Lake Tarawera and land use. ................................................... 54
Table 15 - Objectives for proposed drill sites. ......................................................................... 69
Table 16 - Maximum expected nitrogen load by groundwater flow into Lake Tarawera for scenarios of land use within the Lake Tarawera catchment. ...................................... 71
6
1.
Protection and restoration of water quality are a major priority of the New Zealand
government
Introduction
1. To support this objective, a monitoring and an action programme named “The
Regional Water and Land Plan” was set up by the Environment Bay of Plenty Regional
Council in February 2005 for the Rotorua lakes district2
Currently water quality of Lake Tarawera is slightly worse than during the 1990s
(Environment Bay of Plenty 1997). The Trophic Level Index (TLI), a measure of water
quality, is 2.9 in Lake Tarawera. Environment Bay of Plenty wishes to reduce the TLI to 2.6,
to improve the water quality of the lake. Actions have already been programmed to support
this initiative, including sewage treatment
. Lake Tarawera is part of this
programme. The plan includes a Tarawera River management plan developed originally by
Bay of Plenty Catchment Commission (1985).
3
Most of the water inflow to the lake is from groundwater. Nitrogen loads to the lake from
groundwater are largely unknown as there is limited monitoring data. Development of highly
productive pasture in the last 50 years, coupled with a residence time for the groundwater
estimated on average to be c. 200 years, look likely to result in increasing nutrient loads to the
lake with potential for deterioration of water quality.
.
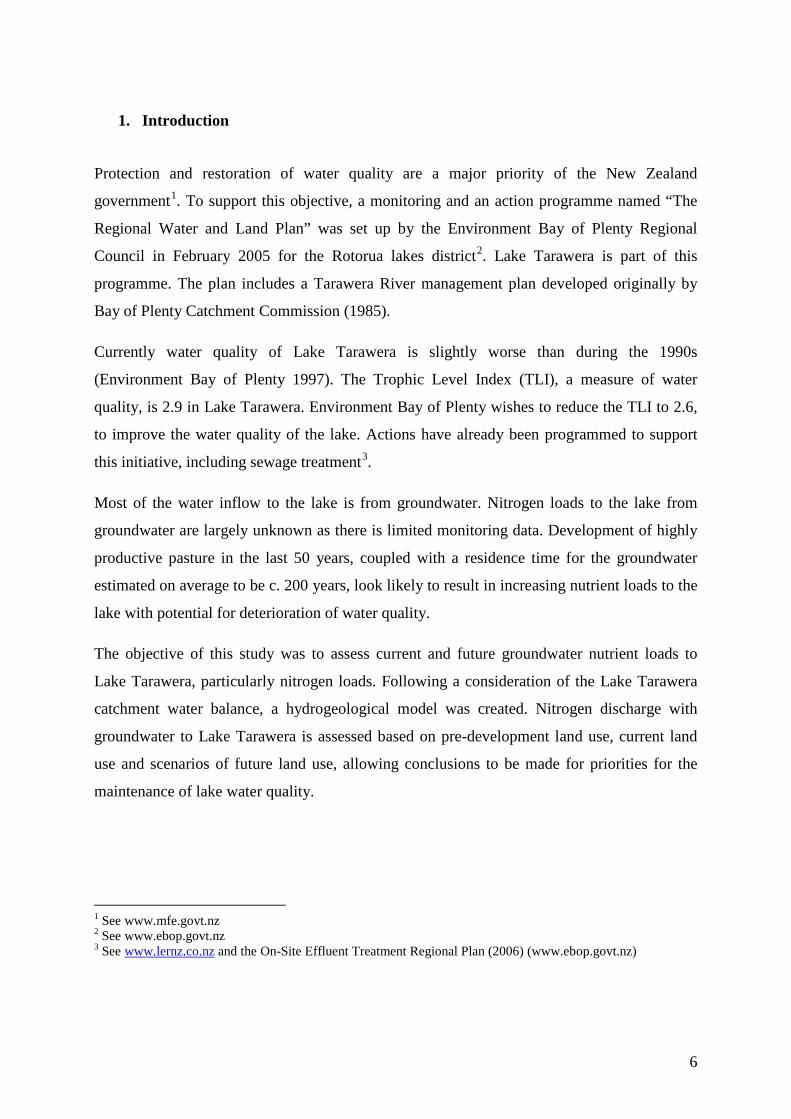
The objective of this study was to assess current and future groundwater nutrient loads to
Lake Tarawera, particularly nitrogen loads. Following a consideration of the Lake Tarawera
catchment water balance, a hydrogeological model was created. Nitrogen discharge with
groundwater to Lake Tarawera is assessed based on pre-development land use, current land
use and scenarios of future land use, allowing conclusions to be made for priorities for the
maintenance of lake water quality.
1 See www.mfe.govt.nz 2 See www.ebop.govt.nz 3 See www.lernz.co.nz and the On-Site Effluent Treatment Regional Plan (2006) (www.ebop.govt.nz)
7
2. Geomorphology and Land Use
The Okataina Volcanic Centre (OVC), located east of Lake Rotorua, has given rise to eight
lakes (Figure 1) within the Okataina Caldera complex. Topography of the Okataina Volcanic
Centre is marked by volcanic domes, plateaus, hills and plains. The eastern part of the study
area is dominated by Maikati Dome (934 m), Mount Tarawera including Tarawera Dome
(1,050m), Ruawahia Dome (1,111 m) and Wahanga Dome (1,047 m). The southern part of the
OVC consists of plateaus and hills. The western and northern parts of the study area include
hills and valleys bounded by the Rotorua and Rotoiti catchments. Ground elevations for the
whole area range from 1,111 m at the Ruawahia Dome to 299 m on the edge of Lake
Tarawera. The catchment area of the eight lakes is approximately 331 km2 (Table 1).
2.1 Okataina Volcanic Centre
The chronology of lake formation is described by Nairn (2002):
• Lake Okareka (formed circa 19,000 yr B.P.)
The earliest formed lake of the Okataina Caldera complex is Lake Okareka. It is located
at an altitude of 355 m on the eastern part of the caldera. The lake occupies an area of
3.34 km2 in a valley eroded back into the ignimbrite plateau.
• Lake Tikitapu (Blue Lake) and Lake Rotokakahi. (Green Lake) (formed circa 13,300
yr B.P.)
Located respectively at an altitude of 417 m and 394 m, these lakes were formed after
damming of lava from a Rotorua ash eruptive episode. They occupy an area of 1.46 km2
(Lake Tikitapu) and 4.52 km2 (Lake Rotokakahi).
• Lake Okataina (formed circa 7000 yr B.P.)
Lake Okataina was formed after lava flows of a rhyolite eruptive episode dammed the
valley which formed from the eastern margin. The eroded walls of the Haroharo Caldera
form the western margin of the lake. Lake Okataina has an area of 10.8 km2.
• Lake Tarawera (formed circa 5000 yr B.P.)
Around 2000 years after the formation of Lake Okataina, with Haraharo and Tarawera
volcanoes erupted and lava flows delimited a basin which progressively filled with

8
water to produce the Lake Tarawera. This lake has the largest area (41.65 km2) and the
lowest elevation (299 m) of the OVC lakes.
• Lake Rerewhakaaitu (formed circa 700 yr B.P.)
Lake Rerewhakaaitu was formed by a pyroclastic eruption that created a dam. The lake
occupies an area of 5.3 km2 and has an altitude of 438 m.
• Lake Rotomahana (formed circa 111 yr B.P.)
The present Lake Rotomahana was created by a series of hydrothermal explosions at the
south-west of Mount Tarawera. Deep craters subsequently filled to form the current lake
which has a water level of 335 m above mean sea level and an area of 8.99 km2.
Most of the Okataina caldera complex is covered by forest (Table 1), especially on the
northern and eastern parts, on the slopes of the volcanic domes. Pasture is concentrated in the
southern caldera, around Lakes Rerewhakaaitu and Okaro. The western plains are farmed for
beef, deer and sheep. Human presence in the study area is localized mainly around the lakes,
in small towns such as Okareka and on the edge of the western edge of Lake Tarawera.
Rotorua City is the nearest developed urban area, with a population of approximately 65,901
(Government census 2006).
Table 1 - Summary statistics for the lakes and land use for each surface catchment (Environment Bay of Plenty, 2003).
Lake Age (years
BP)
Lake elevation
(m)
Lake area (km2)
Catchment area (km2)
Surface catchment land cover (%) in 2003 Indigenous
forest Exotic forest
Pasture Wetlands Urban
Rerewhakaaitu 700 438 5.3 37.0 7.2 15.2 75.3 2.3 0.0 Rotomahana 111 335 8.99 83.3 39.7 16.3 43.2 0.0 0.0 Rotokakahi 13,300 394 4.5 19.7 16.6 57.1 26.3 0.0 0.0 Tikitapu 13,300 417 1.46 6.2 79.2 17.3 3.5 0.0 0.0 Okareka 19,000 355 3.3 19.6 51.6 7.6 37.8 0.0 2.9 Okaro 800 412 0.33 3.89 2.1 6.3 90.6 0.0 0.0 Okataina 7,000 311 10.8 59.8 84.1 7.8 7.8 0.0 0.0 Tarawera 5,000 299 41.7 101.4 62.4 16.0 19.7 1.2 0.7 TOTAL 76.38 330.89

9
Figure 1 - Topographic map (MapToaster Topo NZ 1:250,000) of the Okataina Volcanic Centre; east of Lake Rotorua.
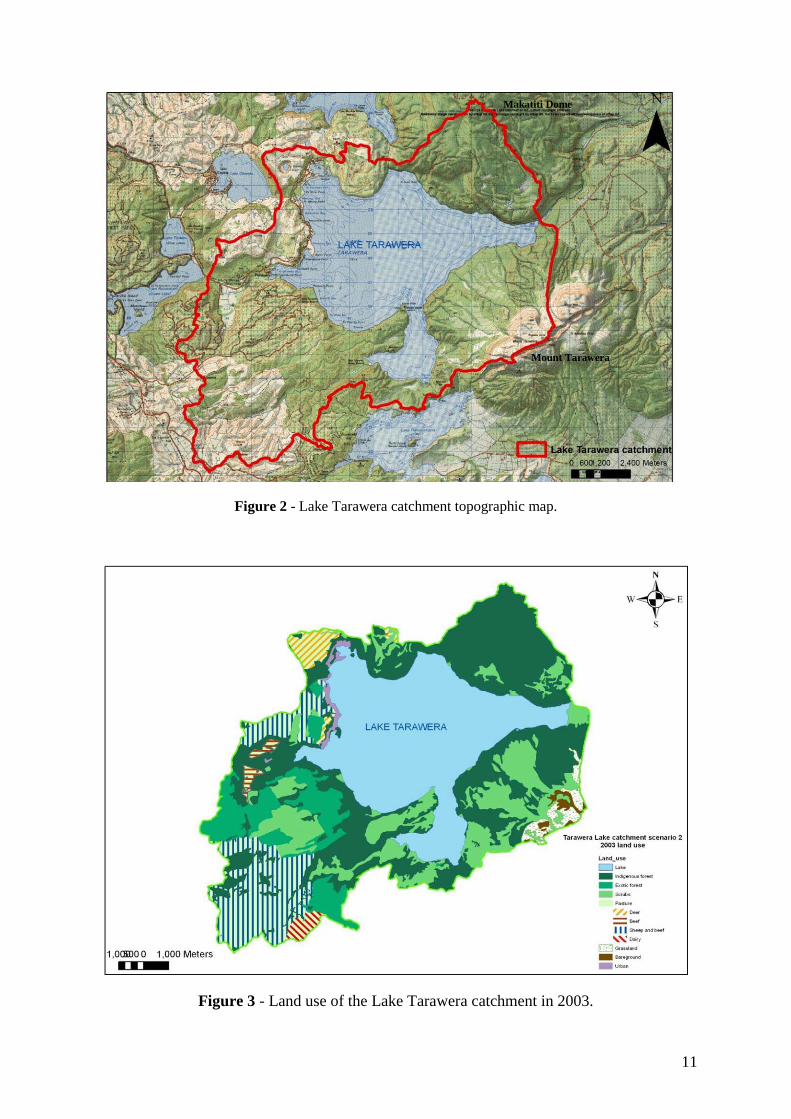
The Lake Tarawera catchment (Figure 2) includes hills, volcanic domes and plateaus, with the
lake being the lowest part of the catchment.
2.2 Lake Tarawera surface catchment
To the east, Lake Tarawera outlet is surrounded by domes that form the highest parts of the
catchment. The high point to the south is Mount Tarawera, which is composed of several
domes. To the north is Makatiti Dome (934 m elevation) which is part of the Okataina
Volcanic Centre. Both have unstable slopes criss-crossed with thalwegs that can give rise to
ephemeral streams and landslides after heavy rains.
The southern part of the Lake Tarawera catchment, linking Lake Rotomahana and Lake
Tarawera, is gently sloping. This area includes areas with geothermal activity (Section 4.2).
Two plateaus occur to the west, separated by the valley formed by Te Wairoa stream coming
from Lake Rotokakahi.
10
The northern catchment includes a boundary of Mamaku Ignimbrite, erupted from the
Rotorua caldera, with a gentle slope to Lake Tarawera, and a collapsed part of the OVC which
has created a natural barrier between Lake Okataina and Lake Tarawera.
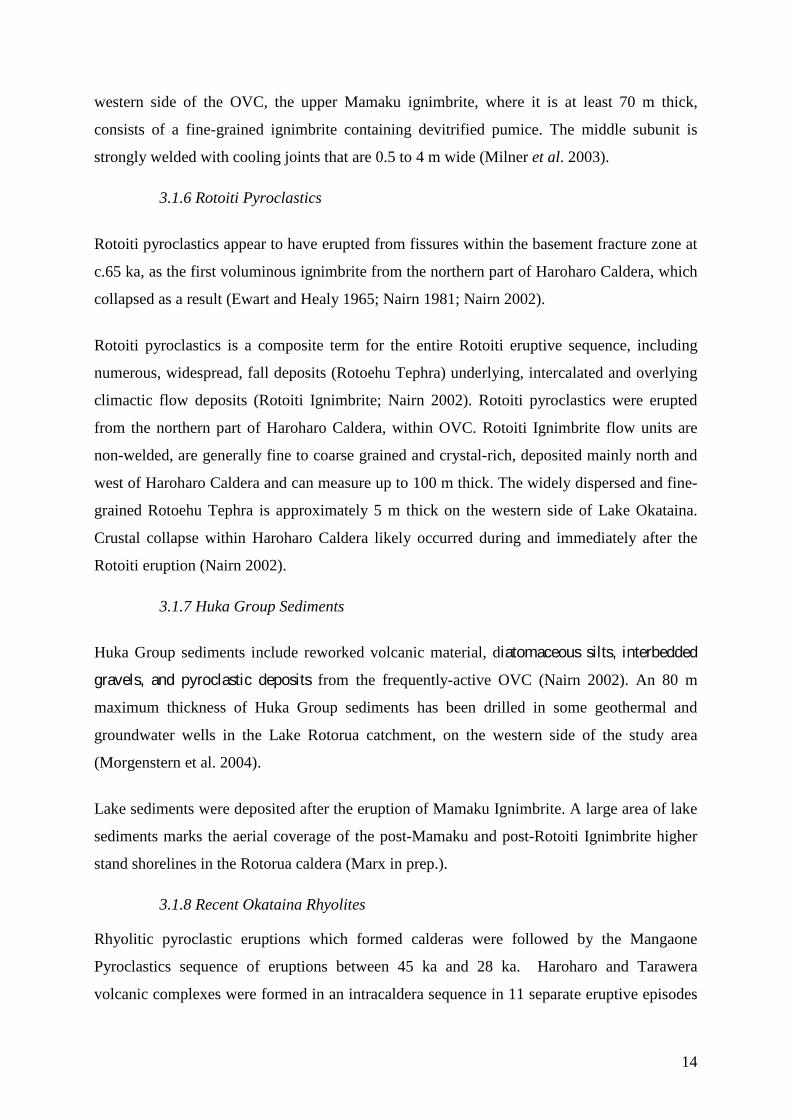
Land use in the Lake Tarawera catchment is dominated by indigenous forest (Figure 3). Scrub
occurs on the northern and eastern slopes of the mountains. The western catchment of Lake
Tarawera includes pasture, with sheep, beef and deer cattle and dairy land uses. Human
habitation occurs around the western edge of the Lake Tarawera (Figure 2).
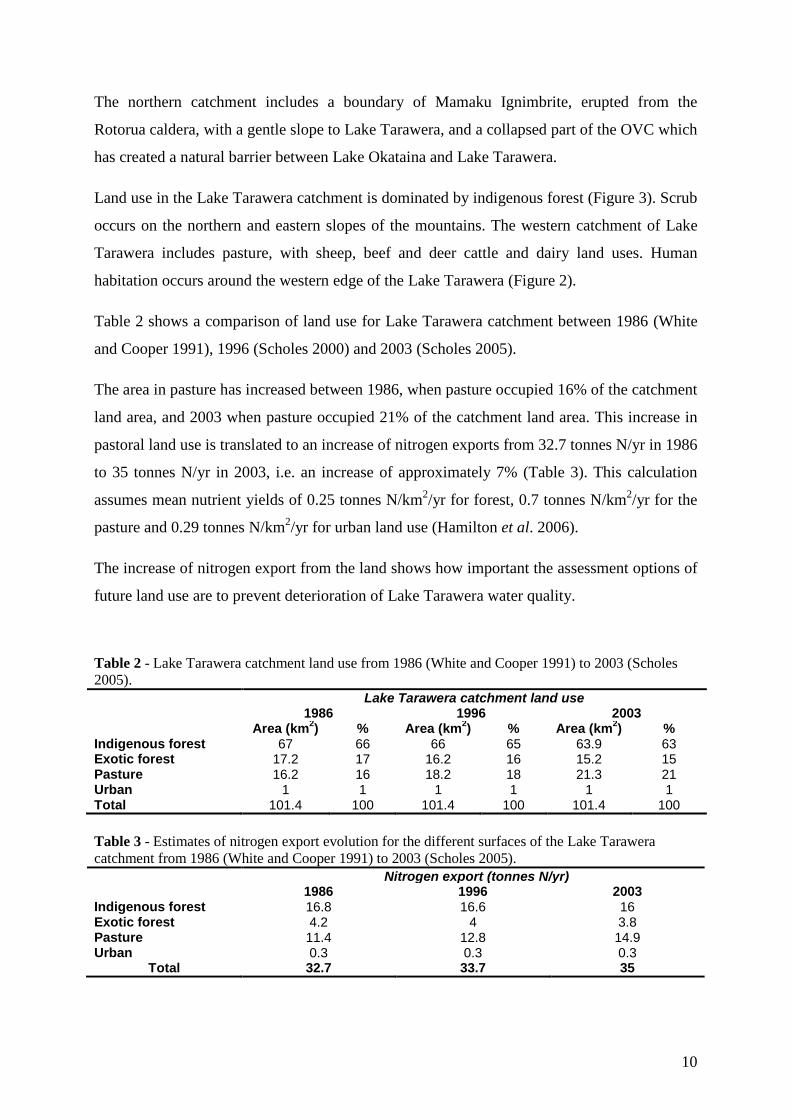
Table 2 shows a comparison of land use for Lake Tarawera catchment between 1986 (White
and Cooper 1991), 1996 (Scholes 2000) and 2003 (Scholes 2005).
The area in pasture has increased between 1986, when pasture occupied 16% of the catchment
land area, and 2003 when pasture occupied 21% of the catchment land area. This increase in
pastoral land use is translated to an increase of nitrogen exports from 32.7 tonnes N/yr in 1986
to 35 tonnes N/yr in 2003, i.e. an increase of approximately 7% (Table 3). This calculation
assumes mean nutrient yields of 0.25 tonnes N/km2/yr for forest, 0.7 tonnes N/km2/yr for the
pasture and 0.29 tonnes N/km2/yr for urban land use (Hamilton et al. 2006).
The increase of nitrogen export from the land shows how important the assessment options of
future land use are to prevent deterioration of Lake Tarawera water quality.
Table 2 - Lake Tarawera catchment land use from 1986 (White and Cooper 1991) to 2003 (Scholes 2005). Lake Tarawera catchment land use
1986 1996 2003 Area (km2) % Area (km2) % Area (km2) % Indigenous forest 67 66 66 65 63.9 63 Exotic forest 17.2 17 16.2 16 15.2 15 Pasture 16.2 16 18.2 18 21.3 21 Urban 1 1 1 1 1 1 Total 101.4 100 101.4 100 101.4 100 Table 3 - Estimates of nitrogen export evolution for the different surfaces of the Lake Tarawera catchment from 1986 (White and Cooper 1991) to 2003 (Scholes 2005). Nitrogen export (tonnes N/yr)
1986 1996 2003 Indigenous forest 16.8 16.6 16 Exotic forest 4.2 4 3.8 Pasture 11.4 12.8 14.9 Urban 0.3 0.3 0.3
Total 32.7 33.7 35
11
Figure 2 - Lake Tarawera catchment topographic map.
Figure 3 - Land use of the Lake Tarawera catchment in 2003.
Mount Tarawera
Makatiti Dome

12
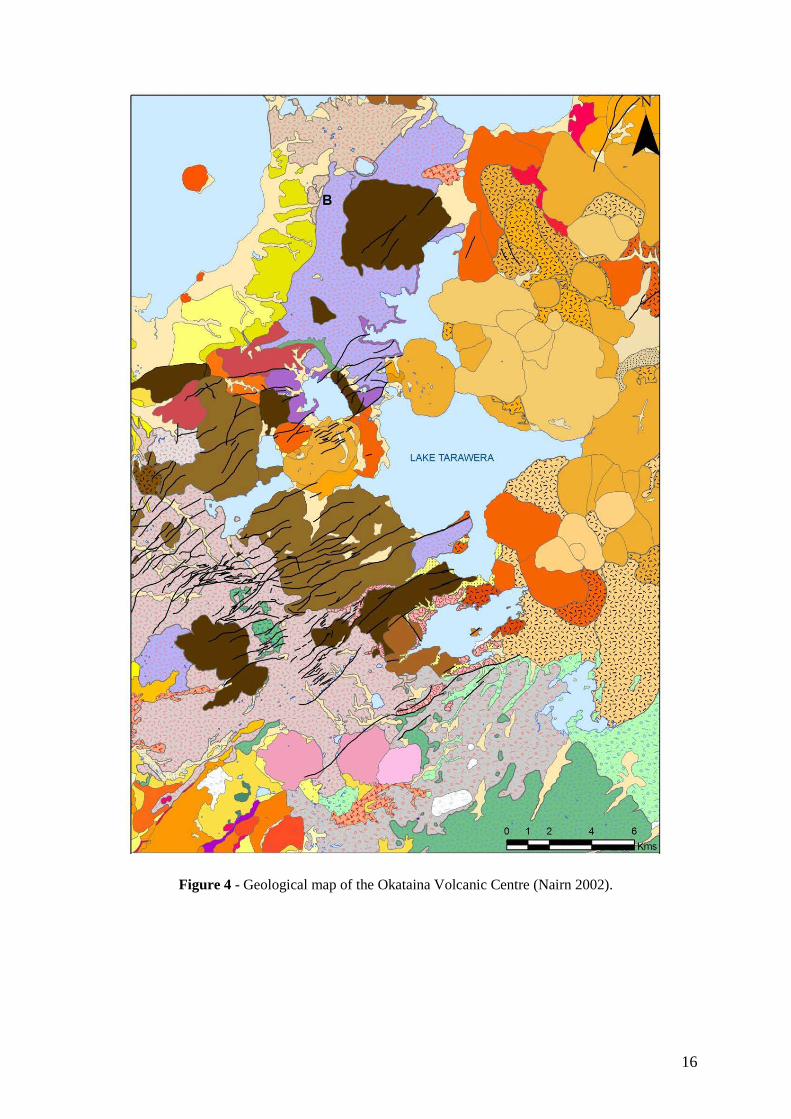
3. Geology
The geology of the Okataina Caldera Complex (Figure 4) has been shaped by volcanic events.
Calderas have been formed during the last 400,000 years, with two major and some smaller
eruptions (Nairn 2002). Described here are the geological units that are most relevant to the
hydrogeological model.
3.1 Geological history and lithological description of the Okataina Caldera complex
Early pyroclastic eruptions from the Okataina Volcanic Centre (OVC) were from multiple
source calderas in the central Taupo Volcanic Zone (TVZ) at around 0.34 Ma. Termed the
Whakamaru Group Pyroclastics, they form the basal units for groundwater aquifers in the
Rotorua catchment. A period of frequent eruptions sent extensive ignimbrite sheets from a
probable source in Maroa Caldera to the north (Wilson et al. 1995). In the Rotorua area,
drillholes have penetrated at least 100 m of Rangitaiki Ignimbrite; part of the Whakamaru
Group ignimbrites (Wilson et al. 1995; Nairn 2002). In general, the Whakamaru Group
pyroclastics are non-welded to moderately welded with some jointing observed in the eastern
margin of the Puhipuhi Basin in the OVC. The distinguishing feature of these ignimbrites is
that they are dark grey, crystal-rich, with abundant, large and predominantly quartz crystals
(Nairn 2002)
3.1.1 Whakamaru Ignimbrite
Matahina ignimbrite was erupted mainly from the eastern OVC around 0.28 Ma (Houghton et
al. 1995) and can be divided into a basal pyroclastic fall deposit, with three overlying
pyroclastic flow deposits. In the OVC area, the ignimbrite is commonly a compacted to
moderately welded light brown tuff, with lithic rhyolite and vesiculated obsidian inclusions,
and large devitrified pumice fragments. The unwelded basal plinian lapilli beds are about 2 m
thick on the south shore of Lake Rotoma and up to 4 m thick at the east at Lake
Rerewhakaaitu. Isolated areas also outcrop on the southeast shore of the Lake Rotomahana,
just within Haroharo Caldera (Nairn 2002).
3.1.2 Matahina Ignimbrite

13
Matahina ignimbrite is interbedded with the Pokopoko Pyroclastics and Onuku Pyroclastics.
These layers have an estimated age of between 0.23 Ma and 0.28 Ma (Nairn 2002).
3.1.3 Pokopoko-Onuku Pyroclastics
Pokopoko Pyroclastics are very coarse near Lake Okataina and Lake Okareka, signifying that
the source is in close proximity, probably the vents within western OVC. Onuku Pyroclastics
are largely pyroclastic flow and fall deposits with weak soil development interspersed
between units, indicating that these deposits were laid down over time. They are made up of
moderately compacted pumice-rich pyroclastic fall and flow units. The fall units are shower-
bedded and are interspersed between pyroclastic flow units. The Onuku pyroclastics probably
emanate from within OVC (Nairn 2002).
Pokopoko-Onuku pyroclastics include moderately compacted to welded pyroclastic flow
components, are crystal-poor and exceed 120 m in depth near lakes Okareka, Tarawera and
Okataina (Nairn 2002). The geology in groundwater drillholes at Mamaku Township, where
drilling penetrated through about 15 m of Pokopoko pyroclastics (Wood 1985), indicates that
pyroclastic flows did not go far west of the town. These deposits were later buried beneath the
Mamaku Ignimbrite (Morgenstern et al. 2004).
Kaingaroa ignimbrite erupted from nearby Reporoa Caldera at 0.23 Ma. The lower unit is
sandy and grades up into a pumice-rich unit, with no visible contact or grading of lithics, and
slight normal grading of pumice abundance. The lower unit is a non-welded to partially
welded, pumice-rich sandy ignimbrite with two distinct pumice types. The upper unit is
exposed around Kawerau, where it underlies Rotoiti Breccia. The upper unit is a non-welded,
pumice-poor ignimbrite with localised, 0.5 m thick, fines-depleted pumice concentration
zones, (Beresford and Cole 2000).
3.1.4 Kaingaroa Ignimbrite
3.1.5
Mamaku ignimbrite is generally considered to have erupted at 0.22 Ma from Rotorua Caldera
(Healy 1964a; Healy 1964b; Briggs 1973; Wood 1992; Wilson et al. 1984; Houghton et al.
1995). It consists of three main subunits; lower, middle and upper (Milner et al. 2003). The
upper and lower subunits are non-welded and predominantly fine-grained. On the north-
Mamaku Ignimbrite
14
western side of the OVC, the upper Mamaku ignimbrite, where it is at least 70 m thick,
consists of a fine-grained ignimbrite containing devitrified pumice. The middle subunit is
strongly welded with cooling joints that are 0.5 to 4 m wide (Milner et al. 2003).
3.1.6
Rotoiti pyroclastics appear to have erupted from fissures within the basement fracture zone at
c.65 ka, as the first voluminous ignimbrite from the northern part of Haroharo Caldera, which
collapsed as a result (Ewart and Healy 1965; Nairn 1981; Nairn 2002).
Rotoiti Pyroclastics
Rotoiti pyroclastics is a composite term for the entire Rotoiti eruptive sequence, including
numerous, widespread, fall deposits (Rotoehu Tephra) underlying, intercalated and overlying
climactic flow deposits (Rotoiti Ignimbrite; Nairn 2002). Rotoiti pyroclastics were erupted
from the northern part of Haroharo Caldera, within OVC. Rotoiti Ignimbrite flow units are
non-welded, are generally fine to coarse grained and crystal-rich, deposited mainly north and
west of Haroharo Caldera and can measure up to 100 m thick. The widely dispersed and fine-
grained Rotoehu Tephra is approximately 5 m thick on the western side of Lake Okataina.
Crustal collapse within Haroharo Caldera likely occurred during and immediately after the
Rotoiti eruption (Nairn 2002).
3.1.7 Huka Group Sediments
Huka Group sediments include reworked volcanic material, diatomaceous silts, interbedded
gravels, and pyroclastic deposits from the frequently-active OVC (Nairn 2002). An 80 m
maximum thickness of Huka Group sediments has been drilled in some geothermal and
groundwater wells in the Lake Rotorua catchment, on the western side of the study area
(Morgenstern et al. 2004).
Lake sediments were deposited after the eruption of Mamaku Ignimbrite. A large area of lake
sediments marks the aerial coverage of the post-Mamaku and post-Rotoiti Ignimbrite higher
stand shorelines in the Rotorua caldera (Marx in prep.).
3.1.8 Recent Okataina Rhyolites
Rhyolitic pyroclastic eruptions which formed calderas were followed by the Mangaone
Pyroclastics sequence of eruptions between 45 ka and 28 ka. Haroharo and Tarawera
volcanic complexes were formed in an intracaldera sequence in 11 separate eruptive episodes

15
post-22 ka. Over the last 22 ka, about 80 km2 of rhyolitic magma and 1 km3 of basalt were
erupted from 40 or more vents within the OVC (Nairn 1992; Nairn 2002). Eruptions occurred
from a number of separate vents along underlying fissures defined by two north-east trending
zones running almost parallel to each other (Nairn, 2002). Table 4 and 5 summarize the lava
flows into eruptive episodes with their associated pyroclastic deposits.
3.1.9 Holocene alluvium
Alluvium laid down after 1886 has been recorded in the Lake Rotomahana and Lake
Tarawera area. Deposits of Rotomahana Pyroclastics and the Tarawera Pyroclastics
represented by remixed ash and scoria, has been found in drainage channels and at the bottom
of the lakes (Nairn 2002).
16
Figure 4 - Geological map of the Okataina Volcanic Centre (Nairn 2002).

17
Table 4 - Stratigraphy and chronology of Haroharo vent zone lavas and pyroclastics (Nairn 2002).
Eruptive Episode and Age
Lavas Pyroclastics
Whakatane 5 ka Mamaku 7.5 ka Rotoma 9ka Rotorua 13.5ka Te Rere 21ka
Makatiti dome Haroharo dome Pararoa dome Makatiti lava flows Rotokohu dome Okataina lava flow Tapahoro dome Tapahoro lava flows Rotoroniu lava flows
Te Horoa dome Hainini dome Hainini lava flow Te Matae lava flow PArewhaiti dome Ruakokopu lava flow ?Otangimoana lava flow ?Oruaroa lava flow Waiti lava flow Kaipara lava flow Te Pohue lava flows Rotoma lava flows Trig 7693 lava B Haumingi lava flow Te Koutu lava flow Tuarae lava flow ?Fenton’s Mill lava flow ?Northern dome (at Okareka) Trig 7693 lava A
Makatiti pyroclastics Pararoa pyroclastics Rotokohu pyroclastics Whakatane Tephra Te Whekau explosion brecchia Te Horoa Pyroclastics
Parewhaiti Pyroclastics Hainini Pyroclastics Mamaku Tephra ?Otamuri Pyroclastics Tuahu Pyroclastics Rotoma Tephra Matutu Pyroclastics Rotorua pyroclastics Rotorua Tephra ?Te whekau explosion breccias ?Tapuaeharuru Pyroclastics ?Te Haehaenga Pyroclastics explosion breccias from Rotokakahi Te Rere tephra
Minor pyroclastic eruptions

18
Table 5 - Stratigraphy and chronology of Tarawera Volcanic Complex lavas and pyroclastics (Nairn 2002).
Eruptive Episodes and Age
Lavas Pyroclastics
Tarawera 1886 AD
Basalt dikes beneath 1886 AD craters Tarawera Pyroclastics
Rotomahana Pyroclastics Rotomahana Tephra
Kaharoa 0.7 ka Ruawahia, Tarawera,
Wahanga domes Green Lake plug Crater dome
Kaharoa Pyroclastics Kaharoa Tephra
Waiohau 11 ka Kanakana dome
Pokohu lava flows Waikakareao lava flows Eastern dome
Waiohau Pyroclastics Waiohau Tephra Local pyroclastic deposits at Rotomahana
Rerewhakaaitu 15 ka Southern dome
?Te Puha lava flow Western dome ?Rotomahana dome
Rerewhakaaitu Pyroclastics (tuff cone) Rerewhakaaitu Tephra
Okareka 18 ka ?Ridge dome
Ridge lava flow Hawea lava flow Patiti Island
Okareka Tephra Scoria fall
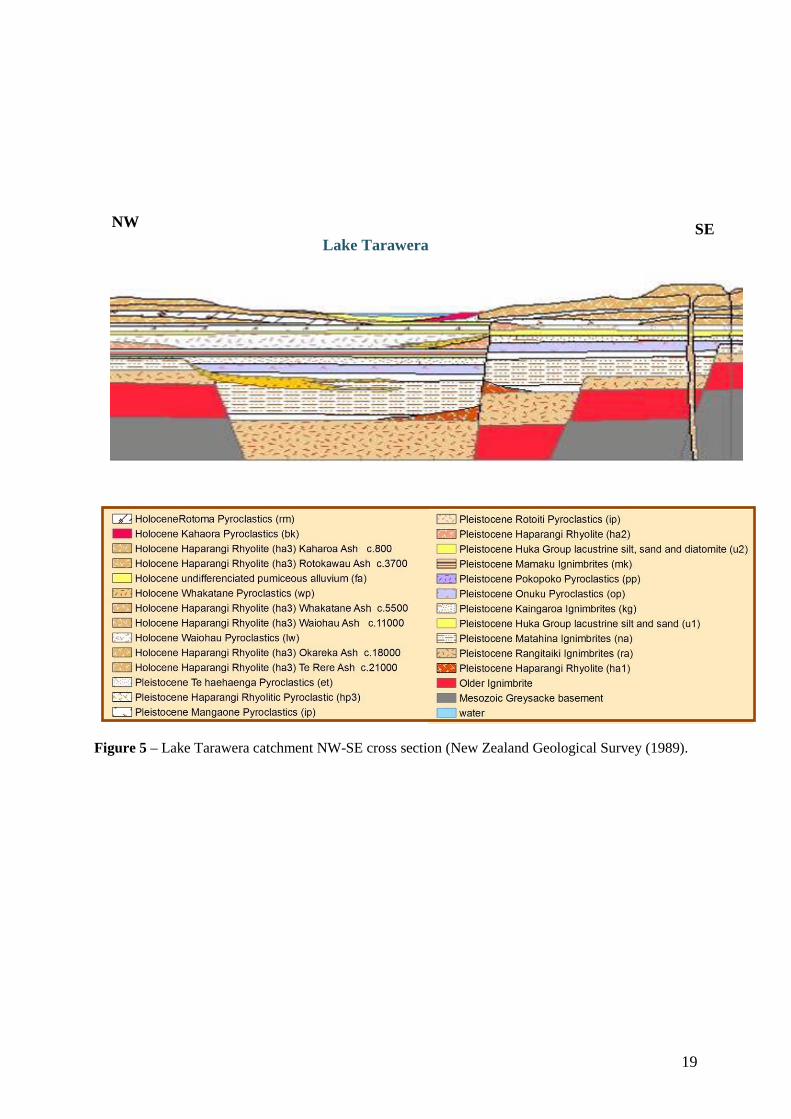
Lake Tarawera’s catchment (Figure 2) is in the heart of the OVC and is underlain by all the
geological units introduced in Section 3.1. A cross section built from the OVC geological map
shows a possible repartition of these layers (Figure 5).
3.2 Tarawera geological model
Pamer (pers. comm.) built a 3D model of the Okataina caldera complex from this cross
section, drill holes, the geological map and digital elevation data (Figure 6 and Figure 7). This
model is used here to simplify the Tarawera catchment into 3 general layers:
− Okataina rhyolites, which include all the different erupted pumices, old and recent;
− Pokopoko-Onuku Ignimbrites;
− Matahina Ignimbrite.
19
Figure 5 – Lake Tarawera catchment NW-SE cross section (New Zealand Geological Survey (1989).
Lake Tarawera NW SE

20
Figure 6 - Three-dimensional model of Okataina Caldera complex (Pamer pers. comm.).
Figure 7 - North-south vertical geological cross section of the Lake Tarawera catchment (Pamer pers. comm.).
21
4. Hydrogeology
Groundwater resources in the catchment of the Okataina Volcanic Centre are poorly
understood mainly because of the low demand for the groundwater and the predominantly
forestry land use. Seven geological formations in the Lake Tarawera catchment have been
identified as possible aquifers based on surface geology in the catchment and from a
hydrogeological investigation in the neighbouring Lake Rotorua catchment. (White et al.
2004):
4.1 Aquifer layers
• Matahina Ignimbrite;
• Onuku – Pokopoko Pyroclastics;
• Old TVZ rhyolite lava;
• Mamaku Ignimbrite;
• Active TVZ rhyolite lava;
• Huka Group sediments;
• Holocene alluvium. Some studies relate horizontal conductivity values for these geological units. Tracey (1986)
showed that the degree of welding controls the hydraulic conductivity in an inverse manner.
Densely welded material is more likely to contain cooling fractures giving rise to high bulk
conductivities. Pumping test data from various ignimbrites indicate a high degree of
uniformity and also fairly consistent values for transmissivity and storativity for ignimbrites.
Highly jointed zones, densely welded zones and inter-ignimbrite contacts are the dominant
and most efficient groundwater paths, whereas the poorly welded zones typically have very
little groundwater flow, despite their high (50-60%) porosities. Hind (1986) thus estimated
that densely welded ignimbrites have hydraulic conductivities of approximately 3×10⁻³ m/s
and poorly welded ignimbrites of approximately 6×10⁻⁶ m/s.
The results of Reeves et al. (2005) coincide with this estimation. He assessed, from pump
tests in the Lake Rotorua catchment, the Mamaku Ignimbrite hydraulic conductivity as 7×10⁻⁴
m/s (60 m/day) and Huka group sediments a hydraulic conductivity as 5.5×10⁻⁵ m/s (4.7
m/day).
22
Another study from Pang (1994) of groundwater in the lower Tarawera catchment reports
estimated hydraulic conductivity of 60-100 m/day for greywacke, between 30-50 m/day for
alluvium and between 10-50 m/day for sands and pumice, on the Rangitaiki Plains, south-east
of the OVC.
Previously, two studies (Groundwater Consultants 1983, Groundwater Consultants 1984) of
the Rangitaiki Plains assessed an average hydraulic conductivity of 70 m/day for the
ignimbrites, 85 m/day for the pumice sands and 35 m/day for the coarse pumice gravels.
Continuity of the layers, seepage between them and the impact of faults on hydraulic
conductivities and flow directions are unknown. Hydraulic conductivities of the water-bearing
geological units in the OVC are assumed (Table 6) from observations in neighbouring
catchments.
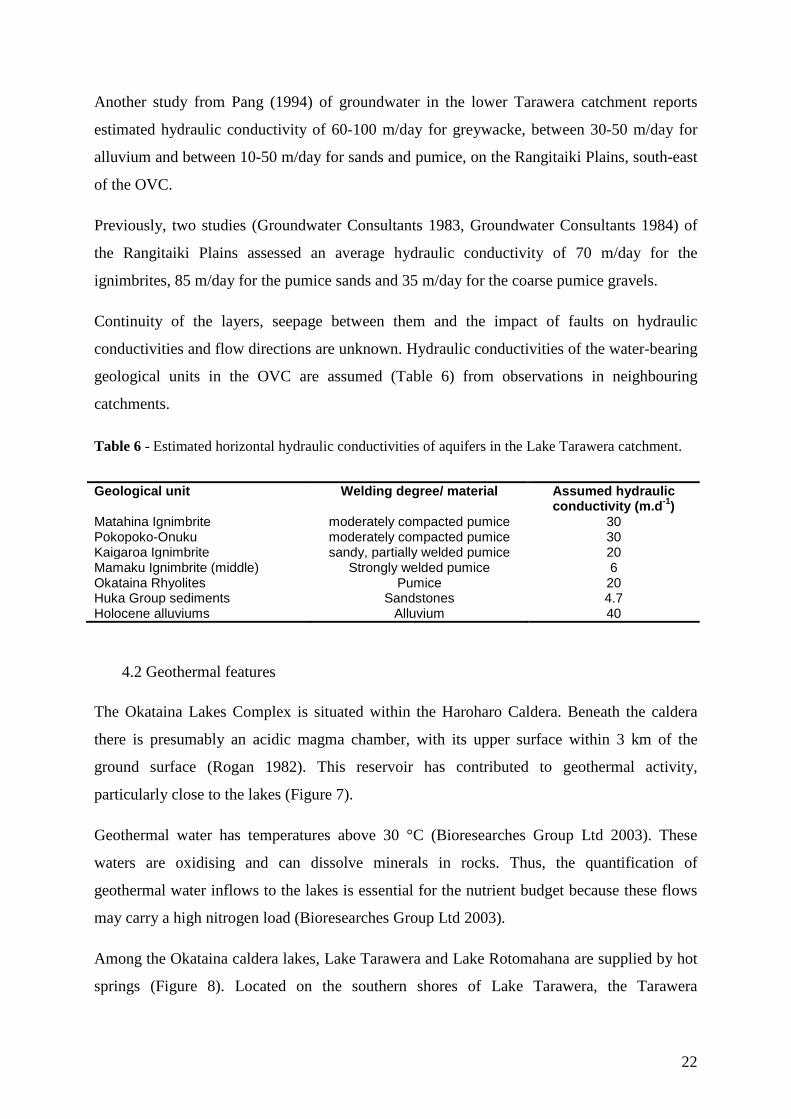
Table 6 - Estimated horizontal hydraulic conductivities of aquifers in the Lake Tarawera catchment.
The Okataina Lakes Complex is situated within the Haroharo Caldera. Beneath the caldera
there is presumably an acidic magma chamber, with its upper surface within 3 km of the
ground surface (Rogan 1982). This reservoir has contributed to geothermal activity,
particularly close to the lakes (Figure 7).
4.2 Geothermal features
Geothermal water has temperatures above 30 °C (Bioresearches Group Ltd 2003). These
waters are oxidising and can dissolve minerals in rocks. Thus, the quantification of
geothermal water inflows to the lakes is essential for the nutrient budget because these flows
may carry a high nitrogen load (Bioresearches Group Ltd 2003).
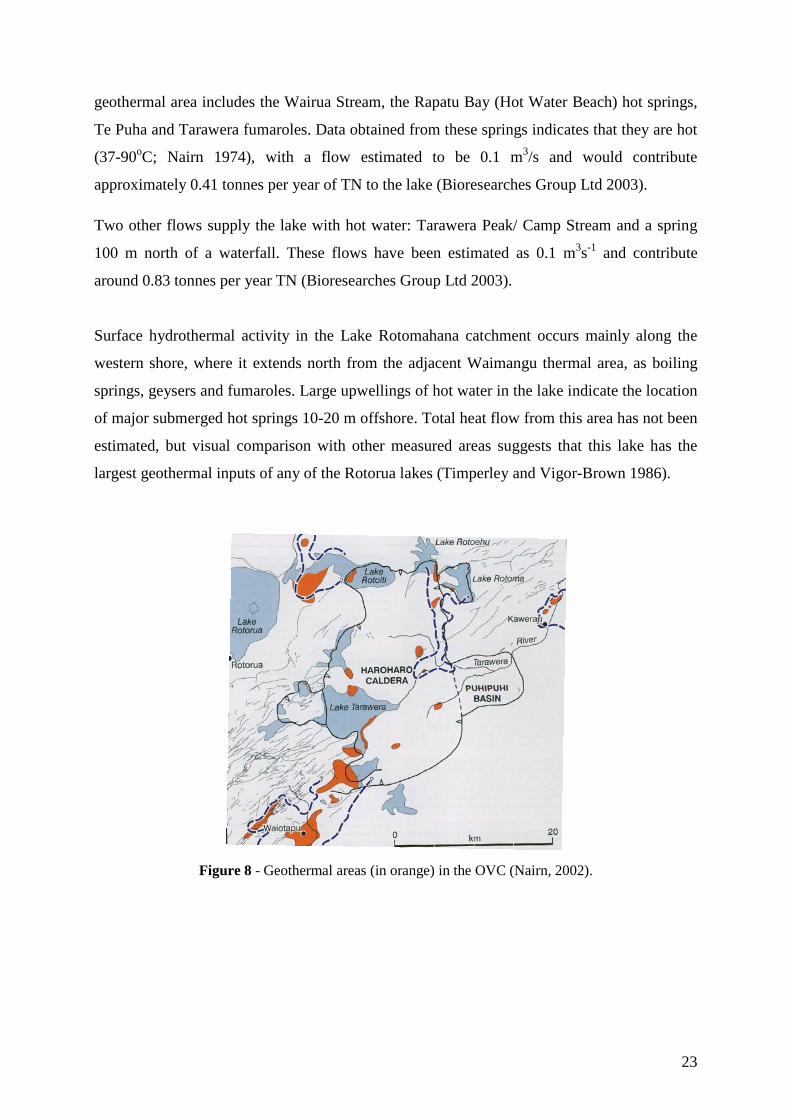
Among the Okataina caldera lakes, Lake Tarawera and Lake Rotomahana are supplied by hot
springs (Figure 8). Located on the southern shores of Lake Tarawera, the Tarawera
Geological unit Welding degree/ material Assumed hydraulic conductivity (m.d-1)
Matahina Ignimbrite moderately compacted pumice 30 Pokopoko-Onuku moderately compacted pumice 30 Kaigaroa Ignimbrite sandy, partially welded pumice 20 Mamaku Ignimbrite (middle) Strongly welded pumice 6 Okataina Rhyolites Pumice 20 Huka Group sediments Sandstones 4.7 Holocene alluviums Alluvium 40
23
geothermal area includes the Wairua Stream, the Rapatu Bay (Hot Water Beach) hot springs,
Te Puha and Tarawera fumaroles. Data obtained from these springs indicates that they are hot
(37-90oC; Nairn 1974), with a flow estimated to be 0.1 m3/s and would contribute
approximately 0.41 tonnes per year of TN to the lake (Bioresearches Group Ltd 2003).
Two other flows supply the lake with hot water: Tarawera Peak/ Camp Stream and a spring
100 m north of a waterfall. These flows have been estimated as 0.1 m3s-1 and contribute
around 0.83 tonnes per year TN (Bioresearches Group Ltd 2003).
Surface hydrothermal activity in the Lake Rotomahana catchment occurs mainly along the
western shore, where it extends north from the adjacent Waimangu thermal area, as boiling
springs, geysers and fumaroles. Large upwellings of hot water in the lake indicate the location
of major submerged hot springs 10-20 m offshore. Total heat flow from this area has not been
estimated, but visual comparison with other measured areas suggests that this lake has the
largest geothermal inputs of any of the Rotorua lakes (Timperley and Vigor-Brown 1986).
Figure 8 - Geothermal areas (in orange) in the OVC (Nairn, 2002).

24
5.
Figure 9 presents the surface inflow monitoring sites in the Lake Tarawera catchment and
Lake Tarawera outflow. Flows are assessed from the Environment Bay of Plenty gauging
flow database for measurements recorded between 1994 and 2003.
Surface Hydrology
Figure 9 - Lake Tarawera surface flow monitoring sites
Three permanent streams are located in the Lake Tarawera catchment. Wairua Stream (site
15380, Figure 9), located on southern shores of Lake Tarawera, is a stream with geothermal
activity and has an estimated flow of 208 L/s. The two other permanent streams are lake
outlets: Te Wairoa from Lake Rotokakahi (site 15385, Figure 9) with an estimated flow of
around 311 L/s and Waitangi Stream from Lake Okareka (site 15388, Figure 9) with an
assessed flow of approximately 102 L/s.
Comparisons between gauging sites from 1987 (White and Cooper 1991), 1995-2003 (EBOP
database) and 2006 (Hamilton et al. 2006) identified 12 springs around Lake Tarawera.
However, the possible transient nature of some springs, their low flow or surrounding dense
vegetation, prevents the identification of all springs.
NSN 1983

25
The total surface water inflow to Lake Tarawera is estimated at 1760 L/s (Table 7). Table 7
summarises all the monitoring sites with their assessed flows. A mean flow for these streams
is given, considering the same years for each stream. The main Twin Creeks stream (site
15383, Figure 9) has the highest inflow to the lake with 384 L/s. Some other streams, assumed
permanent but impossible to gauge due to their low flows, are grouped as “total ungauged
flows” in Table 7.
Table 7 - Assessed flows of the permanent streams and springs of Lake Tarawera.
RIVER/STREAM EBOP site number
FLOW (L s-1)
Tarawera Peak and Camp stream 15377 64.5 Tarawera Peak Stream spring 15331 91 Tarawera Peak Stream rockslide 15332 173.5 Wairua Stream 15380 208 Te Puroku No. 1 (Twin Creeks) 15382 123 Te Puroku No. 2 (Twin Creeks) 15383 384 Te Wairoa Stream 15385 310.6 Jetty Stream (ramp 4) 15386 226 Orchard Stream 15387 15.6 Te Wairoa wharf spring 1015307 26.6 Waitangi Stream 15388 102.3 Waitangui spring 1015336 3.9 Te Whekau Stream 15390 19.5 Spencer Rd Ford Stream NSN 1983 1.5 Total ungauged flows 10 TOTAL INFLOW TO LAKE TARAWERA 1760
TOTAL OUTFLOW (TARAWERA RIVER)
15304 7240
Lake Tarawera has only one outflow, via the Tarawera River (site 15304, Figure 8). This flow
is estimated as 7,240 L/s (Hamilton et al. 2006).
Surface inflow represents only about a quarter (24 %) of the surface outflow. This means that
the groundwater flow coming from the immediate catchment and coming from the seepage
contributes greatly to lake recharge. This shows the importance of characterisation of the
groundwater flux for the Lake Tarawera catchment; as well as for groundwater fluxes in the
whole Okataina Caldera complex.

26
6.
Determination of a water budget model in the study area is an essential step in deriving water
flows. The water budget model suggested here is a schematic solution allowing assessment of
water transfers between the OVC lakes and assessments of water flows between OVC
catchments and catchments outside the study area.
Water Budget
The Okataina Caldera Complex water balance model aims to define the water balance for
each lake catchment and assess the groundwater flows between catchments. The estimated
flows will later be used for the lake water balances, in particular Lake Tarawera and further to
assess nutrient inflows to Lake Tarawera.
The water balance of the Okataina Caldera lake catchments is expressed in terms of an
equation relating the rate of change of storage in each lake to rainfall input, evaporation
output, stream flow input/output and groundwater input/output for each lake catchment
(Spigel and Viner 1992).
6.1 Okataina Caldera water budget
The equation is:
dV/dt =( QGWin - QGWout ) + (ΣQSurf.in - ΣQSurf.out)+ (Pc-Ec)Ac + (Pl- El)As (1)
Where:
dV/dt = rate of change in lake water volume over a period of time,
QGWin = ground water inflow,
QGWout = ground water outflow,
ΣQSurf.in = sum of all surface inflows into the lake catchment,
ΣQSurf.out = sum of all surface outflows from the catchment,
Pc = average rainfall on the catchment surface,
Ec = evaporation on the catchment surface,
Pl = average rainfall on the lake surface,
El = evaporation on the lake surface,
Ac = surface area of the catchment,
As = surface area of the lake.

27
The two most important terms for this project are the groundwater inflows and the
groundwater outflows. The aim here is to define, for all the OVC lake catchments, each term
of the equation to assess the local water balance and to gather all catchment water balances to
obtain estimates of groundwater inflow and outflow for Lake Tarawera. The measurement
periods and time steps are different for the datasets used in the water budget model.
Therefore, the water budget calculations here are approximate.
Records of lake level for Lake Rerewhakaaitu are available from Homestead Arm (Site
Number 1015310), McIntosh et al. (2001). Lake levels are measured daily from 1992 to 2005.
6.1.1 Lake Rerewhakaaitu catchment
The water level at the Homestead Arm site can be used to estimate changes in lake volume
using the relationship between lake level and volume (Figure 10) established by Ellery
(2004).
y = 3.2141x - 1340R2 = 0.9986
45
50
55
60
65
70
75
431 432 433 434 435 436 437 438 439
Lake level (m.a.s.l)
Lake
vol
ume
(m 3 x
10 6
)
Figure 10 - Correlation between lake water level and lake volume for Lake Rerewhakaaitu.
No surface flow enters the Lake Rerewhakaaitu catchment. Stream flow out of the catchment
does not normally occur, however when the lake level is high a drain out of the swampy area
at the south-eastern corner of the lake takes overflowing water into the Mangaharakeke
Stream. This flow is likely to be very close to zero in the long term. Therefore, Qsurf.in and
Qsurf.out are estimated as zero.
28
Rainfall for Lake Rerewhakaaitu catchment was obtained from Climpacts software statistics.
Climpacts was developed by the International Global Change Institute at The University of
Waikatoin collaboration with National Institute of Water and Atmospheric Research (NIWA)
and was originally used for weather prediction. For this study, Climpacts was used to generate
rainfall isohyets for the year 2008 on a GIS layer corresponding to the catchment and the lake,
to obtain a mean value for the whole catchment. Thus, the mean rainfall was estimated to
1,451 mm/year on the lake and 1,460 mm year on the catchment. Combining the lake and
catchment area (approximately 5.3 + 37 km2), the total rainfall inflow on the catchment was
approximately 1,940 L/s.
Lake evaporation was estimated with daily total recorded data measurements from Rotorua
Aero 2 (site number B86131) between January 1 of 1991 and December 31 of 2005. These
data include vapour pressure, surface water temperature and wind for each record.
The lake evaporation was estimated using the following formula:
E=Min(0,(( )*330625152*W*(VP-(e(2.3026*(((7.5T)/(T+237.3))+0.7858)))))*( ))*-1 (2)
with:
E= evaporation (m3/s)
W= wind (m/s)
VP= vapour pressure (mb)
T= surface water Temperature (°C)
A= area (m2)
For the purposes of this report, it is assumed that these data measured at Rotorua Aero 2 are
representative of the Lake Rerewhakaaitu area and the seven other lakes. These values are
added for Lake Rerewhakaaitu with monthly surface water temperature measured by
Environment Bay of Plenty. However, the lack of regular measurements limited the working
period to the years 2003 and 2004. Evaporation for the lake was estimated as approximately
93 L/s over the period. Evaporation for the catchment was estimated as approximately 821
L/s, equivalent to 48% of the total catchment rainfall inflow (White et al. 2003).
Due to its perched nature, it is assumed that no groundwater inflows to the catchment. So,
according to the Equation 1, groundwater outflow from the Lake Rerewhakaaitu catchment
can be estimated from:
29
QGWout = QSurf.in - QSurf.out+ (P-Ec)Ac + (P- El)As - dV/dt (3)
Groundwater outflow from the Lake Rerewhakaaitu catchment is estimated as approximately
1,021 L/s. This groundwater travels to the Lake Rotomahana catchment to the northwest and
the Rangitaiki River catchment to the east.
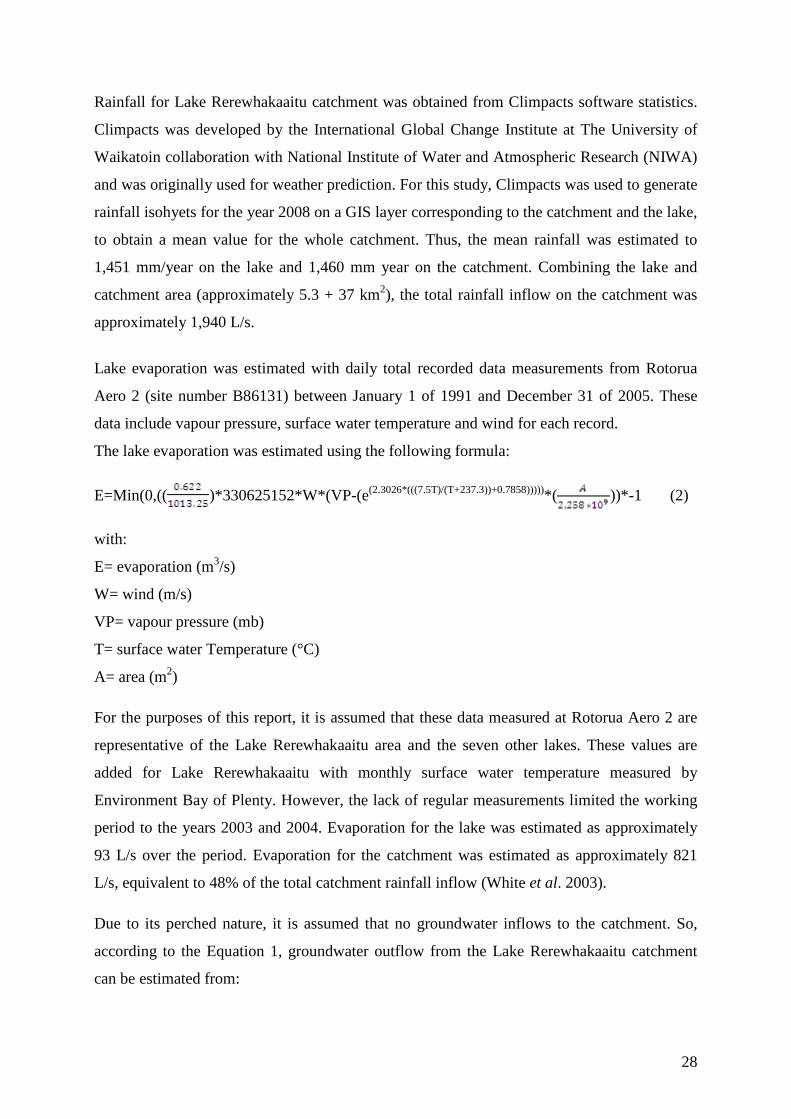
The rate of change for the Lake Okaro is calculated from a correlation of lake level and water
volume estimated for this level. Lake Okaro levels were measured monthly at the Reserve by
EBOP from 1992 to 2006. Water volume correlation (Figure 11) is obtained from Ellery
(2004).
6.1.2 Lake Okaro catchment
y = 0.2996x - 119.93R2 = 0.9981
2
2.5
3
3.5
4
4.5
407 408 409 410 411 412 413 414 415
Lake level (m.a.s.l)
Lake
vol
ume
(m 3 x
10 6
)
Figure 11 - Correlation between lake water level and lake volume for Lake Okaro.
With this correlation, no change is found in the water volume of Lake Okaro from 1992 to
2006.
No surface inflow reaches the Okaro catchment. Haumi Stream flows from Lake Okaro to
Lake Rotomahana. Özkundakci and Hamilton (2008) assessed the Haumi Stream flow as 30 L
s-1.

30
Rainfall on Lake Okaro and the Lake Okaro catchment is assessed with Climpacts. Mean
rainfall was estimated to be 1389 mm year-1 for the lake and 1445 mm year-1 for the
catchment. Combining these values for lake and catchment areas (approximately 0.3+3.9
km2), the rainfall inflow was estimated as approximately 189 L s-1.
Evaporation includes evaporation from the lake and evaporation from the surface catchment.
Evaporation from the lake was calculated with Equation 1. Data used for the surface water
temperature are monthly measurements by EBOP, checked with the Rotorua Airport 2 station
daily database to obtain a homogeneous monthly database. However, gaps in the data restrict
the estimation to years to 2003 and 2004. The mean evaporation value obtained from Lake
Okaro is equivalent to 6 L s-1 for this period. Evaporation from the catchment was estimated
as 48% of the mean rainfall for the catchment area. Evaporation was therefore estimated as
approximately 86 L s-1.
Lake catchment geology mainly consists on alluvium lying on a low permeability geological
layer; so it is assumed that no groundwater inflows into the catchment. Proximity with Lake
Rotomahana catchment and surface connection between Lake Okaro and Lake Rotomahana
allows the possibility of groundwater discharge from Lake Okaro and Lake Rotomahana.
Estimated groundwater flow from Lake Okaro and Lake Rotomahana, using Equation 3, is
approximately 67 L s-1.
The lake volume variation is calculated from 13 years (1992 – 2005) of daily level measures
recorded at Crater Bay (site 15338) by EBOP and the relation between lake level and lake
volume proposed by Ellery (2004), Figure 12.
6.1.3 Lake Rotomahana catchment

31
y = 9.4428x - 2722.6R2 = 0.9898
400
420
440
460
480
500
520
540
332 334 336 338 340 342 344
Lake level (m.a.s.l)
Lake
vol
ume
(m 3 x
10 6
)
Figure 12 - Correlation between lake water level and lake volume for Lake Rotomahana.
The mean rate of lake volume change was estimated as equivalent to an inflow of 18 L s-1
between 1992 and 2005.
Surface flow into Lake Rotomahana is from Lake Okaro, via the Haumi Stream, discharging
into an average flow of 30 L s-1. No surface water outflow leaves the Lake Rotomahana
catchment.
Rainfall for the Lake Rotomahana catchment was assessed using Climpacts software. The
mean rainfall was estimated as approximately 1418 mm year-1 for the lake and 1498 mm year-
1 for the catchment. These values over the lake and catchment areas (approximately 8.8+83.3
km2) yield a rainfall inflow of approximately 4350 L s-1.
Evaporation from the lake was calculated using Equation 2. Data used for the surface water
temperature are monthly measurements from EBOP, checked with the Rotorua Airport 2
station daily database to obtain a homogeneous monthly database. However, gaps in some
years restricted the estimation to the years 2003 and 2004. Mean evaporation from the lake in
2003 and 2004 averages approximately 213 L s-1. Evaporation for the catchment was
approximately 48% (White 2003) of the total catchment rainfall inflow i.e. approximately
1898 L s-1.

32
Groundwater inflows to Lake Rotomahana from the Lake Okaro catchment and the Lake
Rerewhakaaitu catchment are probable. Total inflow is discussed in Section 6.2.
Groundwater probably outflows to Lake Tarawera. A likely geological link occurs between
Lake Rotomahana and Lake Tarawera (Figure 13), Lake Rotomahana has a higher elevation
than Lake Tarawera and the water budget indicates relatively large groundwater losses from
Lake Rotomahana. Groundwater outflow from Lake Rotomahana to Lake Tarawera was
confirmed by the Lake Tarawera water budget (Section 6.3).
Figure 13 - Geological cross section between Lake Rotomahana and Lake Tarawera indicating the geological link between the two lakes (from the Earth Vision geological model of the OVC, Pamer, pers. comm.).
Lake Tarawera Lake Rotomahana
Geological link (rhyolite)
33
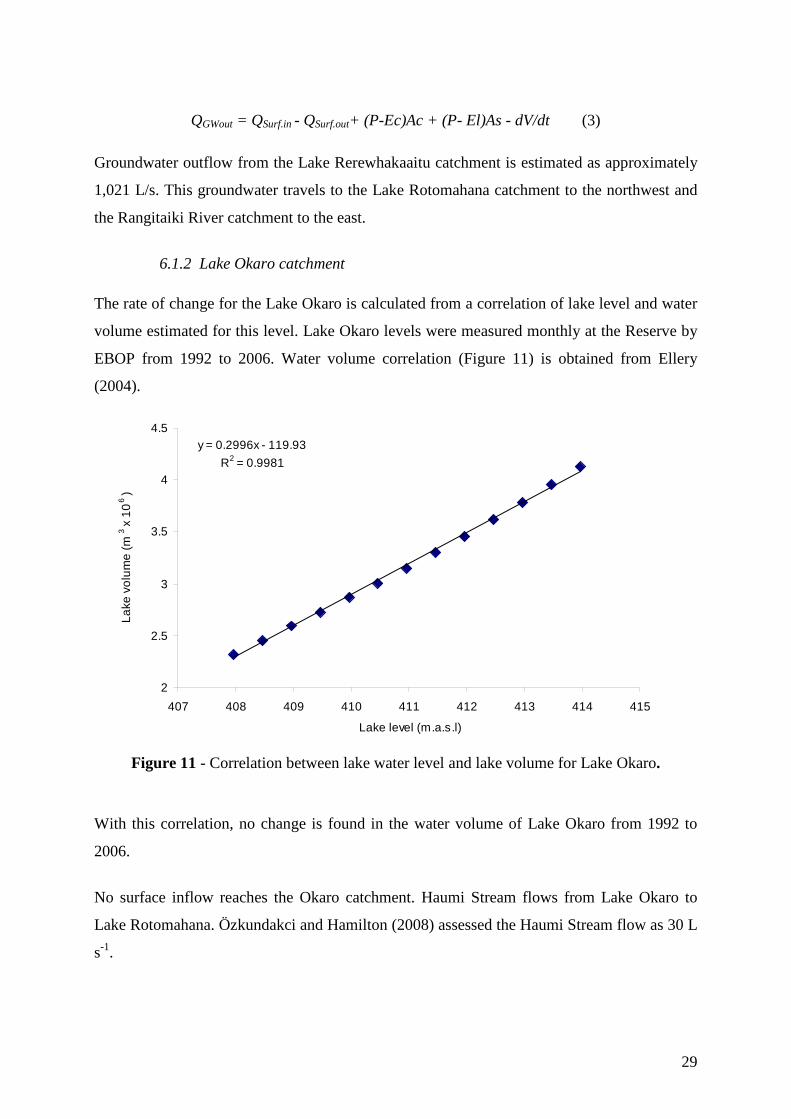
The water level database measured by EBOP at Tarawera Road (site 15347) between 1992
and 2005 was used to estimate changes in volume using the relationship between lake level
and volume (Figure 14) established by Ellery (2004).
6.1.4 Lake Tikitapu catchment
y = 3.3964x - 1140.8R2 = 0.9988
50
55
60
65
70
75
351 352 353 354 355 356 357
Lake level (m.a.s.l)
Lake
vol
ume
(m 3 x
10 6
)
Figure 14 - Correlation between lake water level and lake volume for Lake Tikitapu.
The rate of change of Lake Tikitapu water volume is the equivalent an inflow of 2 L s-1 over
the period 1992 to 2005.
Lake Tikitapu is at the highest elevation amongst the lakes in this part of the study area (417
m above sea level). Thus, no external surface flow comes from surrounding catchments.
Despite the proximity of Lake Okareka and Lake Rotokakahi, no surface flows come out
from the Tikitapu catchment.
Rainfall inflows for the lake and the catchment were estimated using Climpacts software.
Average precipitations of 1568 mm year-1 for the lake and 1678 mm year-1 for the catchment
were found. The total catchment surface area (approximately 1.4+6.2 km2) gave a rainfall
inflow of approximately 400 L s-1.
Evaporation from the lake was calculated using Equation 2. Data used for the surface water
temperature were measured monthly by EBOP and the measurement dates were checked
34
against the Rotorua Airport weather daily database because no weather station exists close to
Lake Tikitapu. A lack of data for several years restricted the calculations to the 2003 and 2004
years.
Average evaporation from the lake in this period was approximately 24 L/s. Evaporation for
the catchment was estimated as approximately 48% (White 2003) of the total catchment
rainfall inflow, i.e. approximately 159 L/s.
No surface flow exists between the catchment and the catchments of adjacent lakes. However,
the water budget indicates a groundwater outflow from the catchment of approximately 215 L
s-1. This groundwater flow may go to the Lake Rotokakahi catchment (the nearest lake) and to
the Lake Rotorua catchment (the lake at the lowest elevation).
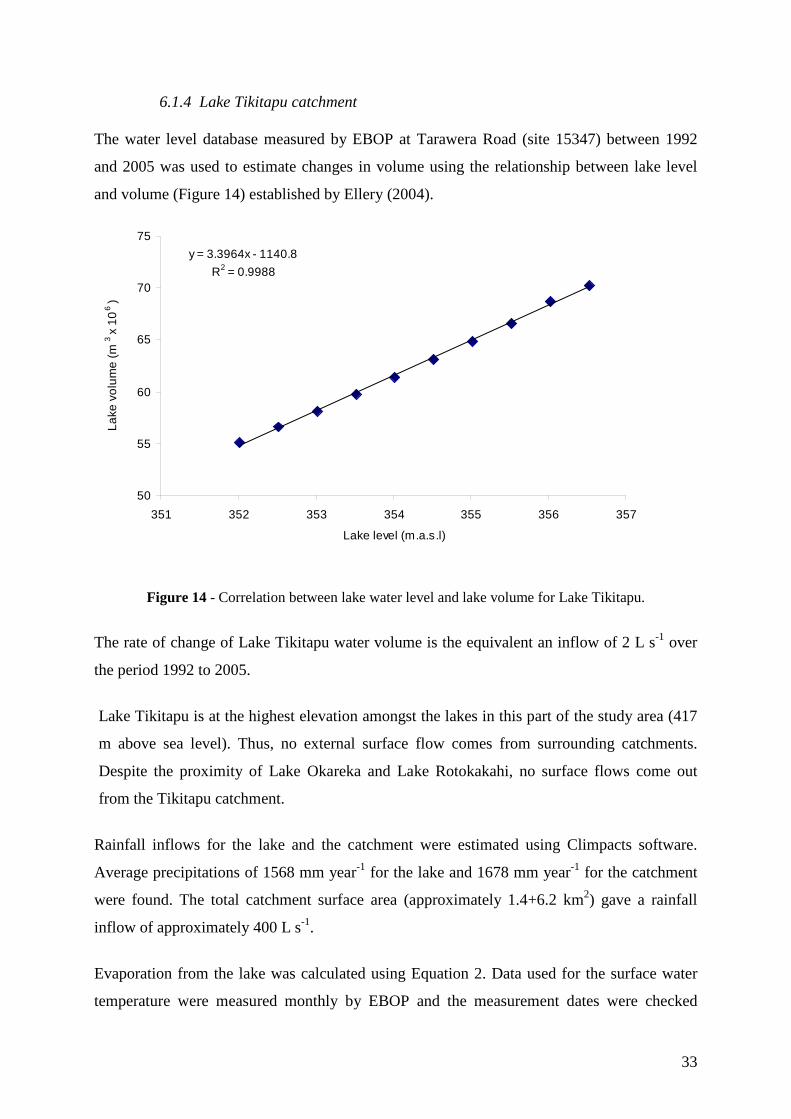
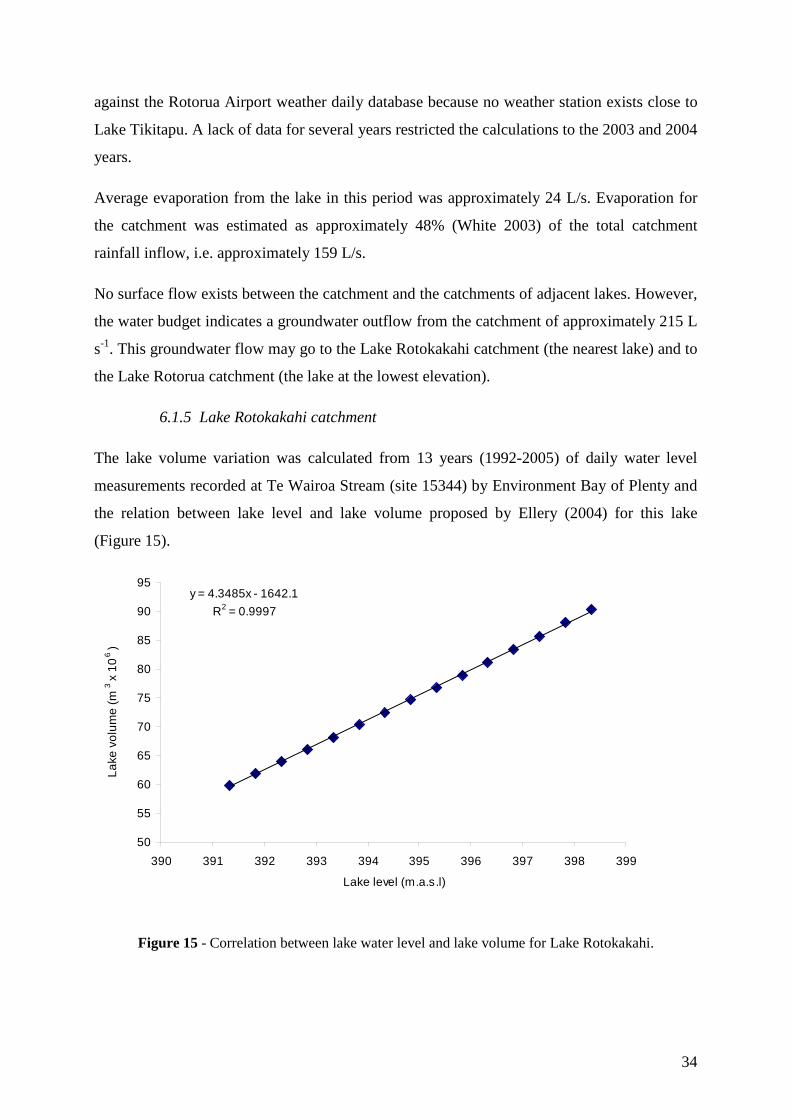
The lake volume variation was calculated from 13 years (1992-2005) of daily water level
measurements recorded at Te Wairoa Stream (site 15344) by Environment Bay of Plenty and
the relation between lake level and lake volume proposed by Ellery (2004) for this lake
(Figure 15).
6.1.5 Lake Rotokakahi catchment
y = 4.3485x - 1642.1R2 = 0.9997
50
55
60
65
70
75
80
85
90
95
390 391 392 393 394 395 396 397 398 399
Lake level (m.a.s.l)
Lake
vol
ume
(m 3 x
10 6
)
Figure 15 - Correlation between lake water level and lake volume for Lake Rotokakahi.
35
It was estimated the rate of water volume change for Lake Rotokakahi was equivalent to zero
inflow over the period 1992-2005.
No surface flow comes in the lake catchment from other catchments. Lake Rotokakahi
catchment is linked to the Lake Tarawera catchment via Te Wairoa Stream, with a flow
assessed from EBOP gauging database (site number 15385) of 310.6 L s-1.
Rainfall for the Lake Rotokakahi catchment was assessed with the Climpacts software. Mean
rainfall was estimated as 1497 mm year-1 for the lake and 1573 mm year-1 for the catchment.
Rainfall inflow was approximately 1176 L s-1 with lake and catchment areas of approximately
4.1 km2 and 19.7 km2, respectively.
Evaporation from the lake was calculated from the Equation 2. Data used for the surface lake
temperature are measured monthly by EBOP. They were integrated with the Rotorua Airport
weather station database to obtain monthly values for the years 2003 - 2004. Mean
evaporation was estimated as approximately 56 L s-1 for Lake Rotokakahi in 2003 and 2004.
Evaporation for the catchment was estimated as approximately 48% (White 2003) of the total
catchment rainfall inflow, i.e. approximately 472 L s-1.
The Lake Rotokakahi catchment possibly receives groundwater flow from the Lake Tikitapu
catchment. Groundwater outflow is assumed to flow into to the Lake Tarawera catchment,
due mainly to the presence of a surface link between these two catchments and possibly into
the Waikato catchment situated at the south-western boundary of the Rotokakahi catchment.
Partitioning of the flows is explained in Section 6.2.
36
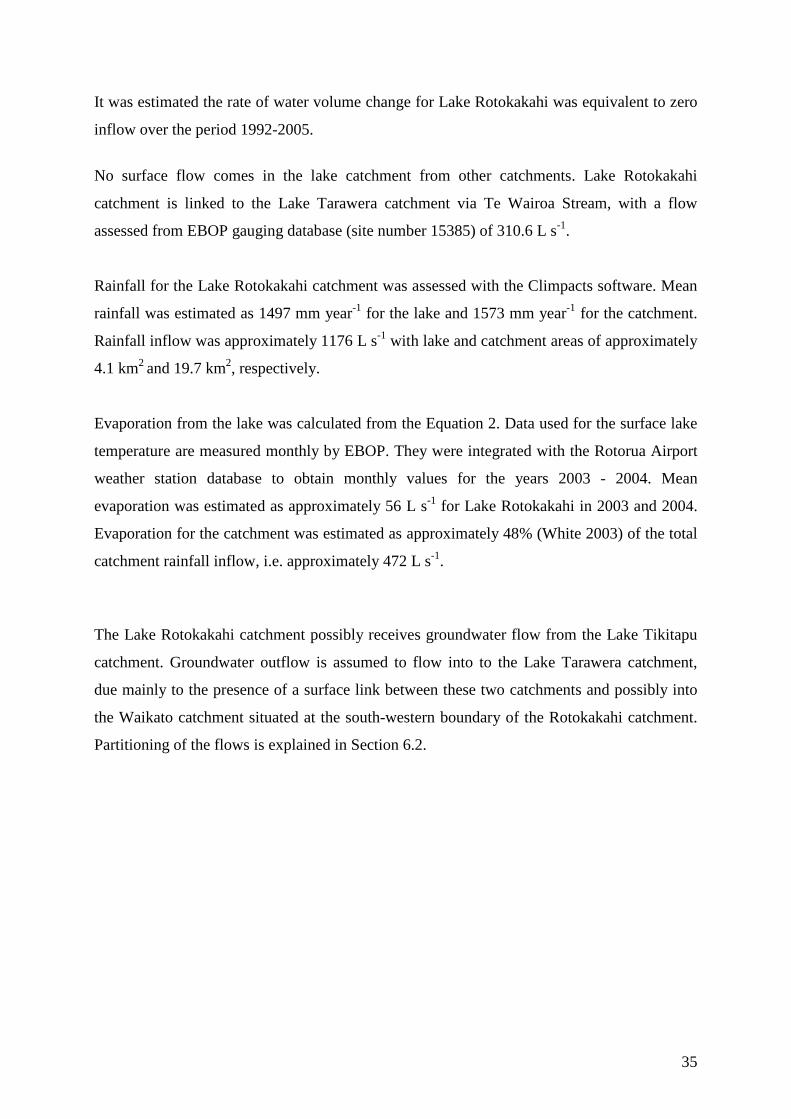
The lake volume variation was calculated in a period between 1992 and 2005 with daily level
measures recorded at Acacia Road (site 15307) by EBOP and the lake level-lake volume
relationship proposed by Ellery (2004) for this lake, Figure 16.
6.1.6 Lake Okareka catchment
y = 3.3964x - 1140.8R2 = 0.9988
50
55
60
65
70
75
351 352 353 354 355 356 357
Lake level (m.a.s.l)
Lake
vol
ume
(m 3 x
10 6
)
Figure 16 - Correlation between lake water level and lake volume for Lake Okareka. The lake volume change for Lake Okareka in the period 1992- 2005 was equivalent to an inflow of 1 L s-1.
No surface inflows in the lake catchment are known. The only known surface outlet from the
catchment is Waitangi Stream from Lake Okareka to nearby Lake Tarawera (Scholes and
Bloxham 2007). Outflow from this stream was gauged monthly by EBOP during July 2003 to
June 2005 and was estimated as 102 L s-1.
Catchment rainfall was estimated using the Climpacts software for the year 2008. Rainfall
was estimated as 1556 mm year-1 for the lake and 1688 mm year-1 for the catchment. This
means an average precipitation for the whole catchment area of approximately 3.3 + 19.6 km2
was estimated as approximately 1209 L s-1.
Evaporation from the lake was calculated using Equation 2. Data used for the surface water
temperatures are monthly measurements from the EBOP Rotorua lakes database in the period
2003 - 2004. The average evaporation from the lake found for these two years was estimated
37
as 59 L s-1. Evaporation for the catchment was estimated as approximately 503 L s-1 assuming
evaporation of approximately 48% of the catchment rainfall inflow (White 2003).
Lake Okareka is the second highest lake of the region, after Lake Tikitapu. So it was
assumed that the catchment doesn’t receive groundwater from adjacent catchments. The
catchment may discharge groundwater to the west to the Lake Rotorua catchment and to the
east to the Lake Tarawera catchment. Equation 3 gives a groundwater outflow from the Lake
Okareka catchment of 646 L s-1.
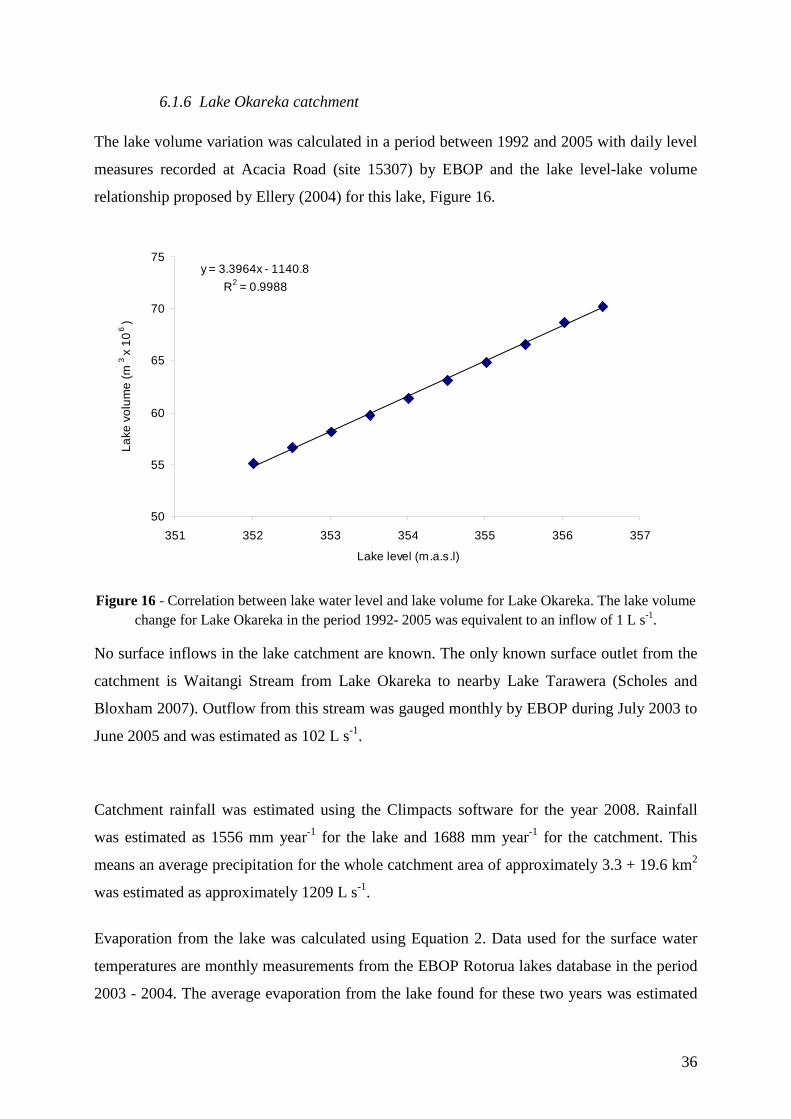
The rate of change of Lake Okataina volume was calculated from a correlation between lake
level and water volume (Figure 17). Lake Okataina levels are measured daily at Tauranganui
Bay (Site 15309) by EBOP from 1992 to 2006. Water volume correlation was obtained from
Ellery (2004).
6.1.7 Lake Okataina catchment
y = 10.54x - 2811.7R2 = 0.9999
400
410
420
430
440
450
460
470
480
490
500
306 307 308 309 310 311 312 313 314
Lake level (m.a.s.l)
Lake
vol
ume
(m 3 x
10 6
)
Figure 17 - Correlation between lake water level and lake volume for Lake Okataina.
The rate of change of the water volume for Lake Okataina was estimated as equivalent to an
inflow of approximately 4 L s-1 for the period 1992 to 2006.
No surface water flows have been observed in the Lake Okataina catchment.

38
Rainfall in the Lake Okataina catchment was assessed with the Climpacts software and GIS
layers of the catchment and the lake. The mean rainfall was estimated as 1764 mm year-1 for
the lake and 1958 mm year-1 for the catchment. The combined lake and catchment areas (lake:
10.8 km2 + catchment: 59.8 km2) yields a rainfall inflow of approximately 4320 L s-1.
Evaporation from the lake was calculated using Equation 2. Data used for the surface lake
temperature were monthly measurements by EBOP in their Rotorua lakes database for 2003
and 2004. Average evaporation from Lake Okataina was estimated as 214 L s-1 for this period.
Evaporation from the lake catchment was estimated as 1931 L s-1 assuming evaporation is
48% (White 2003) of the total catchment rainfall inflow.
The Lake Okataina catchment has a central position within the OVC. So without previous
studies to give a concrete idea on the catchment connections, it was assumed that the Lake
Okataina catchment is possibly linked by groundwater flow to the Lake Rotorua catchment,
the Lake Rotoiti catchment and the Lake Tarawera catchment. Equation 3 allowed assessment
of the groundwater outflow as approximately 2319 L s-1. Estimation of the flow partition is
addressed in Section 6.2.
Records of lake level for Lake Tarawera are available from Te Wairoa (site no. 15301),
measured by EBOP with daily observations over the period 1992 to 2005. These data are used
to estimate changes in volume using the relationship between lake level versus volume
(Figure 18) established by Ellery (2004).
6.1.8 Lake Tarawera catchment

39
y = 40.998x - 9945R2 = 0.9999
2100
2150
2200
2250
2300
2350
2400
294 295 296 297 298 299 300 301
Lake level (m.a.s.l)
Lake
vol
ume
(m 3 x
10 6
)
Figure 18 - Correlation between lake water level and lake volume for Lake Tarawera.
The rate of change of Lake Tarawera volume in the period 1992 to 2005 was estimated as an
average inflow of 7 L s-1.
Two streams flow into the Lake Tarawera catchment, Waitangi Stream and Te Wairoa
Stream, for a total flow of approximately 434 L s-1. The catchment outlet is the Tarawera
River. With a flow estimated to 7240 L s-1 (Hamilton et al. 2006), it represents the only
surface outflow from Okataina Caldera catchments.
Rainfall was assessed with the Climpacts software. Average rainfall on the lake was
estimated as 1556 mm year-1 and average rainfall on the catchment was estimated as 1649
mm year-1. Rainfall on the 143.1 km2 catchment was estimated as approximately 7204 L s-1.
Evaporation from the lake was calculated using Equation 2. Data used for the surface lake
temperature are monthly observations from the EBOP Rotorua lakes database over the period
2003 - 2004. Average evaporation from the lake is estimated as 887 L s-1. Evaporation from
the catchment was estimated as 2545 L s-1 assuming evaporation of 48% (White 2003) of the
total catchment rainfall inflow.
40
The Lake Tarawera catchment may collect groundwater from Lakes Okataina, Okareka,
Rotokakahi and Rotomahana catchments. Proportions of groundwater flow from each
catchment to Lake Tarawera catchment are addressed in Section 6.2. Groundwater outflow from
Lake Tarawera catchment is likely, via the Tarawera River valley.
Darcy’s law and water budgets were used to assess the groundwater transfers between OVC
catchments and from OVC catchments to other catchments.
6.2 Groundwater transfers between catchments
Groundwater flow between catchments (Q) was first estimated from the hydraulic gradient
(Δh) between the lakes, transmissivity (T) of aquifer layers considered and the width of
possible groundwater pathways between lakes. By the combination of these three parameters,
an approximate value of the groundwater flow between two catchments was obtained with
Darcy’s law (estimated flow: Q= T×w×Δh). This procedure was applied to the OVC
catchments, with assumptions on the direction of flow, to obtain estimated flow between
catchments (Table 8). These distributions give an estimated groundwater outflow from
Tarawera lake catchment of 918 L s-1.
In order to consider all the possibilities between catchments, several scenarios varying the
potential flow direction of groundwater between catchments were assessed (Table 9). These
scenarios show that modification of one parameter causes an important change in the
groundwater outflow from the Lake Tarawera catchment. Rainfall is a fundamental element of
the model because an increase of rainfall by 10% multiplies the outflow by two and 10% less
rainfall gives a negative value of groundwater outflow from Lake Tarawera.
Two scenarios (1 and 9) were consistent with the maximum groundwater outflow from Lake
Tarawera of 1 m3 s-1 suggested by White and Cooper (1991). The value of 918 L s-1 (i.e.
scenario 1) was preferred because it is a more realistic for a groundwater flow transfer. This
value implies that OVC lake catchments likely discharge groundwater towards the Lake
Rotorua catchment and towards the Lake Rotoiti catchment.

41
Table 8 - Estimation of the groundwater flow between OVC catchments and from OVC catchments to other catchments.
Inflo
w f
rom
the
othe
r ca
tchm
ents
(L s
-1)
Out
flow
to
the
othe
r cat
chm
ents
(L
s-1
)
Cat
chm
ent l
inke
d
Lake
leve
l gra
dien
t Δ
h (m
/m)
Wid
th
(1) (m
)
Tran
smis
sivi
ty T
(2)
(×10
-3 m
2 .s-1
)
Est
imat
ed o
utflo
w
(L s
-1)
Flow
dis
tribu
tion
(%)
Res
ultin
g flo
w
dist
ribut
ion
(L s
-1)
Okataina 0 2319 Rotorua 33 8505 6.94 159 30 695 Rotoiti 32 6330 6.94 302 55 1275 Tarawera 12 5796 2.31 98 15 350
Okareka 0 544 Rotorua 175 5153 2.31 298 55 300 Tarawera 56 4308 2.31 254 45 245
Tikitapu 0 215 Rotorua 137 2866 2.31 121 60 130 Rotokakahi 23 3101 2.31 87 40 85
Rotokakahi 85 420 Waikato - - - 400 45 210 Tarawera 95 6294 2.31 494 55 210
Okaro 0 67 Rotomahana 100 67 Rerewhakaaitu 0 1021 East - - - - 30 320
Rotomahana 103 12488 2.31 697 70 700 Rotomahana 767 3018 Tarawera 36 12661 2.31 917 100 3018
Tarawera 3823 918 East - - - - 100 918 (1) Value assessed by GIS. (2) Transmissivity of the layers was generalised to the value suggested by White (2003) for the pumice (200 m2.d-1) and the
ignimbrite (600 m2d-1).
Table 9 Groundwater outflow to the east from the Lake Tarawera catchment with scenarios for the OVC water balance.
Scenario Outflow (1) (L s-1)
1 Current model of flow discharges between the different catchments
918
2 No groundwater discharge outside OVC 3848 3 OVC groundwater discharge only to
Northern lakes 1993
4 Scenario 1, but with 10% more rainfall 2153 5 Scenario 1, but with 10% less rainfall -286 6 Scenario 2, but with 10% more rainfall 5570 7 Scenario 2, but with 10% less rainfall 2151 8 Scenario 3, but with 10% more rainfall 3417 9 Scenario 3, but with 10% less rainfall 593
(1) Groundwater outflow to the east through the Lake Tarawera catchment.

42
6.3 Lake Tarawera water budget
A water budget for Okataina Volcanic Complex allows assessment of the flow transfers
between the Lake Tarawera catchment and the catchments of other lakes. The work here
evaluates OVC catchment water flows required to obtain the Lake Tarawera water budget
used for the groundwater flow model. The water budget is given in Equation 1, with flows
from septic tanks included in the water balance.
6.3.1 Water budget components
The lake volume rate of change was estimated as equivalent to an inflow of 7 L s-1 (Section
6.1.8); lake rainfall is estimated by Climpacts to 2023 L s-1 and lake evaporation estimated as
887 L s-1.
In total, stream and spring flow was estimated as 1760 L s-1 (Table 7) assumed inflowing to
Lake Tarawera, with 413 L s-1 coming from outer streams: Waitangi stream and Te Wairua
Stream. The estimated surface outflow was 7240 L s-1 through the Tarawera River.
The Lake Tarawera catchment is situated in a volcanically active area and an active
geothermal area also occurs in the southern part of the catchment. Geothermal spring flow is
estimated (Section 4.2 and Section 5) as 250 L s-1. However, these flows are possibly only a
component of the geothermal inputs. Sheppard (1986) showed, using chloride as a tracer, that
flow from geothermal springs entering Lake Tarawera should total 1270 L s-1. Considering
geothermal spring flow of 250 L s-1, then geothermal groundwater inflows were estimated as
1020 L s-1.
Groundwater inflows can be divided into three categories: groundwater inflows from
catchments outside the Lake Tarawera catchment, groundwater coming from the rainfall
recharge and geothermally influenced groundwater. Groundwater flow to the Lake Tarawera
catchment was estimated for the Okataina Volcanic Complex water budget as 3823 L s-1
(Table 8).
Groundwater coming from rainfall was estimated from the recharge of the catchment.
Considering a rainfall equivalent of 5302 L s-1 and an evaporation rate of 48% for the
catchment, the resulting rainfall inflow was 2757 L s-1. The difference between this flow and
the estimate derived from stream flow gauging (see above) can be attributed to the

43
groundwater flow from the topographic catchment which totals 1409 L s-1. Geothermally-
influenced groundwater flow was estimated previously as 1020 L s-1.
Only one groundwater outflow from Lake Tarawera catchment was considered to the east
catchment, through the Tarawera River catchment. The water balance for the Okataina
Volcanic Centre was therefore used to estimate groundwater outflow as 918 L s-1 (Table 8).
Assuming 2.8 people per household and 104 households around Lake Tarawera4 with a
mean effluent flow value of 250 L/person/day (Hamilton et al. 2006), the septic tank
outflows to Lake Tarawera were estimated to be 0.84 L s-1.
Table 10 summarises the water budget for Lake Tarawera. A comparison was also done with
the water budget of White and Cooper (1991). The first water budget in Section 6.3.1 gives a
water excess of 918 L s-1. This difference accounts for the stream flow value used. Indeed, the
stream flow estimate deals with the streams coming into the lake but also with springs. The
origin of the water in the springs and of several streams comes from groundwater surface
outflow, which means that some water in this water budget was counted twice.
6.3.2 Water budget
Because it was not possible to determine which part comes from the immediate catchment
groundwater and which part comes from the external groundwater inflow, the excess of water
was removed from the external inputs to obtain the adjusted Lake Tarawera water budget.
This proposition was supported by the location of the springs, on the south and west part of
the catchment, where spring flow may be supported by groundwater flow from other
catchments. The proposed Lake Tarawera water budget was consistent with the estimates of
White and Cooper (1991).
4 http://www.mfe.govt.nz/publications/ser/gentle-footprints-may06/gentle-footprintsmay06.pdf

44
Table 10 - Lake Tarawera water budget.
Water budget, section 6.3.1
(L s-1)
Comparison with values suggested by
White and Cooper (1991)(L s-1)
Adjusted Lake Tarawera water budget
(L s-1)
Outputs Tarawera River - surface 7240 6800 7240 -
subsurface 918 0 – 1375 918
Lake Evaporation 887 910 887 Total 9045 7710 – 9085 9045 Inputs Rainfall on lake 2023 2080 2023 Septic tank effluent 1 3 1 Geothermally- influenced groundwater
1020 1272 1020
Immediate catchment - stream flow 1348 1650 1348 - groundwater (non-geothermal) 1409 382 1409 Externally derived - stream flow 413 322 413 - groundwater (non-geothermal) 3824 2004 – 3378 2838 Total 10038 7713 – 9087 9052 Lake volume rate of change +7 +7
The Lake Tarawera water balance shows that surface inflows (stream flows and rainfall on
lake) contribute only 42 % of the lake recharge. Therefore, groundwater is the main inflow to
the lake but the nutrient concentrations carried by these flows are unmeasured. Future
definition of a groundwater model of the Lake Tarawera catchment will help to assess the
nutrient loads by groundwater inflows to the lake.
7.
7.1 Lake Tarawera sub-catchments
Lake Tarawera Groundwater Flow Model
Assessment of water transfers in the Okataina Caldera complex showed that the Lake
Tarawera catchment is connected to the adjacent catchments by underground water flows. In
order to identify, characterise and quantify these groundwater inflows and outflows, it was
necessary to define the supply areas for the lake. The lack of piezometric data and precise
studies on the aquifers and the geological units in the Lake Tarawera catchment mean that
catchment areas are estimated from geology, topography and spring flows.

45
Seven sub-catchments were defined in the Lake Tarawera catchment (Figure 19).
Sub-catchment 1 is on Haparangi rhyolites in the eastern part of the catchment. This sub-
catchment has an area of 20.7 km2; indigenous forest is the sole land use, and the sub-
catchment has no permanent streams (Section 2 and Section 5).
Sub-catchment 2 is in the southern part of the Lake Tarawera catchment mainly on the
rhyolite and alluvium geological layers. The area of this catchment links Lake Rotomahana
with Lake Tarawera. Several springs and geothermal sources are present in this sub-catchment
(Table 7 and Section 4.2). Total discharge to the lake for streams in this sub-catchment is
approximately 329 L s-1. Considering a mean annual rainfall recharge of 1497 mm yr-1, this
means a minimum recharge area of 6.91 km2. This value is larger than estimated for the
catchment area (5.4 km2). Therefore seepage from Lake Rotomahana to Lake Tarawera is
likely.
Sub-catchment 3 uses the boundaries of the old TVZ rhyolites and includes the Mamaku
Ignimbrite. It encompasses the major part of the pasture land use in the Lake Tarawera
catchment, for an area of 43.7 km2. Two major cold spring inflows can be found on this area
(Table 7) for a total flow of 507 L s-1.
Sub-catchment 4 includes the 21 ka-old and 15 ka-old rhyolite layers, with an area of 8.6 km2.
Several springs are present in this area, and have a total surface flow of 404.4
L s-1 (Table 7).
Sub-catchment 5 is the smallest sub-catchment, with an area of 2.8 km2, and includes
Pokopoko ignimbrites and alluviums with relatively high transmissivity. The urban area is
included in this sub-catchment. It is assumed that Mamaku Ignimbrite does not belong to this
catchment. Two known springs discharge to Lake Tarawera from this catchment. The total
flow was assessed to be less than 21 L s-1 (Table 7).
Sub-catchment 6 includes the boundary of the 7.5 ka-old rhyolite layer and has an estimated
area of 3.8 km2. This geological unit must be distinguished to link Lake Okataina and Lake
Tarawera. Unfortunately, no gauged flows are recorded by EBOP for this area.
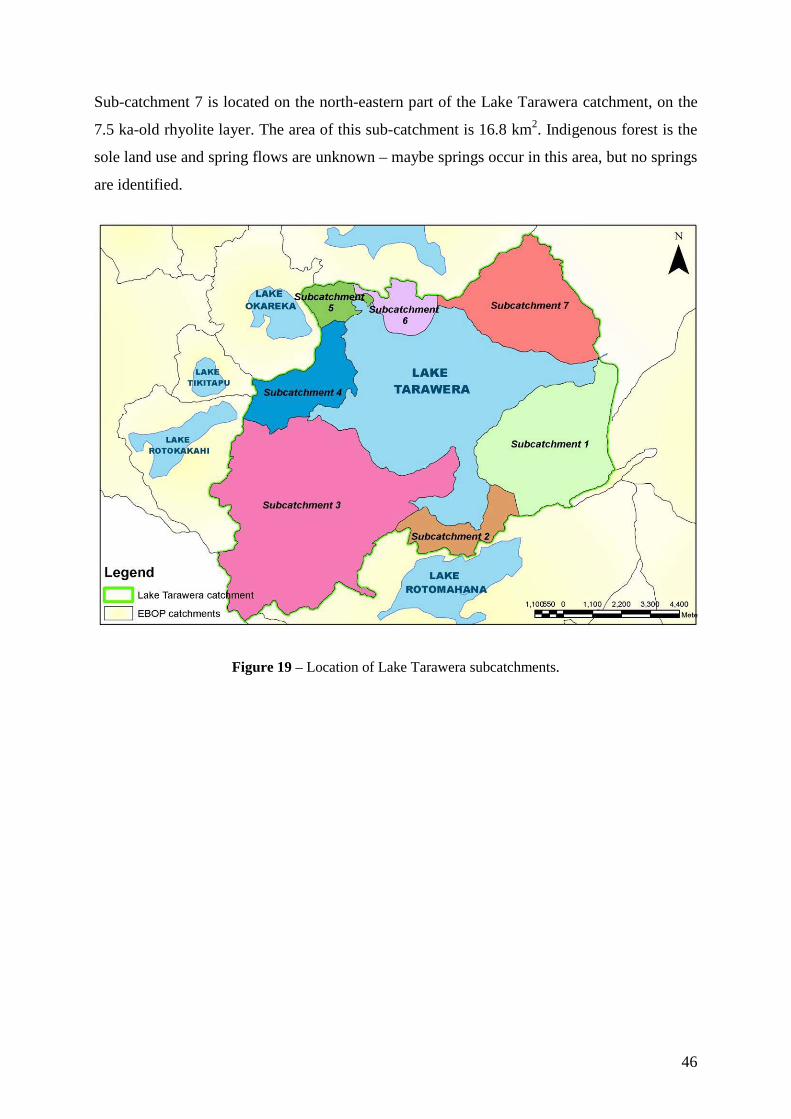
46
Sub-catchment 7 is located on the north-eastern part of the Lake Tarawera catchment, on the
7.5 ka-old rhyolite layer. The area of this sub-catchment is 16.8 km2. Indigenous forest is the
sole land use and spring flows are unknown – maybe springs occur in this area, but no springs
are identified.
Figure 19 – Location of Lake Tarawera subcatchments.

47
7.2 Conceptual model
The groundwater flow model using Finite Element subsurface FLOW system (FEFLOW)
software was developed for the Lake Tarawera surface catchment. One layer was used to
simplify the model running. This layer was made of rhyolite units and is partitioned into two
to improve FEFLOW performance.
7.2.1 Initial properties of the proposed model
• Layer dimensions
The top of the layer was defined from a digital terrain model (DTM) at a 25 m interval. This
DTM was converted by GIS ArcMap into a points shape file and integrated into the model as
topographic elevation. The bottom of the model is the lowest bathymetry value of the lake,
i.e. 213 m above sea level. The layer was partitioned at an elevation of 100 meters below
ground surface.
• Layer properties
Mean horizontal hydraulic conductivity Kxx used for the layer was 2.3×10⁻⁴ m s-1 (20 m day-
1, Section 4). For the two other dimensions, a transverse hydraulic conductivity (Kyy) of
2.3×10⁻⁴ m s-1 i.e. the value used to the Lake Rotorua groundwater flow model (White et al.
2007) and a vertical hydraulic conductivity Kzz (i.e. 2.3×10⁻⁵ m s-1 assuming Kzz = 0.1 Kyy.
This factor limits the vertical seepage and promotes the horizontal flow.
Storativity and storage compressibility are unknown. Therefore it is assumed the same values
applied as used by White et al. (2007) for both of the layers of 0.2 and 0.0001, respectively in
the initial simulations.
Rainfall, proximity to the other lakes, presence of permanent streams, external groundwater
inflows are all elements which need to be defined in the model.
7.2.2 Boundary conditions and inflows
• Rainfall inputs
Rainfall was estimated for each sub-catchment by Climpacts software and corrected by the
evaporation to estimate groundwater recharge in the sub-catchments (Table 11).
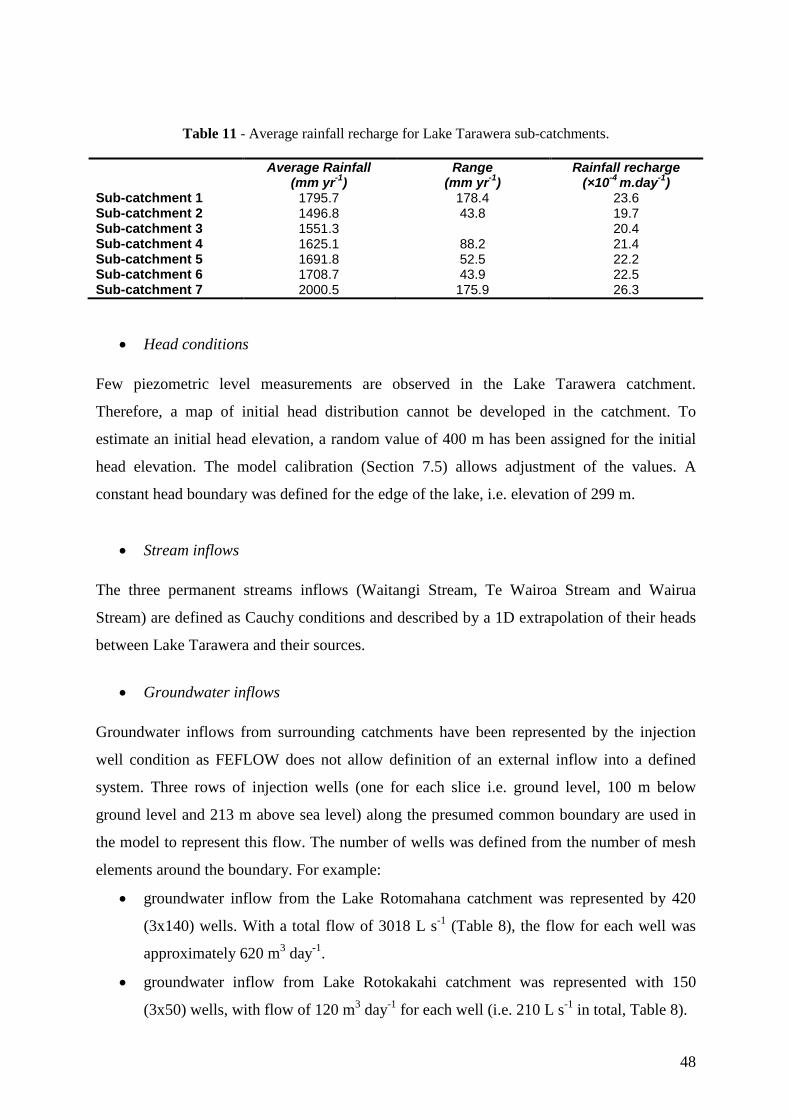
48
Table 11 - Average rainfall recharge for Lake Tarawera sub-catchments.
Average Rainfall (mm yr-1)
Range (mm yr-1)
Rainfall recharge (×10-4 m.day-1)
Sub-catchment 1 1795.7 178.4 23.6 Sub-catchment 2 1496.8 43.8 19.7 Sub-catchment 3 1551.3 20.4 Sub-catchment 4 1625.1 88.2 21.4 Sub-catchment 5 1691.8 52.5 22.2 Sub-catchment 6 1708.7 43.9 22.5 Sub-catchment 7 2000.5 175.9 26.3
• Head conditions
Few piezometric level measurements are observed in the Lake Tarawera catchment.
Therefore, a map of initial head distribution cannot be developed in the catchment. To
estimate an initial head elevation, a random value of 400 m has been assigned for the initial
head elevation. The model calibration (Section 7.5) allows adjustment of the values. A
constant head boundary was defined for the edge of the lake, i.e. elevation of 299 m.
• Stream inflows
The three permanent streams inflows (Waitangi Stream, Te Wairoa Stream and Wairua
Stream) are defined as Cauchy conditions and described by a 1D extrapolation of their heads
between Lake Tarawera and their sources.
• Groundwater inflows
Groundwater inflows from surrounding catchments have been represented by the injection
well condition as FEFLOW does not allow definition of an external inflow into a defined
system. Three rows of injection wells (one for each slice i.e. ground level, 100 m below
ground level and 213 m above sea level) along the presumed common boundary are used in
the model to represent this flow. The number of wells was defined from the number of mesh
elements around the boundary. For example:
• groundwater inflow from the Lake Rotomahana catchment was represented by 420
(3x140) wells. With a total flow of 3018 L s-1 (Table 8), the flow for each well was
approximately 620 m3 day-1.
• groundwater inflow from Lake Rotokakahi catchment was represented with 150
(3x50) wells, with flow of 120 m3 day-1 for each well (i.e. 210 L s-1 in total, Table 8).
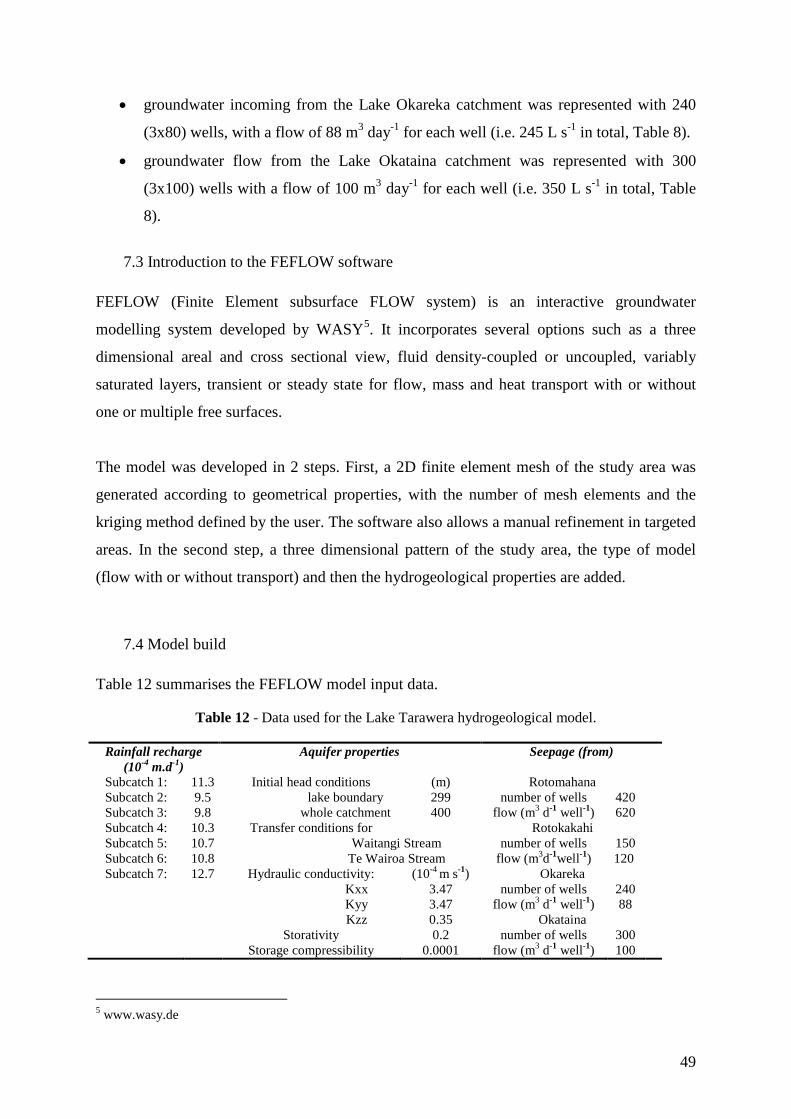
49
• groundwater incoming from the Lake Okareka catchment was represented with 240
(3x80) wells, with a flow of 88 m3 day-1 for each well (i.e. 245 L s-1 in total, Table 8).
• groundwater flow from the Lake Okataina catchment was represented with 300
(3x100) wells with a flow of 100 m3 day-1 for each well (i.e. 350 L s-1 in total, Table
8).
FEFLOW (Finite Element subsurface FLOW system) is an interactive groundwater
modelling system developed by WASY
7.3 Introduction to the FEFLOW software
5
. It incorporates several options such as a three
dimensional areal and cross sectional view, fluid density-coupled or uncoupled, variably
saturated layers, transient or steady state for flow, mass and heat transport with or without
one or multiple free surfaces.
The model was developed in 2 steps. First, a 2D finite element mesh of the study area was
generated according to geometrical properties, with the number of mesh elements and the
kriging method defined by the user. The software also allows a manual refinement in targeted
areas. In the second step, a three dimensional pattern of the study area, the type of model
(flow with or without transport) and then the hydrogeological properties are added.
Table 12 summarises the FEFLOW model input data.
7.4 Model build
Table 12 - Data used for the Lake Tarawera hydrogeological model.
Rainfall recharge (10-4 m.d-1)
Aquifer properties Seepage (from)
Subcatch 1: 11.3 Initial head conditions (m) Rotomahana Subcatch 2: 9.5 lake boundary 299 number of wells 420 Subcatch 3: 9.8 whole catchment 400 flow (m3 d-1 well-1) 620 Subcatch 4: 10.3 Transfer conditions for Rotokakahi Subcatch 5: 10.7 Waitangi Stream number of wells 150 Subcatch 6: 10.8 Te Wairoa Stream flow (m3d-1well-1) 120 Subcatch 7: 12.7 Hydraulic conductivity: (10-4 m s-1) Okareka
Kxx 3.47 number of wells 240 Kyy 3.47 flow (m3 d-1 well-1) 88 Kzz 0.35 Okataina Storativity 0.2 number of wells 300 Storage compressibility 0.0001 flow (m3 d-1 well-1) 100
5 www.wasy.de
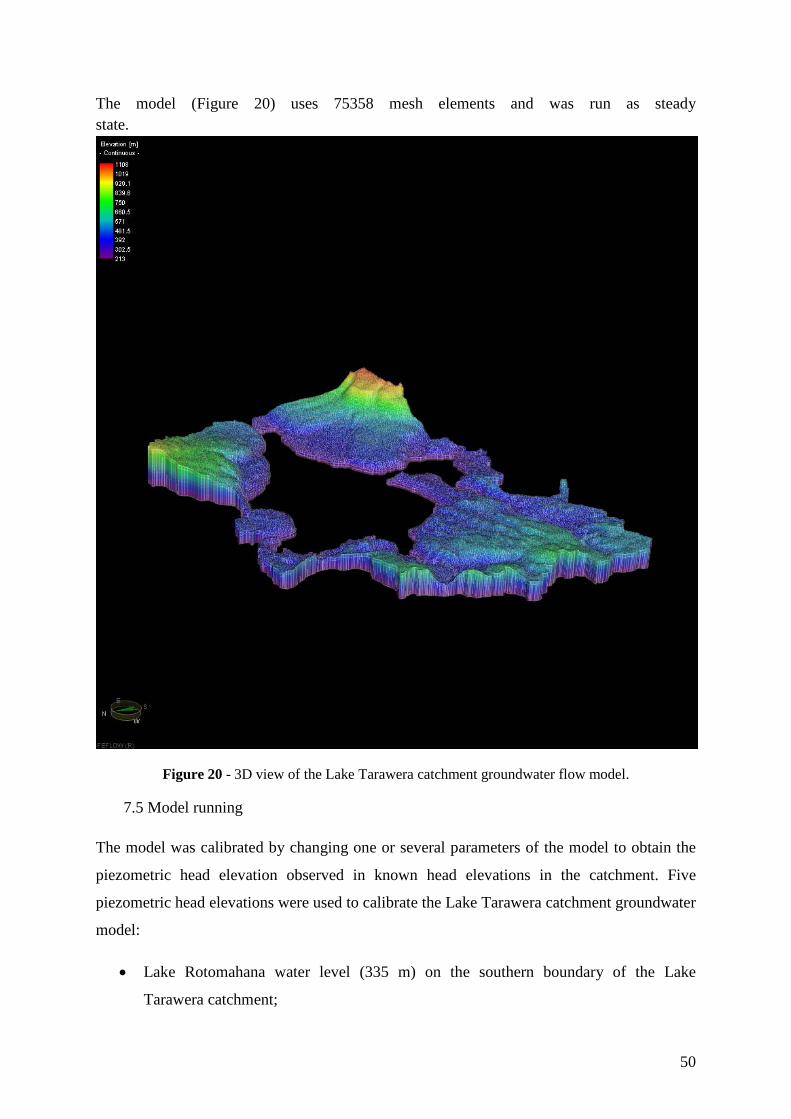
50
The model (Figure 20) uses 75358 mesh elements and was run as steady state.
Figure 20 - 3D view of the Lake Tarawera catchment groundwater flow model.
The model was calibrated by changing one or several parameters of the model to obtain the
piezometric head elevation observed in known head elevations in the catchment. Five
piezometric head elevations were used to calibrate the Lake Tarawera catchment groundwater
model:
7.5 Model running
• Lake Rotomahana water level (335 m) on the southern boundary of the Lake
Tarawera catchment;

51
• EBOP bore hole situated on the south-western part of the Lake Tarawera catchment.
The piezometric level measured in July 2008 is 486 m;
• Lake Rotokakahi water level (494 m) on the western boundary of the Lake Tarawera
catchment;
• Lake Okareka water level (355 m) on the north-western boundary of the Lake
Tarawera catchment;
• Lake Okataina water level (311 m) on the northern boundary of the Lake Tarawera
catchment.
Calibration considered local geology boundaries around the observation points. The southern
part of the catchment represented by the sub-catchment 2 is formed of alluvium and rhyolites.
Calibration of the hydraulic conductivity for the sub-catchment 2 concludes on a value of 2
×10-4 m day-1.
For the western part of the Lake Tarawera catchment, a value of 0.06 ×10⁻⁴ m day-1 obtains a
head elevation of 490 m representing the water level of Lake Rotokakahi. The presence here
of old TVZ rhyolites, that are probably more welded and less fractured, could explain this
low hydraulic conductivity value.
On the north-western part of the Lake Tarawera catchment, presence of alluvium and
possibly Pokopoko Ignimbrite implies a higher hydraulic conductivity than defined for the
rhyolite (Table 6). Hydraulic conductivity after calibration was 0.22 ×10⁻⁴ m day-1.
Calibration of the sub-catchment 6 assuming Lake Okataina is linked through the
groundwater system with Lake Tarawera suggests a hydraulic value of 2.5 ×10⁻⁴ m day-1 to
approximately match the level of Lake Okataina.
For the bore hole on the south-western part of the Lake Tarawera catchment, a value of 0.17
×10-4 m day-1 obtains a head elevation of 490 m.
As no other observation points exist on the catchment, the last value of 0.17 ×10⁻⁴ m day-1
was assumed to be more representative of the hydraulic conductivity of the rhyolite layer for
the Lake Tarawera catchment than the previous value of 0.2 ×10⁻⁴ m day-1 (Table 12). This
value was assigned to rest of the model area.
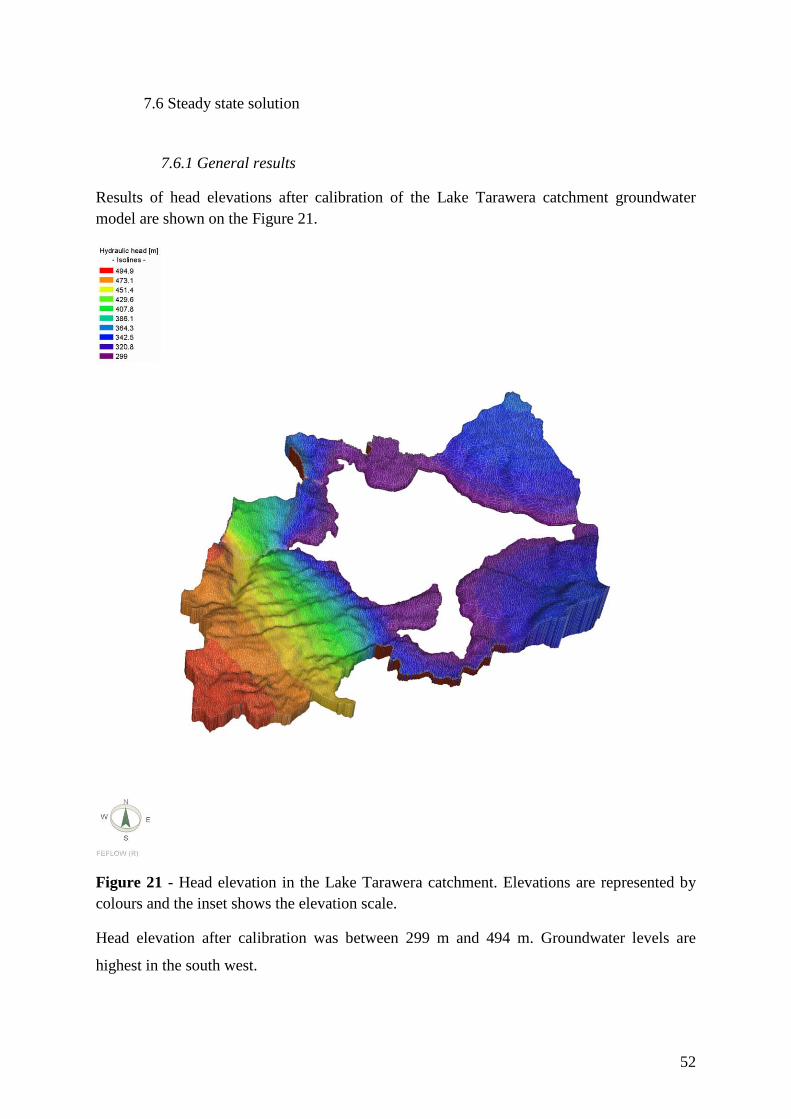
52
7.6 Steady state solution
Results of head elevations after calibration of the Lake Tarawera catchment groundwater model are shown on the Figure 21.
7.6.1 General results
Figure 21 - Head elevation in the Lake Tarawera catchment. Elevations are represented by colours and the inset shows the elevation scale.
Head elevation after calibration was between 299 m and 494 m. Groundwater levels are
highest in the south west.
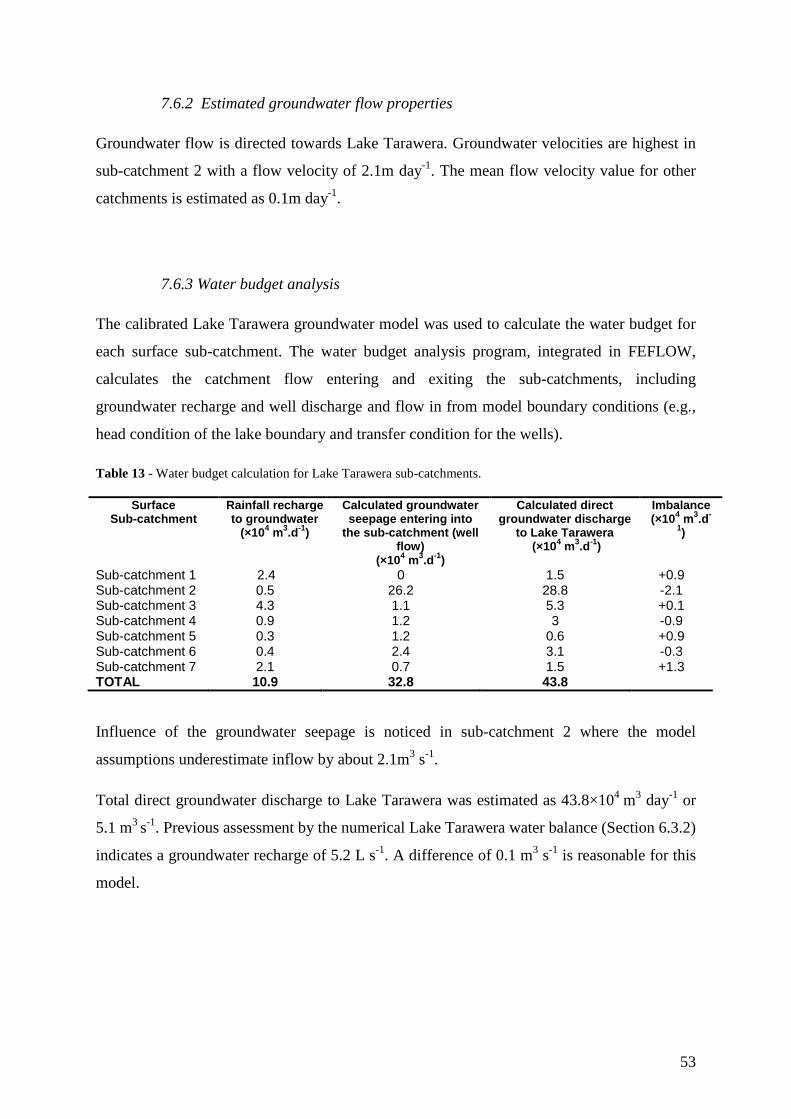
53
Groundwater flow is directed towards Lake Tarawera. Groundwater velocities are highest in
sub-catchment 2 with a flow velocity of 2.1m day-1. The mean flow velocity value for other
catchments is estimated as 0.1m day-1.
7.6.2 Estimated groundwater flow properties
The calibrated Lake Tarawera groundwater model was used to calculate the water budget for
each surface sub-catchment. The water budget analysis program, integrated in FEFLOW,
calculates the catchment flow entering and exiting the sub-catchments, including
groundwater recharge and well discharge and flow in from model boundary conditions (e.g.,
head condition of the lake boundary and transfer condition for the wells).
7.6.3 Water budget analysis
Table 13 - Water budget calculation for Lake Tarawera sub-catchments.
Surface Sub-catchment
Rainfall recharge to groundwater
(×104 m3.d-1)
Calculated groundwater seepage entering into
the sub-catchment (well flow)
(×104 m3.d-1)
Calculated direct groundwater discharge
to Lake Tarawera (×104 m3.d-1)
Imbalance (×104 m3.d-
1)
Sub-catchment 1 2.4 0 1.5 +0.9 Sub-catchment 2 0.5 26.2 28.8 -2.1 Sub-catchment 3 4.3 1.1 5.3 +0.1 Sub-catchment 4 0.9 1.2 3 -0.9 Sub-catchment 5 0.3 1.2 0.6 +0.9 Sub-catchment 6 0.4 2.4 3.1 -0.3 Sub-catchment 7 2.1 0.7 1.5 +1.3 TOTAL 10.9 32.8 43.8
Influence of the groundwater seepage is noticed in sub-catchment 2 where the model
assumptions underestimate inflow by about 2.1m3 s-1.
Total direct groundwater discharge to Lake Tarawera was estimated as 43.8×10⁴ m3 day-1 or
5.1 m3 s-1. Previous assessment by the numerical Lake Tarawera water balance (Section 6.3.2)
indicates a groundwater recharge of 5.2 L s-1. A difference of 0.1 m3 s-1 is reasonable for this
model.

54
8.
One of the objectives of this project was to simulate and evaluate the consequences of land
use changes on the Lake Tarawera nutrient budget. For this, five scenarios were designed to
give a range of nutrient loads. Two other scenarios were added after investigation of the
consequences of current and future land use on nutrient discharge to Lake Tarawera.
Land Use Scenarios
Values used for the nitrogen discharge to the lake from land use are summarized in Table 14.
Nitrogen loss coefficients to the lake were taken from the Rotorua and Rotoiti Lakes Action
Plan (2004). A mean thickness of the rhyolite layer under each land use was also defined for
the model units.
Table 14 - Nitrogen export to Lake Tarawera and land use.
Land Use N Loss to Lake Tarawera
(kg. ha-1.yr-1)
Nitrogen rate set up in the model
(×10-5mg.l-1d-1) Indigenous Forest 4 0.7 Exotic Forest 3 0.8 Deer cattle farming 15 4.1 Beef cattle farming 30 8.2 Sheep and Beef cattle farming 25 6.8 Dairy farming 40 11 Grassland 12 1 Bare ground 5 0.8 Urban * 25 13.7
*the “urban” row groups the exports coming from stormwater, sewage and septic tanks
Transport of nitrogen was simulated by the FEFLOW model. The longitudinal and transverse
dispersivity are those of Hong (pers. comm.) i.e. 70 m and 3 m, respectively. It was assumed
that molecular diffusion and sorption are negligible. It was also assumed that denitrification
doesn’t occur in the aquifer, so a zero-order kinetic reaction was preferred.
The porosity value will influence the travel time of the groundwater in the system. Travel
time for the Lake Tarawera catchment was expected to be in a range of 100 years to 200
years to be consistent with the size and the geology of the catchment. Test simulations were
done using the current land use and 4 different porosity values: 0.01, 0.03, 0.2 and 0.5.
Porosity values 0.01 and 0.5 will give a range for the lowest travel time and the highest travel
time (Figure 22). The porosity values of 0.03 and 0.2 are suggested by Stevenson et al.
(1994) for the rhyolites in the Okataina Volcanic Centre.
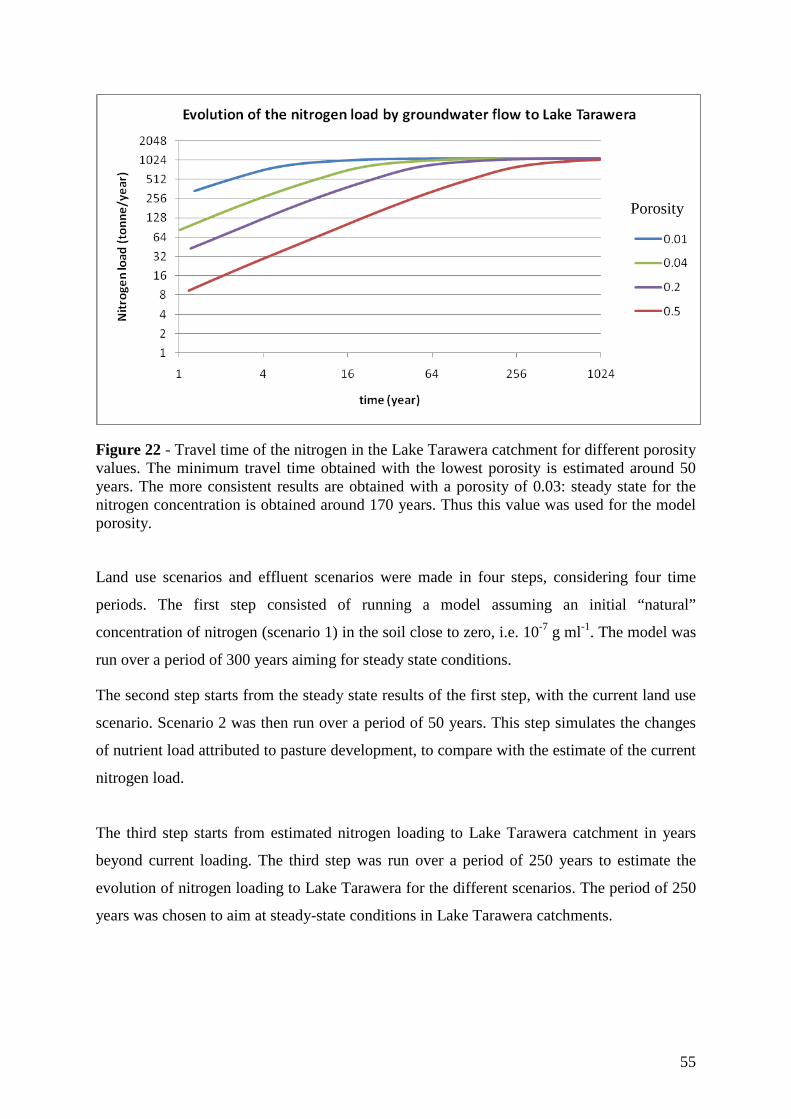
55
Figure 22 - Travel time of the nitrogen in the Lake Tarawera catchment for different porosity values. The minimum travel time obtained with the lowest porosity is estimated around 50 years. The more consistent results are obtained with a porosity of 0.03: steady state for the nitrogen concentration is obtained around 170 years. Thus this value was used for the model porosity.
Land use scenarios and effluent scenarios were made in four steps, considering four time
periods. The first step consisted of running a model assuming an initial “natural”
concentration of nitrogen (scenario 1) in the soil close to zero, i.e. 10-7 g ml-1. The model was
run over a period of 300 years aiming for steady state conditions.
The second step starts from the steady state results of the first step, with the current land use
scenario. Scenario 2 was then run over a period of 50 years. This step simulates the changes
of nutrient load attributed to pasture development, to compare with the estimate of the current
nitrogen load.
The third step starts from estimated nitrogen loading to Lake Tarawera catchment in years
beyond current loading. The third step was run over a period of 250 years to estimate the
evolution of nitrogen loading to Lake Tarawera for the different scenarios. The period of 250
years was chosen to aim at steady-state conditions in Lake Tarawera catchments.
Porosity
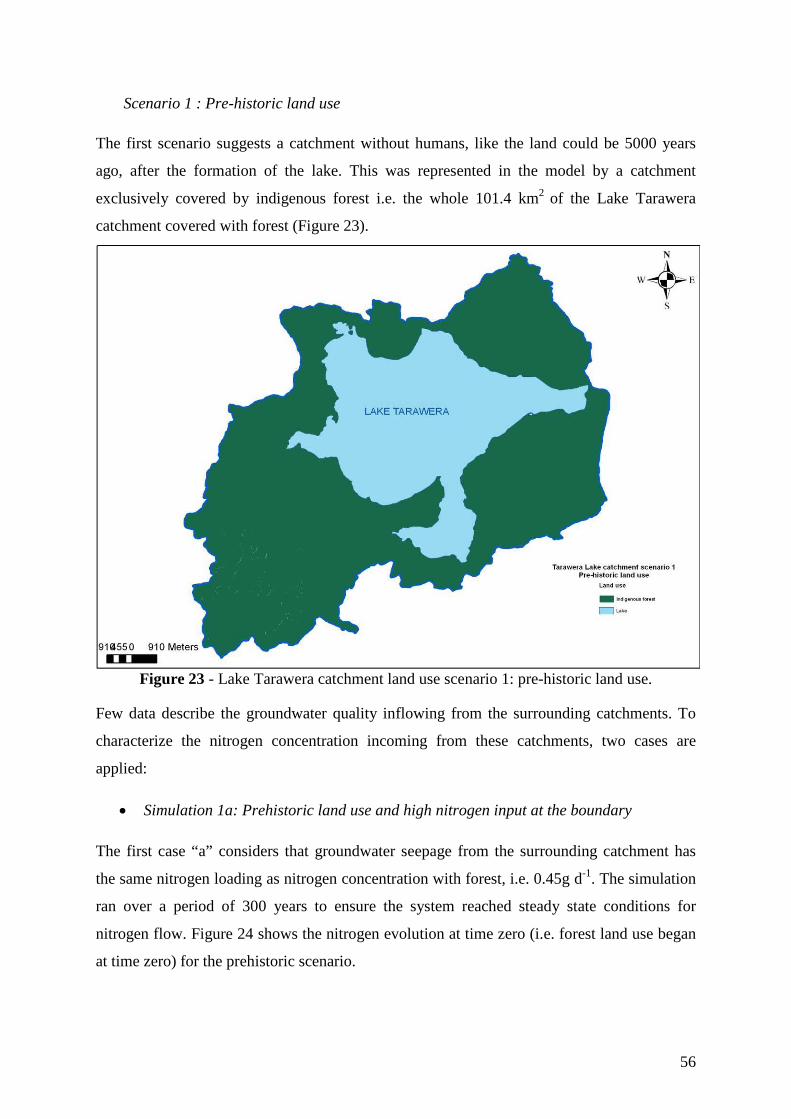
56
Scenario 1 : Pre-historic land use
The first scenario suggests a catchment without humans, like the land could be 5000 years
ago, after the formation of the lake. This was represented in the model by a catchment
exclusively covered by indigenous forest i.e. the whole 101.4 km2 of the Lake Tarawera
catchment covered with forest (Figure 23).
Figure 23 - Lake Tarawera catchment land use scenario 1: pre-historic land use.
Few data describe the groundwater quality inflowing from the surrounding catchments. To
characterize the nitrogen concentration incoming from these catchments, two cases are
applied:
• Simulation 1a: Prehistoric land use and high nitrogen input at the boundary
The first case “a” considers that groundwater seepage from the surrounding catchment has
the same nitrogen loading as nitrogen concentration with forest, i.e. 0.45g d-1. The simulation
ran over a period of 300 years to ensure the system reached steady state conditions for
nitrogen flow. Figure 24 shows the nitrogen evolution at time zero (i.e. forest land use began
at time zero) for the prehistoric scenario.
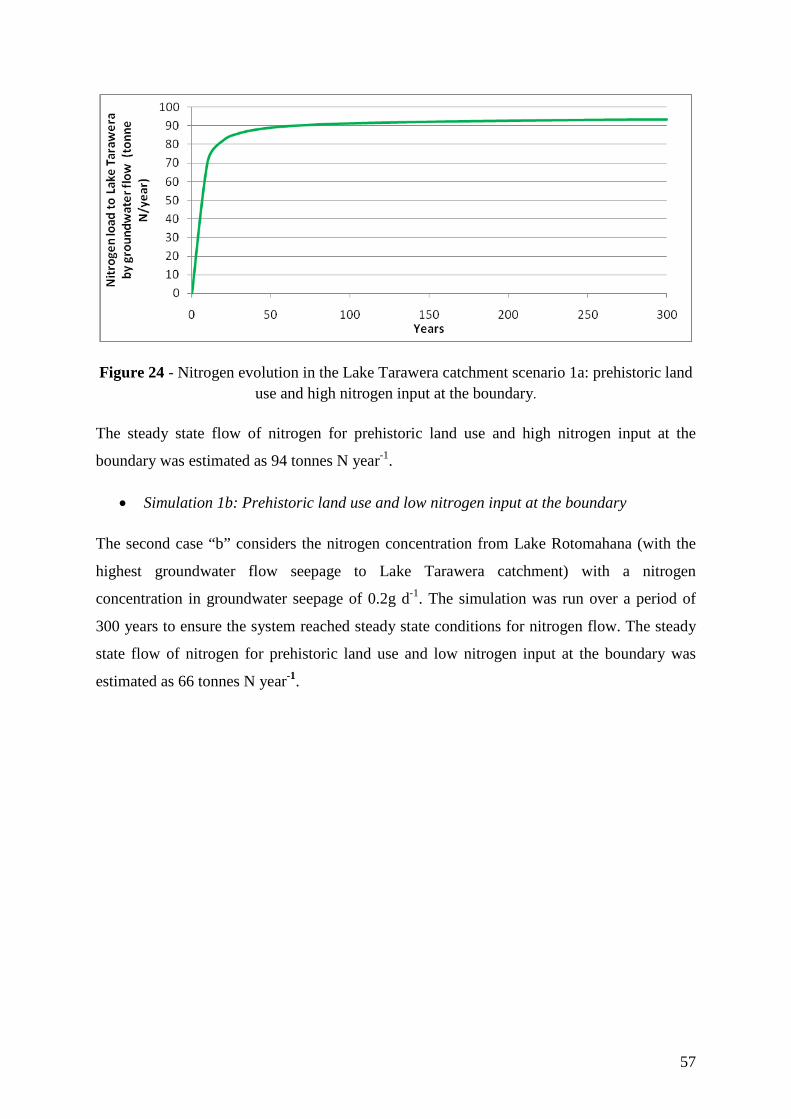
57
Figure 24 - Nitrogen evolution in the Lake Tarawera catchment scenario 1a: prehistoric land use and high nitrogen input at the boundary.
The steady state flow of nitrogen for prehistoric land use and high nitrogen input at the
boundary was estimated as 94 tonnes N year-1.
• Simulation 1b: Prehistoric land use and low nitrogen input at the boundary
The second case “b” considers the nitrogen concentration from Lake Rotomahana (with the
highest groundwater flow seepage to Lake Tarawera catchment) with a nitrogen
concentration in groundwater seepage of 0.2g d-1. The simulation was run over a period of
300 years to ensure the system reached steady state conditions for nitrogen flow. The steady
state flow of nitrogen for prehistoric land use and low nitrogen input at the boundary was
estimated as 66 tonnes N year-1.

58
Scenario 2 : Current land use
This scenario simulates the current Lake Tarawera catchment land use (Figure 25).
Figure 25 – Lake Tarawera catchment land use scenario 2: current land use.
Current land use areas include dairy pasture on the southern part, sheep and beef pasture on
the south and western parts, a deer farm on the north-western and beef pasture on the western
part of the Lake Tarawera catchment.
Steady state conditions from the two previous cases were used as initial conditions for this
scenario. The model was run first over a period of 50 years to simulate development of farm
activity until now then over a period of 300 years so that contaminant flow reaches steady
state conditions. The two cases were simulated successively; calculated nitrogen loads to
Lake Tarawera are shown in Figure 26 and Figure 27.

59
Figure 26 - Nitrogen concentration distribution observed at the surface of the Lake Tarawera catchment after the current land use scenario model was run over a period of 50 years.
Figure 27 - Nitrogen concentration distribution observed at the bottom of the Lake Tarawera catchment after the current land use scenario model was run over a period of 50 years.
After 50 years, most of the nitrogen export flux from pasture reached the edge of Lake
Tarawera for the surface layer. Higher concentrations of nitrogen were measured under the
dairy pasture. The two simulations show the:
− importance of the groundwater seepage;
− importance of pasture land use in controlling the nitrogen discharge to Lake
Tarawera.
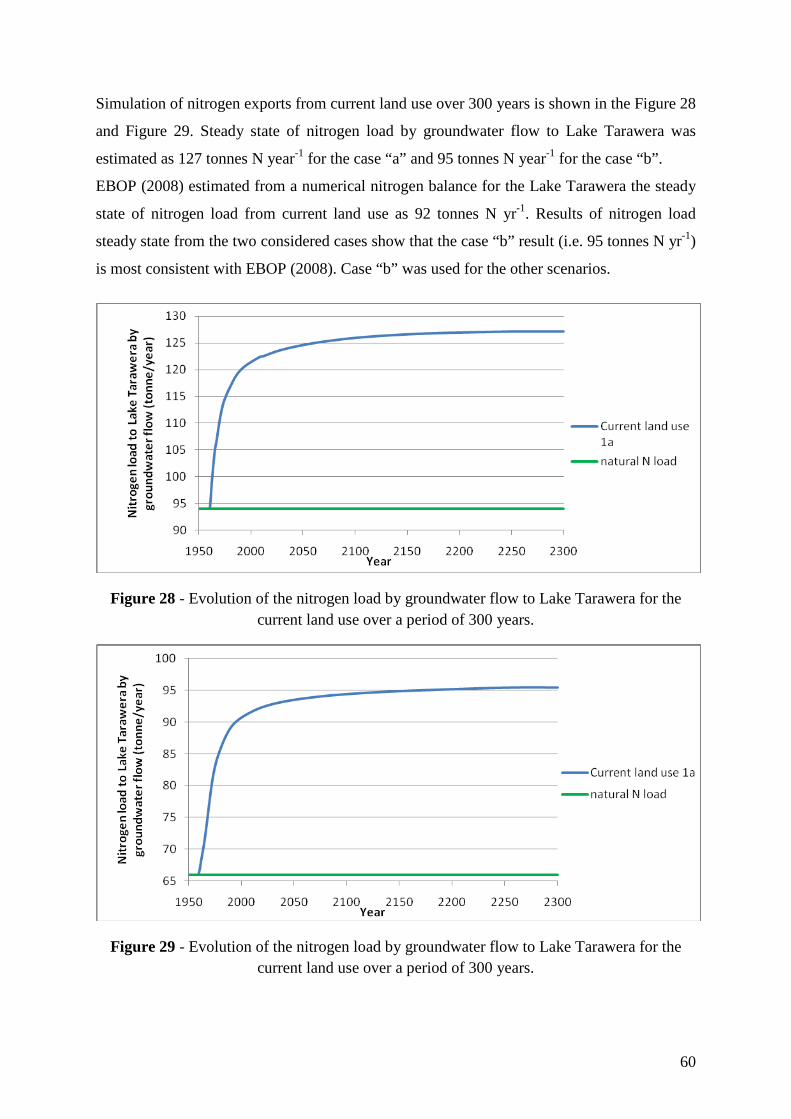
60
Simulation of nitrogen exports from current land use over 300 years is shown in the Figure 28
and Figure 29. Steady state of nitrogen load by groundwater flow to Lake Tarawera was
estimated as 127 tonnes N year-1 for the case “a” and 95 tonnes N year-1 for the case “b”.
EBOP (2008) estimated from a numerical nitrogen balance for the Lake Tarawera the steady
state of nitrogen load from current land use as 92 tonnes N yr-1. Results of nitrogen load
steady state from the two considered cases show that the case “b” result (i.e. 95 tonnes N yr-1)
is most consistent with EBOP (2008). Case “b” was used for the other scenarios.
Figure 28 - Evolution of the nitrogen load by groundwater flow to Lake Tarawera for the current land use over a period of 300 years.
Figure 29 - Evolution of the nitrogen load by groundwater flow to Lake Tarawera for the current land use over a period of 300 years.
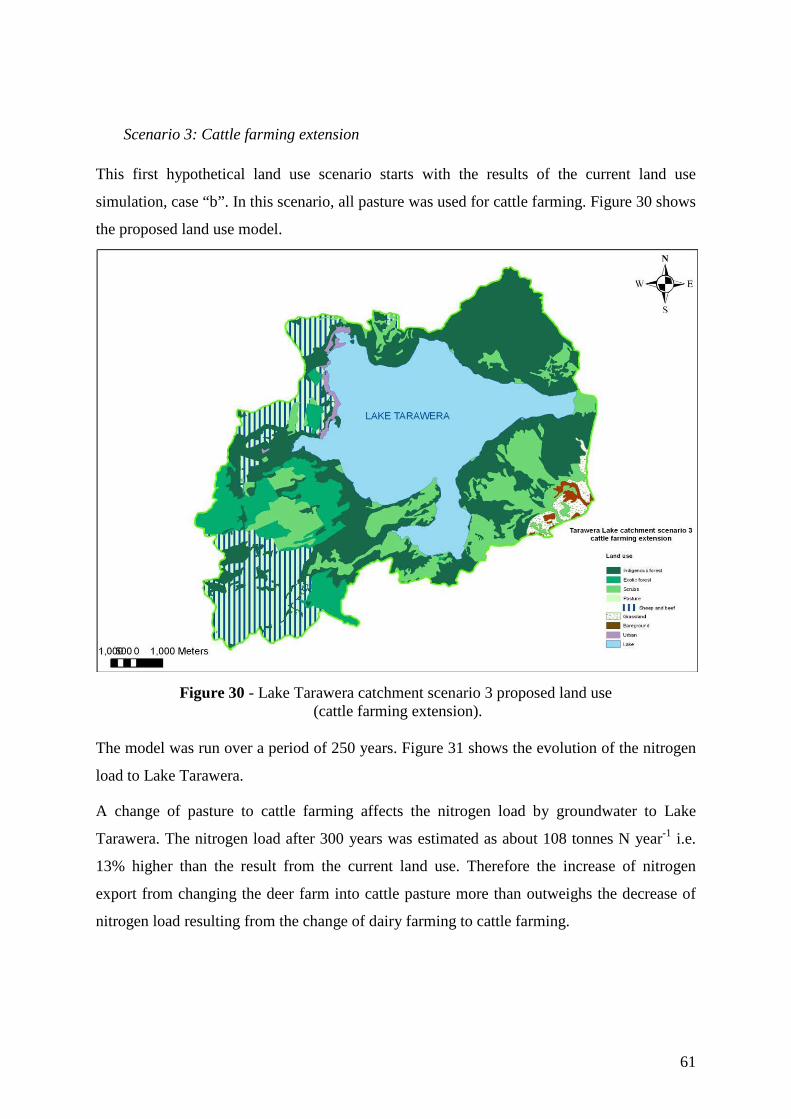
61
Scenario 3: Cattle farming extension
This first hypothetical land use scenario starts with the results of the current land use
simulation, case “b”. In this scenario, all pasture was used for cattle farming. Figure 30 shows
the proposed land use model.
Figure 30 - Lake Tarawera catchment scenario 3 proposed land use
(cattle farming extension).
The model was run over a period of 250 years. Figure 31 shows the evolution of the nitrogen
load to Lake Tarawera.
A change of pasture to cattle farming affects the nitrogen load by groundwater to Lake
Tarawera. The nitrogen load after 300 years was estimated as about 108 tonnes N year-1 i.e.
13% higher than the result from the current land use. Therefore the increase of nitrogen
export from changing the deer farm into cattle pasture more than outweighs the decrease of
nitrogen load resulting from the change of dairy farming to cattle farming.

62
Figure 31 - Evolution and comparison between the nitrogen load by groundwater flow
to Lake Tarawera from the cattle farming extension scenario and from the current land use scenario, over a period of 300 years.
Scenario 4: Dairy extension
The fourth scenario assesses conversion of all pasture to dairy farming. This is the worst
likely case for nitrogen discharge from current pastoral land.
Figure 32 - Lake Tarawera catchment land use scenario 4: dairy extension.

63
Evolution of nitrogen load from this simulation and comparison with current land use is
shown in the Figure 33.
Figure 33 - Nitrogen load in groundwater flow to Lake Tarawera from the dairy farming extension scenario and from the current land use scenario over a period of 250 years.
Pasture change to dairy activity increases the nitrogen load by groundwater flow to Lake
Tarawera. The maximum load of nitrogen by groundwater flow to Lake Tarawera was
estimated as 136 tonne N year-1 with scenario 4.
Pasture change into dairy pasture is the worst case for the Lake Tarawera water quality,
increasing by 43% the nitrogen load by groundwater flow compared to the current land use in
the next 250 years and by 106% the nitrogen load by groundwater flow compared to the
natural load.
Reduction nitrogen use or conversion of the farm activities to low use of nitrogen is possible
and will help to protect Lake Tarawera water quality. However, nitrogen also enters Lake
Tarawera from the urban area and treatment of the urban effluent should decrease the
nitrogen load by groundwater to Lake Tarawera.

64
9. Septic Tanks
Scenario 5 : Tourist development (with pasture retirement)
Scenario 5 assesses how an increase of the population around the lake will impact the nutrient
budget of Lake Tarawera. Scholes (2004) estimated a “natural” increase in the population
around the Rotorua lakes by 9.8% by 2026, excluding potential development of tourist
activity.
The simulation used for scenario 5 considers the urban area will be twice the current area,
and imagines a tourist development will occur around the hot pools at the southern part of the
Lake Tarawera and the population will be ten times the current population. Development of
the urban area implies a development of urban infrastructures. Wallace (Lake Tarawera
working party, 2006) suggests a conversion of the deer farm to a recreational “eco-park”.
This concept is included in the simulation, assuming the deer farm is converted to an eco-
park without animal grazing.
The value used for the nitrogen export from the urban area considers ten times the current
population and was estimated as 13.3 kg N ha-1 year-1. Figure 34 shows the proposed future
Lake Tarawera catchment land use for scenario 5.
The simulation was run from the current land use over a period of 50 years thenrun over a
period of 250 years to reach steady state conditions. Nitrogen load by groundwater flow to
Lake Tarawera wass estimated (Figure 35).
Despite conversion of the deer farm to an eco-park, nitrogen flow generated by the
population increase was higher than the current land use. Nitrogen load by groundwater flow
to Lake Tarawera could reach 103 tonnes N yr-1 in 250 years, which means an increase of 8%
for the nitrogen load to Lake Tarawera.
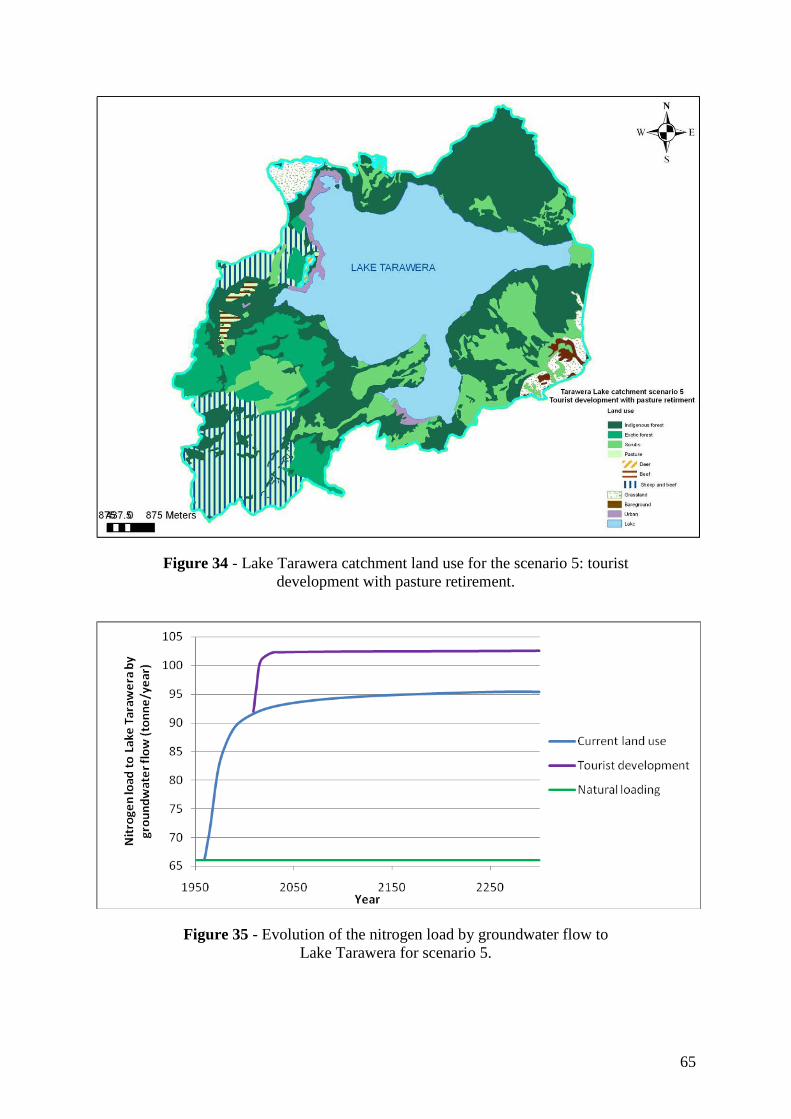
65
Figure 34 - Lake Tarawera catchment land use for the scenario 5: tourist development with pasture retirement.
Figure 35 - Evolution of the nitrogen load by groundwater flow to Lake Tarawera for scenario 5.

66
Scenario 6 : On-site effluent treatment
The On-site Effluent Treatment Regional Plan 2006 (EBOP 2006) imposes, for Lake
Taraweraby 2014, a maximal discharge in total nitrogen (TN) of 15g m-3 in treated
wastewater and a maximum effluent flow of 2 m3 d-1.
Assuming 2.8 people per household and 104 households around Lake Tarawera
(Government census 2006) with a mean effluent flow value of 250 L/person/day (Hamilton
et al. 2006) and the nutrient concentration of 15g m-3, the leaking outflow from the urban area
is estimated as 0.40 tonnes N yr-1. Added to the sewage and the stormwater exports in
nitrogen, the new nitrogen export value used for this scenario was estimated as 1.45 kg/ha/yr.
This simulation started from the current land use scenario results and the value of the urban
area nitrogen export to groundwater was changed. The model was then run over a period of
250 years to reach steady state conditions for nitrogen load to Lake Tarawera. Figure 36
shows the nitrogen load results for this simulation.
Figure 36 - Evolution of the nitrogen load by groundwater flow to Lake Tarawera considering a on-site effluent treatment.
Evolution of the nitrogen load by groundwater flow to Lake Tarawera showed a slight
decrease of the nitrogen load to Lake Tarawera with on-site effluent treatment. Nitrogen
export from urban area was estimated to reduce the nitrogen groundwater leakage into the
lake by 6 % to an estimated value of 89 tonne N year-1.

67
Scenario 7: Wastewater treatment plant
Another way to reduce nitrogen export from groundwater flow to Lake Tarawera is to treat
wastewater from the urban area.
A wastewater treatment plant for effluent from the Tarawera urban area was suggested for
this scenario. The location of the plant, in this scenario, is southwest of the urban area i.e. in
the Lake Tarawera catchment, not too far from the urban area but not in forest.
The wastewater treatment plant was assumed to remove 70% of the nitrogen from the
incoming wastewater and discharge the treated water directly to groundwater.
The model was run from the current land use scenario, from the current date. This scenario
includes stormwater nitrogen export of 0.71 kg N ha-1 year-1. The wastewater treatment plant
was represented as a flow boundary condition with a constant flow of 12 mg L-1. The new
simulation was run over a period of 250 years to reach steady state conditions for
contaminant flow.
Figure 37 shows the results for the nitrogen load by groundwater flow to Lake Tarawera for
scenario 7.
Figure 37 - Evolution of the nitrogen load by groundwater flow to Lake Tarawera
considering a wastewater treatment plant.
Results were similar to these found for the septic tank solution. Treatment of sewage
decreased the nitrogen load in groundwater flow to Lake Tarawera slightly, to an estimate of
89 tonnes N year-1

68
Scenarios 6 and 7 allowed reducing the nitrogen load to Lake Tarawera. However,
wastewater treatment is just a part of the solution to the problem of Lake Tarawera water
quality. The really effective answer to the lake water quality problem remains a reduction of
the nitrogen loads from the pasture. This solution would involve a reduction of the farm area
or a change of their use to low nitrogen uses. The objective of EBOP to improve Lake
Tarawera water quality by reducing the TLI to 2.6 implies a change in agricultural land use in
the Lake Tarawera catchment by reducing agricultural land area or reducing agricultural land
use intensity.
10. Information gaps and recommendations
This report identifies some issues and uncertainties that should be considered for future
studies on groundwater in the Lake Tarawera catchment.
• The Okataina Volcanic Centre water budget was based on possible connections
between the lake catchments. Lake Tarawera catchment is likely connected to four
other lake catchments but no information exists to assess the connection between
some lake catchments. Some studies should be undertaken to verify these links.
• It is necessary to improve the geological and hydrogeological knowledge of the
catchment. For this a drill-hole campaign should be planned around the lake. Figure
38, and Table 15, describe the proposed priority sites. Thus, better data will be
obtained for the layer properties and will allow the future definition of a model based
on real hydrogeological properties.

69
Figure 38 - Proposed drill holes sites for the Lake Tarawera catchment.
Table 15 - Objectives for proposed drill sites.
Proposed site
number Site Description Bore hole use Objective
1
Lake Tarawera - Lake Rotomahana link. Geothermal
area
Pump test Piezometric level Water quality Temperature
• Assess the pumice and alluvium hydraulic conductivity.
• Check and monitor the nitrogen concentration from the pastoral land use.
• Look at a possible connection with geothermal activity
2 Lake Tarawera - Lake Rotokakahi link
Pump test Piezometric level Water quality
• Assess the pumice and alluvium hydraulic conductivity
• Monitor the nitrogen concentration in groundwater inflowing to Lake Tarawera
3 Lake Tarawera – Lake Okareka link
Pump test Piezometric level Water quality
• Assess the Pokopoko and Onuku ignimbrites hydraulic conductivities.
• Check and monitor the nitrogen concentration from the pastoral land use
70
• The current Lake Tarawera catchment groundwater model was defined by only one
layer. Model calibration revealed that heterogeneity of geology in the Lake Tarawera
catchment modifies the hydraulic conductivity. The Lake Tarawera catchment
groundwater model should integrate at least two layers.
• In the current groundwater model, interactions between groundwater and rivers
haven’t been considered. The future model should take into consideration these
interactions.
11. Summary
Formed 5000 years ago, Lake Tarawera is in the centre of the Okataina caldera complex. A
water budget for lakes and catchments in the Okataina caldera indicates that Lake Tarawera
receives a groundwater inflow of 3.8 m3 s-1 from the surrounding catchments including those
of Lake Rotomahana, Lake Rotokakahi, Lake Okareka and Lake Okataina. Groundwater
outflow from the Lake Tarawera catchment was estimated as 0.9 m3 s-1 to the Tarawera River
valley. A water budget for the Lake Tarawera, and its catchment, indicates that 58 % of the
inflowing water comes from underground flow.
Lake Tarawera catchment land use is dominated by forests but for the last 30 years,
conversion of forest to pasture has occurred, causing an increase in nitrogen inputs to the
lake. To assess nitrogen inflow to the lake, a hydrogeologic model was created with the
FEFLOW software. The Lake Tarawera catchment groundwater model considers one layer
generally representing rhyolite.
The FEFLOW model was used to assess possible future nitrogen loads to Lake Tarawera for
current land use and five scenarios of future land use within the Lake Tarawera catchment.
Table 16 summarises the maximum expected nitrogen load with groundwater flow to Lake
Tarawera for current land use and five scenarios of future land use.

71
Table 16 - Maximum expected nitrogen load by groundwater flow into Lake Tarawera for scenarios of land use within the Lake Tarawera catchment.
Sub-catchment
Pre-
hist
oric
land
us
e
Cur
rent
La
nd u
se
Cat
tle fa
rmin
g ex
tens
ion
on
exis
ting
past
ure
Dai
ry e
xten
sion
on
exis
ting
past
ure
Tour
ist
deve
lopm
ent
On-
site
effl
uent
tr
eatm
ent
Was
tew
ater
tr
eatm
ent p
lant
Maximum expected nitrogen load by groundwater flow to
Lake Tarawera (tonne N yr-1)
66 95 108 136 103 89 89
Future maximum nitrogen load by groundwater flow to Lake Tarawera from current land use
in the Lake Tarawera catchment was estimated as 95 tonnes N yr-1. Land use outside the Lake
Tarawera catchment may impact on water quality in Lake Tarawera because groundwater
travels into the lake from other catchments.
The worst case scenario assessed in this project for Lake Tarawera water quality was a
conversion of all existing pasture in the Lake Tarawera catchments into dairy land use. In this
case future nitrogen load to Lake Tarawera may increase to 136 tonnes N yr-1.
A wastewater treatment plant would allow some reduction of the nitrogen load to Lake
Tarawera. However, the best way to improve lake water quality, i.e. reduce the Lake
Tarawera TLI to Environment Bay of Plenty’s target of 2.6, is to address pastoral land use
because most of the nitrogen that currently enters the lake comes from pastoral land. Options
for pastoral use may include reducing the area of farm land or reducing nitrogen discharge
from the existing farm area.

72
12. References
Bay of Plenty Catchment Commission. 1985: Tarawera River Management Plan. Vol. 2,
Background Report, prepared by Bay of Plenty Catchment Commission and Beca
Carter Hollings & Fermer Ltd.
Beresford, S.W. and Cole, J.W. 2000: Kawerau Ignimbrite: a 0.24 Ma Ignimbrite erupted
from the Okataina caldera complex, Taupo Volcanic Zone, New Zealand. New
Zealand Journal of Geology and Geophysics 43: 109-115.
Bioresearches Group Limited. 2003: Estimate of the geothermal nutrients inputs to twelve
Rotorua lakes. EBOP report. 32p. + app.
Briggs, N.D. 1973: Investigations of New Zealand pyroclastic flow deposits. Unpublished
PhD thesis, Victoria University of Wellington.
Ellery, G. 2004: Lake level and volume summary of the Rotorua lakes. EBOP internal report.
82 p.
Environment Bay of Plenty (EBOP), 1997: Rotorua lakes summary report. Environmental
report 97/21.
Ewart, A. and Healy, J. 1965: Rotorua – volcanic geology. Pp. 10-26 in Thompson, B.N.,
Kermode, L.O., and Ewart, A. (eds): New Zealand volcanology: Central volcanic
region. New Zealand department of Scientific and Industrial Research information
series 50.
Groundwater Consultants New Zealand Ltd. 1983. Rangitaiki Plains Groundwater Survey -
Bore Completion Report – Paul’s Road Bore. for Bay of Plenty Catchment Commission.
Groundwater Consultants New Zealand Ltd. 1984: Rangitaiki Plains Groundwater Survey.
Bay of Plenty Catchment Commission and Regional Water Board.
Hamilton, D., Hamilton, M., and McBride, C. 2006: Nutrient and water budget for Lake
Tarawera. Centre for Biodiversity and Ecology Research, Department of Biological
Science, School of Science and Engineering, University of Waikato.

73
Healy, J. 1964a: Volcanic mechanism in the Taupo Volcanic Zone, New Zealand. New
Zealand journal of geology and geophysics 7(1): 6-23.
Healy, J. 1964b: Dating of the younger volcanic eruptions of the Taupo region. Pp 7-42 in
Stratigraphy and chronology of Late Quaternary Volcanic Ash in Taupo, Rotorua, and
Gisborne districts. New Zealand Geological Survey bulletin 73.
Hind, K.J. 1986: A geotechnical investigation of ignimbrites in the Ruahihi Area, Tauranga.
Unpublished M. Sc. Thesis, University of Waikato,Hamilton, NZ.
Houghton, B.F., Wilson, C.J.N., McWilliams, M.O., Lamphere, M.A., Weaver, S.D., Briggs,
R.M. and Pringle, M.S. 1995: Chronology and dynamics of a large silis magmatic
system: central Taupo Volcanic Zone, New Zealand. Geology 23:13-16.
McIntosh, J.J., Ngapo, N., Stace, C.E., Ellery, G.R., and Gibbons-Davies, J. 2001: Lake
Rerewhakaaitu Project. Environment Bay of Plenty, environmental report 2001/15.
Milner, D.M., Cole, J.W. and Wood, C.P. 2003: Mamaku Ignimbrite: a caldera-forming
ignimbrite erupted from a compositionally zoned magma chamber in Taupo Volcanic
Zone, New Zealand. Journal of Volcanology and Geothermal Research 122: 243-264.
Morgenstern, U., Reeves, R., Daughney, C., Cameron, S., Gordon, D., 2004. Groundwater
age and Chemistry, and Future Nutrient Load for Selected Rotorua Lakes Catchments.
Institute of Geological & Nuclear Sciences science report 2004/31. 73p.
Nairn, I.A. 1974: Rotoma, Lake Rotoiti, Tikitere, Taheke, Tarawera geothermal fields. In
Minerals of New Zealand (Part D: Geothermal) by staff of New Zealand Geological
Survey. Report N.Z.G.S. 38 p.
Nairn, I.A. 1981: Geothermal resources of the Okataina Volcanic Centre. Working notes. NZ
Geological Sciences.
Nairn, I.A. 1992: The Te Rere and Okareka eruptive episodes — Okataina Volcanic Centre,
Taupo Volcanic Zone, New Zealand. New Zealand Journal of Geology and
Geophysics, 1992, Vol. 35: 93-108
74
Nairn, I.A. 2002. Geology of the Okataina Volcanic Centre, scale 1:50 000. Institute of
Geological & Nuclear Sciences geological map 25. 1 sheet + 156 p. Lower Hutt, New
Zealand: Institute of Geological & Nuclear Sciences Limited.
New Zealand Geological Survey. 1989: Geological map of New Zealand V16 Mount
Tarawera.
Özkundakci, D. and Hamilton, D.P. 2007: Recent studies of sediment capping and
flocculation for nutrient stabilization of Lake Okaro. Centre for Biodiversity and
Ecology Research, Department of Biological Sciences, School of Science and
Engineering, The University of Waikato.
Pang, L., 1994: Groundwater resources of the lower Tarawera catchment. Bay of Plenty
Regional Council environmental report. 149p.
Reeves, R., White, P.A., Cameron, S.G., Kilgour, G., Morgenstern, U., Daughney, C., Esler,
W. and Grant, S., 2005: Lake Rotorua groundwater study: results of the 2004-2005
field programme. Institute of Geological and Nuclear Sciences client report 2005/06.
160p.
Rogan, A.M. 1982: A geophysical study of the Taupo Volcanic Zone, New Zealand. Journal
of Geophysical Research 87: 4073 – 4088.
Scholes, P. and Bloxham, M. 2007: "Rotorua Lakes Water Quality 2006 Report."
Environment Bay of Plenty.
Sheppard, D.S. 1986: Fluid chemistry of the Waimangu geothermal system. Geothermics 15:
309-328.
Spigel R.H. and Viner, A.B. 1992: Lakes, Waters of New Zealand 17: 47-62.
Stevenson, R.J., Hodder, A.P.W. and Briggs, R.M. 1994: Rheoloical estimates of rhyolite
lava flows to Okataina Volcanic Centre. New Zealand Journal of Geology and
Geophysics, 1994, Vol 37: 211-221.
Timperley, M.H. and Vigor-Brown, R.J. 1986: Water Chemistry of Lakes in the Taupo
Volcanic Zone. New Zealand Journal of Marine and Freshwater Research, 20:173-
183.

75
Topographic map of New Zealand 260-V16 Tarawera 1: 50 000. InfoMap. Edition 1988.
Topographic map of New Zealand 260-U16 Rotorua 1:50 000. InfoMap. Edition 2000.
Tracey, B.K. 1986: Geohydrological investigations in the Kinleith-Tokoroa region.
Unpublished M. Sc. Thesis, University of Waikato, Hamilton, NZ.
Wilson, C.J.N., Rogan, A.M., Smith, I.E.M., Northey, D.J., Nairn, I.A. and Houghton, B.F.
1984: Caldera volcanoes of the Taupo Volcanic Zone, New Zealand. Journal of
Geophysical Research 89: 8463-8484.
Wilson, C.J.N., Houghton, B.F., McWilliams, M.O., Lamphere, M.A., Weaver, S.D. and
Briggs, R.M. 1995: Volcanic and structural evolution of Taupo Volcanic Zone, New
Zealand: a review. Journal of Volcanology and Geothermal Research 68: 1-28.
White, E. and Cooper, A.B. 1991: A desk study of nutrient load on Lake Tarawera with an
assessment of prospects for lake water quality management by manipulation of land
use or point nutrient sources. DSIR Marine and Freshwater. 25p. + app.
White, P.A., Tait, T.M, Reeves, R.R., and Nairn, I.A. 2003: Groundwater in the Lake
Rerewhakaaitu catchment. GNS Client report 2002/62. 62 p.
White, P.A., Cameron, S.G., Kilgour, G., Mroczek, E., Bignall, G., Daughney, C., and
Reeves, R.R. 2004.: Review of groundwater in the Lake Rotorua catchment.
Confidential Report to Environment Bay of Plenty.
White, P.A., Zemansky, G., Hong, T., Kilgour, G., and Wall, M., 2007: Lake Rotorua
groundwater and Lake Rotorua nutrients – phase 3 science programme technical
report. GNS Client report 2007/220 to Environment Bay of Plenty. 402p.
Wood, C.P. 1985: Geology of Mamaku Water Supply Drillhole. DSIR report to Rotorua
District Council. 27 May, 1985.
Wood, C.P. 1992: Geology of Rotorua geothermal system. Geophysics 21: pp 25-44.