GROUNDWATER BASICS - Plainview Water District
117
4-1 SUBJECTS: Math (Advanced), Science (Physics) TIME: 1 class period MATERIALS: calculator paper pencil student sheet and figures GROUNDWATER BASICS 9-12 OBJECTIVES The student will do the following: 1. Compute math problems dealing with volume of groundwater. 2. Calculate average porosity in one type of aquifer. 3. Calculate the volume of water that will supply a particular well and its recharge rate. BACKGROUND INFORMATION Groundwater accounts for a major portion of the world’s freshwater resources. Estimates of the global water supply show groundwater as 0.6 percent of the world’s total water and 60 percent of the available fresh water resources. The total volume of readily available global groundwater is about 4.2 x 10 km as 6 3 compared to 0.126 x 10 km (kilometers cubed) stored in lakes and streams. Next to glaciers and 6 3 icecaps, which do not have readily available water, groundwater reservoirs are the largest holding basins for fresh water in the world hydrologic cycle (Figure 1). The age of groundwater may range from a few years or less to tens of thousands of years or more. For the United States, it is estimated that about 25 percent of precipitation becomes groundwater. It is estimated that the total usable groundwater in storage is about equivalent to the total precipitation for ten years, or the total surface runoff to streams and lakes for 35 years, although all of this groundwater is not available for practical use. In the United States, groundwater storage exceeds by many times the capacity of all surface reservoirs and lakes, including the Great Lakes. Recoverable groundwater is that water released from storage in the subsurface zone of saturation whose capacity is the total volume of the pores or openings in soil or rocks that are filled with water. The porosity values of specific materials are shown in Figure 2. Groundwater movement is dependent on the degree of interconnection of the porous space (permeability)
Transcript of GROUNDWATER BASICS - Plainview Water District
4-1
SUBJECTS:Math (Advanced), Science (Physics)
TIME:1 class period
MATERIALS:calculatorpaperpencilstudent sheet and figures
GROUNDWATER BASICS9-12
OBJECTIVES
The student will do the following:
1. Compute math problems dealing with volume of groundwater.
2. Calculate average porosity in one type of aquifer.
3. Calculate the volume of water that willsupply a particular well and its rechargerate.
BACKGROUND INFORMATION
Groundwater accounts for a major portion of the world’s freshwater resources. Estimates of the globalwater supply show groundwater as 0.6 percent of the world’s total water and 60 percent of the availablefresh water resources. The total volume of readily available global groundwater is about 4.2 x 10 km as6 3
compared to 0.126 x 10 km (kilometers cubed) stored in lakes and streams. Next to glaciers and6 3
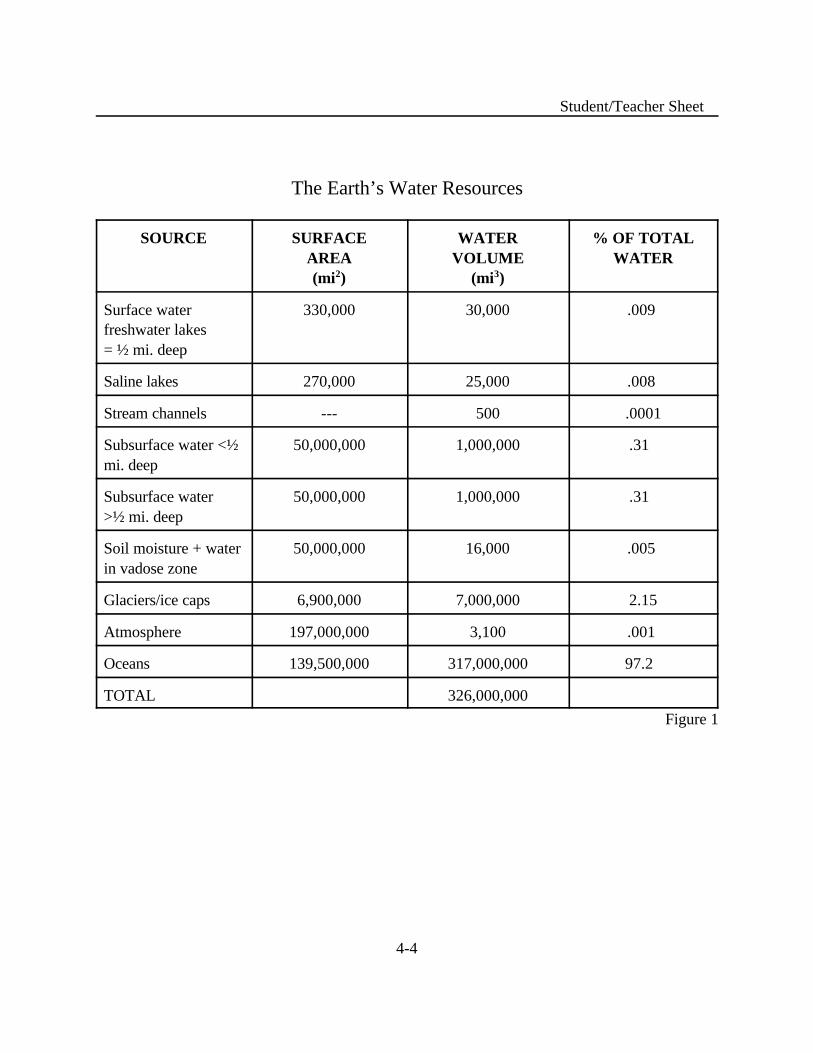
icecaps, which do not have readily available water, groundwater reservoirs are the largest holding basinsfor fresh water in the world hydrologic cycle (Figure 1).
The age of groundwater may range from a few years or less to tens of thousands of years or more. For theUnited States, it is estimated that about 25 percent of precipitation becomes groundwater.
It is estimated that the total usable groundwater in storage is about equivalent to the total precipitation forten years, or the total surface runoff to streams and lakes for 35 years, although all of this groundwater isnot available for practical use. In the United States, groundwater storage exceeds by many times thecapacity of all surface reservoirs and lakes, including the Great Lakes.
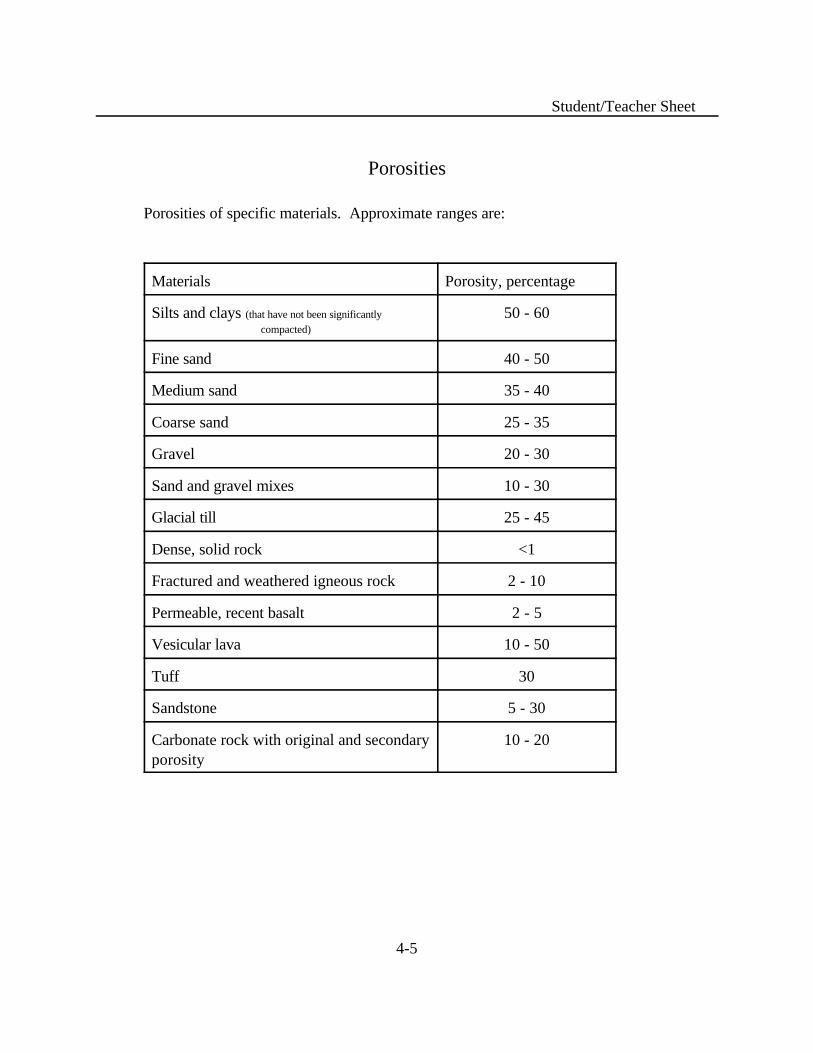
Recoverable groundwater is that water released from storage in the subsurface zone of saturation whosecapacity is the total volume of the pores or openings in soil or rocks that are filled with water. The porosityvalues of specific materials are shown in Figure 2.
Groundwater movement is dependent on the degree of interconnection of the porous space (permeability)
4-2
and the gradient or slope of the water table. These factors vary greatly depending on the aquifer type.Groundwater in a carbonate aquifer can occasionally move through limestone caverns as rapidly as surfacewater (1-3 ft/sec). In sandy aquifers, groundwater can move as slowly as 3 ft/day or even as slowly as 1in/day. For those reasons, groundwater cleanup, or remediation, can only be done by enhanced methods.*These methods are complex and expensive, making groundwater pollution prevention quite economical. There are obvious health protection reasons for groundwater pollution prevention, as well.
Terms:
carbonate aquifer: underground layer of limestone that is saturated with usable amounts of water
gradient: change of elevation, velocity, pressure, or other characteristics per unit length; slope
hydrologic cycle: the cyclical process of water’s movement from the atmosphere, its inflow andtemporary storage on and in land, and its outflow to the oceans; cycle of water from the atmosphere bycondensation, and precipitation, then its return to the atmosphere by evaporation and transpiration.
permeability: the capacity of a porous material to transmit fluids. Permeability is a function of the sizes,shapes, and degree of connection among pore spaces, the viscosity of the fluid, and the pressure drivingthe fluid.
porosity: the spaces in rock or soil not occupied by solid matter.
water table: upper surface of the zone of saturation of groundwater
ADVANCE PREPARATION
A. Copy Figures 1 and 2, Student Sheets, and Activity Section for students.
B. Complete the math problems before students are given them. (See the teacher sheet.)* For information on enhanced methods, see activity “Groundwater: Cleaning Up” in this chapter.
PROCEDURE
I. Setting the stage
A. Give students Conversion Student Sheet, Figures 1 and 2, and Activity Section.
B. If students need help with the math, give them the Hint Page.
4-3
II. Activity
Problems:
A. How many gallons are represented by 4.2 x 10 km of global groundwater?6 3
B. If 1 x 10 mi of subsurface water exists in a volume of the earth’s crust that covers 6 3
5 x 10 mi of the land surface land is ½ mile deep, what is the average porosity (in %) of the7 2
upper layer of the Earth’s crust?* (assuming that the entire depth is saturated)
C. If a recharge area of a water well measures 1000 acres and the well is 800 meters deep, and soilporosity is that of a sand and gravel mix, what volume of water might theoretically supply the well?*
D. In question C above, what is the annual recharge rate (gallons/year) if precipitation is 55inches per year, 7 inches of which become groundwater?
*Note: Solutions to B, C, and D are oversimplifications of these types of determinations butgenerally demonstrate the principles of recharge, yield, and infiltration calculations.
RESOURCES
Bouwer, Herman, Groundwater Hydrology, McGraw Hill Book Company, New York, NY, 1978,pp. 2-3, 6-8.
Groundwater and Wells, Johnson Division, UOP, Inc. St. Paul, MN, 1975, pp. 17-18.
Groundwater Pollution and Hydrology, Princeton University Short Course, 1983, pp. 1-2.
4-4
Student/Teacher Sheet
The Earth’s Water Resources
SOURCE SURFACE WATER % OF TOTALAREA VOLUME WATER(mi ) (mi )2 3
Surface water 330,000 30,000 .009 freshwater lakes= ½ mi. deep
Saline lakes 270,000 25,000 .008
Stream channels --- 500 .0001
Subsurface water <½ 50,000,000 1,000,000 .31 mi. deep
Subsurface water 50,000,000 1,000,000 .31 >½ mi. deep
Soil moisture + water 50,000,000 16,000 .005 in vadose zone
Glaciers/ice caps 6,900,000 7,000,000 2.15
Atmosphere 197,000,000 3,100 .001
Oceans 139,500,000 317,000,000 97.2
TOTAL 326,000,000
Figure 1
4-5
Student/Teacher Sheet
Porosities
Porosities of specific materials. Approximate ranges are:
Materials Porosity, percentage
Silts and clays (that have not been significantly 50 - 60 compacted)
Fine sand 40 - 50
Medium sand 35 - 40
Coarse sand 25 - 35
Gravel 20 - 30
Sand and gravel mixes 10 - 30
Glacial till 25 - 45
Dense, solid rock <1
Fractured and weathered igneous rock 2 - 10
Permeable, recent basalt 2 - 5
Vesicular lava 10 - 50
Tuff 30
Sandstone 5 - 30
Carbonate rock with original and secondary 10 - 20porosity
4-6
Student Sheet
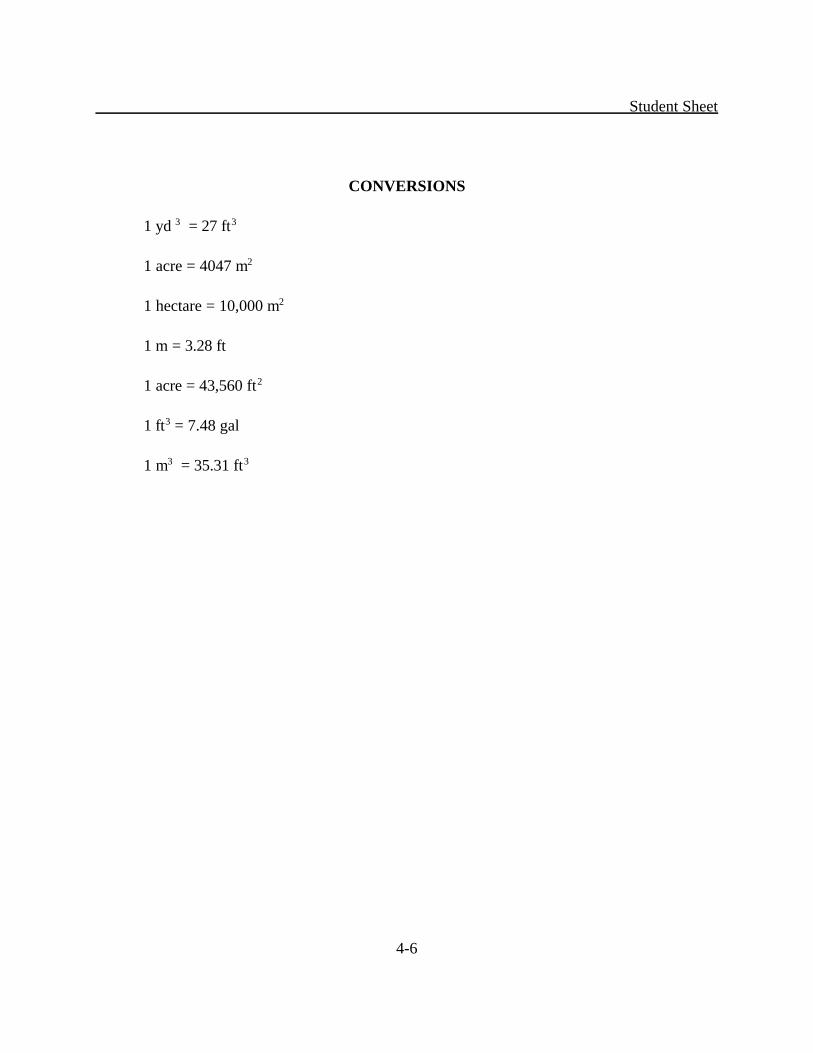
CONVERSIONS
1 yd = 27 ft3 3
1 acre = 4047 m2
1 hectare = 10,000 m2
1 m = 3.28 ft
1 acre = 43,560 ft2
1 ft = 7.48 gal3
1 m = 35.31 ft3 3
4-7
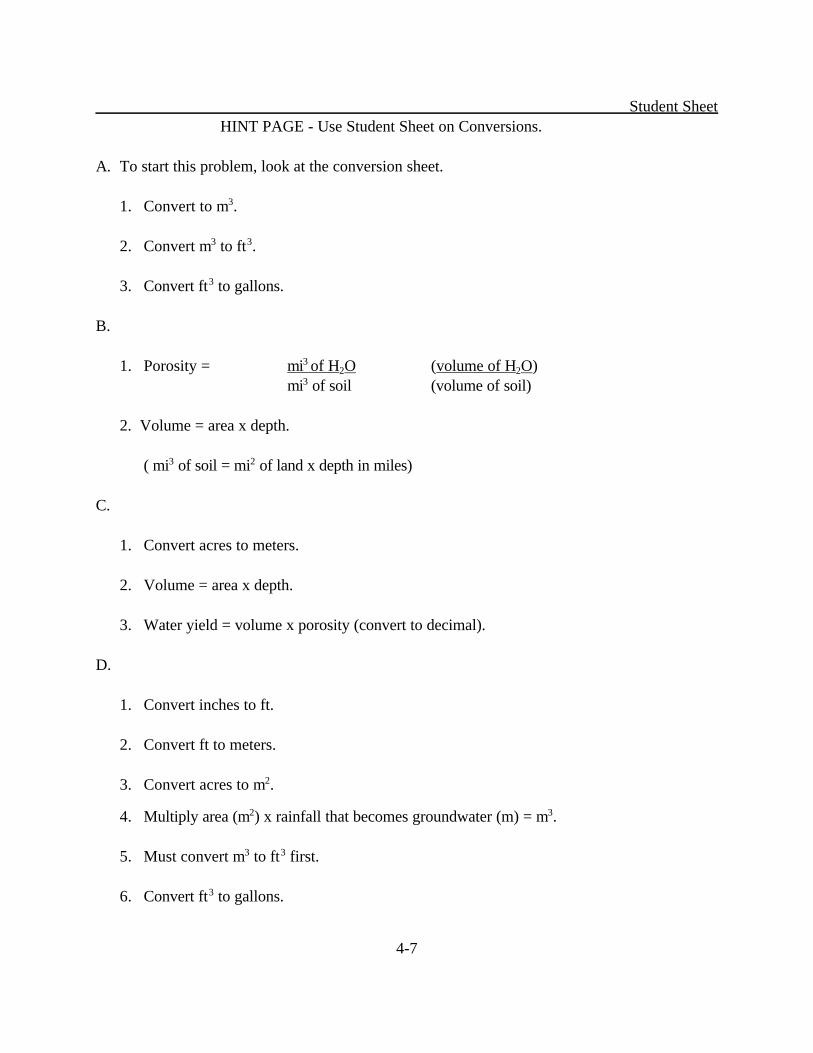
Student Sheet HINT PAGE - Use Student Sheet on Conversions.
A. To start this problem, look at the conversion sheet.
1. Convert to m .3
2. Convert m to ft .3 3
3. Convert ft to gallons.3
B.
1. Porosity = mi of H O (volume of H O)3 2 2
mi of soil (volume of soil)3
2. Volume = area x depth.
( mi of soil = mi of land x depth in miles)3 2
C.
1. Convert acres to meters.
2. Volume = area x depth.
3. Water yield = volume x porosity (convert to decimal).
D.
1. Convert inches to ft.
2. Convert ft to meters.
3. Convert acres to m .2
4. Multiply area (m ) x rainfall that becomes groundwater (m) = m .2 3
5. Must convert m to ft first. 3 3
6. Convert ft to gallons.3
4-8
Teacher Sheet
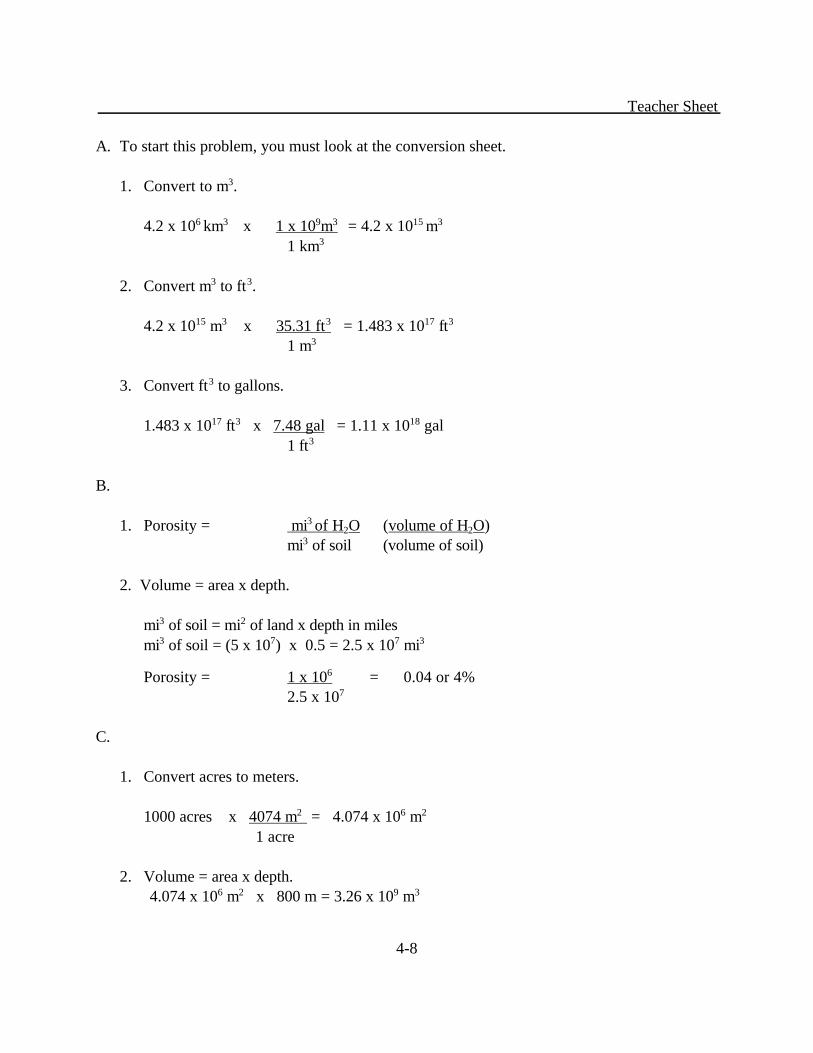
A. To start this problem, you must look at the conversion sheet.
1. Convert to m .3
4.2 x 10 km x 1 x 10 m = 4.2 x 10 m6 3 9 3 15 3
1 km3
2. Convert m to ft .3 3
4.2 x 10 m x 35.31 ft = 1.483 x 10 ft15 3 3 17 3
1 m3
3. Convert ft to gallons.3
1.483 x 10 ft x 7.48 gal = 1.11 x 10 gal17 3 18
1 ft3
B.
1. Porosity = mi of H O (volume of H O)3 2 2
mi of soil (volume of soil)3
2. Volume = area x depth.
mi of soil = mi of land x depth in miles3 2
mi of soil = (5 x 10 ) x 0.5 = 2.5 x 10 mi3 7 7 3
Porosity = 1 x 10 = 0.04 or 4% 6
2.5 x 10⁷
C.
1. Convert acres to meters.
1000 acres x 4074 m = 4.074 x 10 m2 6 2
1 acre
2. Volume = area x depth. 4.074 x 10 m x 800 m = 3.26 x 10 m6 2 9 3
4-9
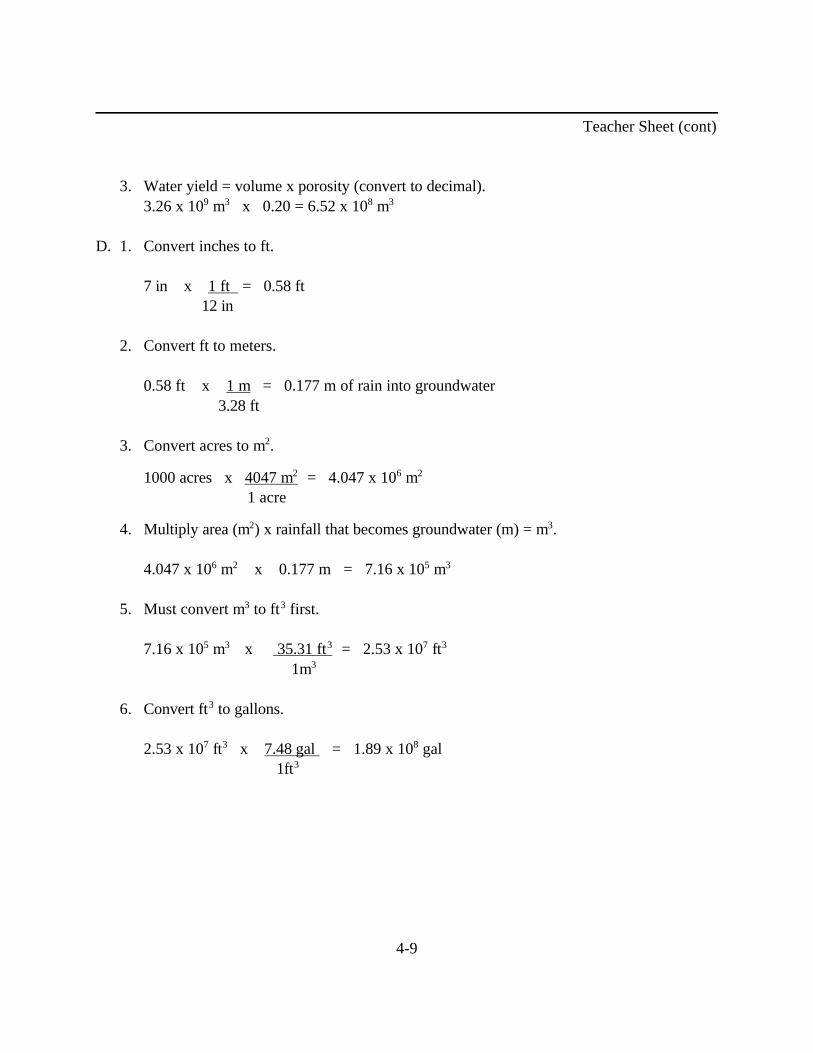
Teacher Sheet (cont)
3. Water yield = volume x porosity (convert to decimal).3.26 x 10 m x 0.20 = 6.52 x 10 m9 3 8 3
D. 1. Convert inches to ft.
7 in x 1 ft = 0.58 ft 12 in
2. Convert ft to meters.
0.58 ft x 1 m = 0.177 m of rain into groundwater 3.28 ft
3. Convert acres to m .2
1000 acres x 4047 m = 4.047 x 10 m2 6 2
1 acre
4. Multiply area (m ) x rainfall that becomes groundwater (m) = m .2 3
4.047 x 10 m x 0.177 m = 7.16 x 10 m6 2 5 3
5. Must convert m to ft first. 3 3
7.16 x 10 m x 35.31 ft = 2.53 x 10 ft5 3 3 7 3
1m 3
6. Convert ft to gallons.3
2.53 x 10 ft x 7.48 gal = 1.89 x 10 gal7 3 8
1ft3
4-10
Student Sheet
4-11
SUBJECTS:Language Arts, Science(Physical Science, EarthScience)
TIME:1 class period
MATERIALS:student sheets:The Hidden Resource - Groundwater Keeping It SafeKeeping It Protected
9-12 FROM GROUND TO WATER
OBJECTIVES
The student will do the following:
1. Define groundwater.
2. Describe some problems involving groundwater.
3. Discuss ideas relating to groundwater issues.
BACKGROUND INFORMATION
Groundwater begins with precipitation that seeps into the ground.The amount of water that seeps into the ground will vary widely from place to place depending on slopeof the land, amount and intensity of rainfall, and the type of land surface.
Many people think of groundwater as underground lakes or streams; however, ground-water is simplywater filling spaces between rock grains or fractures and fissures in rocks. A body of rock or sedimentthat can yield water in a usable quantity is called an aquifer.
Rain and snowmelt percolating down through the soil are the sources of groundwater. Plants consumemuch of the water that enters the soil, and a small amount is held on the soil grains. Some water in the soilevaporates, and some flows out of the soil into lakes and rivers.
Groundwater is usually in very slow motion. The rate of groundwater flow is determined by the slope ofthe water table and the sizes of the pores among the rock and soil particles.
Groundwater does not occur all the way to the core of the Earth. Beneath the water-bearing rockseverywhere, at some depth the rocks are water-tight. This depth may be a few hundred feet or, more thanlikely, tens of thousands of feet.
Terms
aquifer: porous, water-bearing layer of sand, gravel, and rock below the Earth’s surface; reservoirfor groundwater
4-12
fault: a fracture in the Earth's crust accompanied by displacement of one side of the fracture withrespect to the other
fracture: a break in rock that may be caused by compressional or tensional forces
groundwater: water that infiltrates into the Earth and is stored in usable amounts in the soil and rock belowthe Earth’s surface; water within the zone of saturation
pore: a passage; channel; a tiny opening, usually microscopic
saturated zone: a portion of the soil profile where all pores are filled with water. Aquifers are located inthis zone. There may be multiple saturation zones at different soil depths separated by layers of clay orrock.
saturation: being filled to capacity; having absorbed all that can be taken up
surface water: precipitation that does not soak into the ground or return to the atmosphere byevaporation or transpiration. It is stored in streams, lakes, rivers, ponds, wetlands, oceans,and reservoirs.
transpiration: process in which water absorbed by the root systems of plants moves up through theplants, passes through pores (stomata) in their leaves or other parts, and then evaporates intothe atmosphere as water vapor; the passage of water vapor from a living body through a membrane
or pores
unsaturated zone: a portion of the soil profile that contains both water and air; the zone betweenthe land surface and the water table. The soil formations do not yield usable amounts of free-flowing water. It is also called zone of aeration and vadose zone.
water table: upper surface of the zone of saturation of groundwater
ADVANCE PREPARATION
Have copies of Student Sheets ready for class distribution.
PROCEDURE
I. Setting the stage
4-13
A. Have terms and definitions on the board.
B. Have students write terms and definitions in journals if vocabulary words are to be used as part of an overall unit word study.
C. Give students copies of one or more of the Student Sheets that are to be used. Allow for independent reading time or assign sections to be read individually.
D. Have a class discussion of handouts led by teacher or student. Have on hand several leadingquestions that may be developed in class discussion; these could come from Background Information.
II. Activity
A. Read the Student Sheets on Groundwater. Write a newspaper article addressing groundwater problems.
B. Create a three-frame comic strip addressing one problem involved in groundwater contamination.
C. Compose a well-written business letter (using the form suggested in your English textbook) to an official in the area, or ask one in the local state agency to speak to the class concerning groundwater in the area. Follow up with a thank-you letter.
D. Write a newspaper story relating your findings of the groundwater situation in your area.
E. Prepare a lesson plan for presentation to a fifth-grade class in which groundwater issues are addressed. Include terms and definitions, questions for discussion, and a short follow-up quiz.
4-14
III. Extensions
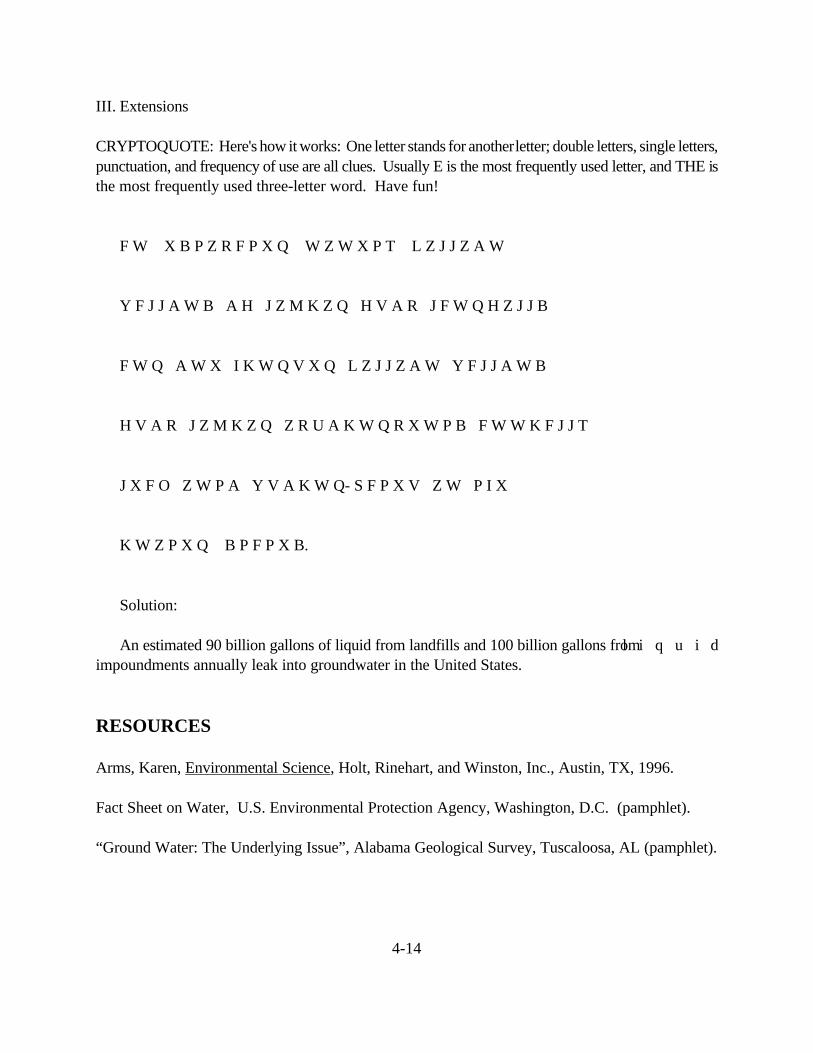
CRYPTOQUOTE: Here's how it works: One letter stands for another letter; double letters, single letters,punctuation, and frequency of use are all clues. Usually E is the most frequently used letter, and THE isthe most frequently used three-letter word. Have fun!
F W X B P Z R F P X Q W Z W X P T L Z J J Z A W
Y F J J A W B A H J Z M K Z Q H V A R J F W Q H Z J J B
F W Q A W X I K W Q V X Q L Z J J Z A W Y F J J A W B
H V A R J Z M K Z Q Z R U A K W Q R X W P B F W W K F J J T
J X F O Z W P A Y V A K W Q- S F P X V Z W P I X
K W Z P X Q B P F P X B.
Solution:
An estimated 90 billion gallons of liquid from landfills and 100 billion gallons from l i q u i dimpoundments annually leak into groundwater in the United States.
RESOURCES
Arms, Karen, Environmental Science, Holt, Rinehart, and Winston, Inc., Austin, TX, 1996.
Fact Sheet on Water, U.S. Environmental Protection Agency, Washington, D.C. (pamphlet).
“Ground Water: The Underlying Issue”, Alabama Geological Survey, Tuscaloosa, AL (pamphlet).
4-15
Student SheetThe Hidden Resource - Groundwater
Every day Americans rely on a resource that is “hidden” in its natural surroundings. Hidden beneath layersof soil and rock is the Earth’s largest freshwater supply: groundwater. The estimated supply ofgroundwater in the lower 48 states is 65 quadrillion gallons or about 4 times the amount of water in theGreat Lakes. It is the source of water for about half of the U.S. residents and nearly 97 percent of the ruralpopulation.
Groundwater originates as precipitation. It seeps into the ground, filling the spaces and pores between soilparticles or the fractures and fissures in rocks. The underground area where all the pores and spaces arefilled with water is called the saturated zone. Different geological formations hold varying amounts of water,but those that yield water in usable quantities are called aquifers. Usually, groundwater flows slowlythrough an aquifer; the rate can be as little as half an inch per year. The flow can be considerably fasterin limestone caverns, volcanic lava tubes, or large rock formations where groundwater may resembleunderground streams.
As water travels through the soil and rock, it picks up water-soluble materials and carries them along.Some of the materials in groundwater occur naturally, but many constituents in groundwater are the resultof human land use activities. Different soils have different capacities to filter and absorb wastes. However,once groundwater is contaminated, it is difficult and may be impossible to clean up. When possible,cleanup is very expensive and may require many years.
In many geological formations, groundwater moves so slowly that contamination can remain undiscoveredfor years until the contaminated groundwater is brought to the surface by springs or wells. During that time,the pollutants can spread and contaminate large volumes of otherwise usable groundwater.
Potential sources of contaminants that threaten groundwater in the United States include the following:
C ~23 million septic systemsC ~390 million tons of municipal and industrial waste in 6,000 landfillsC ~1.7 million active oil and gas wells and ~1million abandoned wellsC ~72,000 active coal and mineral mines; ~60,500 oil and gas; ~1,500 metal mines; ~5,000 coal;
~6,000 active non-metalC ~1.1 billion pounds of pesticides used each year; 660 million pounds of Alachlor and Atrazine used
per yearC ~50 million tons of fertilizer used each yearC ~306 million gallons of improperly disposed motor oilC ~1.2 million underground storage tanksC ~7.4 million tons of deicing salts applied to highways each winter; Snow Belt states receive 100
metric tons per road mile during the winter
4-16
Student Sheet
KEEPING IT PROTECTED
An estimated 90 billion gallons of liquid from landfills and 100 billion gallons from liquidimpoundments annually leak into groundwater in the United States.
Listed below are some of the ways to make sure that future generations will have clean, safe groundwatersupplies.
C Have your septic tank pumped out every three to five years.C Do not store pesticides, fertilizers, and herbicides near a well.C Make sure abandoned wells are properly filled in and sealed.C Store home-heating oil in an above-ground storage tank where leaks can be easily detected.C Use fertilizers and pesticides on lawns and gardens sparingly and follow all label directions for
mixing, use, and disposal of empty containers.C Report chemical or toxic spills on land, in the air, or in the water by calling the 24-hour National
Response Center toll-free at 800-424-8802.C Do not pour toxic or hazardous substances into sinks or toilets, on the ground, or into sinkholes.C Collect used motor oil and recycle it at used-oil collection centers or service stations.C Cover your wellhead with a cap and grade the soil around the wellhead so that runoff water is
diverted away from the well.C Test your well water for bacteria and nitrates once a year.
4-17
Student Sheet
KEEPING IT SAFE
Everyone has a role to play in keeping our water supplies safe. Everyday activities affect water quality.By being cautious about the use of hazardous substances - pesticides, fertilizers, herbicides, paints, fuels -and the disposal of all types of waste, every citizen can help keep our water resources safe and clean.
Consider some of the following alternatives to hazardous household chemicals and products:
C Use lotions or gels instead of aerosol sprays.C Use rechargeable batteries.C Use 1 part vinegar to 32 parts water to wash floors.C Use a mixture of salt and lemon juice to clean copper.C Use dry cornstarch or baking soda as a rug cleaner.C Use non-phosphate detergents.C Use cedar chips as an alternative to moth balls.C Use 2 tablespoons of vinegar to 1 quart of water as a window cleaner.

4-18
4-19
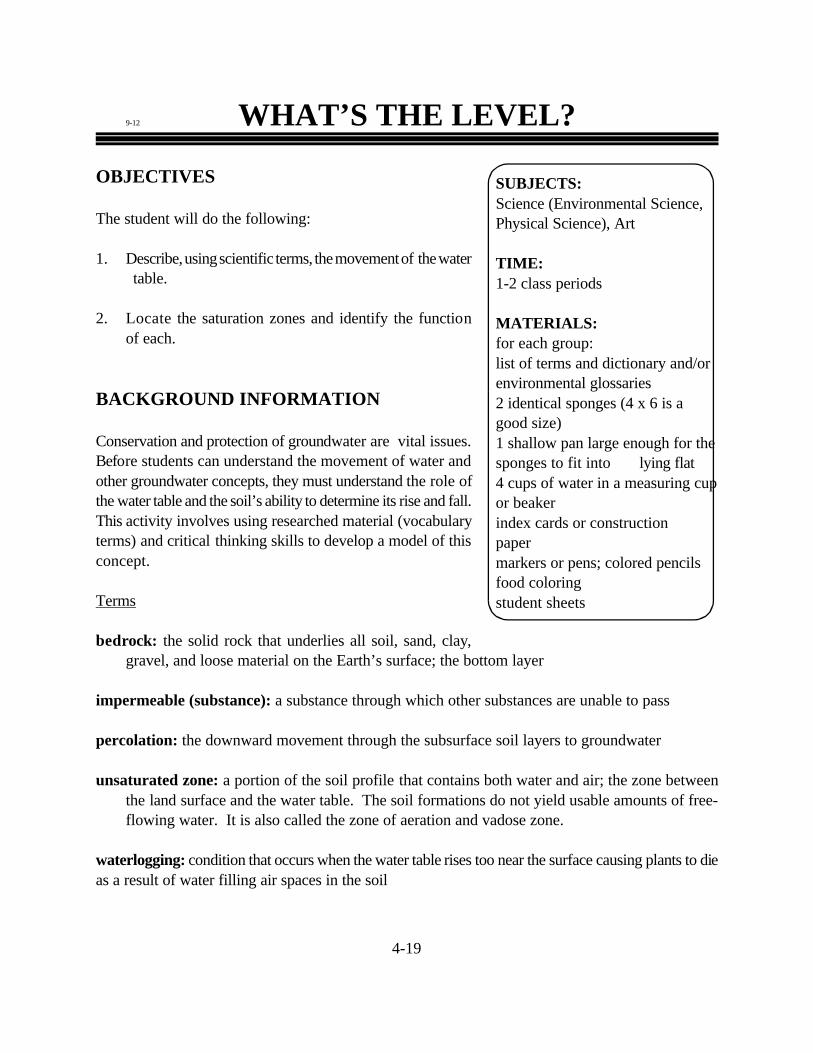
SUBJECTS:Science (Environmental Science,Physical Science), Art
TIME:1-2 class periods
MATERIALS:for each group:list of terms and dictionary and/orenvironmental glossaries2 identical sponges (4 x 6 is agood size)1 shallow pan large enough for thesponges to fit into lying flat4 cups of water in a measuring cupor beakerindex cards or construction papermarkers or pens; colored pencilsfood coloringstudent sheets
9-12 WHAT’S THE LEVEL?
OBJECTIVES
The student will do the following:
1. Describe, using scientific terms, the movement of the water table.
2. Locate the saturation zones and identify the functionof each.
BACKGROUND INFORMATION
Conservation and protection of groundwater are vital issues.Before students can understand the movement of water andother groundwater concepts, they must understand the role ofthe water table and the soil’s ability to determine its rise and fall.This activity involves using researched material (vocabularyterms) and critical thinking skills to develop a model of thisconcept.
Terms
bedrock: the solid rock that underlies all soil, sand, clay,gravel, and loose material on the Earth’s surface; the bottom layer
impermeable (substance): a substance through which other substances are unable to pass
percolation: the downward movement through the subsurface soil layers to groundwater
unsaturated zone: a portion of the soil profile that contains both water and air; the zone betweenthe land surface and the water table. The soil formations do not yield usable amounts of free-flowing water. It is also called the zone of aeration and vadose zone.
waterlogging: condition that occurs when the water table rises too near the surface causing plants to dieas a result of water filling air spaces in the soil
4-20
water table: upper surface of the zone of saturation of groundwater
zone of saturation: that region below the surface in which all voids are filled with liquid
ADVANCE PREPARATION
A. Gather the materials.
B. Copy Student Sheets -- one per group.
PROCEDURE
I. Setting the stage
A. The purpose of this activity is for students to utilize information gained from defining terms and thendiscover answers on their own. Therefore, they should be given additional suggestions until they havehad time to figure out the model for themselves.
B. There are several ways to approach this lab. Usually the students will stack the two sponges on top of each other and pour the water over them until they become saturated. However, some students may pour the water into the pan, saturate one of the sponges, and set the dry sponge on top. And still others may dunk the sponges into the cup of water, wring them out, and then proceed.
C. The sponges represent the soil and are similar to soil because they have the ability to hold waterand air within their pores, become saturated, and dry out. The sponges also allow for the percolationof the water down to the zone of saturation. The pan, being an impermeable substance, representsthe bedrock and thus does not allow the water to penetrate but instead blocks its flow and starts thewater table rising. The water will represent groundwater when it is held within a completely saturatedsponge, soil water when it is held within a within a damp (but unsaturated) sponge and precipitationwhen it is poured over the top of the sponges.
D. It is important that the students define the terms prior to building the model and answering the lab questions. Remind students that they may have to use several sources to get a definition they understand.
4-21
II. Activity
A. Give each lab group of students the following materials:
1. List of terms and a dictionary and/or environment glossaries (on Student Sheet)
2. Two identical sponges
3. Shallow pan
4. Four cups of water in a measuring cup or beaker
5. Index cards or construction paper
6. Markers or pens; colored pencils
7. Student lab sheet
B. Tell students to read the directions on the lab sheet and complete the lab. They may not work with or discuss this lab with another group. They are to turn in the lab sheet and model
when they have finished.
III. Follow-up
A. Have each group orally explain its model to the teacher or to other groups.
B. Join two or more groups and let them go over their answers, adding or deleting information as needed, until they have a clear understanding of the materials.
IV. Extensions
A. Let students simulate climate conditions, such as drought or high temperatures,and note the changes.
B. Assign students to research the process of waterlogging and devise an experiment to test the procedure.
C. Have students research what happens to plants, homes, septic tanks, and roads when the water table is only one foot below the surface.
4-22
RESOURCES
Arms, Karen, Environmental Science, Holt, Rinehart, and Winston, Inc., Austin, TX, 1996.
Chiras, Daniel D., Environmental Science, High School Edition, Addison-Wesley, Menlo Park, CA.
Nebel, Bernard J. and Richard T. Wright, Environmental Science: The Way The World Works, 4th Edition, Prentice-Hall, Englewood Cliffs, NJ, 1993.
4-23
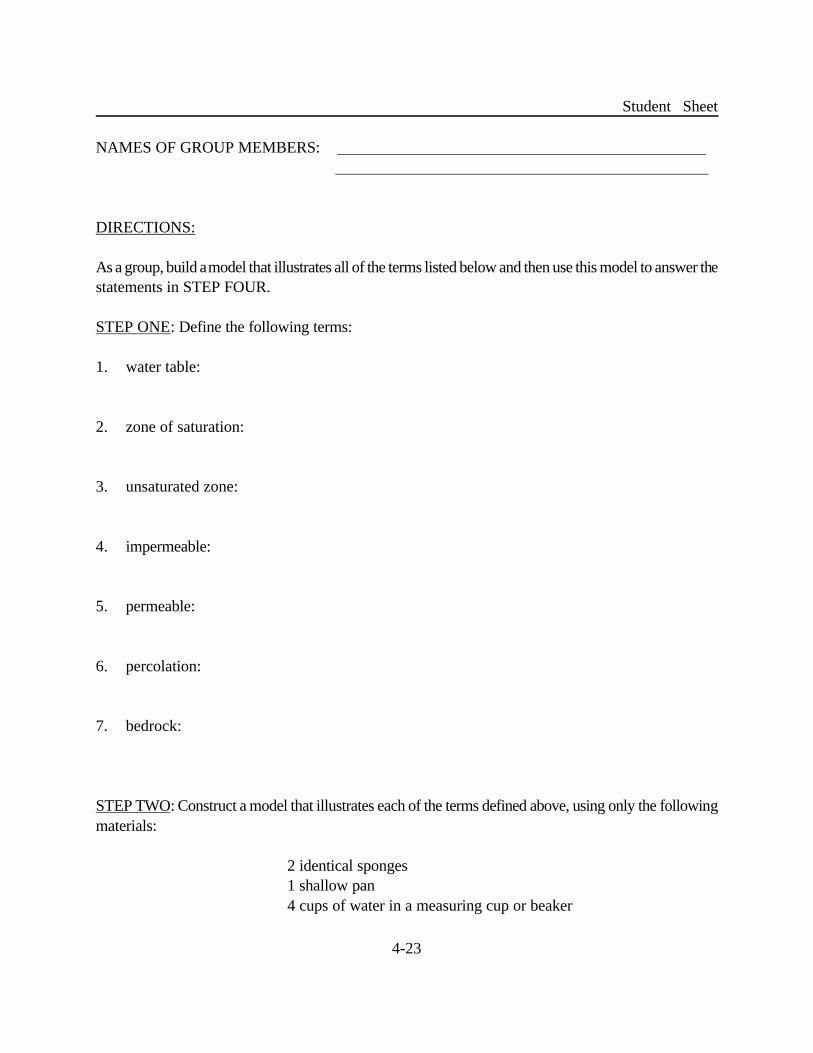
Student Sheet
NAMES OF GROUP MEMBERS:
DIRECTIONS:
As a group, build a model that illustrates all of the terms listed below and then use this model to answer thestatements in STEP FOUR.
STEP ONE: Define the following terms:
1. water table:
2. zone of saturation:
3. unsaturated zone:
4. impermeable:
5. permeable:
6. percolation:
7. bedrock:
STEP TWO: Construct a model that illustrates each of the terms defined above, using only the followingmaterials:
2 identical sponges1 shallow pan4 cups of water in a measuring cup or beaker

4-24
Student Sheet
STEP THREE: Draw a picture of your model and label all parts.
4-25
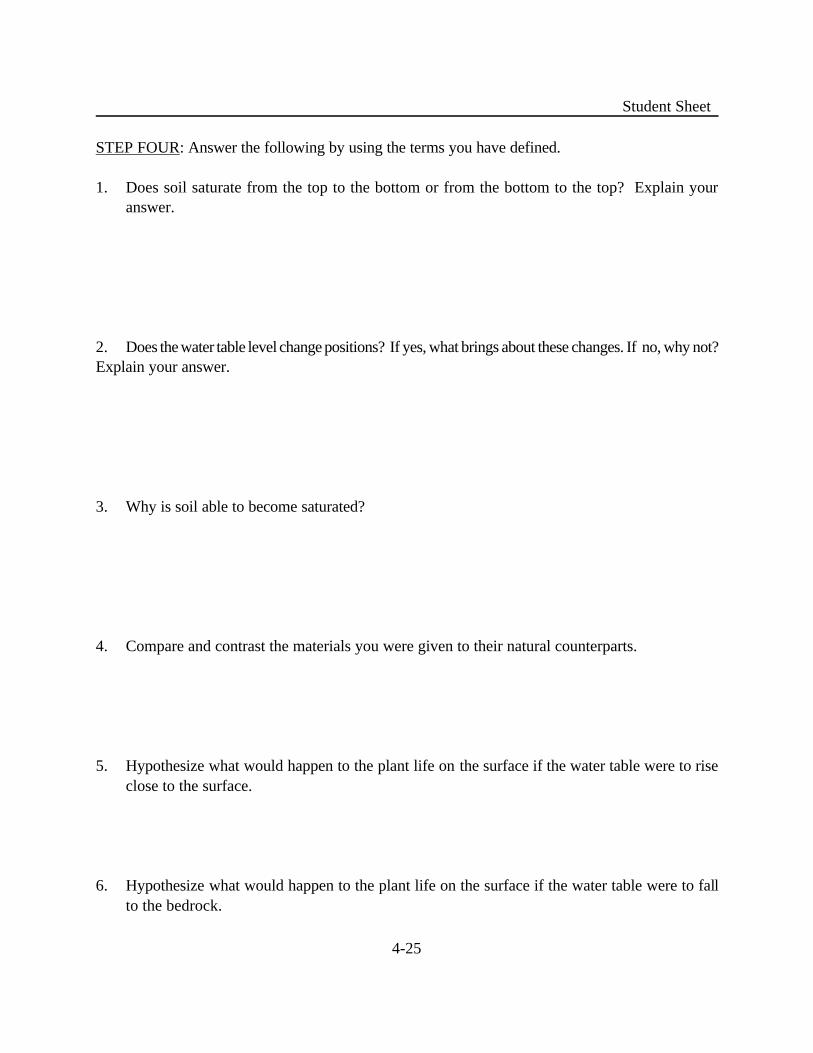
Student Sheet
STEP FOUR: Answer the following by using the terms you have defined.
1. Does soil saturate from the top to the bottom or from the bottom to the top? Explain youranswer.
2. Does the water table level change positions? If yes, what brings about these changes. If no, why not?Explain your answer.
3. Why is soil able to become saturated?
4. Compare and contrast the materials you were given to their natural counterparts.
5. Hypothesize what would happen to the plant life on the surface if the water table were to riseclose to the surface.
6. Hypothesize what would happen to the plant life on the surface if the water table were to fallto the bedrock.

4-26
4-27
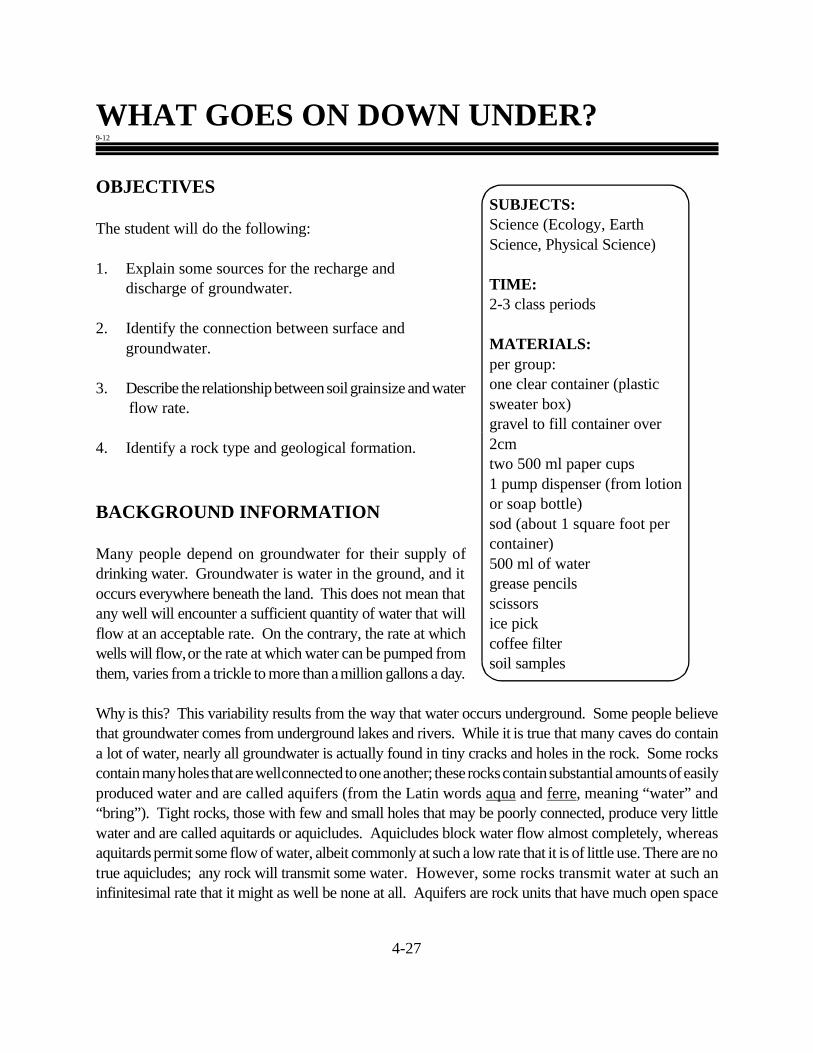
SUBJECTS:Science (Ecology, EarthScience, Physical Science)
TIME:2-3 class periods
MATERIALS:per group:one clear container (plasticsweater box)gravel to fill container over 2cmtwo 500 ml paper cups1 pump dispenser (from lotionor soap bottle)sod (about 1 square foot per container)500 ml of watergrease pencilsscissorsice pick coffee filtersoil samples
WHAT GOES ON DOWN UNDER?9-12
OBJECTIVES
The student will do the following:
1. Explain some sources for the recharge and discharge of groundwater.
2. Identify the connection between surface and groundwater.
3. Describe the relationship between soil grain size and water flow rate.
4. Identify a rock type and geological formation.
BACKGROUND INFORMATION
Many people depend on groundwater for their supply ofdrinking water. Groundwater is water in the ground, and itoccurs everywhere beneath the land. This does not mean thatany well will encounter a sufficient quantity of water that willflow at an acceptable rate. On the contrary, the rate at whichwells will flow, or the rate at which water can be pumped fromthem, varies from a trickle to more than a million gallons a day.
Why is this? This variability results from the way that water occurs underground. Some people believethat groundwater comes from underground lakes and rivers. While it is true that many caves do containa lot of water, nearly all groundwater is actually found in tiny cracks and holes in the rock. Some rockscontain many holes that are well connected to one another; these rocks contain substantial amounts of easilyproduced water and are called aquifers (from the Latin words aqua and ferre, meaning “water” and“bring”). Tight rocks, those with few and small holes that may be poorly connected, produce very littlewater and are called aquitards or aquicludes. Aquicludes block water flow almost completely, whereasaquitards permit some flow of water, albeit commonly at such a low rate that it is of little use. There are notrue aquicludes; any rock will transmit some water. However, some rocks transmit water at such aninfinitesimal rate that it might as well be none at all. Aquifers are rock units that have much open space
4-28
(aquifers are porous). These open spaces are well connected so that fluids may flow easily through therock (aquifers are permeable). A porous and permeable rock is like a sponge; it can hold a lot of water,and it can give up a lot of water quickly. Aquifers tend to be interlayered with aquitards and aquicludesso if a deep well is drilled, there might be several different aquifers that could be tapped to supply water.The water in different aquifers under the same piece of land can be very different; the aquifers may be, toall intents and purposes, separate.
Even where large rivers or lakes could provide abundant water, many people choose to drill wells for theirdrinking water. This is because groundwater is less likely to be polluted than surface water. Most of thepotential sources of pollution (for instance, farms, paper mills, or septic tanks) are at the surface or veryclose to it (for example, underground storage tanks). Thus, most pollution occurs at or very near thesurface, and nearly all surface waters show at least some signs of pollution. However groundwater issomewhat protected from this contamination. Water travels slowly in the subsurface with speeds of inchesor feet per day. Thus, even if some unwanted substances enter the ground, they may take a long time topenetrate deeply enough to affect the groundwater supply. Also, deeper aquifers that underlie aquicludesmay be isolated from surface-derived contamination. Groundwater is commonly treated with chlorine tokill bacteria if it is to be used for drinking, but most groundwater needs no other treatment. Groundwateris a priceless resource that we ought to conserve, protect, and use wisely.
Terms
aquiclude: a low-permeability unit that forms either the upper or lower boundary of a groundwaterflow system
aquifer: porous, water-bearing layer of sand, gravel, and rock below the Earth’s surface; reservoirfor groundwater
aquitard: a low-permeability layer of rock or clay that can store water but transmits it very slowly fromone aquifer to another
artesian well: a well that produces water without need for pumping due to pressure exerted by confininglayers of soil
discharge: the outflow of groundwater from a flowing artesian well, ditch, or spring
dowsing: to search for a source of water or minerals with a divining rod
drawdown: the lowering of the water table as water is removed from an aquifer
geologic map: a map of the Earth’s surface with surface geologic formations superimposed overexisting features such as roads, streams, lakes, and other features
4-29
geological formation: a body of rock identified by lithic characteristics and stratigraphic position;the fundamental unit in lithostratigraphic classification
groundwater: water that infiltrates into the Earth and is stored in usable amounts in the soil androck below the Earth’s surface; water within the zone of saturation
hydraulic head: the height of the free surface of a body of water above a given subsurface point; the sumof elevation, pressure, and velocity components at a given point in an aquifer
igneous rock: rock that solidified from a hot, liquid state
lithic: of stone lithostratigraphy: the arrangement of rocks in layers or strata; the branch of geology dealing with thestudy of the nature, distribution, and relations of the stratified rocks of the Earth’s crust
metamorphic rock: rock made by heating and pressurizing preexisting rocks
outcrop: the exposure of bedrock or strata projecting through the overlying cover of detritus and soil
permeability: the capacity of a porous material to transmit fluids. Permeability is a function of the sizes,shapes, and degree of connection among pore spaces, the viscosity of the fluid, and the pressure drivingthe fluid.
porosity: a description of the total volume of rock or soil not occupied by solid matter
recharge: (1) to replenish a waterbody or an aquifer with water; (2) the replacement of any water that may have flowed out or been pumped out of the aquifer
road cut: a hill, ridge, or mountain side excavated for a road right-of-way. Road cuts leave exposedstrata, rock, and soil that can be viewed in their natural state if not covered or vegetated.
sedimentary rock: a rock that consists chiefly either of small pieces of rock cemented together(sandstone) or of crystals that grew from water (rock salt, limestone)
sinkhole: a hole caused by collapse of the land surface, commonly because underlying limestonerock has dissolved away
water table: upper surface of the zone of saturation of groundwaterwell: a bored, drilled, or driven shaft or dug hole. Wells range from a few feet to more than 6 miles in
4-30
depth, but most water wells are between 100 and 2,000 feet in depth.
ADVANCE PREPARATION
A. Copy Student Sheet and collect materials.
B. The teacher may wish to put 8-10 small holes, using an ice pick, into one cup for each group.
PROCEDURE
I. Setting the stage
A. Discuss Background Information with students.
B. Put terms with definitions on the board.
C. Divide students into groups of 3-4. Distribute materials.
II. Activity
A. Construct a model of an aquifer.
1.Have students use gravel to construct subsoil aquifers in the plastic container. Cover the gravelwith sod on each side of the container to represent hills with a valley between. The valley is onlyto contain gravel to a height of about 2 cm.
2.Have one student in each group hold the cup with the holes over the model.
3.Then have another student pour 500 ml of water into the cup for a simulation of rain. Tell students to note how the water infiltrates the gravel to become groundwater. Also, have them note what happens to the water falling on the sod.
4.Have a third group member draw a line with a grease pencil at the water level in the container all the way around the container. Note: The pencil mark illustrates the water table. Explain that a pond is formed when the water table is higher than the land surface.
4-31
5.Have a student in each group insert the pump into one of the hills on the side of the valley, pushing the bottom down to the groundwater.
6.Allow students to press the pump several times after the water has begun to flow. Catch the water in the paper cup with no holes. Instruct students
to observe what is happening to the water table. Where did the water go? What is happening to the pond?
7.Discuss the concept of discharge. Discuss the effect of groundwater pumping on natural streams and lakes.
8.Have students answer these questions:
a. Where does groundwater come from? (snow, sleet, rain: precipitation) Water could move from a stream or lake to recharge a water table if
the table is below the stream level.
b. What would happen to a neighborhood if a well were drilled near a stream or pond and enough water pumped to lower the water table? (Some water from a stream or lake would be removed by the pump through the well. If enough water were removed, the stream or pond might go dry.)
B. Ask students to discover aquifer conductivity by doing the following:
1.Take samples of soil from various locations in the community.
2.Describe the samples’ grain size, color, and any other observed physical characteristics.
3.Place a standard volume in a coffee filter holder or other suitable container.
4.Pour a known volume of water through the different samples.
5.Measure the time it takes for the water to pass through the various soil samples and record.
6.Analyze the relationship between soil grain size and the rate of time it takes for the water to pass through the sample. Write a brief statement about this.
4-32
C. Have students identify a rock-type, geological formation and determine the possibility of an aquifer by doing the following:
1. Stop at a road cut and pick up a rock that is indicative of the area.
2. Determine the location of the sample site on a road map.
3. Locate a geologic map of the area and determine the formations in the area.
4. Determine whether the rock is of metamorphic, igneous, or sedimentary origin.
5. While at the outcrop, look for groundwater seeps.
6. Draw a sketch of the outcrop.
7.Analyze the rock and the formation. Determine if it is an aquifer.
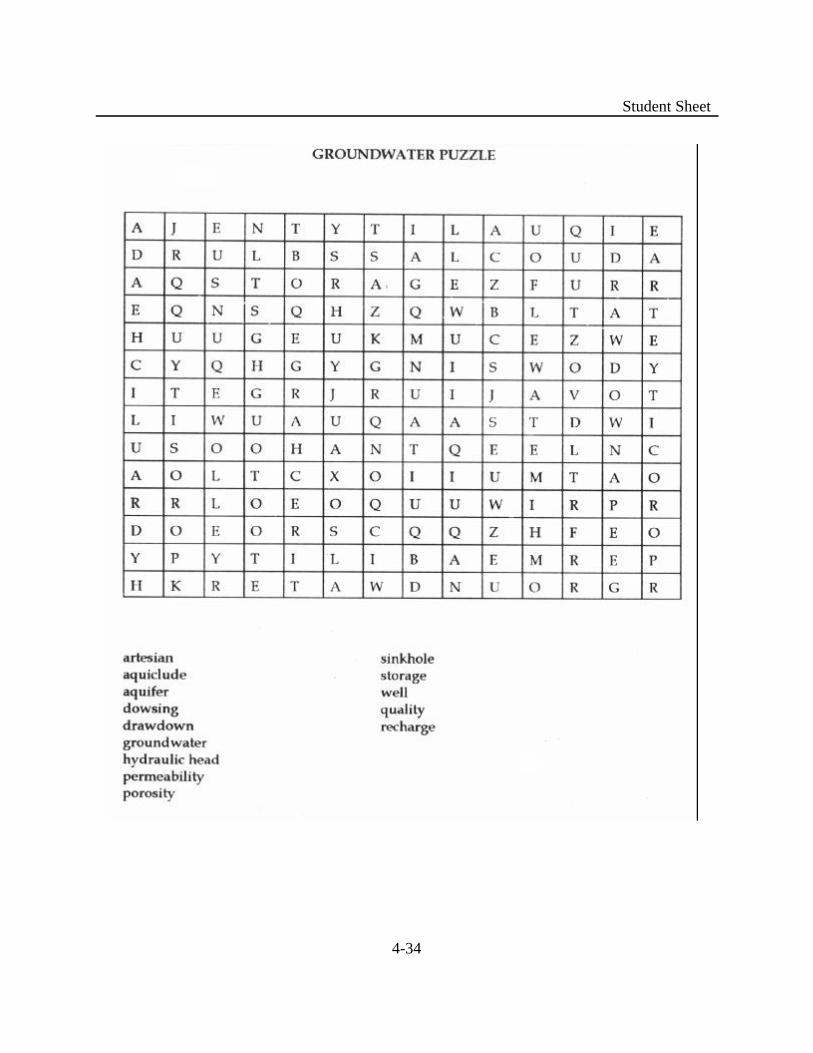
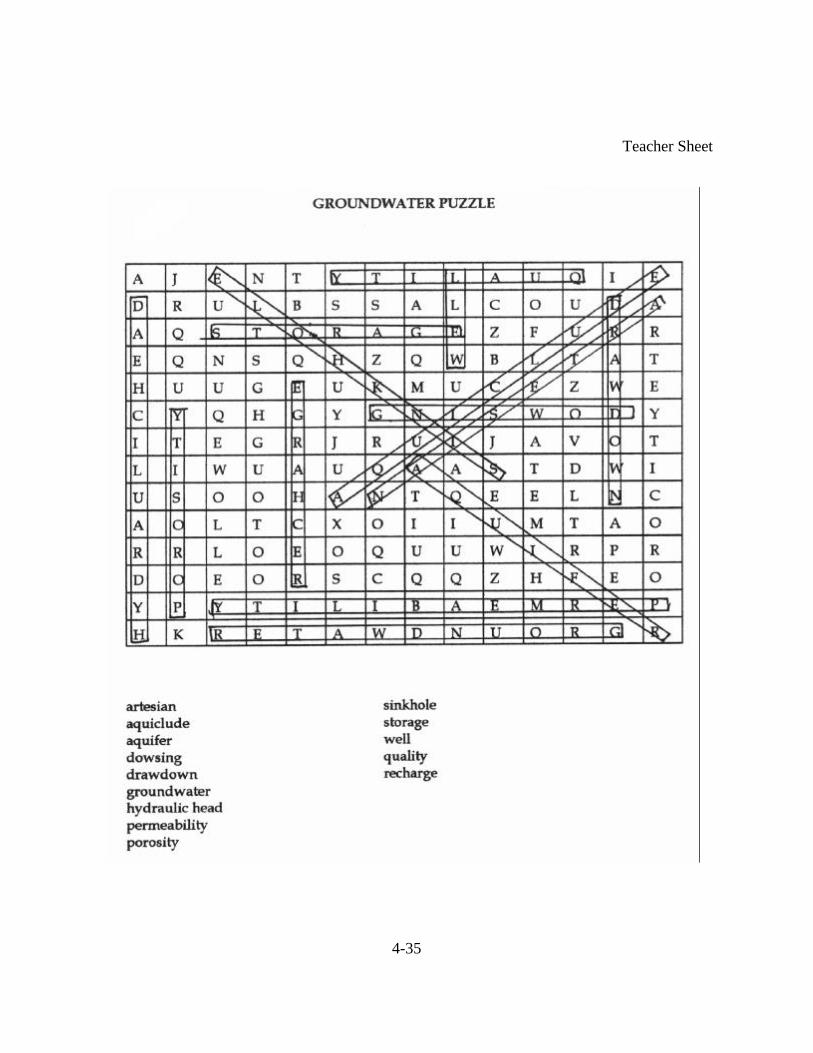
D. Pass out the puzzles and post or pass out the word list.
III. Extensions
A. Have students research different types of aquifers in different regions of the country and present findings to the class.
B. The Student Sheet Puzzle could be timed or done as a contest and a quiz given with the terms used in it.
C. Students could do library research on their local aquifer. The results of this research could be turned in as research papers, presented to the class, or presented in other places, such as a local meeting of conservation or environmental group or a city council.
4-33
RESOURCES
College or university libraries and Geology departments can also be very helpful. Many informativebrochures about groundwater have been published by a variety of entities.
The environmental agency in each state. (See list in back of guide.)
The Geological Survey in each state. (See list in back of guide.)
The U. S. Geological Survey.
4-34
Student Sheet
4-35
Teacher Sheet

4-36
4-37
SUBJECTS:Science (Physical Science, Ecology,Earth Science), Social Studies(Geography)
TIME:2 class periods
MATERIALS:3-liter soda bottlesaquarium gravelsand (coarse)pump from a liquid dispenserblue, yellow, & red food coloringpaper cupsstrawsstudent sheetsdroppersscissors or razor bladesmarkers
DO YOU DRINK IT?9-12
OBJECTIVES
The student will do the following:
1. Create an aquifer model.
2. Locate major U.S. aquifers.
3. Explain how a well works.
4. Examine a well’s relationship to the water table.
5. Apply principles of well placement.
6. Explain different ways that ground is contaminated.
BACKGROUND INFORMATION
An aquifer is an underground layer of rock or soil thatholds the water called groundwater. The word “aquifer” is derived from the Latin “aqua” meaning “water,”and “ferre” meaning “to bring” or “to yield.” The ability of a geological formation to yield water dependson two factors - porosity and permeability. Porosity is determined by how much water the soil or rock canhold in the spaces between its particles. Permeability means how interconnected the spaces are so thatwater can flow freely between them.
There are two types of aquifers. One is a confined aquifer, in which a water supply is sandwiched betweentwo impermeable layers. These are sometimes called artesian aquifers because, when a well is drilled intothis layer, the pressure may be so great that water will spurt to the surface without being pumped. This isan artesian well. The other type of aquifer is the unconfined aquifer, which has an impermeable layer underit but not above it. It is the most common type.
Aquifers may be categorized according to the kind of material of which they are made. A consolidatedaquifer is composed of a porous or fractured rock formation. Most unconsolidated aquifers are composedof buried layers of sandy, gravelly, or soil-like material.
4-38
The top surface of the groundwater is called the water table. The water table depth varies from area toarea and fluctuates due to seasonal changes and varying amounts of precipitation. Excessive pumping fromthe aquifer (wells) can also lower the water table.
Perhaps the largest aquifer in the world is the Ogallala aquifer located in the midwestern United States.This aquifer is named after a Sioux Indian tribe. It is estimated to be more than two million years old andto hold about 650 trillion gallons (2,500 trillion liters)! It underlies parts of eight states, stretching about 800miles (1,288 km) from South Dakota to Texas. The Ogallala aquifer supplies vast amounts of water toirrigate the crops in this vitally important agricultural area.
Not only is groundwater used to irrigate crops, but it is also used for drinking water. About half of the U.S.population gets its drinking water from groundwater. Wells reach into the water table and bring water tothe surface by being pumped by hand, windmill, or motor-driven devices. In ancient days, these wells weredug by hand and lined with stones or bricks to prevent the sides from collapsing. Today, most are formedby drilling a 2-4 inch (5-10 cm) hole and lining it with metal or plastic piping.
The biggest problem facing well water is contamination. Sources of groundwater pollution are leakingunderground storage tanks, leaking septic tanks or septic tanks with inadequate drainfields, landfill seepage,animal waste, fertilizer, pesticides, industrial waste, road salt, and some natural contaminants. Another bigproblem causing groundwater contamination is abandoned wells that are not properly closed. These leavedirect channels for contaminants to enter the aquifers. Some wells are even used to inject waste materialsinto the ground. When a groundwater source is contaminated, it is very difficult and expensive to clean up.The best way to protect well water is to prevent contamination from occurring.
Another type of well is an underground injection well. This type of well is used as a means of wastewaterdisposal, aquifer recharge, or solution mining of an economically significant mineral from a geologicformation. The most prevalent use of underground injection, however, is for wastewater disposal.
Underground injection wells have even been classified into categories by the U.S. EPA. They are asfollows:
Class I Municipal and hazardous/non-hazardous industrial wasteClass II Oil and gas field wastes and enhanced recovery injectionClass III Solution miningClass IV Shallow hazardous waste disposal (banned)Class V All other types of injection (floor drains, storm drains, etc.)
4-39
In most states, Class I hazardous and IV wells are prohibited. All states that have oil and natural gasproduction have Class II wells. Class III, or mining wells, inject water to solution mine a desired mineral(as salt). Injection wells not fitting any of these categories are Class V wells. Septic systems serving 20or more people a day and floor drains found at service stations and car washes are examples of Class Vwells. Note: Two background information charts (A&B) should be supplied with this background narrative.
Subsurface disposal by wells depends on the capacity of the geologic formation to attenuate wastes thatare properly injected into it.
Terms
aquifer: porous, water-bearing layer of sand, gravel, and rock below the Earth’s surface; reservoirfor groundwater
aquifer recharge: the addition of water by any means to an aquifer
artesian aquifer: an aquifer that is sandwiched between two layers of impermeable materials and isunder great pressure, forcing the water to rise without pumping. Springs often surface from artesianaquifers.
attenuation: dilution or lessening in severity
confined aquifer: an artesian aquifer
groundwater: water that infiltrates into the Earth and is stored in usable amounts in the soil and rock belowthe Earth’s surface; water within the zone of saturation
impermeable (substance): a substance through which other substances are unable to pass
solution mining: a type of mining wherein water is injected into a well to remove a desired mineral
unconfined aquifer: an aquifer containing unpressurized groundwater, having an impermeablelayer below but not above it
underground injection well: a type of well used for wastewater disposal, aquifer recharge, orsolutionmining of minerals
water table: upper surface of the zone of saturation of groundwater
4-40
ADVANCE PREPARATION
A. Collect materials for activities.
1.Each student can be asked to bring one 3-liter bottle and a pump from a liquid dispenser, or eachgroup may prepare a group water pump model.
2.Fill three dropper bottles with water. Tint the water in each with a different color of food coloring.Set aside.
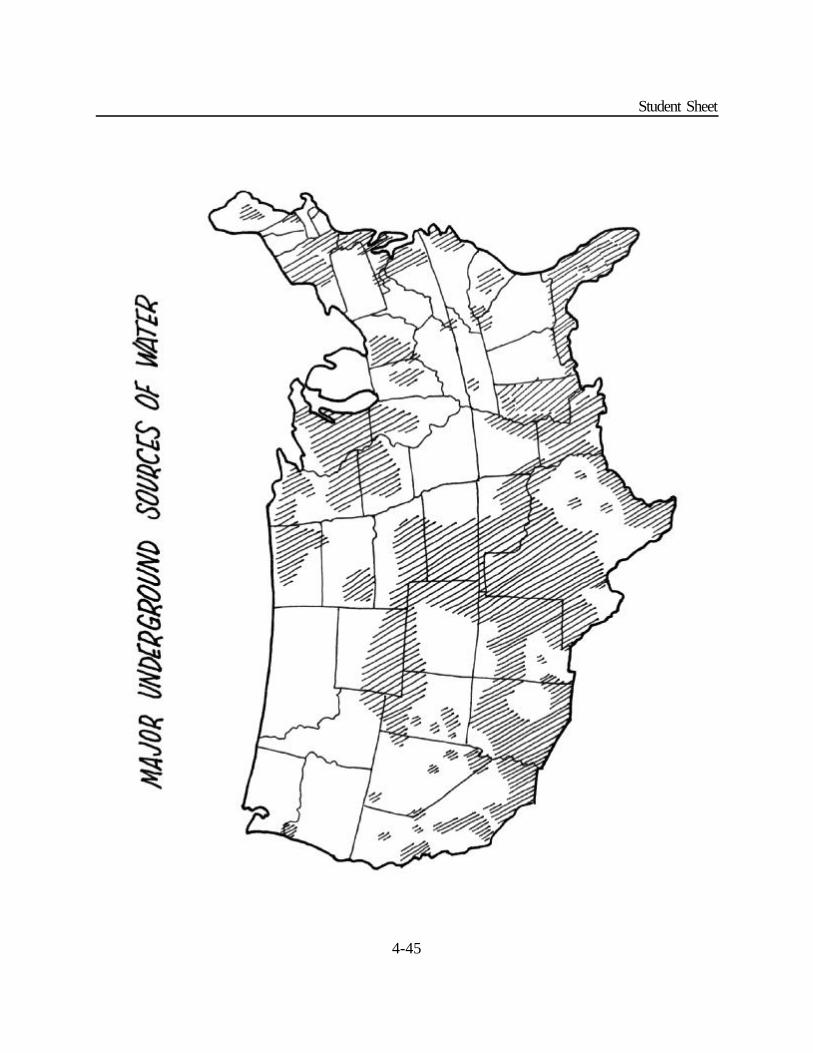
B. Make a transparency of U.S. Aquifer Map. Make enough copies for students.
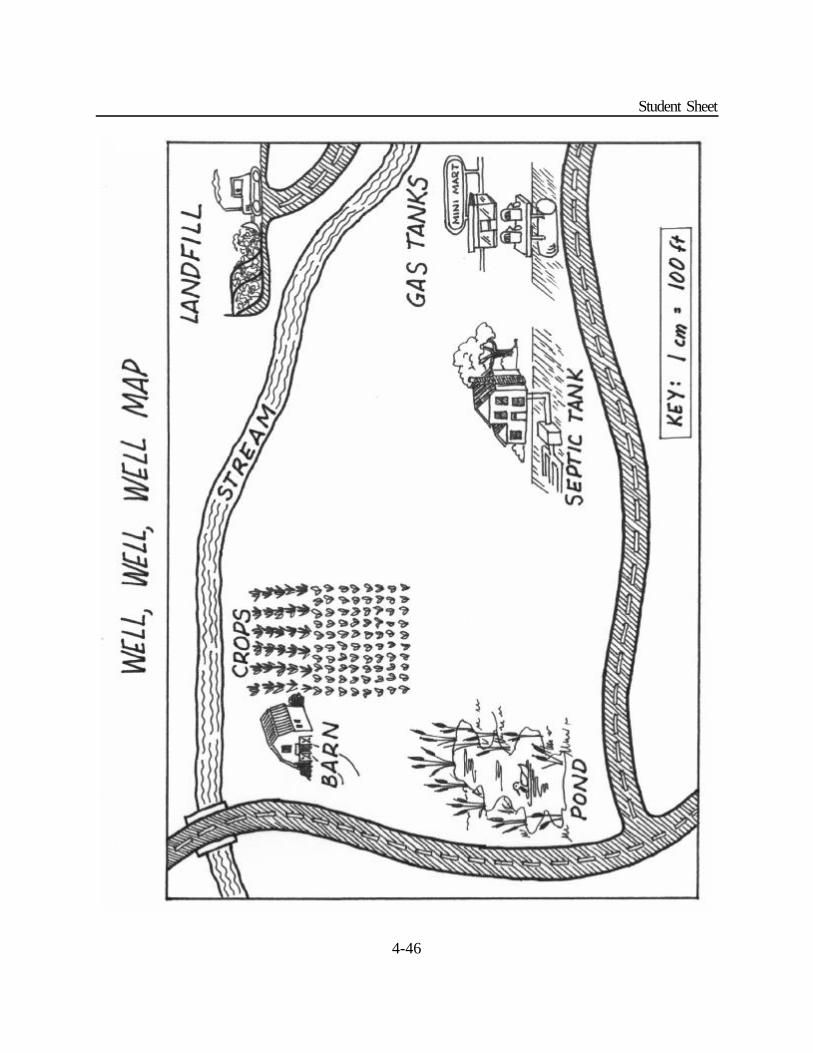
C. Make a transparency of Well, Well, Well Map. Make enough copies for students.
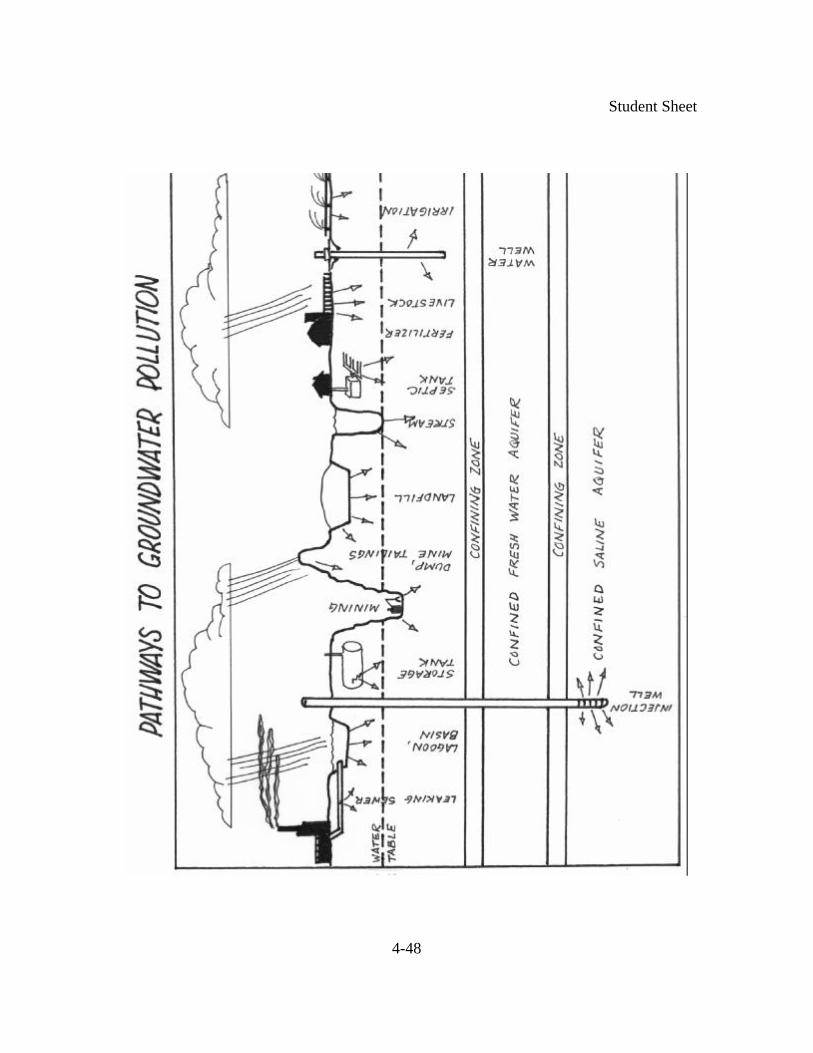
D. Make copies of Background Information and sheets on Pathways To Groundwater Pollution forstudents.
E. Make a transparency of Model Example Sheet.
PROCEDURE
I. Setting the stage
A. Pass out Aquifer Map, Well, Well, Well Map, Background Information, and Pathwaysto Groundwater Pollution sheets.
B. Divide students into working groups of 3, 4, or 5.
C. Ask students to read Background Information, look at Pathways to Groundwater Pollution sheets, and discuss information in their groups.
D. Put terms on the board and have students copy on the Background Information sheet.
II. Activity
A. Show the students the transparency of the U.S. Aquifer Map.
1.Explain that the crosshatching on this map marks the places in the continental U.S. where abundant fresh water is available from aquifers. In these areas,
4-41
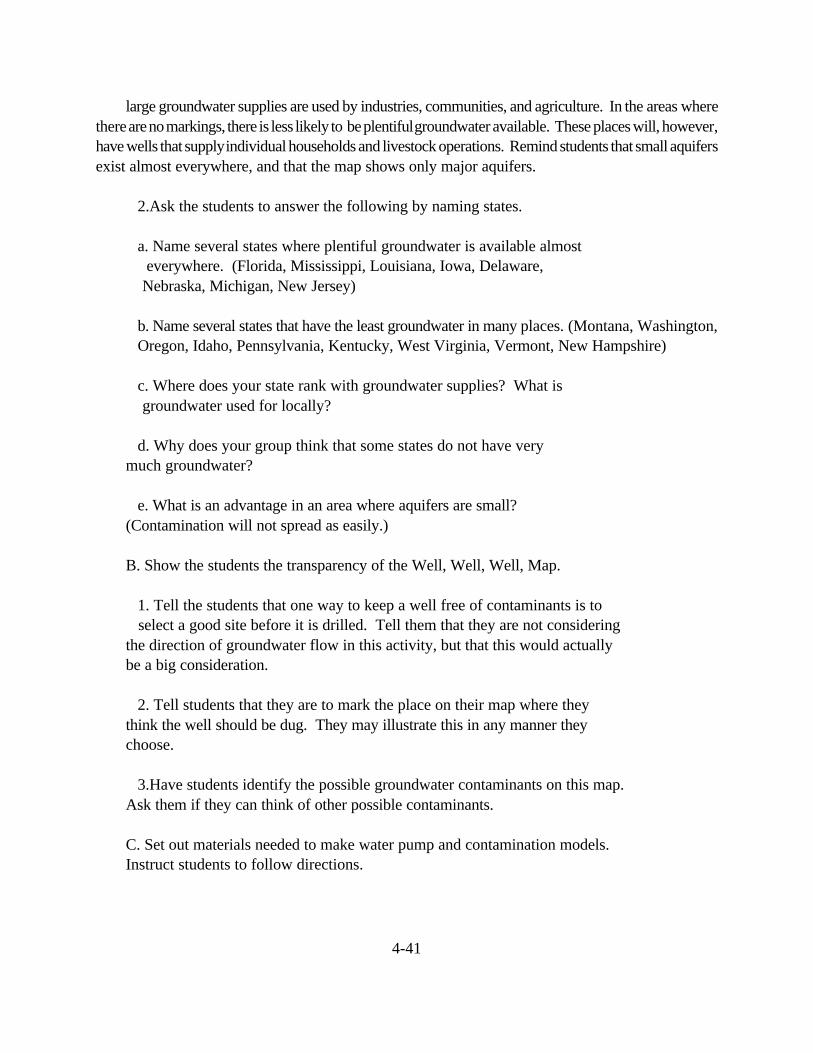
large groundwater supplies are used by industries, communities, and agriculture. In the areas wherethere are no markings, there is less likely to be plentiful groundwater available. These places will, however,have wells that supply individual households and livestock operations. Remind students that small aquifersexist almost everywhere, and that the map shows only major aquifers.
2.Ask the students to answer the following by naming states.
a. Name several states where plentiful groundwater is available almost everywhere. (Florida, Mississippi, Louisiana, Iowa, Delaware, Nebraska, Michigan, New Jersey)
b. Name several states that have the least groundwater in many places. (Montana, Washington,Oregon, Idaho, Pennsylvania, Kentucky, West Virginia, Vermont, New Hampshire)
c. Where does your state rank with groundwater supplies? What is groundwater used for locally?
d. Why does your group think that some states do not have very much groundwater?
e. What is an advantage in an area where aquifers are small? (Contamination will not spread as easily.)
B. Show the students the transparency of the Well, Well, Well, Map.
1. Tell the students that one way to keep a well free of contaminants is to select a good site before it is drilled. Tell them that they are not considering the direction of groundwater flow in this activity, but that this would actually be a big consideration.
2. Tell students that they are to mark the place on their map where they think the well should be dug. They may illustrate this in any manner they choose.
3.Have students identify the possible groundwater contaminants on this map. Ask them if they can think of other possible contaminants.
C. Set out materials needed to make water pump and contamination models. Instruct students to follow directions.
4-42
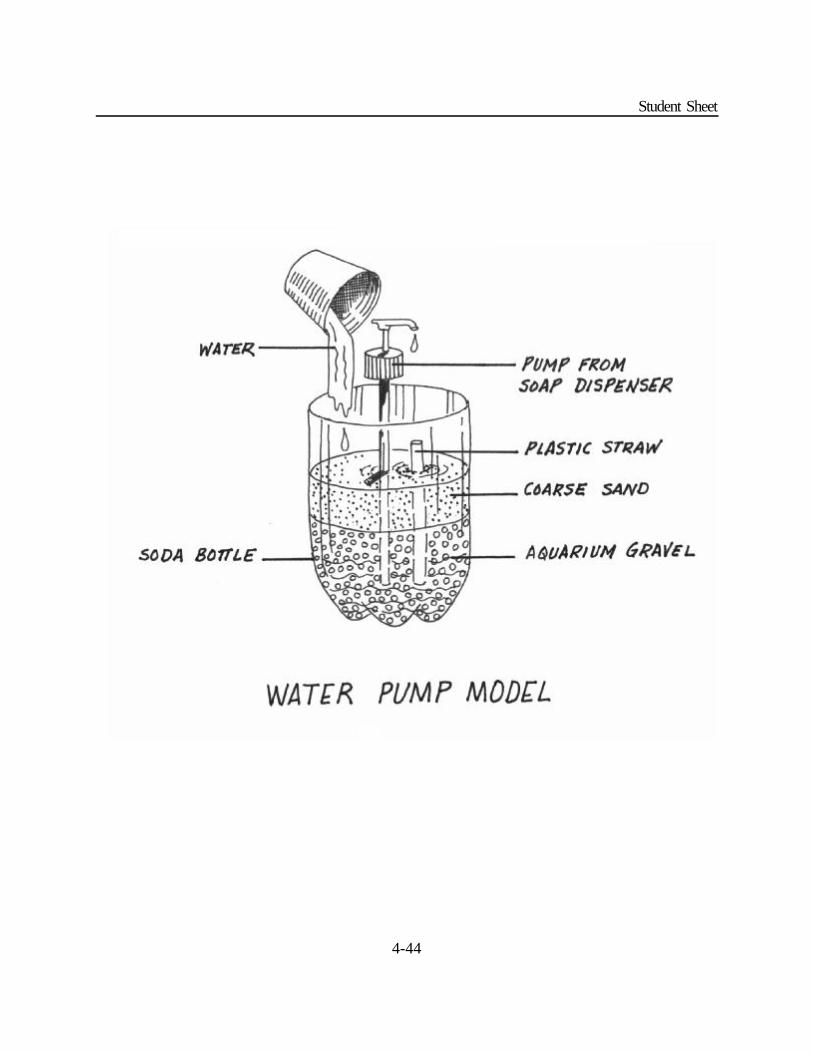
1.Using the 3-liter bottle, cut off about ½ the top. Remove the black bottom and fill the remaining clear portion with approximately 2 inches (2.5 to 3.7 cm) of gravel and then 2 inches of sand. (Use transparency of model.)
2. Pour in 2 to 3 inches (5 to 7.5 cm) of water colored blue with food coloring and mark the location of the water table with a black or blue marker.
3. Place the pump into the gravel with the tube extending into the water.
4. Pump water out of the model, catching the water in the cup.
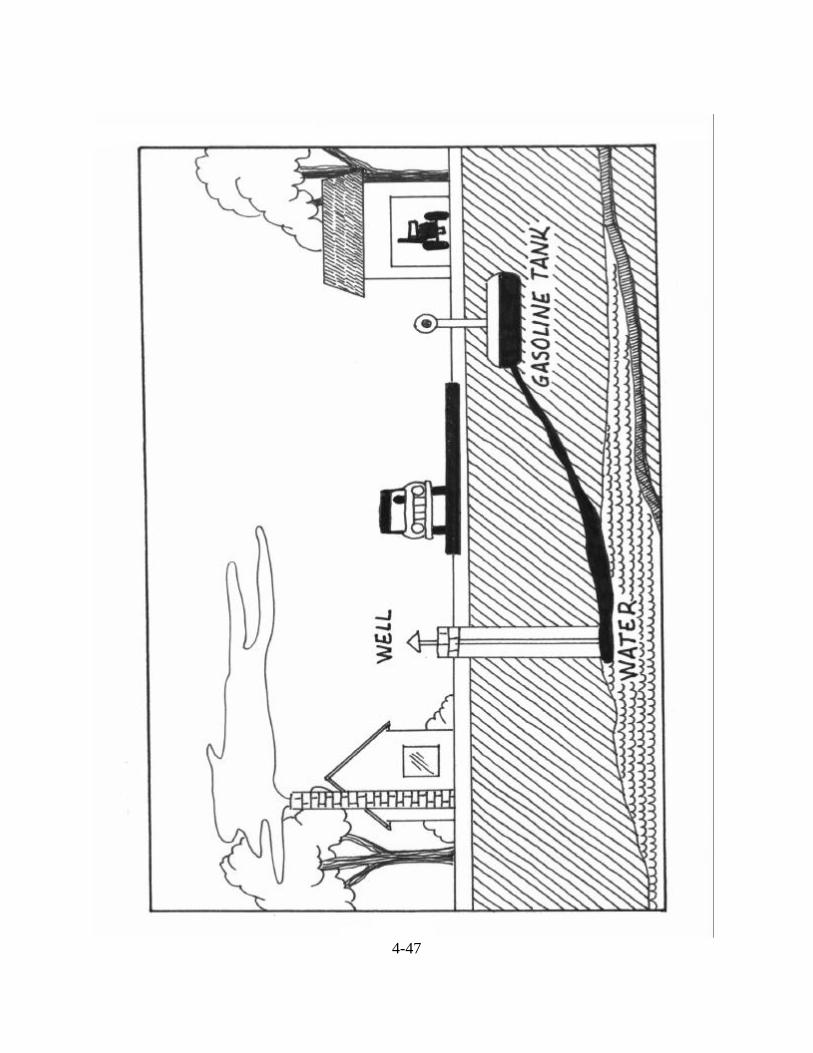
5. Discuss how contaminants like agricultural waste, sewage, road salt, and other surface contaminants can get into the groundwater. Demonstrate this by using the yellow food coloring on the surface of the sand and “rain” on your model. Pump more water out of the well. Observe results.
6.Place a straw into your model to represent an abandoned well. It should reach the same depth as your pumping well. Pour a contaminant (red
food coloring) into abandoned well. Pump more water out of the pumping well. Compare this means of contamination with the surface contamination.
III. Follow-up
A. Have students list at least four possible sources of groundwater contamination.
B. Have students demonstrate knowledge of vocabulary by using the terms correctly in an explanation of groundwater, wells, and groundwater contamination.
C. Students should try simulating other types of contamination (leaking underground storage tanks) with their model.
D. Using the Background Information on underground injection wells, answer the following.
1. Some states, such as Florida, use injection wells to recharge valuable aquifers used for drinkingwater. List the pluses and minuses of this practice as it relates to environment and public health.What Class well would this be? Why?
4-43
2. Class II wells are used to re-inject salt water or liquid waste from oil and gas production. They are also used for further recovery of oil when reservoirs are depressurized but
recoverable product remains. What is this called? How does it work?
IV. Extensions
A. Have students contact their local health department to obtain guidelines on digging new wells.
B. Share with students the following information about dowsing or “water witching” and divining rods.Some people will not have a well drilled without calling a water “witch”or “dowser” to locate thegroundwater. Water witches or dowsers have been around for thousands of years. They usemetal or wooden sticks (“divining rods”) to locate places where wells should be drilled. Some evenpredict the depth of the water table. Dowsers are not always successful in their efforts, but manypeople believe in their special ability to find water. Ask students to research the local use andefficacy of dowsing.
C. Write the American Groundwater Trust (6375 Riverside Drive, Dublin, Ohio 43017)for more information about wells and groundwater protection.
RESOURCES
Banks, M., British Calendar Customs, Volume 1, William Glaisher, Ltd., London, 1937.
Branley, F.M., Water for the World, T. Y. Crowell, New York, 1982.
“Groundwater Pollution Control,” American Groundwater Trust, Dublin, Ohio, 1990.
“Ground Water: Issues and Answers,” American Institute of Professional Geologists, Arvada, Colorado, 1984.
Grades 3-5 Water Sourcebook.
U.S. Department of the Interior, Water Dowsing, 1993, p. 15.
4-44
Student Sheet
4-45
Student Sheet
4-46
Student Sheet
4-47
4-48
Student Sheet
4-49
Student Sheet

4-50

4-51
SUBJECTS:Science (Physical Science,Physics), Math
TIME:1 class period
MATERIALS:copies of student sheets andbackground information
S9-12HYDRAULIC HEAD
OBJECTIVES
The student will do the following:
1. Apply knowledge of the controlling variables for groundwater flow.
2. Demonstrate groundwater flow direction based on hydraulic head observations.
BACKGROUND INFORMATION
The water in the ground (groundwater) fills pore spaces in the subsurface rocks and sediments. The waterin the lower part of the zone of porosity fills all the pore spaces and creates a saturated material (Figure 1).
The groundwater is stored or flows through the pore spaces and is acted on by three outside forces. Theseforces are: (taken from Fetter, 1988)
1. gravity- that which pulls water downward.
4-52
2. external pressure- a combination of atmospheric pressure and the weight of over lying sediments andwater.
3. molecular attraction- that which causes water to adhere to other surfaces and to itself.
When it hits the ground, rain will be drawn by gravity downward through the soil zone to a zone saturatedby water. The external pressure on the saturated zone creates a pressure (fluid pressure) in the saturatedzone. At this depth, the fluid pressure is greater than the external pressure. However, as the top of thesaturated zone is approached, the fluid pressure decreases until at some depth the pressure of the fluid inthe pores is equal to atmospheric pressure. This surface, where fluid pressure is equal to atmosphericpressure, is called the water table and defines the top of an unconfined aquifer.
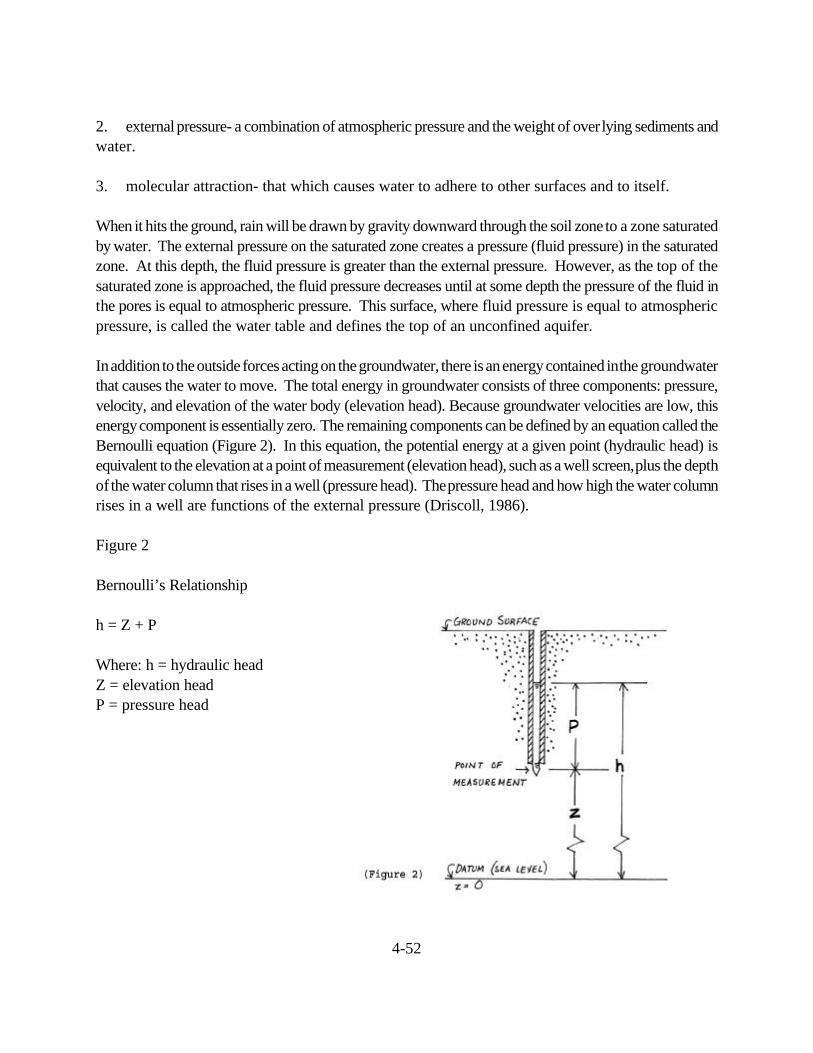
In addition to the outside forces acting on the groundwater, there is an energy contained in the groundwaterthat causes the water to move. The total energy in groundwater consists of three components: pressure,velocity, and elevation of the water body (elevation head). Because groundwater velocities are low, thisenergy component is essentially zero. The remaining components can be defined by an equation called theBernoulli equation (Figure 2). In this equation, the potential energy at a given point (hydraulic head) isequivalent to the elevation at a point of measurement (elevation head), such as a well screen, plus the depthof the water column that rises in a well (pressure head). The pressure head and how high the water columnrises in a well are functions of the external pressure (Driscoll, 1986).
Figure 2
Bernoulli’s Relationship
h = Z + P
Where: h = hydraulic headZ = elevation headP = pressure head
4-53
In a water table or unconfined aquifer, the top of the saturated zone is at atmospheric pressure, which isconstant across a site. Because the pressure head is constant across the site, this component is generallynot taken into consideration when calculating the energy to drive groundwater to a point of discharge.Therefore, the height of the water column, z, represents the actual energy available to drive water throughaquifer materials to a point of discharge like a well or spring (Driscoll, 1986).
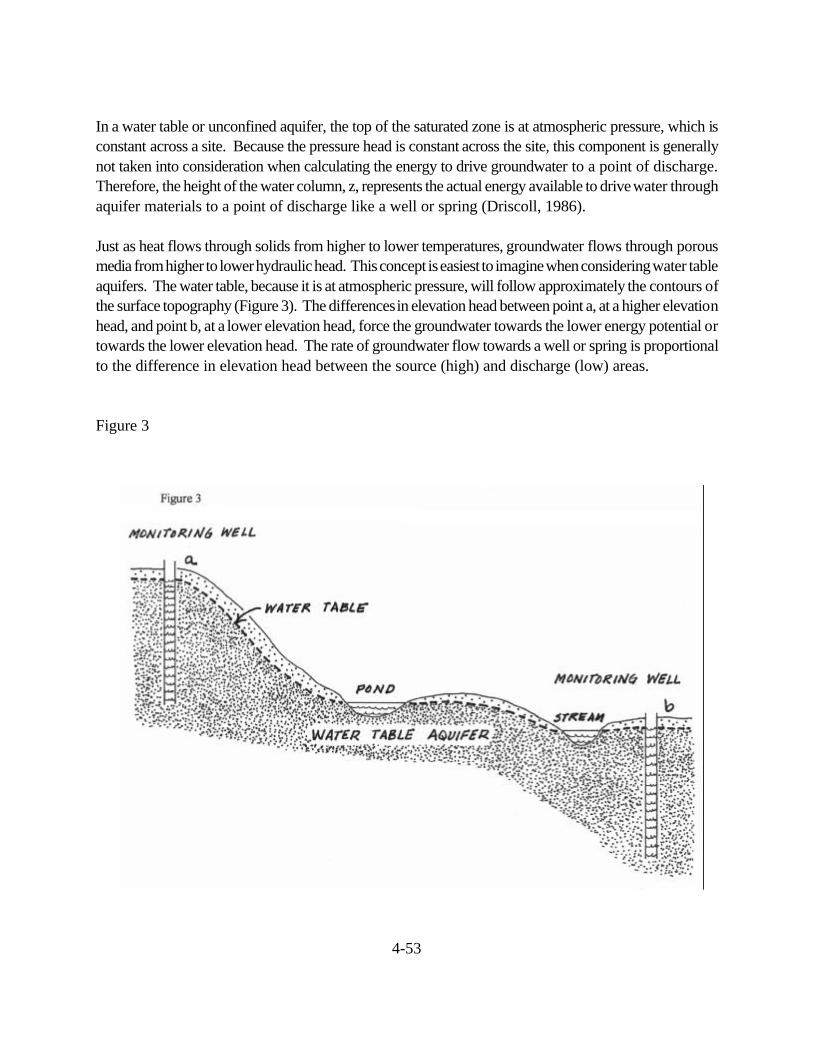
Just as heat flows through solids from higher to lower temperatures, groundwater flows through porousmedia from higher to lower hydraulic head. This concept is easiest to imagine when considering water tableaquifers. The water table, because it is at atmospheric pressure, will follow approximately the contours ofthe surface topography (Figure 3). The differences in elevation head between point a, at a higher elevationhead, and point b, at a lower elevation head, force the groundwater towards the lower energy potential ortowards the lower elevation head. The rate of groundwater flow towards a well or spring is proportionalto the difference in elevation head between the source (high) and discharge (low) areas.
Figure 3
4-54
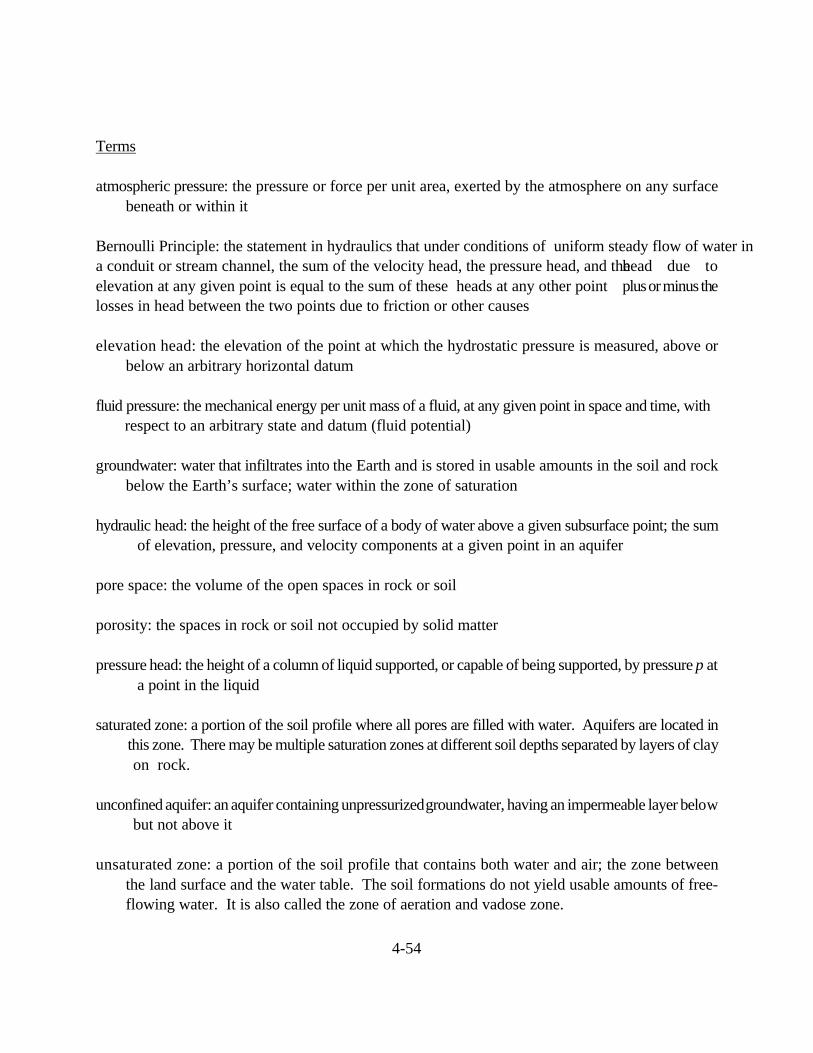
Terms
atmospheric pressure: the pressure or force per unit area, exerted by the atmosphere on any surfacebeneath or within it
Bernoulli Principle: the statement in hydraulics that under conditions of uniform steady flow of water in a conduit or stream channel, the sum of the velocity head, the pressure head, and the head due toelevation at any given point is equal to the sum of these heads at any other point plus or minus thelosses in head between the two points due to friction or other causes
elevation head: the elevation of the point at which the hydrostatic pressure is measured, above orbelow an arbitrary horizontal datum
fluid pressure: the mechanical energy per unit mass of a fluid, at any given point in space and time, with respect to an arbitrary state and datum (fluid potential)
groundwater: water that infiltrates into the Earth and is stored in usable amounts in the soil and rockbelow the Earth’s surface; water within the zone of saturation
hydraulic head: the height of the free surface of a body of water above a given subsurface point; the sum of elevation, pressure, and velocity components at a given point in an aquifer
pore space: the volume of the open spaces in rock or soil
porosity: the spaces in rock or soil not occupied by solid matter
pressure head: the height of a column of liquid supported, or capable of being supported, by pressure p at a point in the liquid
saturated zone: a portion of the soil profile where all pores are filled with water. Aquifers are located in this zone. There may be multiple saturation zones at different soil depths separated by layers of clay on rock.
unconfined aquifer: an aquifer containing unpressurized groundwater, having an impermeable layer below but not above it
unsaturated zone: a portion of the soil profile that contains both water and air; the zone betweenthe land surface and the water table. The soil formations do not yield usable amounts of free-flowing water. It is also called the zone of aeration and vadose zone.
4-55
water table: upper surface of the zone of saturation of groundwater
ADVANCE PREPARATION
A. Copy Background Information and Student Sheets for students.
B. Copy or put on board terms and definitions for students.
C. Enlarge and make transparencies of Figures 1-3 in Background Information.
PROCEDURE
I. Setting the stage
A. Discuss Background Information using transparencies.
B. Review vocabulary.
II. Activity
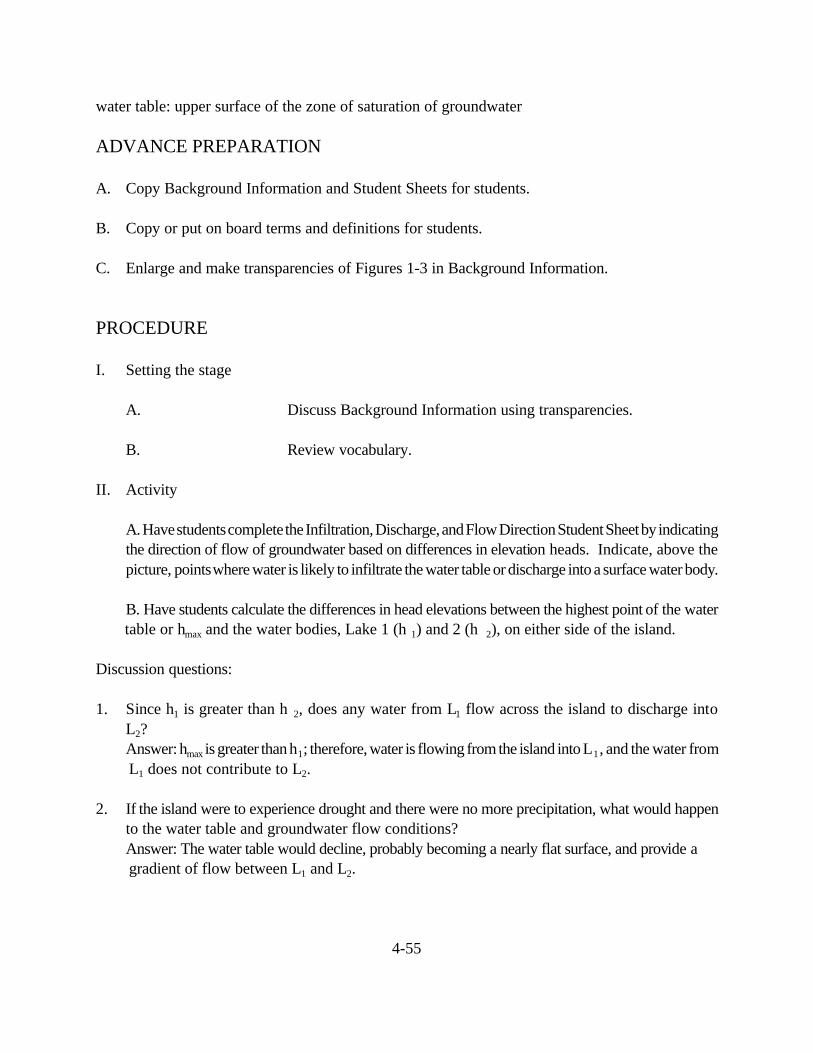
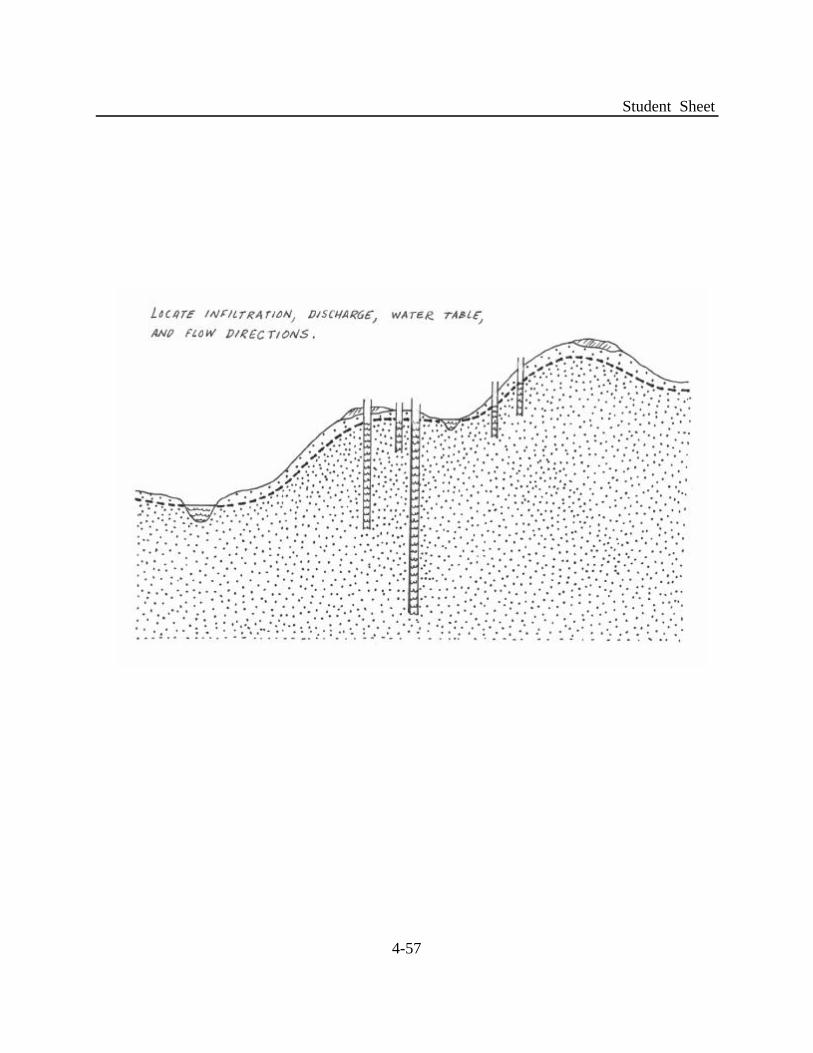
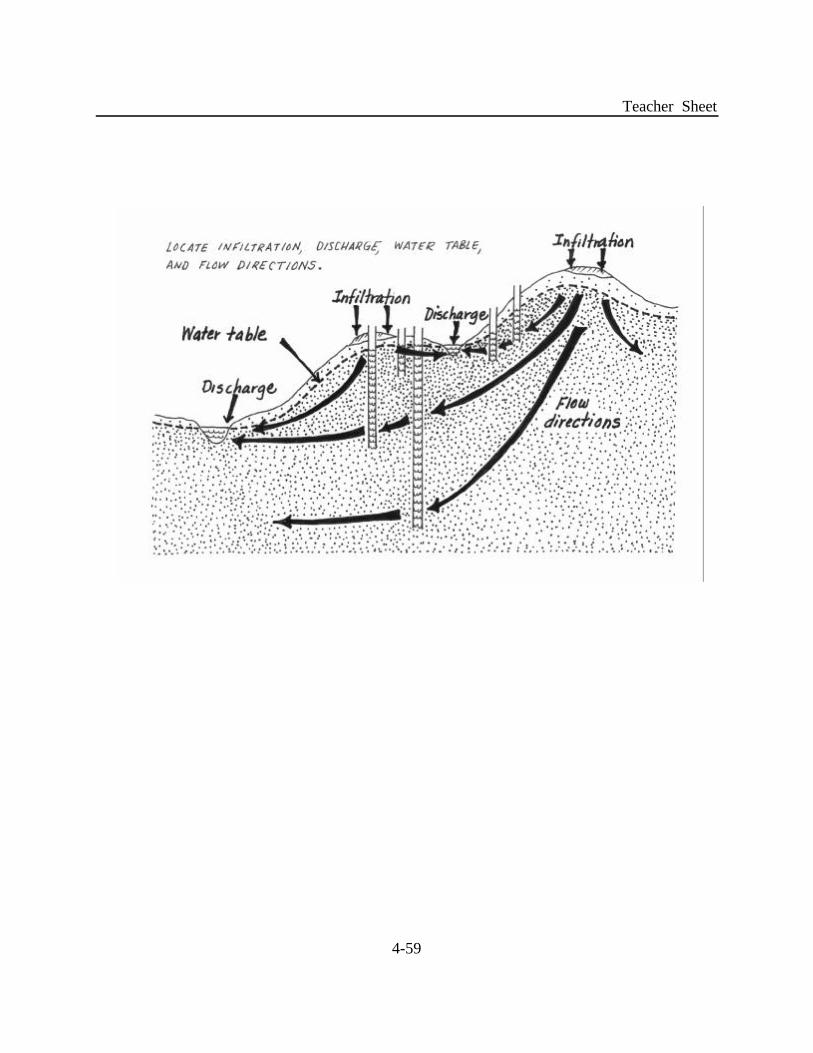
A. Have students complete the Infiltration, Discharge, and Flow Direction Student Sheet by indicatingthe direction of flow of groundwater based on differences in elevation heads. Indicate, above thepicture, points where water is likely to infiltrate the water table or discharge into a surface water body.
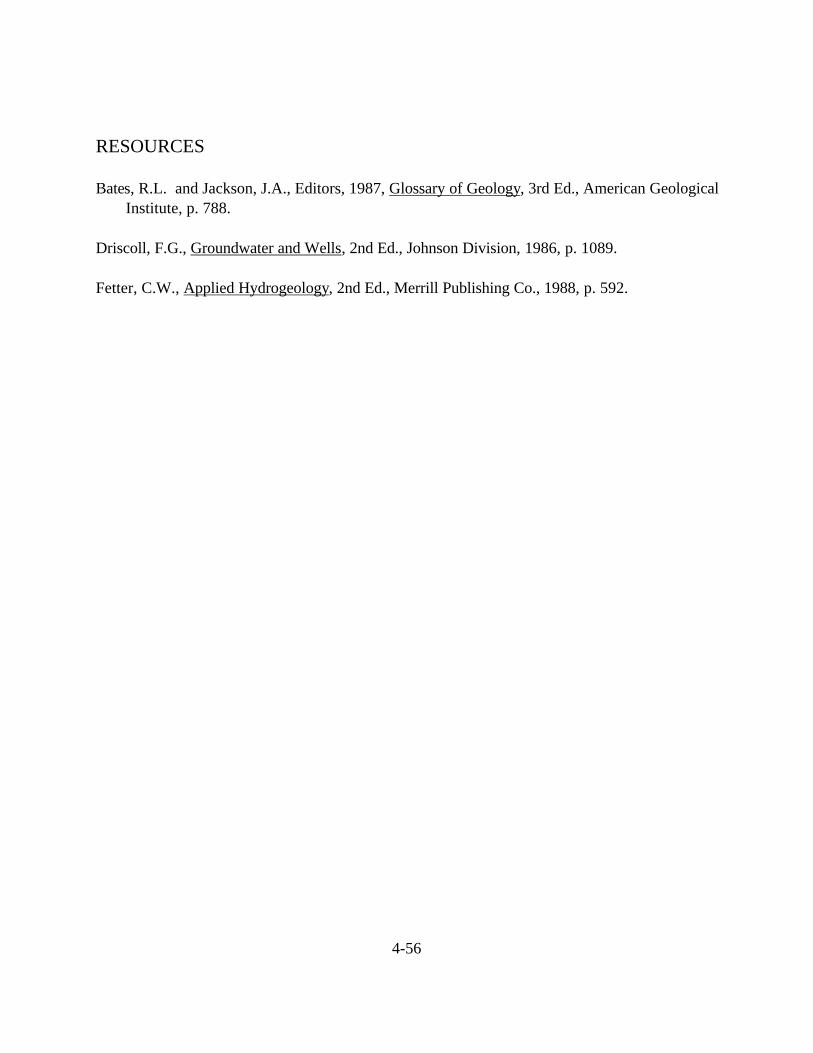
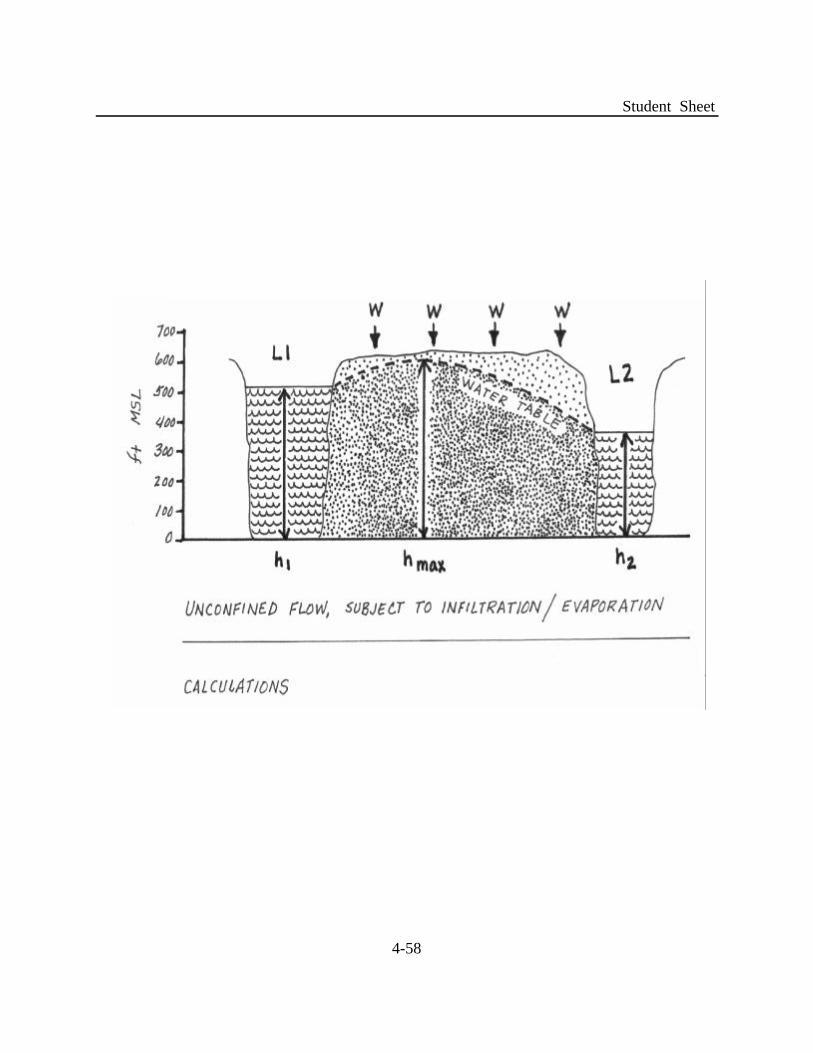
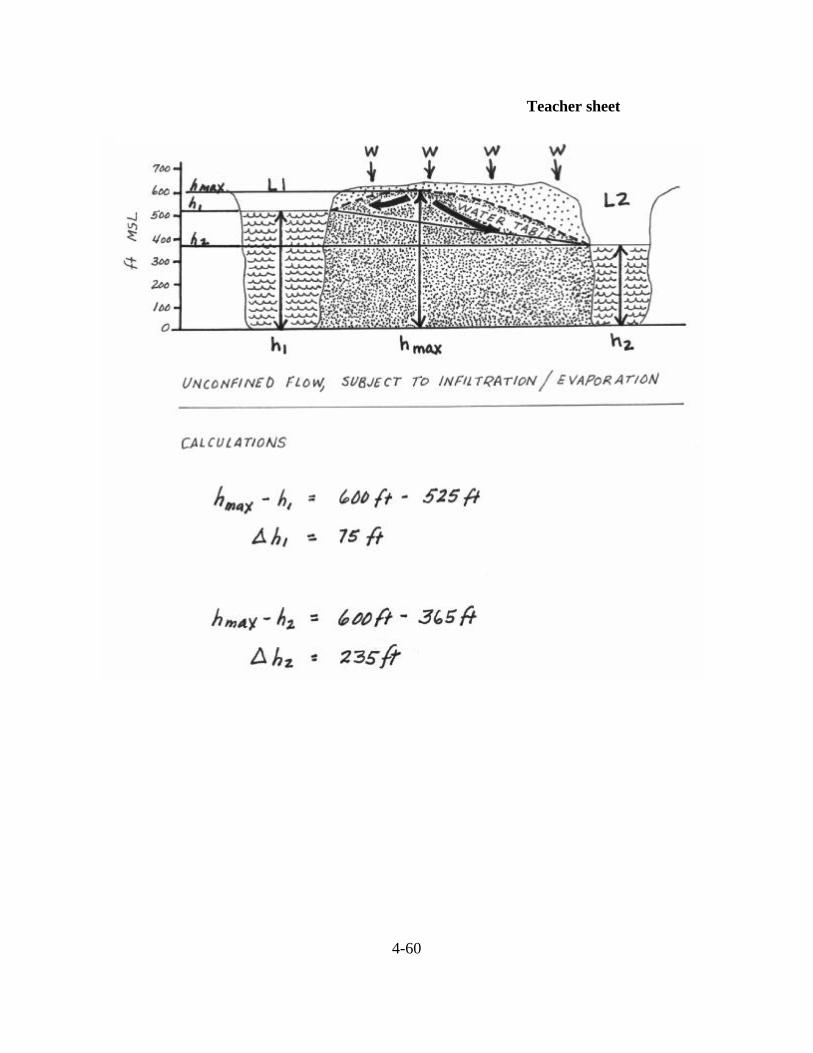
B. Have students calculate the differences in head elevations between the highest point of the water table or h and the water bodies, Lake 1 (h ) and 2 (h ), on either side of the island.max 1 2
Discussion questions:
1. Since h is greater than h , does any water from L flow across the island to discharge into1 2 1
L ?2
Answer: h is greater than h ; therefore, water is flowing from the island into L , and the water frommax 1 1
L does not contribute to L .1 2
2. If the island were to experience drought and there were no more precipitation, what would happento the water table and groundwater flow conditions?Answer: The water table would decline, probably becoming a nearly flat surface, and provide a
gradient of flow between L and L .1 2
4-56
RESOURCES
Bates, R.L. and Jackson, J.A., Editors, 1987, Glossary of Geology, 3rd Ed., American GeologicalInstitute, p. 788.
Driscoll, F.G., Groundwater and Wells, 2nd Ed., Johnson Division, 1986, p. 1089.
Fetter, C.W., Applied Hydrogeology, 2nd Ed., Merrill Publishing Co., 1988, p. 592.
4-57
Student Sheet
4-58
Student Sheet
4-59
Teacher Sheet
4-60
Teacher sheet
4-61
SUBJECTS:Science (PhysicalScience), Social Studies(Economics, PoliticalScience)
TIME:1 class period
MATERIALS:copies of background
informationstudent sheets
FLOW NETS9-12
OBJECTIVES
The student will do the following:
1. Determine the directions of groundwater flow using flow nets.
2. Apply the concept of pressure head and groundwater flowconditions to solve several logistical problems.
BACKGROUND INFORMATION
Flow nets provide a general knowledge of the regional groundwaterflow patterns that the hydrologist can use to determine suchinformation as areas of recharge and discharge. Freeze andCherry (1979, pg. 168) have stated that flow nets are an important concept of hydrology. They state, “Theproper construction of flow nets is one of the most powerful analytical tools used by the hydrologist toanalyze groundwater flow.”
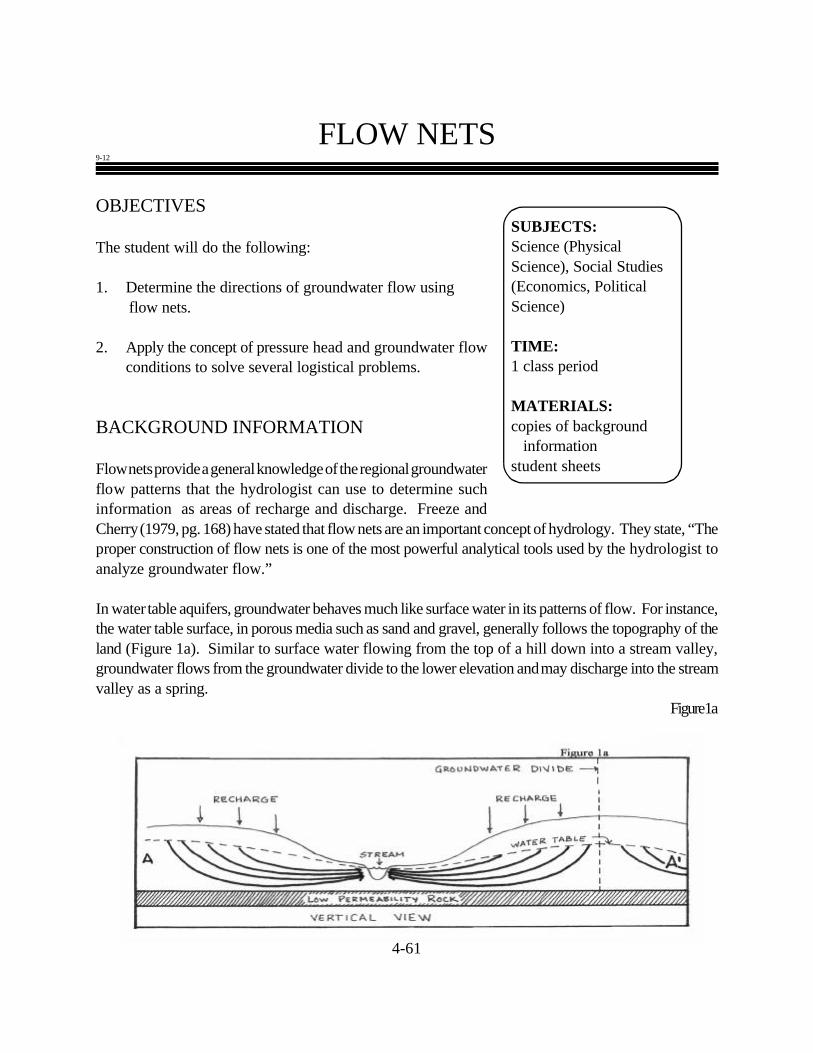
In water table aquifers, groundwater behaves much like surface water in its patterns of flow. For instance,the water table surface, in porous media such as sand and gravel, generally follows the topography of theland (Figure 1a). Similar to surface water flowing from the top of a hill down into a stream valley,groundwater flows from the groundwater divide to the lower elevation and may discharge into the streamvalley as a spring.
Figure 1a
4-62
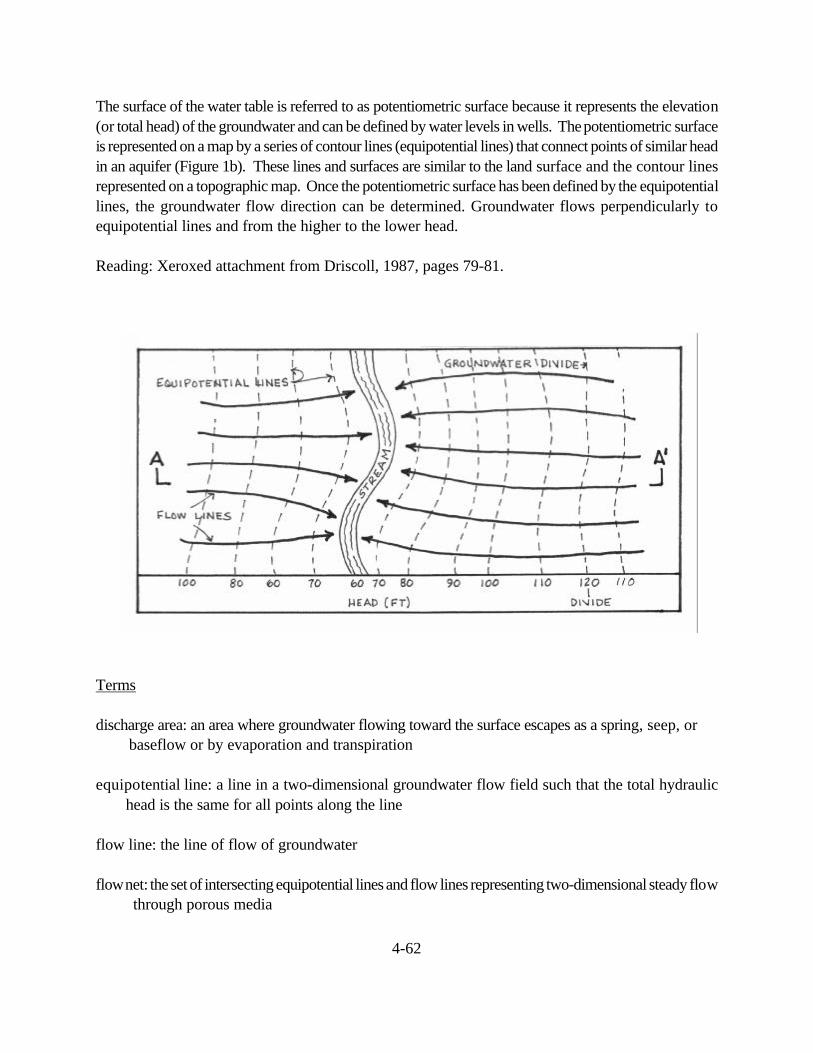
The surface of the water table is referred to as potentiometric surface because it represents the elevation(or total head) of the groundwater and can be defined by water levels in wells. The potentiometric surfaceis represented on a map by a series of contour lines (equipotential lines) that connect points of similar headin an aquifer (Figure 1b). These lines and surfaces are similar to the land surface and the contour linesrepresented on a topographic map. Once the potentiometric surface has been defined by the equipotentiallines, the groundwater flow direction can be determined. Groundwater flows perpendicularly toequipotential lines and from the higher to the lower head.
Reading: Xeroxed attachment from Driscoll, 1987, pages 79-81.
Terms
discharge area: an area where groundwater flowing toward the surface escapes as a spring, seep, or baseflow or by evaporation and transpiration
equipotential line: a line in a two-dimensional groundwater flow field such that the total hydraulichead is the same for all points along the line
flow line: the line of flow of groundwater
flow net: the set of intersecting equipotential lines and flow lines representing two-dimensional steady flow through porous media
4-63
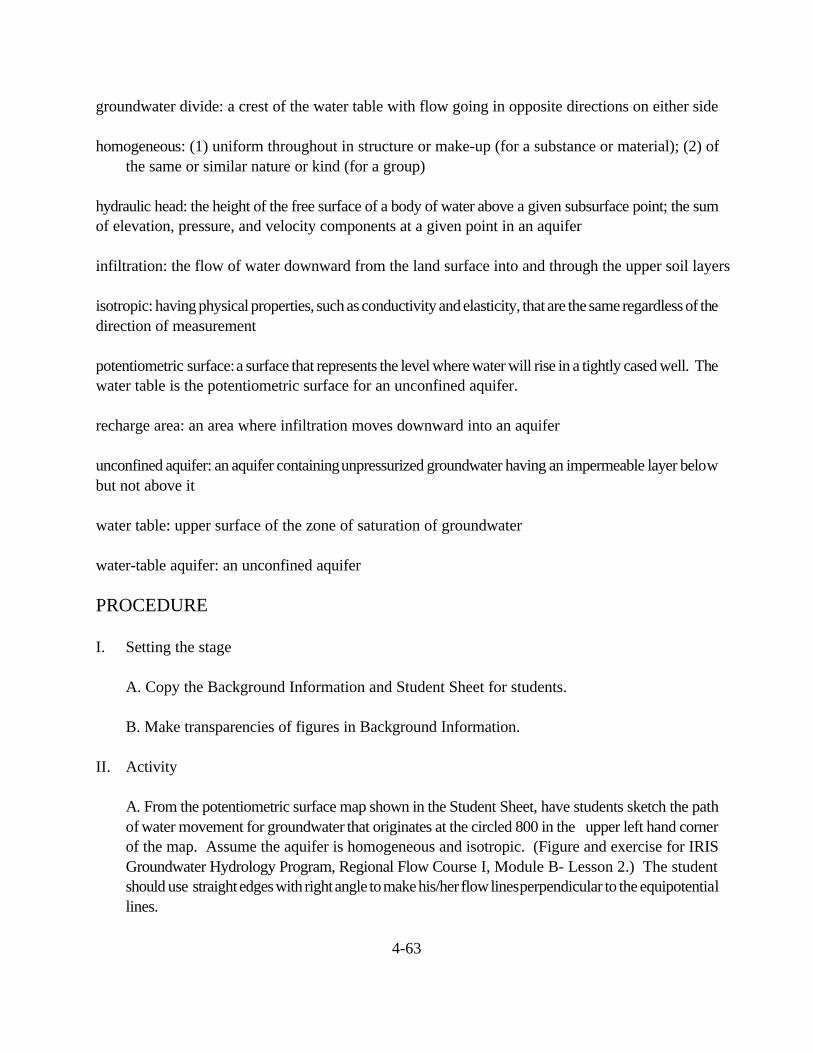
groundwater divide: a crest of the water table with flow going in opposite directions on either side
homogeneous: (1) uniform throughout in structure or make-up (for a substance or material); (2) ofthe same or similar nature or kind (for a group)
hydraulic head: the height of the free surface of a body of water above a given subsurface point; the sumof elevation, pressure, and velocity components at a given point in an aquifer
infiltration: the flow of water downward from the land surface into and through the upper soil layers
isotropic: having physical properties, such as conductivity and elasticity, that are the same regardless of thedirection of measurement
potentiometric surface: a surface that represents the level where water will rise in a tightly cased well. Thewater table is the potentiometric surface for an unconfined aquifer.
recharge area: an area where infiltration moves downward into an aquifer
unconfined aquifer: an aquifer containing unpressurized groundwater having an impermeable layer belowbut not above it
water table: upper surface of the zone of saturation of groundwater
water-table aquifer: an unconfined aquifer
PROCEDURE
I. Setting the stage
A. Copy the Background Information and Student Sheet for students.
B. Make transparencies of figures in Background Information.
II. Activity
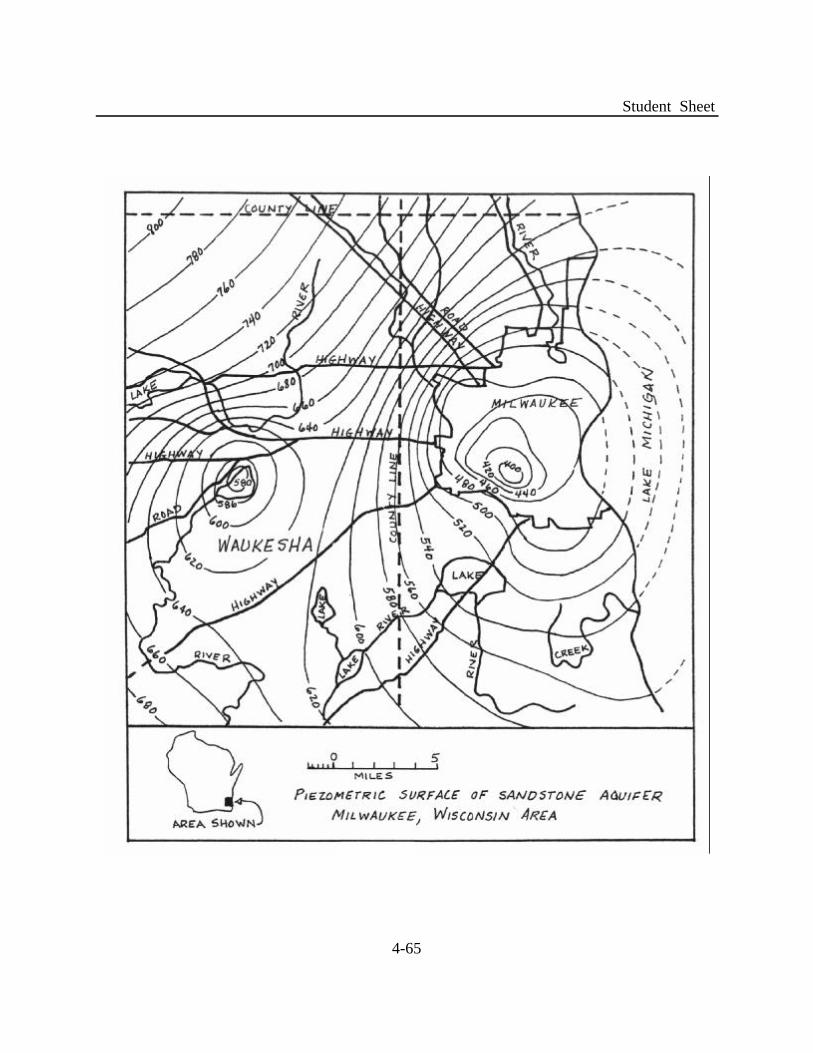
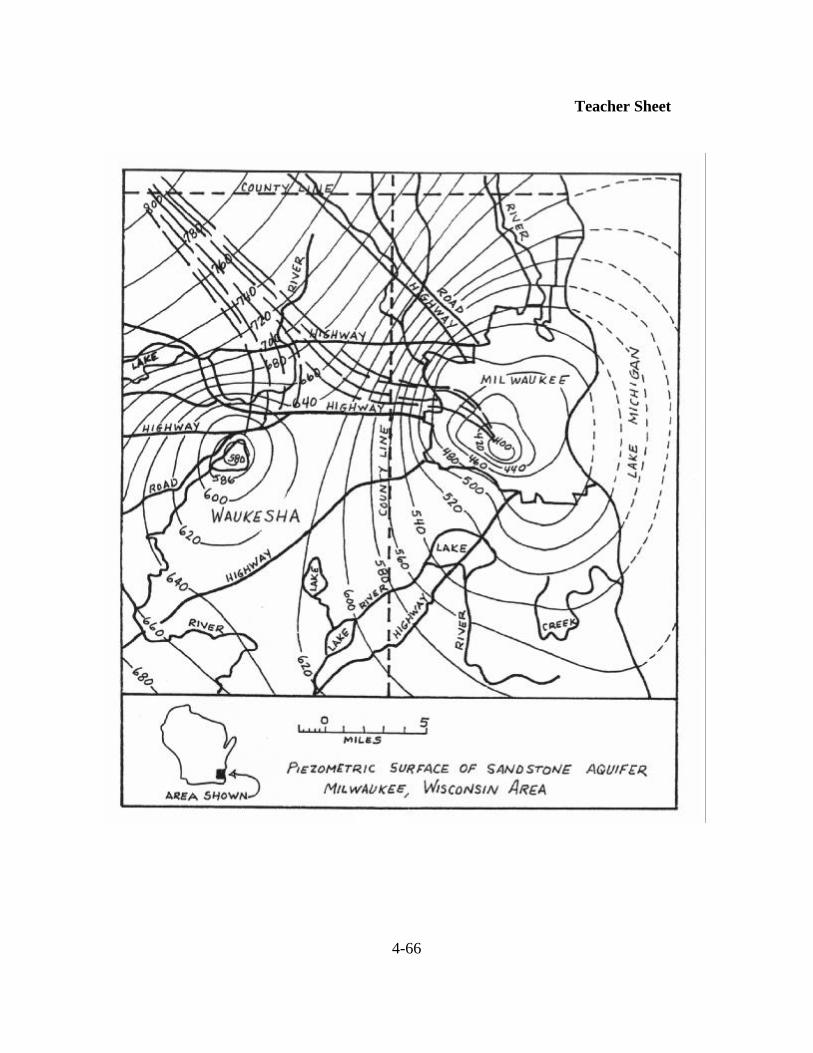
A. From the potentiometric surface map shown in the Student Sheet, have students sketch the pathof water movement for groundwater that originates at the circled 800 in the upper left hand cornerof the map. Assume the aquifer is homogeneous and isotropic. (Figure and exercise for IRISGroundwater Hydrology Program, Regional Flow Course I, Module B- Lesson 2.) The studentshould use straight edges with right angle to make his/her flow lines perpendicular to the equipotentiallines.
4-64
B. In class discussion, ask the students these questions.
1.Where is the groundwater flowing according to your constructed flow lines?Answer: They should show that groundwater from the 800 line splits and flows towards the cities of Waukesha and Milwaukee.
2.What could create the closed loop configuration of the equipotential lines Around Milwaukee and Waukesha? Answer: City wells and their constant
pumping created a bowl shape from pulling water down toward wells.
3.If the cities of Milwaukee and Waukesha turned off all the pumps in their public water supplies,what would happen to the potentiometric surface? To what point would the groundwater beflowing? Answer: The surface would eventually flatten out, and the equipotential lines wouldbecome straight and almost parallel to the shore of Lake Michigan. Groundwater would be flowingtowards Lake Michigan. (This question shows how an aquifer can be affected by a high volume of
withdrawal from pumps in the water supply wells. The volume extractedcan change the configuration of the potentiometric surface.)
III. Follow-up
A. Have students research the source of their community’s water supply. Have them call or write to the city water board or authority to find out specifics about their aquifer (if groundwater is the source).
B. Invite someone from the local water system to speak to the class if groundwater is used, and/or schedule trip to a well field.
IV. Extensions
If your area uses groundwater in any capacity, get potentiometric surface maps in the area. The localor state environmental or geological agencies may have access to these. Complete the same exercisewith these maps.
RESOURCES
Freeze, R. A. and Cherry, J. A., Groundwater, Prentice-Hall, Inc., 1979, p. 604.
4-65
Student Sheet
4-66
Teacher Sheet
4-67
SUBJECTS:Science (EnvironmentalScience, Physical Science,Earth Science), Social Studies(Political Science, Government)
TIME:2-8 class periods
MATERIALS:box (cardboard or other)various colors of paintposter boardthin strips of papergluepencilnarrative material
GROUNDWATER: CLEANING UP 9-12
OBJECTIVES
The student will do the following:
1. Create a model and display board that informs otherstudents and/or the public about different aspects ofgroundwater contamination that pose a threat to healthand human safety.
2. Illustrate some remediation activities that aid in correcting these problems.
BACKGROUND INFORMATION
Groundwater is one of the Earth’s most valuable resources.During the late 1970s, the realization of the threats to thenation’s groundwater supplies and the implications of thosethreats became evident to natural resource managers andsociety as a whole. Publicity about situations such as that encountered at Love Canal triggered bothconcern and demands for action. Enactments followed, such as the Resource Conservation and RecoveryAct (RCRA); Comprehensive Environmental Response, Compensation, and Liability Act (CERCLA); andSafe Drinking Water Act (SDWA); forming the major thrust of the federal government’s groundwaterprotection policy.
In July 1991, a new “Groundwater Protection Strategy” was outlined in the final report of theEnvironmental Protection Agency’s Groundwater Task Force. The Task Force was established in 1990by EPA’s Administrator to develop a comprehensive, national approach to addressing groundwaterprotection concerns. EPA selected a “pilot state” for each region to help outline and refine the processfor developing a core groundwater protection program.
Some possible sources of groundwater contamination are listed below.
1. Leaking underground storage tanks (examples: gasoline tanks at service stations)
4-68
2. Septic tanks (domestic or commercial wastewater on-site disposal systems)
3. Leaking above-ground storage tanks (ASTs) (examples: bulk fuel terminals, ASTs containingheating fuel)
4. Spills and leaks of solvents, fuels, and other chemicals being transported by rail, truck, or pipeline (example: train derailment)
5. The improper disposal of hazardous chemical wastes into septic tanks, unpermitted injection wells, and unpermitted dumping areas
6. Unpermitted dumps and landfills where solid and hazardous wastes have been disposed without proper engineering and geologic considerations
Once polluted, groundwater must be cleaned up or remediated, if possible. There are several methods ofremediation with pluses and minuses described in the following paragraphs.
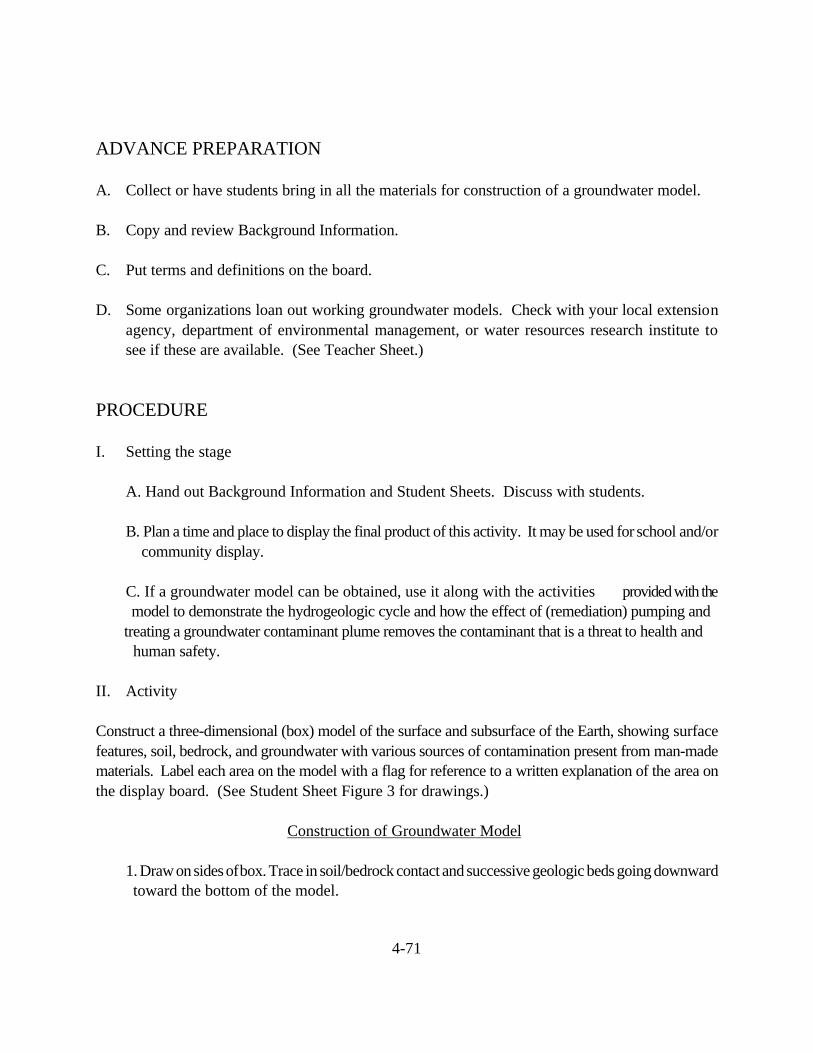
AIR SPARGING
Engineers have used air sparging since about 1985 to clean contaminated aquifers. In air sparging, wellsare used to inject a gas, usually air, beneath contaminated soils or aquifers. The air causes turbulence andgroundwater mixing, which increase the rate of soil and water contaminant desorption. Contaminants moveinto the air phase, and extraction or vacuum wells pull these vapors through the vadose zone to the surface.Air sparging and soil vapor extraction technologies rely on contaminant mass transport and biodegradation.Experienced engineers can design a system to enhance either process. In both cases, oxygen transport isessential for the technology to work. The air sparging system will usually consist of air sparging wells, asoil venting system, vapor monitor probes, groundwater recovery control, and air emissions control. (SeeStudent Sheet Figure 1 for illustration.)
CHEMICAL OXIDATION TECHNOLOGY
Chemical oxidation technology was developed to destroy dissolved organic contaminants (fuels andsolvents) in water. The technology uses ultraviolet (UV) radiation and hydrogen peroxide to oxidizeorganic compounds present in water at parts per million (ppm) levels. This treatment technology producesno air emissions and generates almost no residue, sludge, or spent media that require further processing,handling, or disposal. Ideally, end products are water, carbon dioxide, halides (for example, chloride), and,in some cases, organic acids. The technology uses medium pressure mercury vapor lamps to generate UVradiation. The principal oxidants in the system, hydroxyl radicals, are produced by direct photolysis ofhydrogen peroxide at UV wavelengths.
In Figure 2 on the Student Sheet, contaminated water enters the oxidation unit through a section of pipe
4-69
containing a temperature gauge, a flow meter, an influent sample port, and hydrogen peroxide and acidinjection points. Contaminated water is dosed with hydrogen peroxide before the water enters the firstreactor. After chemical injections, the contaminated water flows through a static mixer and enters theoxidation unit. Water then flows through the six UV reactors, which are separated by baffles to directwater flow. Treated water exits the oxidation unit through a pipe equipped with a temperature gauge, aneffluent sample port, and a base injection point. Base may be added to the treated water to adjust the pHto meet discharge requirements.
This system is used to treat landfill leachate, groundwater, and industrial wastewater all containing a varietyof organic contaminants including chlorinated solvents, pesticides, polynuclear aromatic hydrocarbons, andpetroleum hydrocarbons.
IN-SITU BIOREMEDIATION
Advancing technology is allowing scientists to isolate different microbes capable of performing manybeneficial functions. Several thousand different kinds of microbes are found naturally in soil; however, onlya small percentage of them are capable of breaking down contaminants. Furthermore, not all of thesepollution-consuming microbes are capable of quick and effective biodegradation.
Engineers and microbiologists have spent a number of years experimenting with and developing several ofthe most effective strains of synergistic microorganisms with metabolic pathways capable of degrading avariety of hydrocarbon-based contaminants under either aerobic or anaerobic conditions.
These microbes are naturally occurring and are not genetically engineered. Microbial formulas are madeup of a number of different strains of microorganisms that work symbiotically to remove a large variety ofcontaminants from the surrounding environment. Cultures are resilient to fluctuations in pH, salinity, andtemperatures that frequently occur in the field. Microbes have successfully remediated contaminants intemperatures as low as 40 degrees Fahrenheit. Microbes have remediated a variety of contaminantsranging from PCPs, PCBs, DDT, and BTEX chemicals to paint thinners, municipal sewage, chlorinatedsolvents, and creosote.
Once all of the contaminants have been removed from the site, the microbes become self-consuming,leaving behind organic material that acts as a fertilizer.
Terms
above-ground storage tanks (ASTs): any type of container used above the surface to store products.Regulated ASTs include those containing 660 or more gallons (in one container) or 1320 gallons (in morethan one container) of oil of any kind and which pose a potential discharge to surface waters.
air sparging: injecting air into groundwater to help remove contaminants
4-70
bedrock: the solid rock that underlies all soil, sand, clay, gravel, and loose material on the Earth’s surface;the bottom layer
biodegradation: the breakdown of materials by living things into simpler chemicals
chemical oxidation: a means of destroying dissolved organic contaminants in water using ultraviolet (UV)radiation, hydrogen peroxide, or other processes
hazardous waste: waste materials that are dangerous to human health and/or the environment
in-situ bioremediation: a means of degrading hydrocarbon-based contaminants at the site of contamination
injection well: a well in which fluids, such as wastewater, saltwater, natural gas, or used chemicals, areinjected in the ground for the purpose of disposal or to force adjacent fluids like oil into adjacent into the vicinity of producing wells
pH: a measure of the concentration of hydrogen ions (H ) in a solution; the pH scale ranges from 0 to 14,+
where 7 is neutral, values less than 7 are acidic, and values greater than 7 are basic or alkaline. It ismeasured by an inverted logarithmic scale so that every unit decrease in pH means a 10-fold increase inhydrogen ion concentration. Thus, a pH of 3 is 10 times as acidic as a pH of 4 and 100 times as acidic asa pH of 5.
plume: an area where a contaminant has spread out
soil venting: vacuum extraction or soil vapor extraction; a means of reducing concentrations of volatilechemicals in petroleum products absorbed into soils in the unsaturated zone. A vacuum is applied to thesoil to create a negative pressure gradient that causes movement of vapors toward extraction wells. Thevolatile chemicals are then removed through the wells, treated, and discharged into the atmosphere orreinjected to the subsurface.
synergistic: more than one agent working together to produce enhanced combined effects (i.e., agreater total effect than the sum of the individual effects)
underground storage tank (UST): any tank, including underground piping connected to the tank, that hasat least 10% of its volume underground and contains petroleum products or hazardous substances (expectheating oil tanks and some motor fuel tanks used for farming or residential purposes)
vadose zone: the zone of aeration between the Earth’s surface and the water table; area of the soilthat contains both air and water; same as unsaturated zone--zones between land surface andthe water table
4-71
ADVANCE PREPARATION
A. Collect or have students bring in all the materials for construction of a groundwater model.
B. Copy and review Background Information.
C. Put terms and definitions on the board.
D. Some organizations loan out working groundwater models. Check with your local extensionagency, department of environmental management, or water resources research institute tosee if these are available. (See Teacher Sheet.)
PROCEDURE
I. Setting the stage
A. Hand out Background Information and Student Sheets. Discuss with students.
B. Plan a time and place to display the final product of this activity. It may be used for school and/or community display.
C. If a groundwater model can be obtained, use it along with the activities provided with the model to demonstrate the hydrogeologic cycle and how the effect of (remediation) pumping and treating a groundwater contaminant plume removes the contaminant that is a threat to health and human safety.
II. Activity
Construct a three-dimensional (box) model of the surface and subsurface of the Earth, showing surfacefeatures, soil, bedrock, and groundwater with various sources of contamination present from man-madematerials. Label each area on the model with a flag for reference to a written explanation of the area onthe display board. (See Student Sheet Figure 3 for drawings.)
Construction of Groundwater Model
1. Draw on sides of box. Trace in soil/bedrock contact and successive geologic beds going downward toward the bottom of the model.
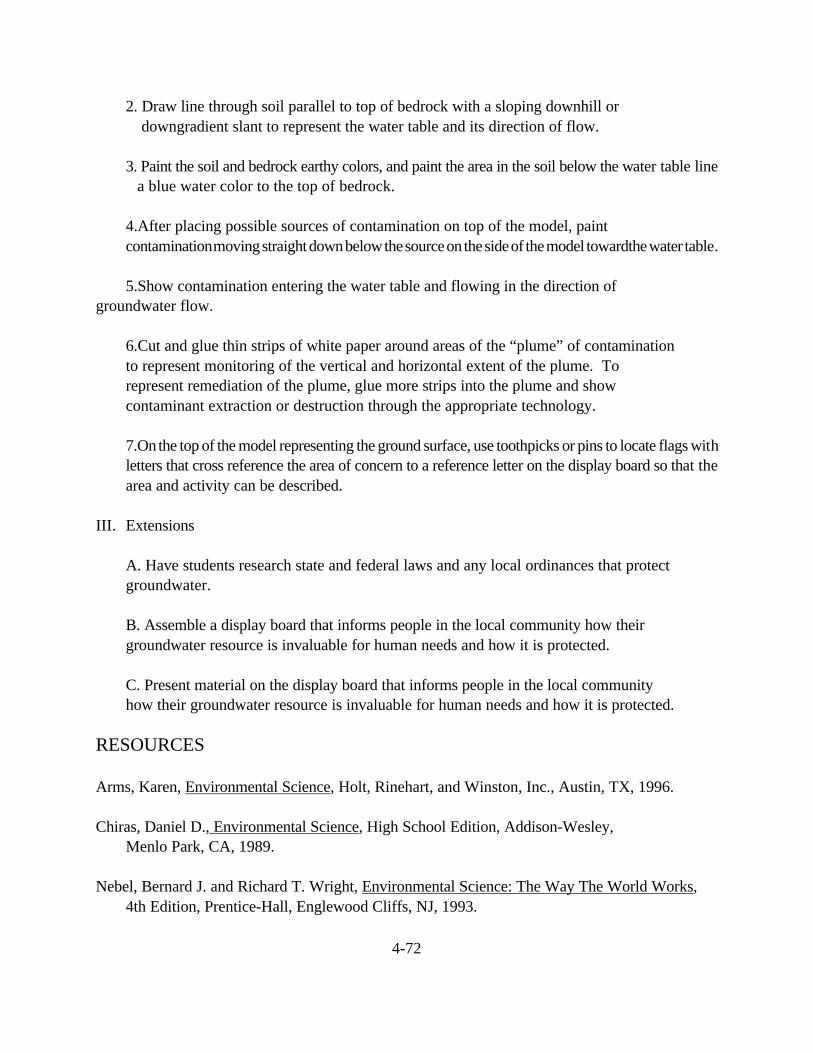
4-72
2. Draw line through soil parallel to top of bedrock with a sloping downhill or downgradient slant to represent the water table and its direction of flow.
3. Paint the soil and bedrock earthy colors, and paint the area in the soil below the water table line a blue water color to the top of bedrock.
4.After placing possible sources of contamination on top of the model, paint contamination moving straight down below the source on the side of the model towardthe water table.
5.Show contamination entering the water table and flowing in the direction of groundwater flow.
6.Cut and glue thin strips of white paper around areas of the “plume” of contamination to represent monitoring of the vertical and horizontal extent of the plume. To represent remediation of the plume, glue more strips into the plume and show contaminant extraction or destruction through the appropriate technology.
7.On the top of the model representing the ground surface, use toothpicks or pins to locate flags withletters that cross reference the area of concern to a reference letter on the display board so that thearea and activity can be described.
III. Extensions
A. Have students research state and federal laws and any local ordinances that protect groundwater.
B. Assemble a display board that informs people in the local community how their groundwater resource is invaluable for human needs and how it is protected.
C. Present material on the display board that informs people in the local community how their groundwater resource is invaluable for human needs and how it is protected.
RESOURCES
Arms, Karen, Environmental Science, Holt, Rinehart, and Winston, Inc., Austin, TX, 1996.
Chiras, Daniel D., Environmental Science, High School Edition, Addison-Wesley, Menlo Park, CA, 1989.
Nebel, Bernard J. and Richard T. Wright, Environmental Science: The Way The World Works, 4th Edition, Prentice-Hall, Englewood Cliffs, NJ, 1993.
4-73
Student Sheet
Figure 1
4-74
Student Sheet
Figure 2
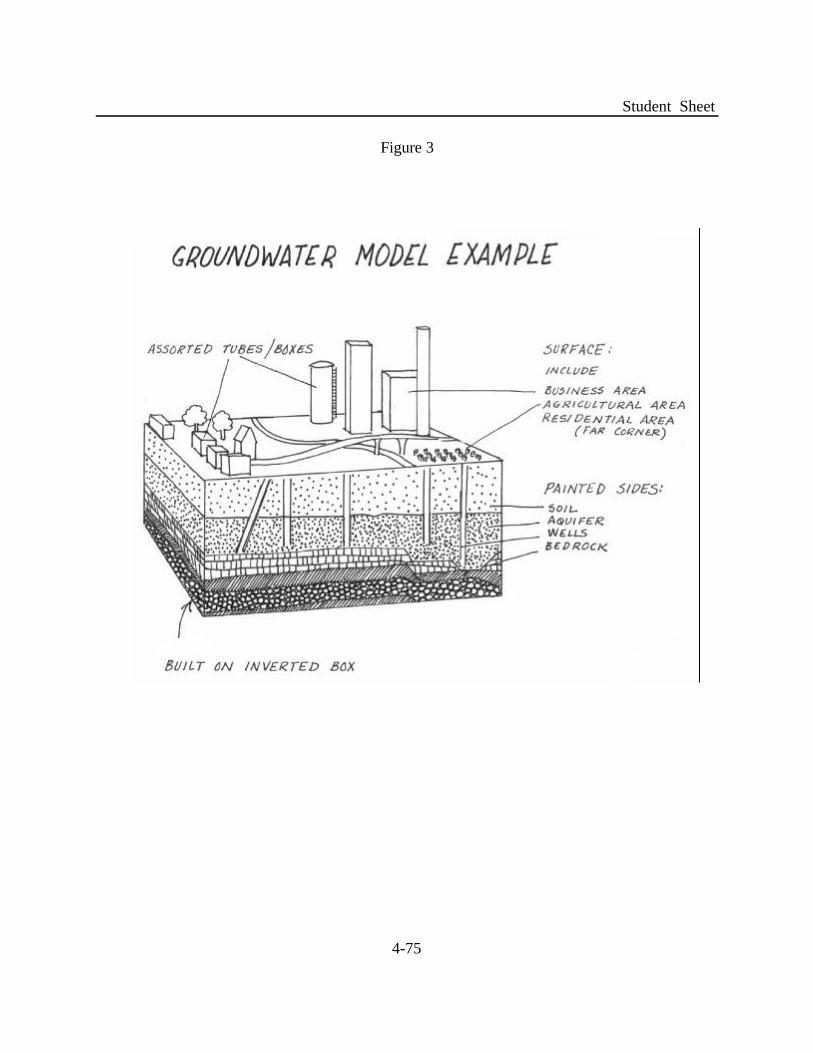
4-75
Student Sheet
Figure 3
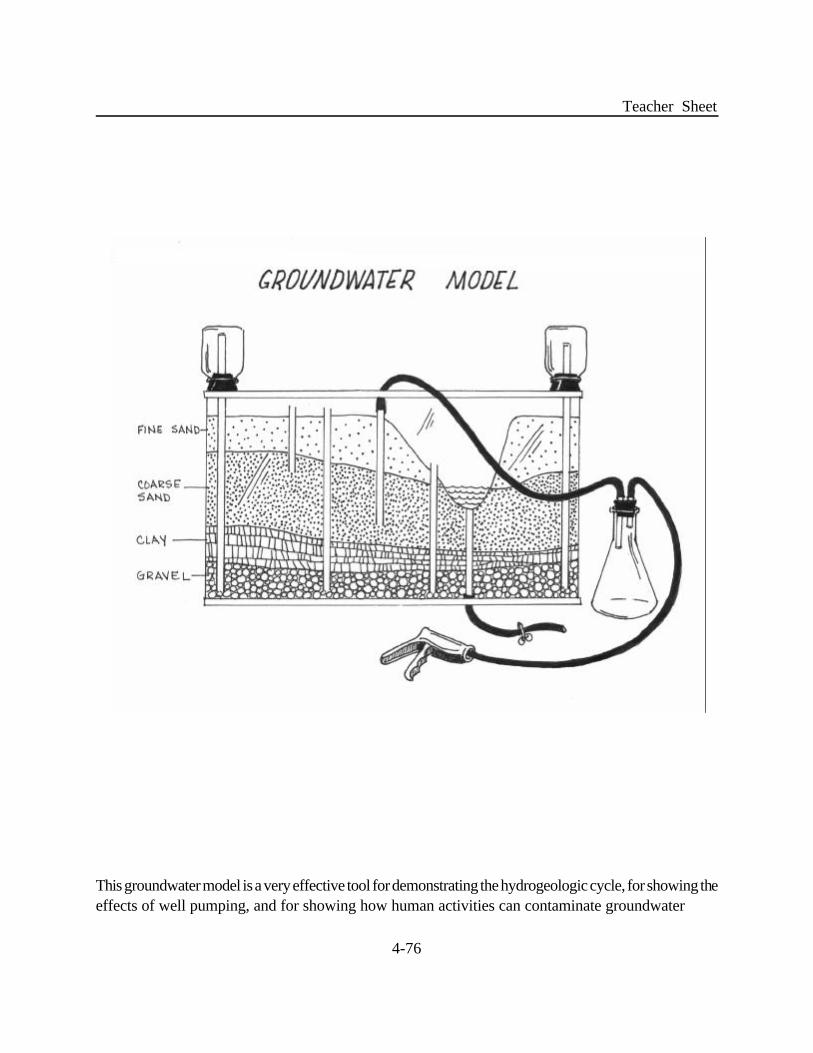
4-76
Teacher Sheet
This groundwater model is a very effective tool for demonstrating the hydrogeologic cycle, for showing theeffects of well pumping, and for showing how human activities can contaminate groundwater
4-77
SUBJECTS:Science (Ecology, SocialStudies (Geography), Health
TIME:1 class period
MATERIALS:colored pencilsstudent sheets
WHAT IS GROUNDWATER POLLUTION DOING
TO THE NEIGHBORHOOD?
9-12
OBJECTIVES
The student will do the following:
1. Explain the potential impact of the environment on health.
2. Describe some carcinogenic contaminants and possible sources of them.
3. Develop possible ways to work toward lessening oreliminating the contaminants from the environment.
BACKGROUND INFORMATION
Chemicals introduced into the environment may find their way into groundwater and become hazards.The Environmental Protection Agency (EPA) has set drinking water standards that list amounts in mg/l(ppm) above which a health hazard could be posed either immediately or over the long term at sustainedexceedance levels. They also list some possible sources for carcinogens and other hazardouscompounds.
Terms
carcinogen: cancer-causing agent
hot spot: region where an unusually high number of deaths are due to cancer that might be linkedto environmental contamination
parts per million (ppm): a measurement of concentration of 1 unit of material dispersed in 1 million unitsof another (for water, same as mg/l)
4-78
ADVANCE PREPARATION
A. Copy Student Sheets for each student.
B. Become familiar with Ellen’s story.
PROCEDURE
I. Setting the stage
Share Ellen’s story with the students. Distribute Student Sheet Limestone Ridge drawing and(optional) EPA Standards (located on Factsheet pages F-73 thru F-77).
II. Activity
A. Have students follow the coded key, complete the schematic using the given information, and answer the questions.
B. Discuss findings as a group
III. Follow-up
A. Have students write a statement accepting or rejecting their hypotheses. Explain why the test turned out like it did.
B. Have students list some possible sources of coliform contamination in the samples that were positive.
C. Discuss how these contaminants affect the cost of purifying drinking water. Ask students for ideas on how to prevent contamination.
IV. Extensions
A. Have students ask questions of relatives and friends to try to discover any potential “hot spots.”
B. Have students write a letter to the EPA regarding a problem they may discover from their questions (A) or write a “simulated letter” regarding the problem in the activity (the “hot
spot” on Limestone Ridge Road).
4-79
RESOURCES
Arms, Karen, Environmental Science, Holt, Rinehart, and Winston, Inc., Austin, TX 1996.
Chiras, Daniel D. Environmental Science, High School Edition, Addison-Wesley,Menlo Park, CA, 1989.
“National Primary Drinking Water Standards,” EPA, Washington D.C, February, 1994. (Latestversion obtainable from the Safe Drinking Water Hotline, 1-800-426-4791).
Nebel, Bernard J. And Richard T. Wright, Environmental Science: The Way The World Works,4th Edition, Prentice-Hall, Englewood Cliffs, NJ, 1993.
4-80
Student Sheet
ELLEN’S STORY - LIFE (AND DEATH) ON LIMESTONE RIDGE ROAD
Ellen had lived on Limestone Ridge Road for 44 years, all of her life except for the four years she hadgone away to college. She was typical of may of the residents of Limestone Ridge Road whose parentsand grandparents had lived there before them. All of the households obtained their drinking water fromwells, and most of the families had been farmers for several generations.
In the 40 years Ellen had lived on the road, many of the residents had died, especially in the last ten years.Ellen’s parents and sister had died of cancer in the last ten years.
Ellen had just returned from yet another neighbor’s funeral, a neighbor who had, coincidentally, died ofcancer. As Ellen began to think about those who had died in the last ten years, she was astonished torealize that almost every death she could remember could be attributed to cancer!
Ellen began a neighborhood drawing recording deaths by the house location of each, recordingsurrounding industry at its location, and also recording what information she could obtain about chemicalsthat had been used in farming along the road.
It is important to note that farmers are among the highest occurrences of skin cancer due to long/frequentexposure to sun. Therefore, all cancer sources may not be totally due to drinking water.
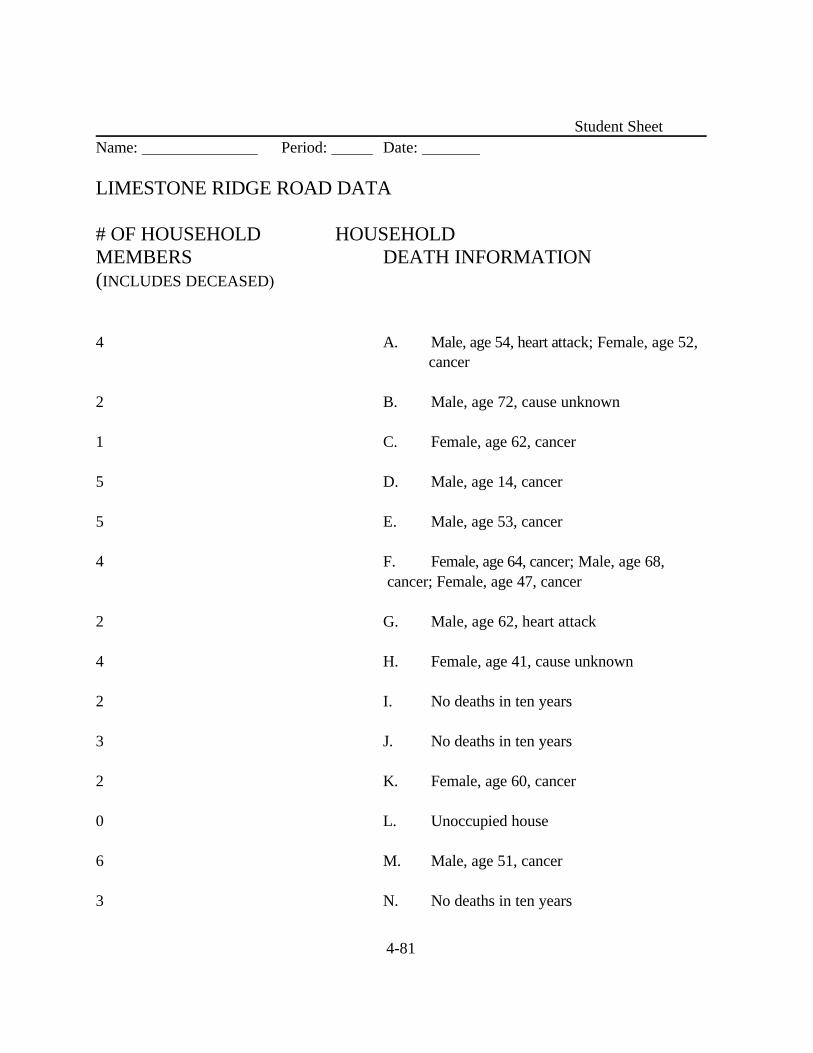
4-81
Student Sheet
Name: Period: Date:
LIMESTONE RIDGE ROAD DATA
# OF HOUSEHOLD HOUSEHOLDMEMBERS DEATH INFORMATION(INCLUDES DECEASED)
4 A. Male, age 54, heart attack; Female, age 52, cancer
2 B. Male, age 72, cause unknown
1 C. Female, age 62, cancer
5 D. Male, age 14, cancer
5 E. Male, age 53, cancer
4 F. Female, age 64, cancer; Male, age 68, cancer; Female, age 47, cancer
2 G. Male, age 62, heart attack
4 H. Female, age 41, cause unknown
2 I. No deaths in ten years
3 J. No deaths in ten years
2 K. Female, age 60, cancer
0 L. Unoccupied house
6 M. Male, age 51, cancer
3 N. No deaths in ten years
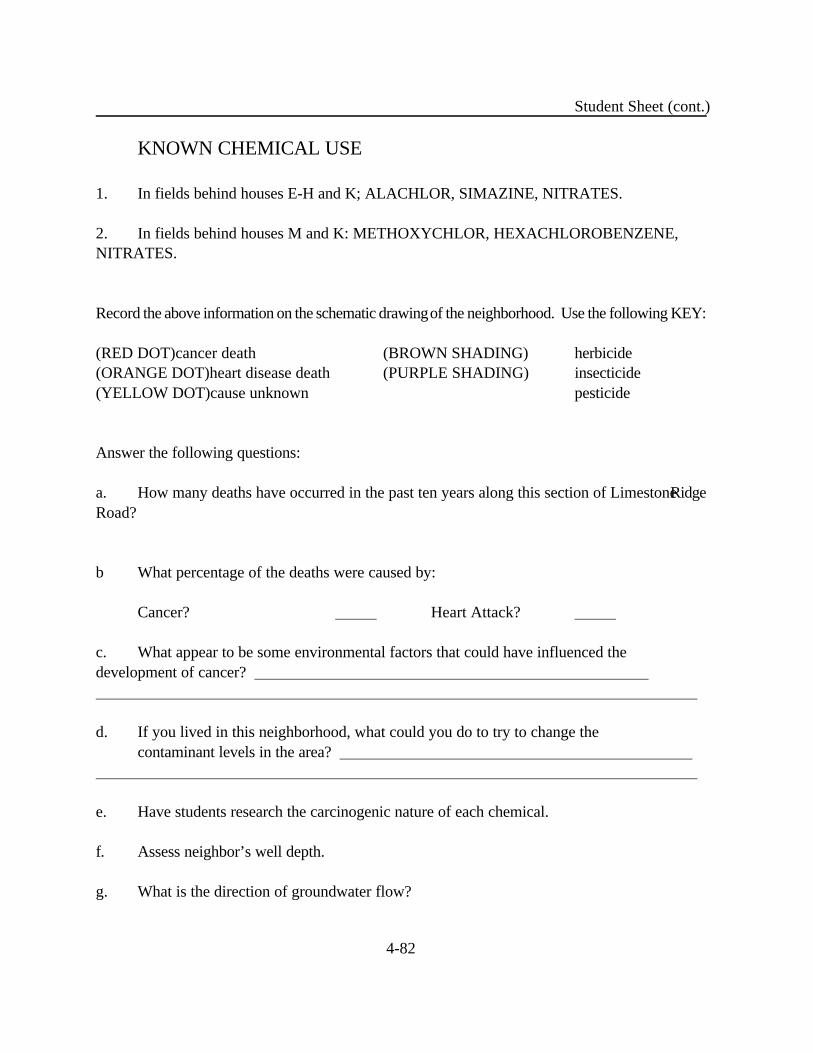
4-82
Student Sheet (cont.)
KNOWN CHEMICAL USE
1. In fields behind houses E-H and K; ALACHLOR, SIMAZINE, NITRATES.
2. In fields behind houses M and K: METHOXYCHLOR, HEXACHLOROBENZENE, NITRATES.
Record the above information on the schematic drawing of the neighborhood. Use the following KEY:
(RED DOT)cancer death (BROWN SHADING) herbicide(ORANGE DOT)heart disease death (PURPLE SHADING) insecticide(YELLOW DOT)cause unknown pesticide
Answer the following questions:
a. How many deaths have occurred in the past ten years along this section of Limestone RidgeRoad?
b What percentage of the deaths were caused by:
Cancer? Heart Attack?
c. What appear to be some environmental factors that could have influenced the development of cancer?
d. If you lived in this neighborhood, what could you do to try to change the contaminant levels in the area?
e. Have students research the carcinogenic nature of each chemical.
f. Assess neighbor’s well depth.
g. What is the direction of groundwater flow?
4-83
Teacher Sheet
1. Look at student’s color coded drawing, or prepare an overhead transparency of the drawing andcolor code with input from students.
2. a. 13 deaths
b. 9/13 = 69% of the deaths were due to cancer
c. 2/13 = 15% of the deaths were due to heart attack
d. Answers will vary -
Could include: limit or eliminate contaminants sprayed on crops; check and change, if needed, by-products of plastics plant.
NOTE: Accumulated contaminants in the soil would be difficult to “clean-up.”
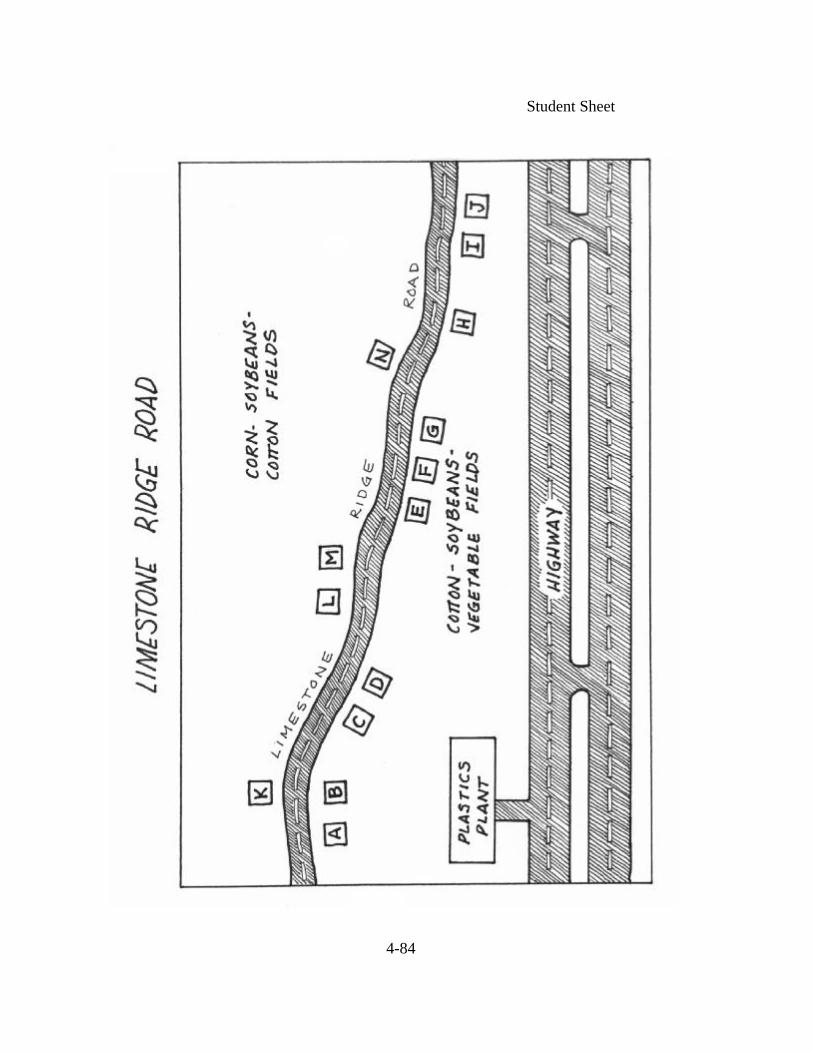
4-84
Student Sheet
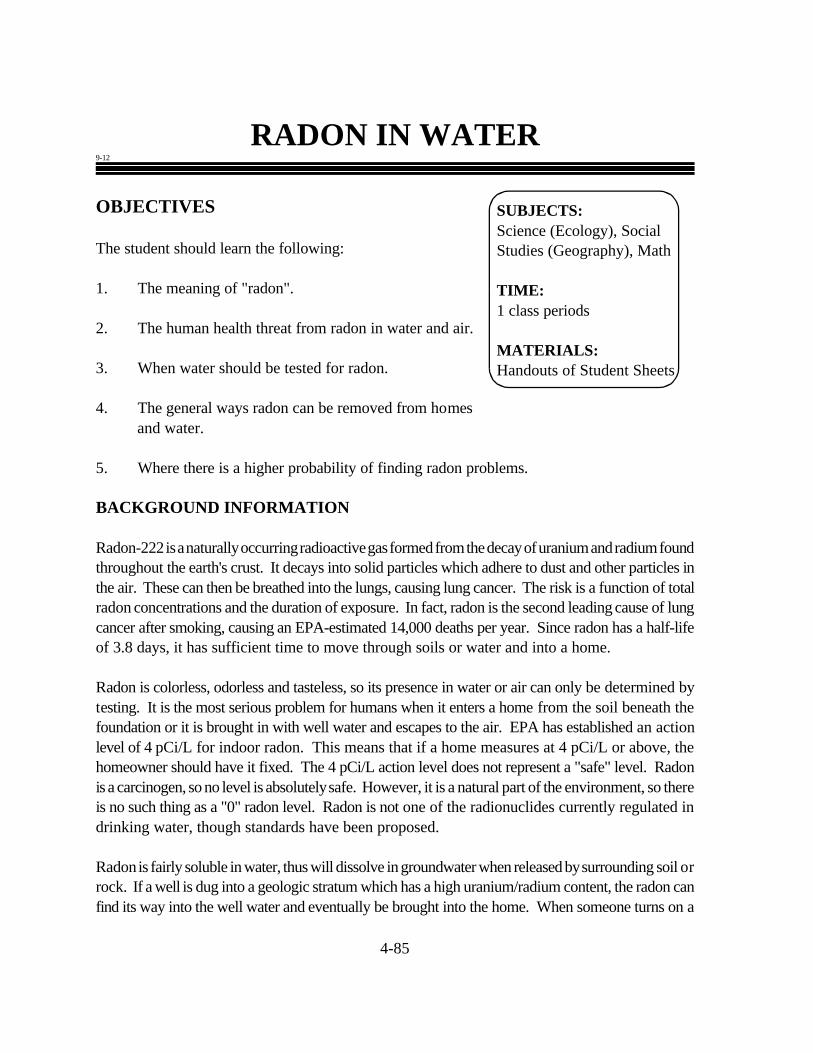
4-85
SUBJECTS:Science (Ecology), SocialStudies (Geography), Math
TIME:1 class periods
MATERIALS:Handouts of Student Sheets
RADON IN WATER9-12
OBJECTIVES
The student should learn the following:
1. The meaning of "radon".
2. The human health threat from radon in water and air.
3. When water should be tested for radon.
4. The general ways radon can be removed from homes and water.
5. Where there is a higher probability of finding radon problems.
BACKGROUND INFORMATION
Radon-222 is a naturally occurring radioactive gas formed from the decay of uranium and radium foundthroughout the earth's crust. It decays into solid particles which adhere to dust and other particles inthe air. These can then be breathed into the lungs, causing lung cancer. The risk is a function of totalradon concentrations and the duration of exposure. In fact, radon is the second leading cause of lungcancer after smoking, causing an EPA-estimated 14,000 deaths per year. Since radon has a half-lifeof 3.8 days, it has sufficient time to move through soils or water and into a home.
Radon is colorless, odorless and tasteless, so its presence in water or air can only be determined bytesting. It is the most serious problem for humans when it enters a home from the soil beneath thefoundation or it is brought in with well water and escapes to the air. EPA has established an actionlevel of 4 pCi/L for indoor radon. This means that if a home measures at 4 pCi/L or above, thehomeowner should have it fixed. The 4 pCi/L action level does not represent a "safe" level. Radonis a carcinogen, so no level is absolutely safe. However, it is a natural part of the environment, so thereis no such thing as a "0" radon level. Radon is not one of the radionuclides currently regulated indrinking water, though standards have been proposed.
Radon is fairly soluble in water, thus will dissolve in groundwater when released by surrounding soil orrock. If a well is dug into a geologic stratum which has a high uranium/radium content, the radon canfind its way into the well water and eventually be brought into the home. When someone turns on a
4-86
faucet, takes a shower, or runs a dishwasher, the radon will escape to the air where it can be breathed.There is some risk from ingesting or drinking water with high radon levels, however the primary healthrisk is from breathing radon decay products in the air.
The release of dissolved radon into the house air is often referred to as "de-gassing" of the water. De-gassing occurs primarily when the water is brought into contact with air, facilitating escape of radonfrom the water. The most de-gassing occurs when the water is aerated or sprayed, as in a shower.Heating the water will decrease radon solubility, also causing release of the dissolved radon.
When a town's drinking water comes from surface waters instead of groundwater, radon is usually nota problem. It has a chance to escape to outdoor air before being brought into the home. As a rule ofthumb, it takes 10,000 pCi/L of radon in water to increase the level in a home by 1 pCi/L. However,this can vary widely. If a home measures less than 4 pCi/L, then even if its water supply source is awell, the water probably does not need to be sampled for radon. If the home measures above 4 pCi/Land has a well, then radon in water may be a contributing factor.
Radon problems in homes, however, are relatively easy to fix. The most common approach is calledactive soil depressurization. In this method radon-containing soil gas is drawn away from thefoundation before it can enter the home, and is vented to the outdoors where it is quickly diluted inoutside air. One or more pipes are inserted through the slab into the soil below. The pipes areconnected to a fan, usually in the attic, and extended through the roof. The fan draws the radon throughthe pipe and vents it above the roof level. If the home has a crawl space, the same general approachcan be used, except the pipe is run through a plastic vapor barrier which is placed on the soil.
If water is contributing to the indoor radon problem it must be treated as well. The water can bepassed through a vessel containing activated carbon. The radon and its decay products are adsorbedonto the carbon, where they can decay away. The water can also be aerated, causing the radon to de-gas, or stored for a time above ground. The latter two approaches are not as practical for homeshowever.
EPA has developed a Map of Radon Zones as a guide for radon officials. The authors evaluated theradon data which had been collected from around the country, then looked at geological maps todetermine where the uranium content was the highest. Every county in the United States was then ratedZone 1, 2 or 3, with Zone 1 counties being the most likely to have homes with radon levels greater than4 pCi/L. However, homes with elevated radon levels have been found in both Zone 2 and Zone 3counties. A separate book was prepared for each state to provide the background details for thecounty designations. Because such information is continually being updated, EPA recommends thatevery home be tested, regardless of its location.
4-87
Terms
aeration: exposing to circulating air
picocuries per liter (pCi/L): units for measurement of radioactive element concentrations in water andin air
radon: colorless, odorless, tasteless, naturally occurring radioactive gas formed from natural deposits of uranium that can cause lung cancer. It can enter the home around plumbing pipes andthrough cracks and openings in the foundation. It can also be brought in with the home's water supply.
radon decay products: the radioactive elements that immediately follow radon-222 in the decay chain.They are ultrafine solids that tend to adhere to other solids, such as dust particles in the air, or lungtissue if inhaled.
solubility: ability or tendency of one substance to blend uniformly with another
ADVANCE PREPARATION
Contact the State Radon Program to obtain a state book of Map of Radon Zones. Copy theappropriate state map, Map of Radon Zones, drawing of the house (without entry routes identified),drawing of Mesa Village, and questions.
PROCEDURE
I. Setting the stage.
A. Present background information and terms.
B. Discuss the drawing of Mesa Village.
II. Activity.
A. Distribute Student Sheets of questions on Mesa Village. Have students answer questions individually or as a group.
B. Distribute drawing of the home. Have students attempt to identify possible radon entry routes.
4-88
C. Distribute or show Map of Radon Zones and appropriate state map. Have students find where they live. What Zone is the school in?
D. Answer any general questions.
III. Follow-up.
Have students research:
A. Where their drinking water comes from. Does it represent a potential radon problem?
B. Whether their state drinking water program tests for radon in water. If so, what kind of results have been found?
C. Whether anyone they know has tested for radon. What were the results?
D. If the home had elevated radon levels was it fixed? How? Was radon in water a contributing factor?
E. The uranium decay chain. The difference between alpha, beta and gamma emitters. What do radon decay products emit?
RESOURCES
A Citizen's Guide to Radon, EPA 402-K92-001, September 1994.
Consumer's Guide to Radon, EPA 402-K92-003, August 1992.
Home Buyer's and Seller's Guide to Radon, EPA 402-R93-003, March 1993.
Radon Reduction Techniques for Detached Houses, 2nd Edition, EPA 625/5-87/019,January 1988.
Radon Reduction Techniques for Existing Detached Houses, 3rd Edition, EPA 625/R-93/011,October, 1993.
Removal of Radon from Household Water, EPA OPA-87-011, September, 1987.
Map of Radon Zones, EPA 402,R-93-071, September 1993.
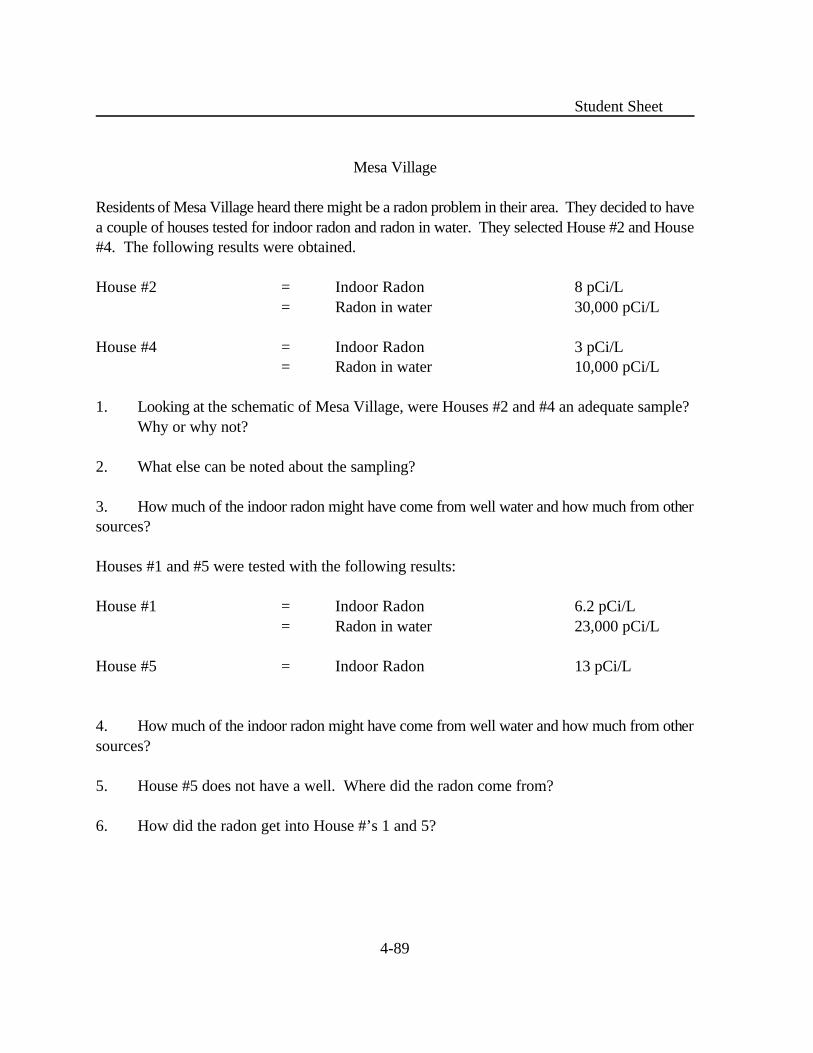
4-89
Student Sheet
Mesa Village
Residents of Mesa Village heard there might be a radon problem in their area. They decided to havea couple of houses tested for indoor radon and radon in water. They selected House #2 and House#4. The following results were obtained.
House #2 = Indoor Radon 8 pCi/L= Radon in water 30,000 pCi/L
House #4 = Indoor Radon 3 pCi/L= Radon in water 10,000 pCi/L
1. Looking at the schematic of Mesa Village, were Houses #2 and #4 an adequate sample? Why or why not?
2. What else can be noted about the sampling?
3. How much of the indoor radon might have come from well water and how much from othersources?
Houses #1 and #5 were tested with the following results:
House #1 = Indoor Radon 6.2 pCi/L= Radon in water 23,000 pCi/L
House #5 = Indoor Radon 13 pCi/L
4. How much of the indoor radon might have come from well water and how much from othersources?
5. House #5 does not have a well. Where did the radon come from?
6. How did the radon get into House #’s 1 and 5?
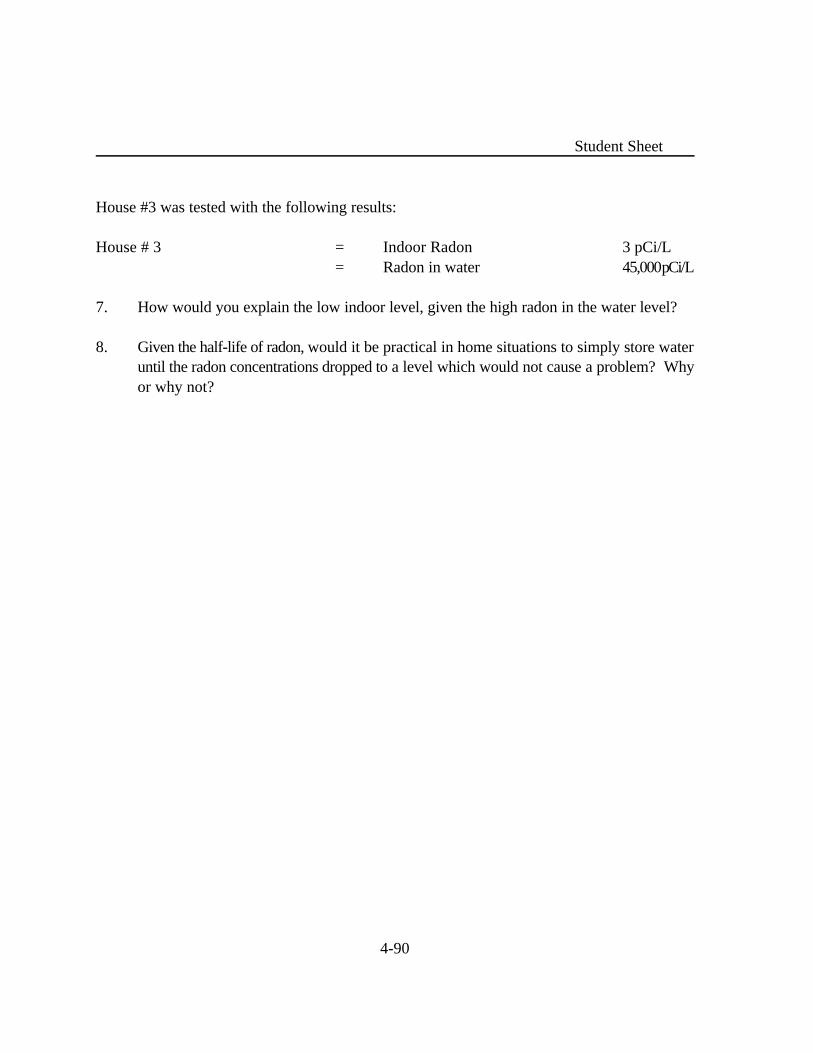
4-90
Student Sheet
House #3 was tested with the following results:
House # 3 = Indoor Radon 3 pCi/L= Radon in water 45,000 pCi/L
7. How would you explain the low indoor level, given the high radon in the water level?
8. Given the half-life of radon, would it be practical in home situations to simply store wateruntil the radon concentrations dropped to a level which would not cause a problem? Whyor why not?
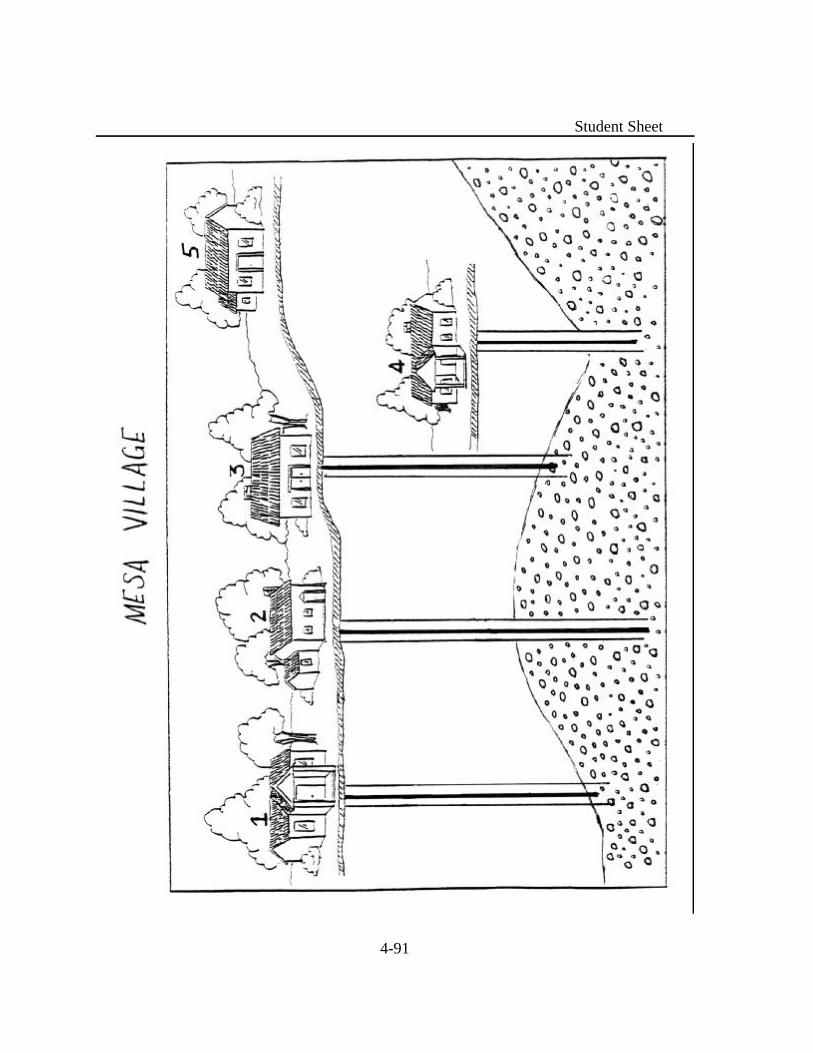
4-91
Student Sheet
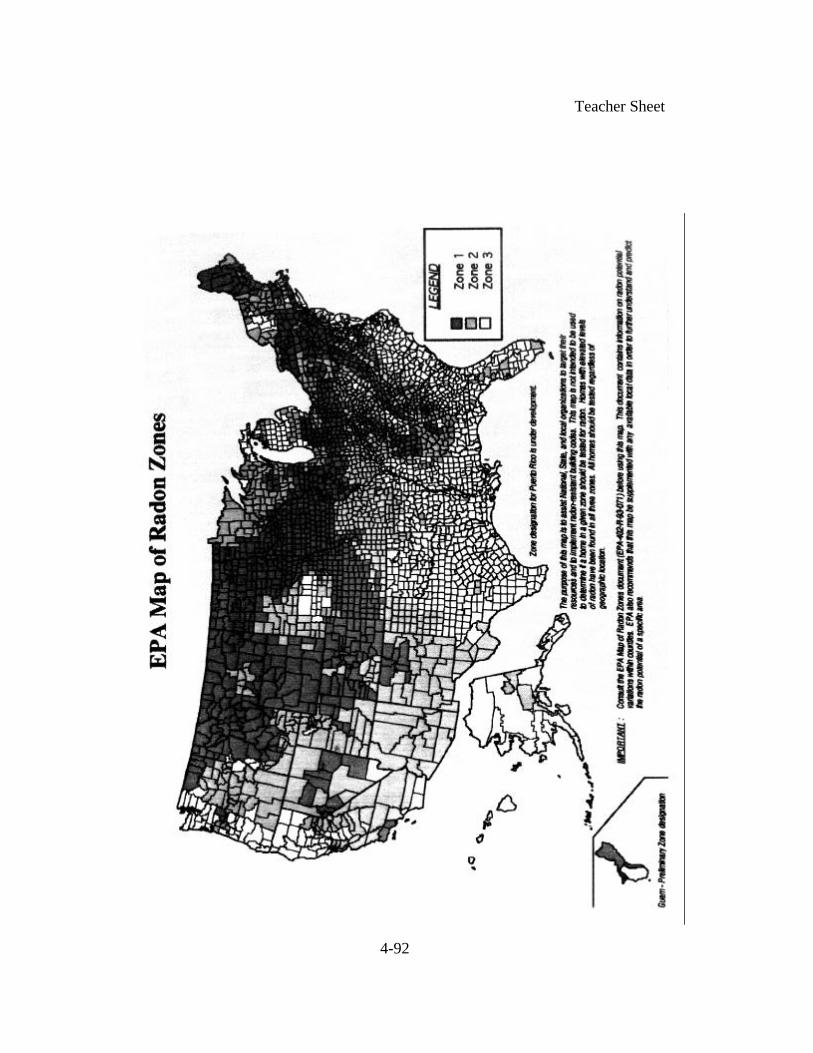
4-92
Teacher Sheet
4-93
Teacher Sheet
Answer Sheet
1. Houses #2 and #4 do not provide an adequate sample because:
a)Every home should be tested
b)A house with a high radon level can be right next door to one with a low level.
2. The water should not be tested for radon until the levels inside the home are found to beabove 4 pCi/L.
3. Using the 10,000 to 1 rule of thumb:
House #2 = 5 pCi/L from other sources= 3 pCi/L from water
House #4 = 2.9 pCi/L from other sources= 0.1 pCi/L from water
4. Using the 10,000 to 1 rule of thumb, approximately 2.3 pCi/L came from the water and 3.9pCi/L from other sources.
5. Probably from the soil beneath the house. In some instances radon can be emitted frombuilding materials.
6. Using the schematic of the house, show how radon came in through cracks in the foundation, floor to wall joints, the shower. etc. in House #1.
7. The owner of House #3 could be a single person or someone who travels a lot, resultingin less water usage. The owners of Houses #1 and #2 could have large families who would use
much more water. If the water is not turned on, the radon does not escape to the air.
8. No, because too much storage capacity would be needed.
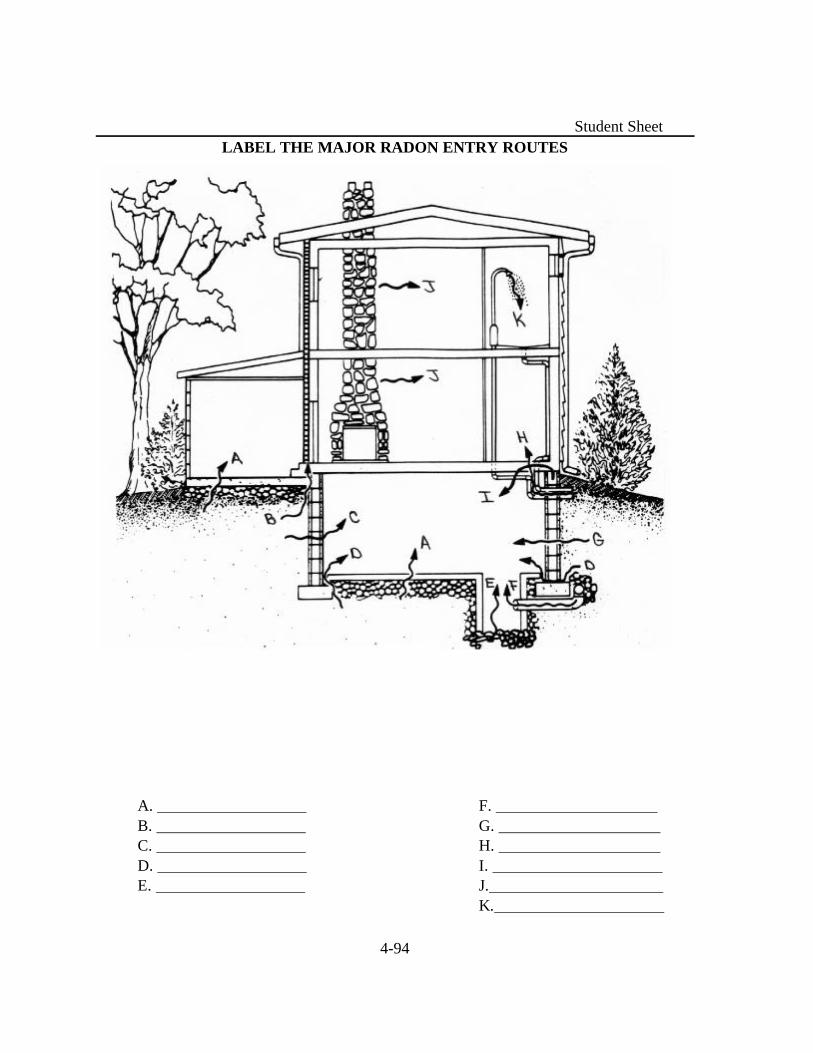
4-94
Student Sheet
LABEL THE MAJOR RADON ENTRY ROUTES
A. F. B. G. C. H. D. I. E. J.
K.
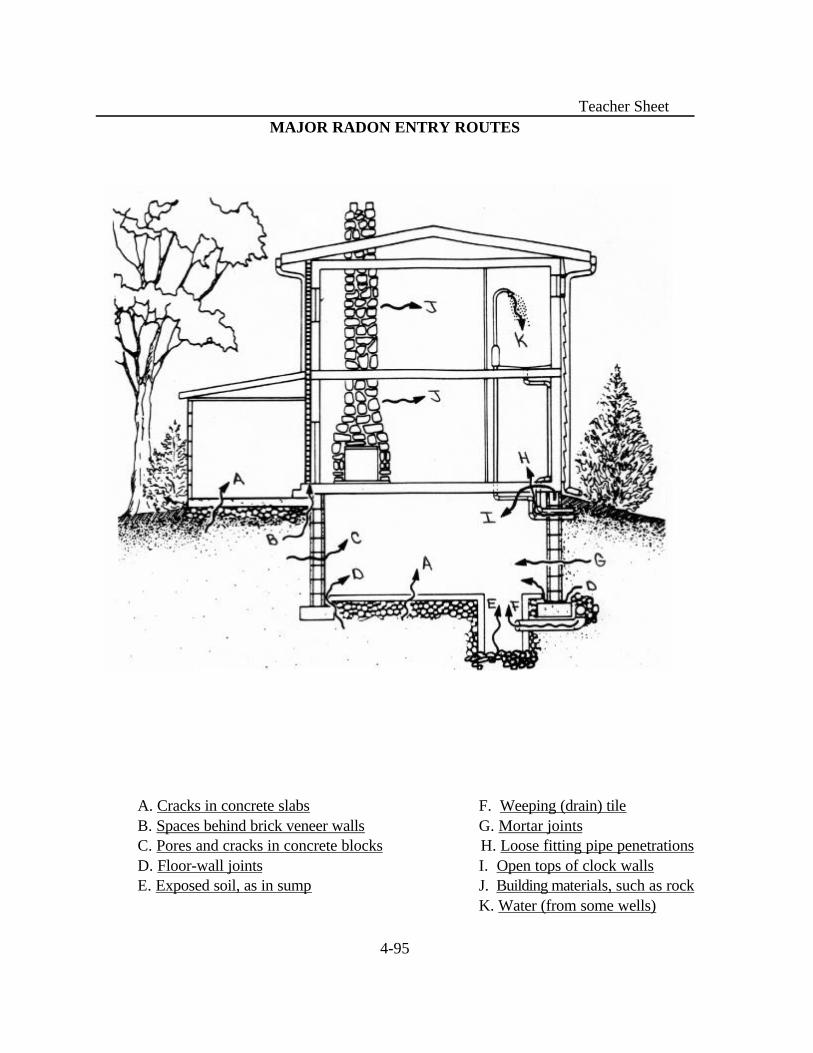
4-95
Teacher SheetMAJOR RADON ENTRY ROUTES
A. Cracks in concrete slabs F. Weeping (drain) tileB. Spaces behind brick veneer walls G. Mortar jointsC. Pores and cracks in concrete blocks H. Loose fitting pipe penetrationsD. Floor-wall joints I. Open tops of clock wallsE. Exposed soil, as in sump J. Building materials, such as rock
K. Water (from some wells)

4-96
4-97
SUBJECTS:Science (Chemistry,Environmental Science), Math
TIME:3-4 class periods per procedurehomework1 month (minimum) for leachatecollection
MATERIALS:plastic garbage can (30 gallon)clear Plexiglas®, +/- 4" x 30" (Be sure to modify this if you choose to use a 13 gallon kitchen trash can.)membrane filtrate5 to 10 gallons of soilscrew-in, plastic faucet with securing nuta small piece of screened wire +/- 2" squarecaulking compoundwaterproof glue for plasticone gallon of distilled watercoliform bacteria testlaboratory thermometerstudent work sheets (included)gloves
LANDFILLS AND THE POTENTIAL FORGROUNDWATER CONTAMINATION
9-12
OBJECTIVES
The student will do the following:
1. Define waste and leachate.
2. Describe a sanitary landfill in terms of its construction and function. 3. Identify some common chemical and physical
properties of leachate and the problems these cancause in groundwater.
4. Identify sites in the community that are possible sources of contaminants in runoff waters and groundwaters due to unsupervised, unprotected garbage disposal sites.
BACKGROUND INFORMATION
Most of our household waste is buried in landfills. An important factor in how landfills are built is how they contain waste and prevent waste from contaminating nearbysoil and water sources. The possibility of leachatecontaminating soil and groundwater exists wherever wastesare disposed. Leachate is a fluid that has passed through or emerged fromthe waste in a landfill, picking up a variety of suspended anddissolved materials along the way. Leachate generationdepends on the amount of liquid originally contained in the waste (primary leachate) and the quantityof precipitation that enters the landfill through the cover or that which comes in direct contact with the waste (secondary leachate) prior to being covered. Factors that affectleachate generation are: climate (rainfall), topography (run-on/run-off), landfill cover, vegetation, andtype of waste.
4-98
In unlined landfills, the leachate continues to leach into the ground and may contaminate groundwater.Many old landfills used a simple clay liner for containing leachate (clay is one of the mostnon-permeable soils). Newer landfills are required to meet federal and state requirements to preventenvironmental contamination (Subtitle D landfills). These landfills have sophisticated liner systems oftenmade of heavy-duty, high density polyethylene (HDPE) plastic, where leachate is collected at thebottom. The leachate is typically treated on-site or is pumped out and sent to a local wastewatertreatment plant. Treated leachate can be disposed of in a number of ways (e.g., discharged to surfacewaters or recirculated back into the landfill). Some States also allow continued use of clay liners, if theliner meets federal and state performance standards, and if leachate is properly collected, treated, anddisposed of.
In this lesson, the landfill model represents the construction of a Subtitle D sanitary landfill to holdmunicipal waste.
A common convenient procedure for disposal of household and domestic garbage is to take it to thenearest ravine, hollow, or back road and leave it in a completely unprotected situation. Because thiskind of behavior is such an accepted and uncontested way of life for many households, the effect of thisgarbage upon water quality can be overwhelming. Often there is absolutely no regard for thecontamination potential of some of these items. The results of this can be the introduction of very toxicsubstances into the streams and groundwater. An understanding of the long-term harmful effects ofthese actions would influence the future actions of students and their counterparts toward propergarbage disposal. Such an understanding of the part of the community leaders will possibly influencelegislation and enforcement.
Terms
aquifer: porous, water-bearing layer of sand, gravel, and rock below the Earth’s surface; reservoir forgroundwater.
groundwater: water that infiltrates into the Earth and is stored in usable amounts in the soil and rock below the Earth’s surface; water within the zone of saturation.
leachate: a liquid that results from water collecting contaminants as it trickles through wastes, or soilcontaining agricultural pesticides or fertilizers
percolate: to drain or seep through a porous and permeable substance; to filter such as a liquid passing through a porous body (water through soil to the aquifer)
residue: something that remains after a part is taken away
4-99
ADVANCE PREPARATION
A. Make copies of Student Sheet (3).
B. Ask students to come up with some of the materials to construct the sanitary landfill model.
PROCEDURE
I. Setting the stage
A. Discuss with the students the following:
1.What is waste?
2.What does the term “biodegradable” mean? (Note that some of the elements necessary for biodegradability - air, water, and sunlight - are not available in a landfill. Without air, water, or sunlight, there is no degradation.)
3.What are the sources of waste? Give examples.
4.What happens to the waste from our homes, schools, and businesses? Then what? (Lead students to the conclusion that most waste is buried in a
landfill.)
5.Why is waste disposal an important issue?
6.Have students identify some local sites where household garbage is disposed illegally.
7.Discuss the possible effects of illegal disposal on surface water and groundwater.
B. If possible, make arrangements for students to visit the nearest landfill site or arrange a presentation by a local waste management or public health expert. Explain how a landfill is constructed. Discuss:
1.Site selection.
2.Methods and operations.
3.Chemical and biological reactions occurring in a completed landfill.
4-100
4.Methane gas and leachate movement and control.
5.Landfill design criteria and regulations.
C. Ask the students to describe what they think the properties of landfill leachate might be (interms of pH, bacteria, and suspended solids) and what the processes occurring in its formation mightbe. (Seeing the landfill operation or hearing a presentation by a landfill operator first will give studentsa better understanding. As a less-than-complete-but-effective alternative, have students take a trip tothe school dumpster. (This may reveal the early formation of leachate, as liquid wastes have probably started to accumulate in the bottom of the container.) Students could test the pH of leachatefrom the school dumpster.
D. Ask each student to bring to class a small plastic bag containing household wastes, including foodstuffs (vegetable and fruit peels, no meat or dairy products), yard trimmings or plant residue, metal, paper, plastic, and cloth. As they bring the small bags of waste, havethem deposit the bags in a larger bag or other large container.
E. Have the materials and equipment gathered for constructing the landfill model. (See studentSheet: Construction of a Sanitary Landfill Model.) Divide the class into teams.
II. Activity
A. Give the teams copies of the Student Sheet: Construction of a Sanitary Landfill Model, and proceed with the landfill model construction and waste preparation.
B. To prepare for the simulated rainfall, determine the average annual precipitation for your geographic area. Information is available from the state climatologist or local extension agent of National Weather Service.
1.Divide the average annual precipitation by 52 to calculate the average weekly precipitation.
2.Measure distilled water to equal the amount of the calculated average weekly precipitation and sprinkle it over the soil in the model landfill.
3.Repeat the addition of “average weekly precipitation,” keeping a record of the number of “weeks,” until water begins to collect in the bottom of the model landfill. (The
liquid that collects in the bottom is a leachate.) Be prepared to allow several weeks of adding precipitation to obtain enough leachate to perform this activity.
4-101
C. Monitor the temperature by inserting a thermometer as far as possible into the center of the landfill model and keeping a daily record of temperature readings. This can be an excellent graphing exercise.
D. One month after the addition of water, withdraw all of the leachate from the model and test for pH, total suspended solids (liquid weight minus weight of solids), hardness, coliform bacteria (optional), and other water quality parameters for which tests are available.
1.Compare the results of these tests with the properties of distilled water and graph the results.
2.Discuss what can be done to prevent leachate from contaminating groundwater and surface waters.
Explain to the class that leachate contamination can be controlled through landfill design and operationalrequirements (i.e., exclusion or hazardous waste and liquids). For example, landfill liners and leachatecollection systems help to control contamination.
E. How Leachate Contaminates GroundwaterTo determine how leachate, once it has reached an aquifer, contaminates groundwater,
conduct the following experiment:
Material Needed:4 petri dishes4 steel nailsSoapRubbing alcoholPaper towelsUniversal indicator paperA sample of the leachateHousehold ammoniaHousehold vinegarTap waterSafety goggles
1.Measure the acidity of the leachate from this activity with universal indicator paper. Compare it with indicator dipped in tap water, household
ammonia, and household vinegar.
2.Clean the nails with soap and water, rinse with alcohol, and dry with paper towels. Be careful not to touch the nails with bare hands after rinsing.
4-102
3.Fill each of the four petri dishes about half full. Place tap water in one, leachate in the second, household ammonia in the third, and household
vinegar in the fourth. Place one nail in each dish.
4.After a few days when the liquid has evaporated, observe the nails. Record the observations. Have the nails changed in appearance?
F. How Leachate Affects PlantsTo perform another experiment with the leachate sample, ask the students to bring
to class an egg carton containing nine eggshell halves.
You will also need the following materials:
3 different types of soil (clay, loam, sand)Approximately 20 small plants 1" to 2" high (radishes germinate quickly)Soil testing kitStudent Record Sheets (included)
1.Discuss soil structure and compare soils with three different structure types - heavy (clay), medium (loam), and light (sand).
2.Have the students prepare three seed beds from each of the three soil types, using the eggshell halves as containers. (Have the students prick tiny drainage holes in the bottoms of the eggshell halves.)
3.Have the students sow several radish seeds in each shell half and keep them moist during germination. (Plastic wrap laid on top will hold moisture in the soil.)
4.When the radish plants are one or two inches high, water one bed of each soil type with distilled water (control group), one bed of each soil type with leachate drawn directly from the landfill model, and the other bed of each type with leachate that has been passed through a column of soil. (Discuss the movement and dilution of leachate, including how continued movement changes the degrees of dilution.) Use the same measured volume of liquid on each plant. (Be sure not to overwater.)
5.Have the students record the condition of the plants after one hour, 24 hours, and 48 hours.Observe for signs of obvious ill effects (or, as might be possible, temporarily beneficial effects foradded nutrients in the leachate). Record the observations on the Student Sheet: How LeachateAffects Plants.
4-103
G. How Leachate Affects Living ThingsMeasure 1 ml of leachate in a container and add 99 ml of distilled water (to simulate the dilution of leachate due to normal movement through soil.)
1.Place 10 to 20 living Daphnia in the container. (Daphnia are any of a variety of small freshwater crustaceans of the genus Daphnia, some species of which are commonly used as food for aquarium fish.)
2.Record any changes of activity or obvious death after 1 minute, 2 minutes, and 5 minutes.
H.CAUTION: MAKE SURE STUDENTS TAKE PROPER PRECAUTIONS, SUCH ASWEARING PROTECTIVE CLOTHING, GLOVES, AND GOGGLES, BEFORE PARTICIPATING IN THE FOLLOWING SEGMENT OF THE EXPERIMENT:
Include hazardous wastes - household chemicals such as hazardous pesticides, nail polish remover, cleaning fluids - in your landfill model. Have leachate samples analyzed at a laboratory. How might this leachate affect groundwater? Should household hazardous wastes be placed in municipal solid waste landfills? If not, what should we do with them?
Continue testing plants watered with leachate samples that have passed through increasingly more soil.
III. Follow-up
Discuss the results of this lesson in terms of the following:
A. The need for monitoring streams, wells, and springs located below the elevation of landfill sites.
B. The importance of reporting unusual odors in drinking water and knowing to whom suchinformation should be reported. Place a listing of agencies to report unusual odors and environmentalhazards to students. Teachers can prepare an “Inquiry Sheet” that can be easily completed withnecessary information and sent to the appropriate person(s).
RESOURCE
EPA Facts About Leachate Collection, June 1992
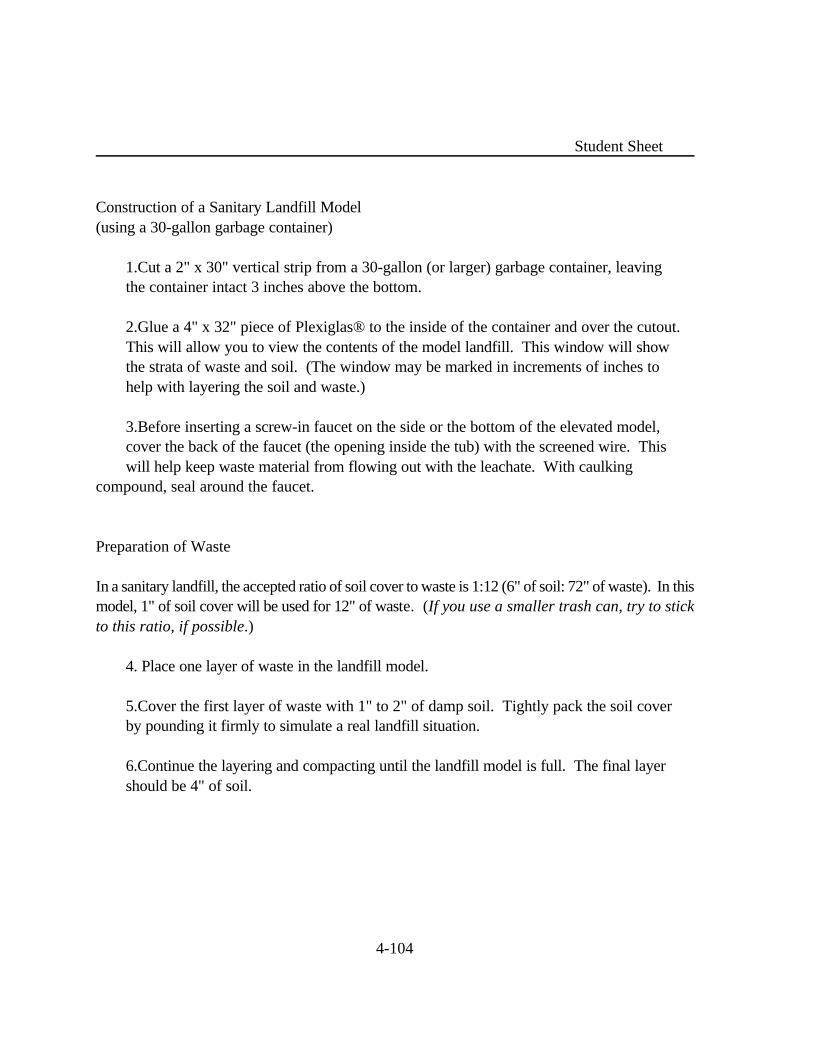
4-104
Student Sheet
Construction of a Sanitary Landfill Model(using a 30-gallon garbage container)
1.Cut a 2" x 30" vertical strip from a 30-gallon (or larger) garbage container, leaving the container intact 3 inches above the bottom.
2.Glue a 4" x 32" piece of Plexiglas® to the inside of the container and over the cutout. This will allow you to view the contents of the model landfill. This window will show the strata of waste and soil. (The window may be marked in increments of inches to help with layering the soil and waste.)
3.Before inserting a screw-in faucet on the side or the bottom of the elevated model, cover the back of the faucet (the opening inside the tub) with the screened wire. This will help keep waste material from flowing out with the leachate. With caulking
compound, seal around the faucet.
Preparation of Waste
In a sanitary landfill, the accepted ratio of soil cover to waste is 1:12 (6" of soil: 72" of waste). In thismodel, 1" of soil cover will be used for 12" of waste. (If you use a smaller trash can, try to stickto this ratio, if possible.)
4. Place one layer of waste in the landfill model.
5.Cover the first layer of waste with 1" to 2" of damp soil. Tightly pack the soil cover by pounding it firmly to simulate a real landfill situation.
6.Continue the layering and compacting until the landfill model is full. The final layer should be 4" of soil.
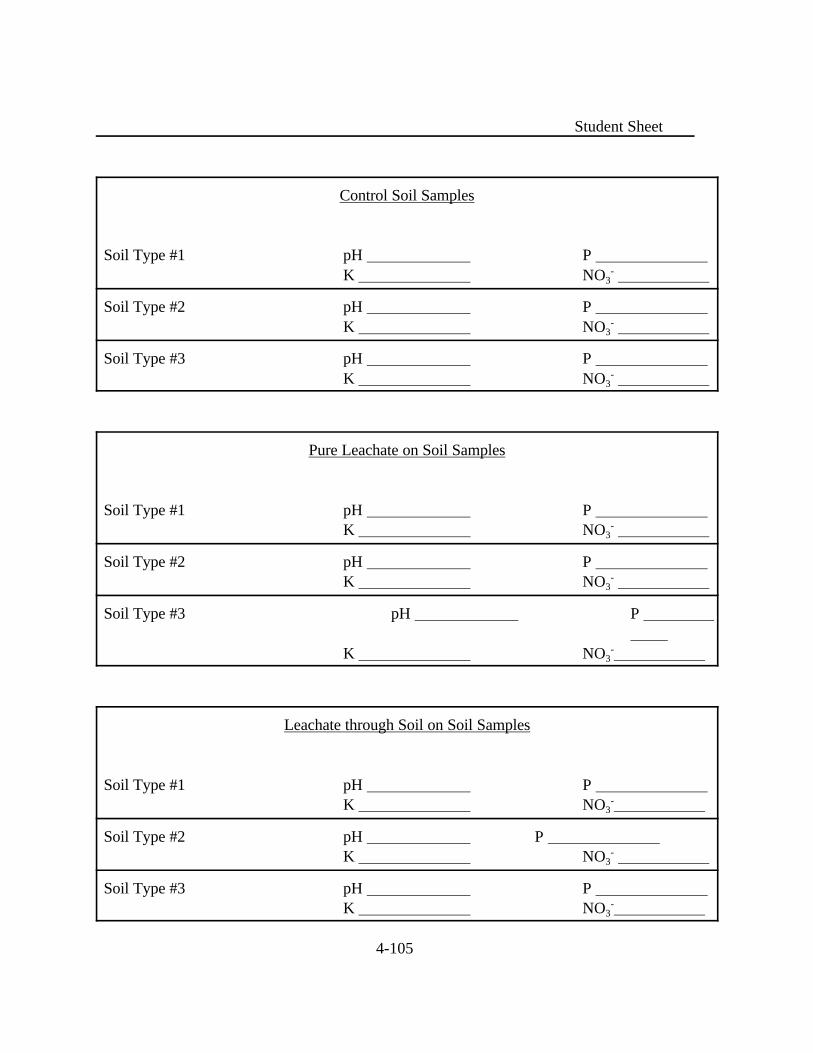
4-105
Student Sheet
Control Soil Samples
Soil Type #1 pH P K NO 3
-
Soil Type #2 pH P K NO 3
-
Soil Type #3 pH P K NO 3
-
Pure Leachate on Soil Samples
Soil Type #1 pH P K NO 3
-
Soil Type #2 pH P K NO 3
-
Soil Type #3 pH P
K NO 3-
Leachate through Soil on Soil Samples
Soil Type #1 pH P K NO 3
-
Soil Type #2 pH P K NO 3
-
Soil Type #3 pH P K NO 3
-
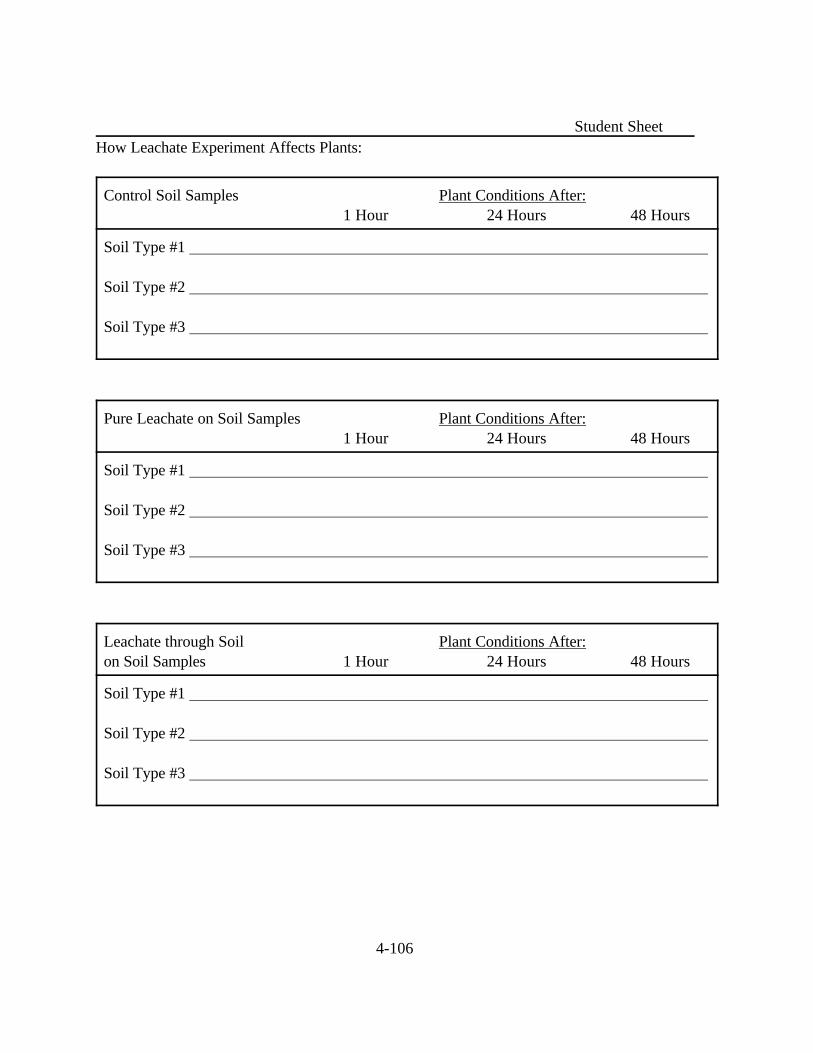
4-106
Student SheetHow Leachate Experiment Affects Plants:
Control Soil Samples Plant Conditions After:1 Hour 24 Hours 48 Hours
Soil Type #1
Soil Type #2
Soil Type #3
Pure Leachate on Soil Samples Plant Conditions After:1 Hour 24 Hours 48 Hours
Soil Type #1
Soil Type #2
Soil Type #3
Leachate through Soil Plant Conditions After:on Soil Samples 1 Hour 24 Hours 48 Hours
Soil Type #1
Soil Type #2
Soil Type #3
4-107
SUBJECTS:Science (Physical Science,Environmental Science),Social Studies (Economics),Math
TIME:2 class periods
MATERIALS:2 sheets of graph or bookkeeping paper perstudent groupcalculators (optional)
LEAKING UNDERGROUNDSTORAGE TANKS
9-12
OBJECTIVES
The student will do the following:
1. Define USTs.
2. List existing environmental hazards caused by USTs.
3. Explain how problems with USTs are remediated.
4. Understand some of the costs associated with USTremediation.
BACKGROUND INFORMATION
Underground Storage Tanks, or USTs, are basically storage tanks placed underground. Throughoutthe world, the petroleum industry uses most of the USTs. Local gasoline stations use, by far, the largestnumber of USTs. Most of them have two to four 4,000 to 12,000 gallon tanks underground. Somerural homeowners may also use USTs for residential or farming purposes.
Problems with USTs arise when they begin to leak. Motor fuel contains hydrocarbons and additivesthat pose health risks to people, animals, and plants. Nature can break down these hydrocarbonsthrough a method called bioremediation. Unfortunately, nature's work is slow compared to our needs.These dangerous compounds may transmit quickly through soil and can find their way down to anaquifer.
Nationally 51% of the U.S. population relies to some extent on groundwater as a source of drinkingwater. Aquifers are where these drinking water sources are stored underground. When aquifersbecome contaminated by hazardous chemicals, the effects can be devastating. Even if people, plants,and animals do not become ill or die, contamination may persist for years; remediation may cost millionsof dollars.
4-108
Previous common practice was to place unprotected steel USTs and piping in the ground and forgetabout them. Unprotected steel can be highly subject to corrosion, though, especially in aqueousenvironments. In 1994, it was estimated that 1.2 million USTs existed in the U.S., many of which couldbe leaking or leak at some time in the future. Now, new tanks (and related piping) are required to meetfederal and state requirements intended to prevent leakage to groundwater. Tanks which do not meetthese requirements must be removed, replaced or upgraded by 1998.
Awareness of the problem and new environmental regulations have prompted companies to provideproducts that will increase UST safety. Liners, double-walled tanks and piping, or fiberglass tanks canbe used in UST systems. Sound older, unprotected steel tanks and piping can be upgraded withcorrosion protection systems.
Today tank owners are federally required to demonstrate financial responsibility, that is, the availabilityof funds to clean up a leak or spill should one occur from a tank or line. Most states have establishedtrust funds, paid for by motor fuel sales taxes, to satisfy this requirement. Many states and the federalgovernment are encouraging the insurance industry to take over this job allowing the states to retiretheir funds.
Federal, state, and sometimes local, governments regulate USTs. They ensure that owners andoperators of USTs meet various requirements. Regulatory inspections may cover a variety ofprocedures that owners and operators must follow. Some of these are listed below.
Owners/operators of USTs must:
1.Register all active UST systems with the appropriate agency.
2.Meet leak detection requirements for both tanks and piping by choosing an appropriate method,depending on size and type of tank system (Figure 2).
3.Install corrosion protection and spill overfill equipment on existing systems no later thanDecember 22, 1998.
Terms
aquifer: porous, water-bearing layer of sand, gravel, and rock below the Earth’s surface; reservoir forgroundwater
bioremediation: a biologically mediated corrective process that occurs naturally over time; humans mayspeed up this process through technology (see in-situ bioremediation)
4-109
corrosion: a substance formed or an action of wearing away by chemicals; formed by deterioration
groundwater: water that infiltrates into the Earth and is stored in usable amounts in the soil and rockbelow the Earth’s surface; water within the zone of saturation
hydrocarbons: a very large group of chemical compounds consisting primarily of carbon and hydrogen. The largest source of hydrocarbons is petroleum (crude oil).
inspect: to examine in detail, especially for flaws
inventory: a detailed list of items in one’s view or possession, especially a periodic survey of all goodsand materials
leaking underground storage tank: underground storage tank which has spilled, leaked, emitted,discharged, leached, disposed, or otherwise allowed an escape of its contents into groundwater, surface water, or subsurface soils
pressurize: to put (gas or liquid) under a greater than normal pressure
record: an account, as of information, set down in writing as a way of preserving data collected on aspecific subject
suction: a force causing a fluid or solid to be drawn into interior space or to adhere to a surface dueto the difference between external and internal pressures
underground storage tank (UST): any tank, including underground piping connected to the tank,that has at least 10 % of its volume underground and contains petroleum products or
hazardous substances (except heating oil tanks and some motor fuel tanks used for farming orresidential purposes)
ADVANCE PREPARATION
A. Copy Student Sheet, Background Information, and procedure for students.
B. Put terms and definitions on the board.
C. Divide the class into work groups and hand out materials.
D. Give students time to read and discuss materials. During discussion, have groups list environmental hazards caused by USTs and discuss how they are remediated.
4-110
E. After class discussion of USTs, have students proceed with activity within their groups.
PROCEDURE
I. Setting the stage
A. The State of California’s massive cleanup fund began in 1990. The Underground Storage Tank Cleanup Fund allows UST owners to comply with new regulations by helping finance tank removal and groundwater cleanup. Funding has already assisted in “the cleanup of some 25, 700 leaking underground tanks.”
B. The average cost for tank removal is about $10,000. The soil and groundwater cleanup after contamination occurs is where costs really balloon. For the purposes of this activity, the complex and individualized costs will be generalized; and a
standard figure for the cleanup of leaking tanks will be set at $400,000.
C. The funds for the Underground Storage Tank Cleanup Fund are generated by a fee charged to the owners/operators of underground petroleum storage tanks. A
proposal is to increase the current 0.06 of a cent per gallon to 1.2 cents per gallon fee. Estimates show that this increase would provide an additional $676 million to the “trust fund.”
D. Sacramento County has 3, 390 underground tanks, of which 519 are known to be leaking and 299 have been cleaned. Yolo has a total of 572 tanks including 121 leaking ones and 65 cleaned sites. Placer County has 994 tanks including 218 leaking tanks and 31 cleaned ones. And Eldorado County has 714 tanks including 31 leaking ones and 25 that have been cleaned.
II. Activity
A. Using the data listed, determine how many USTs still need to be replaced in the four counties listed. List them individually by county and include a total. List the number of leaking tanks by county and the total.
B. Using the assumed costs, determine how much money will be needed to replace and clean up all of the tanks in the four counties listed. Include these subtotals:
Cleanup for Leaking Tanks, Tank Removal for Leaking Tanks, Cleanup and Tank Removal for Leaking Tanks, Tank Removal for all Tanks, and Total Tank Removal and Cleanup.
C. Report how much money will need to be generated by the fund to accomplish final cleanup within five years (for the four counties listed).
4-111
D. At 1.2 cents per gallon, how many gallons will need to be sold to generate the needed funds for the four counties listed?
E. If the new fee passes, the 1.2 cent per gallon fee will probably be passed down to the consumers through increased gas prices. Do you feel that it is unfair to the consumers to be made responsible?
F. If the four counties contained over 2 million people, can you imagine how many USTs there would be in Los Angeles and Orange Counties, which include over ten million people? Do you think the final cleanup of all USTs in California will be
achieved in five years? What other way could they generate funds?
III. Follow-up
A. Ask students where their drinking water comes from. If any get water from groundwater, ask these students if there are any USTs in their area.
B. After the class generates a survey sheet, have students interview a gas station owner or manager. Be sure they include questions about how old the tanks are, if they have caused problems, the last time they were inspected, who does the inspection, how leaks are detected.
C. Give a quiz on USTs. Ask students to define UST, list environmental problems caused by USTs, explain how problems with USTs are remediated.
IV. Extensions
A. Some of the regulatory rules for USTs are listed in this activity. Have students read over these and study the Student Sheet figures.
B. Have students find out if groundwater is checked in the local area for petroleum contamination. Who is responsible for checking on USTs in the area?
4-112
RESOURCES
Dictionary of Scientific and Technical Terms, McGraw-Hill, 1994 Ed.
Pickett, Diane, Personal Interview, Brown and Root Environmental.
"Tank Owners Brace for Shift to Private UST Coverage,” National Petroleum News, Vol 87, July 1995.
"Underground Tank Owners Seek Some Clarity,” The Business Journal Serving Greater Sacramento, Vol 11, August 15, 1994.
“Musts for UST’s. A Summary of Federal Regulations for Underground Storage Tank Systems, Solid Waste and Emergency Response, 5403W, EPA 510-K-95-002. July 1995.
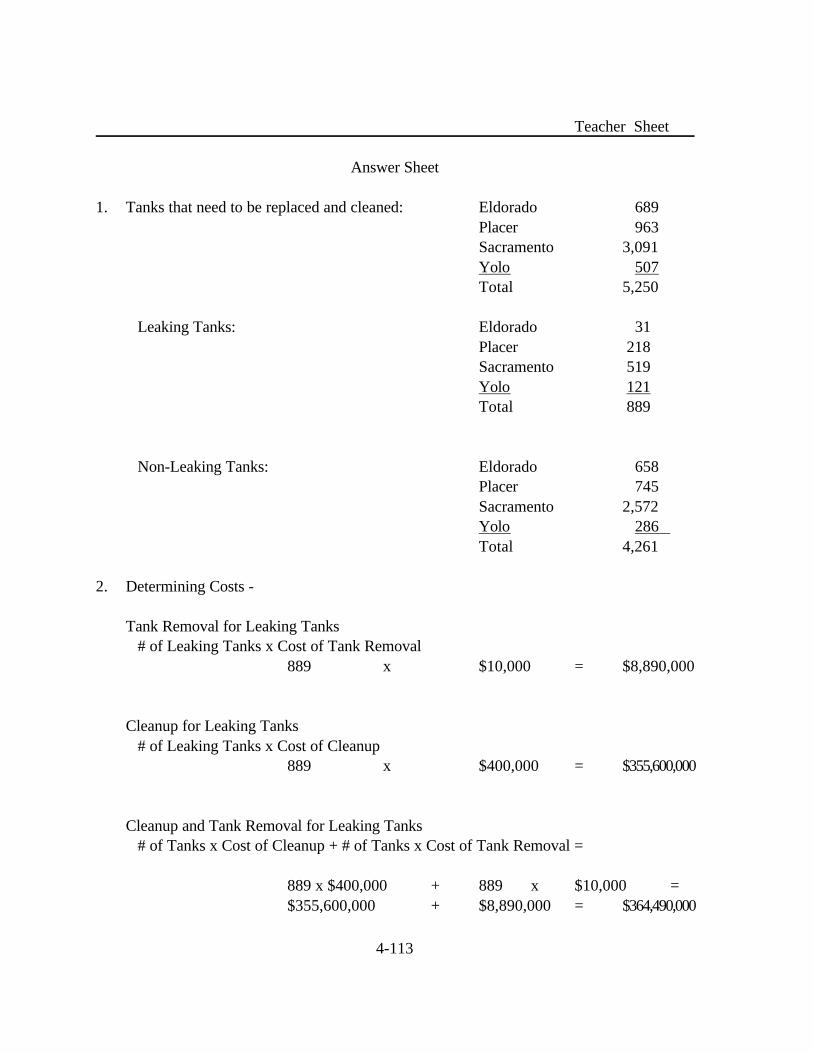
4-113
Teacher Sheet
Answer Sheet
1. Tanks that need to be replaced and cleaned: Eldorado 689Placer 963Sacramento 3,091Yolo 507Total 5,250
Leaking Tanks: Eldorado 31Placer 218Sacramento 519Yolo 121Total 889
Non-Leaking Tanks: Eldorado 658Placer 745Sacramento 2,572Yolo 286Total 4,261
2. Determining Costs -
Tank Removal for Leaking Tanks# of Leaking Tanks x Cost of Tank Removal
889 x $10,000 = $8,890,000
Cleanup for Leaking Tanks# of Leaking Tanks x Cost of Cleanup
889 x $400,000 = $355,600,000
Cleanup and Tank Removal for Leaking Tanks# of Tanks x Cost of Cleanup + # of Tanks x Cost of Tank Removal =
889 x $400,000 + 889 x $10,000 =$355,600,000 + $8,890,000 = $364,490,000
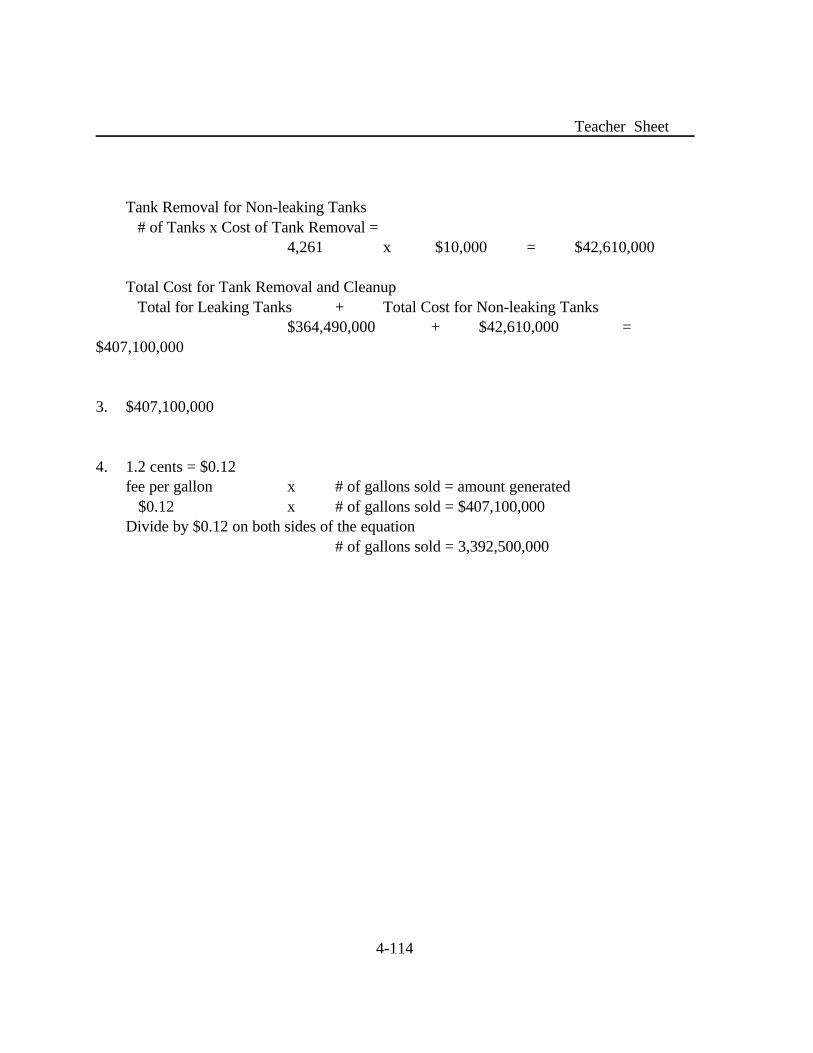
4-114
Teacher Sheet
Tank Removal for Non-leaking Tanks# of Tanks x Cost of Tank Removal =
4,261 x $10,000 = $42,610,000
Total Cost for Tank Removal and CleanupTotal for Leaking Tanks + Total Cost for Non-leaking Tanks
$364,490,000 + $42,610,000 =$407,100,000
3. $407,100,000
4. 1.2 cents = $0.12fee per gallon x # of gallons sold = amount generated $0.12 x # of gallons sold = $407,100,000Divide by $0.12 on both sides of the equation
# of gallons sold = 3,392,500,000
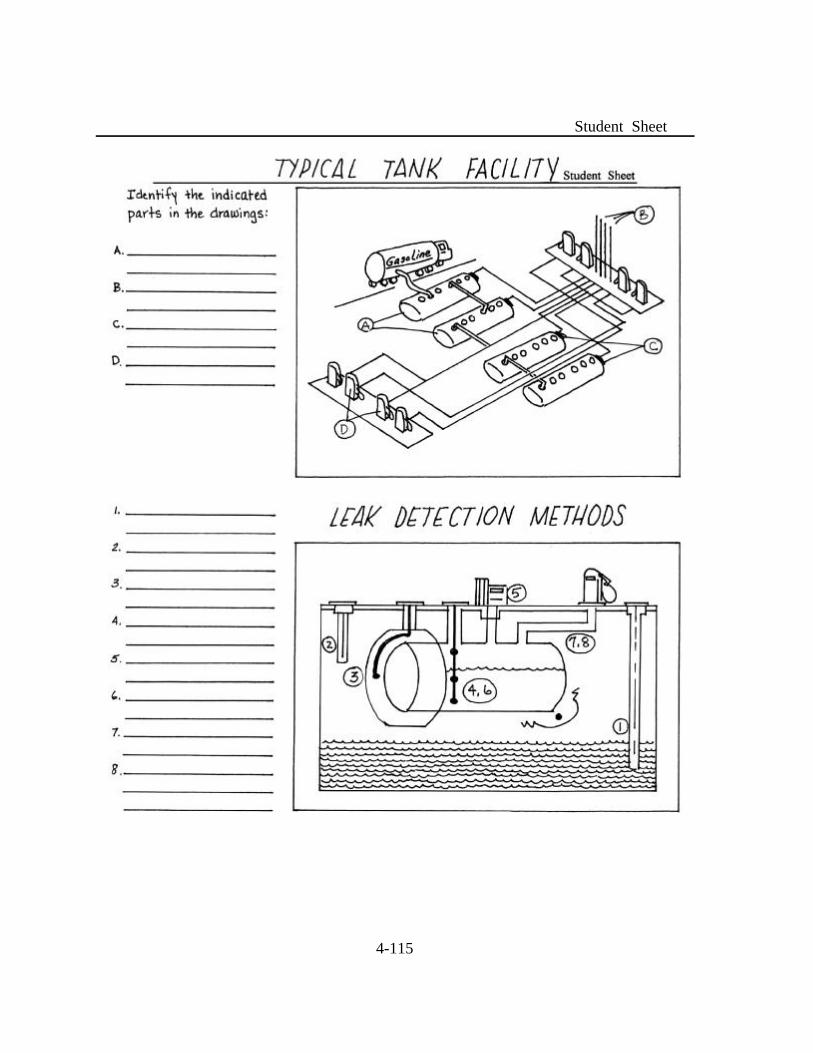
4-115
Student Sheet
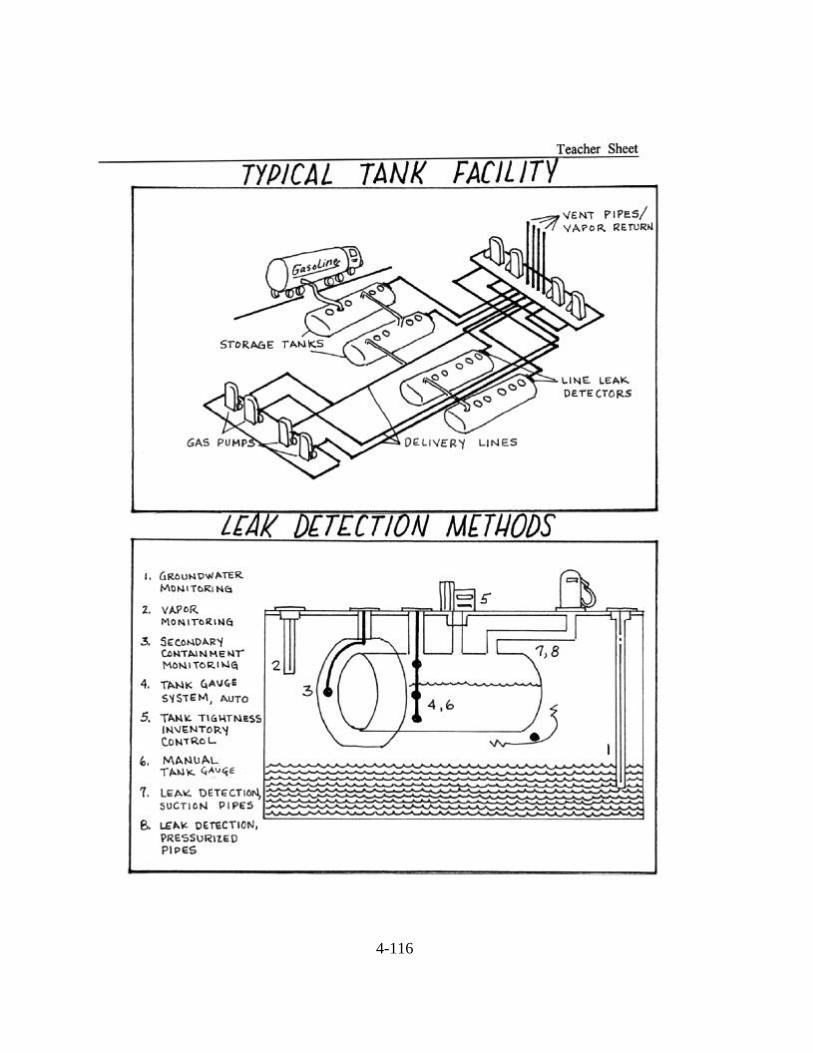
4-116

4-117