Ground Water Scenario Hanumangarh District...
22
GOVERNMENT OF INDIA MINISTRY OF WATER RESOURCES CENTRAL GROUND WATER BOARD Ground Water Scenario Hanumangarh District Rajasthan Western Region, Jaipur 2013
-
Upload
hoangxuyen -
Category
Documents
-
view
219 -
download
1
Transcript of Ground Water Scenario Hanumangarh District...
GOVERNMENT OF INDIA
MINISTRY OF WATER RESOURCES
CENTRAL GROUND WATER BOARD
Ground Water Scenario Hanumangarh District
Rajasthan
Western Region, Jaipur 2013
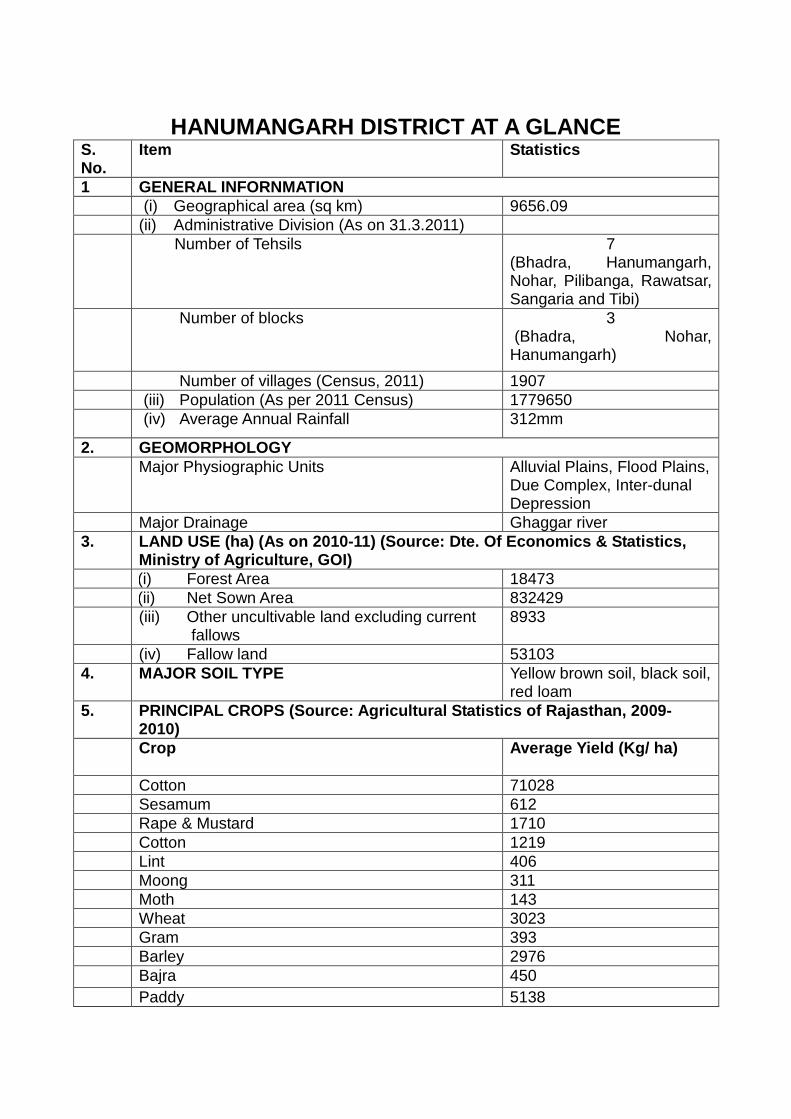
HANUMANGARH DISTRICT AT A GLANCE S. No.
Item Statistics
1 GENERAL INFORNMATION (i) Geographical area (sq km) 9656.09 (ii) Administrative Division (As on 31.3.2011) Number of Tehsils 7
(Bhadra, Hanumangarh, Nohar, Pilibanga, Rawatsar, Sangaria and Tibi)
Number of blocks 3 (Bhadra, Nohar, Hanumangarh)
Number of villages (Census, 2011) 1907 (iii) Population (As per 2011 Census) 1779650 (iv) Average Annual Rainfall 312mm
2. GEOMORPHOLOGY Major Physiographic Units Alluvial Plains, Flood Plains,
Due Complex, Inter-dunal Depression
Major Drainage Ghaggar river 3. LAND USE (ha) (As on 2010-11) (Source: Dte. Of Econ omics & Statistics,
Ministry of Agriculture, GOI) (i) Forest Area 18473 (ii) Net Sown Area 832429 (iii) Other uncultivable land excluding current
fallows 8933
(iv) Fallow land 53103 4. MAJOR SOIL TYPE Yellow brown soil, black soil,
red loam 5. PRINCIPAL CROPS (Source: Agricultural Statistics of Rajasthan, 2009-
2010) Crop Average Yield (Kg/ ha)
Cotton 71028 Sesamum 612 Rape & Mustard 1710 Cotton 1219 Lint 406 Moong 311 Moth 143 Wheat 3023 Gram 393 Barley 2976 Bajra 450 Paddy 5138
ii ii
S. No.
Item Statistics
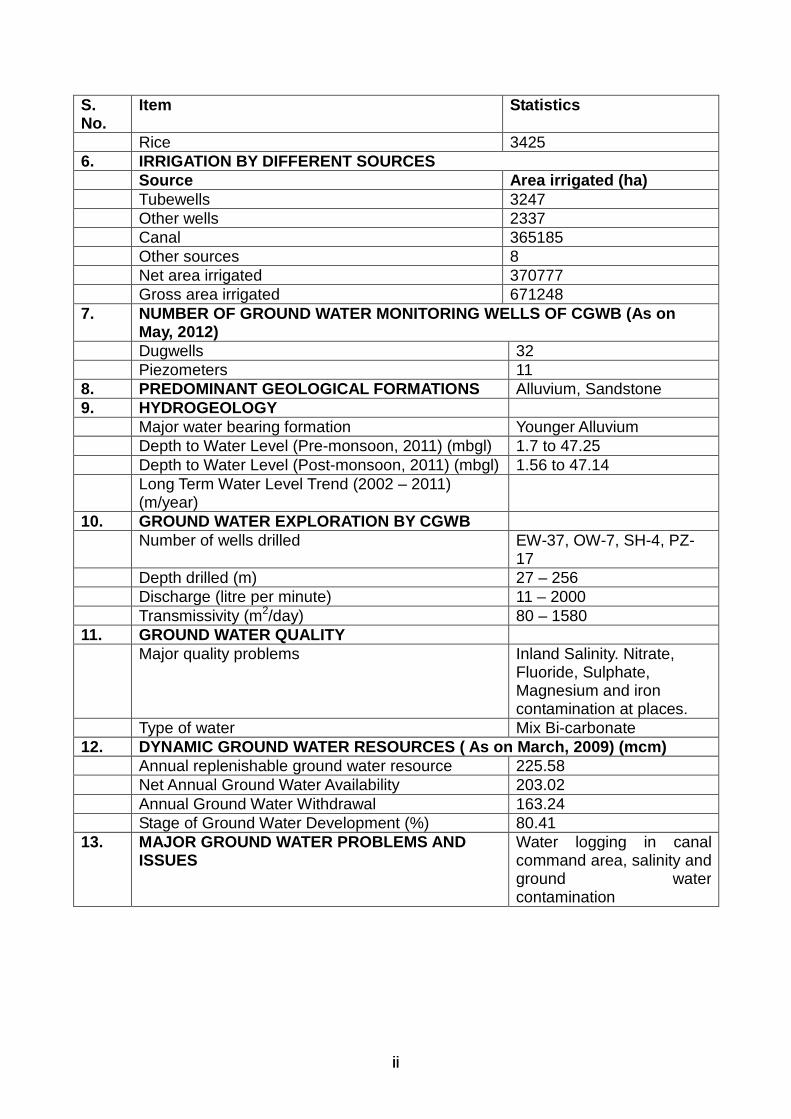
Rice 3425 6. IRRIGATION BY DIFFERENT SOURCES Source Area irrigated (ha) Tubewells 3247 Other wells 2337 Canal 365185 Other sources 8 Net area irrigated 370777 Gross area irrigated 671248 7. NUMBER OF GROUND WATER MONITORING WELLS OF CGWB (As on
May, 2012) Dugwells 32 Piezometers 11 8. PREDOMINANT GEOLOGICAL FORMATIONS Alluvium, Sandstone 9. HYDROGEOLOGY Major water bearing formation Younger Alluvium Depth to Water Level (Pre-monsoon, 2011) (mbgl) 1.7 to 47.25 Depth to Water Level (Post-monsoon, 2011) (mbgl) 1.56 to 47.14 Long Term Water Level Trend (2002 – 2011)
(m/year)
10. GROUND WATER EXPLORATION BY CGWB Number of wells drilled EW-37, OW-7, SH-4, PZ-
17 Depth drilled (m) 27 – 256 Discharge (litre per minute) 11 – 2000 Transmissivity (m2/day) 80 – 1580 11. GROUND WATER QUALITY Major quality problems Inland Salinity. Nitrate,
Fluoride, Sulphate, Magnesium and iron contamination at places.
Type of water Mix Bi-carbonate 12. DYNAMIC GROUND WATER RESOURCES ( As on March, 2009) (mcm) Annual replenishable ground water resource 225.58 Net Annual Ground Water Availability 203.02 Annual Ground Water Withdrawal 163.24 Stage of Ground Water Development (%) 80.41 13. MAJOR GROUND WATER PROBLEMS AND
ISSUES Water logging in canal command area, salinity and ground water contamination
GROUND WATER SCENARIO DISTRICT – HANUMNGARH, RAJASTHAN
Contents
1.0 Introduction....................................... ...........................................1 2.0 Climate and Rainfall ............................... .....................................3 3.0 Geomorphology...................................... .....................................3 4.0 Soils and Irrigation Practices..................... .................................4 5.0 Ground Water Scenario.............................. .................................4 5.1 Geological Framework ............................... ................................................... 4 5.2 Hydrogeological Condition.......................... ................................................. 4 5.3 Depth to Water Level (Pre Monsoon 2011) ............ ...................................... 5 5.4 Depth to Water Level (Post Monsoon 2011) ........... ..................................... 7 5.5 Groundwater Quality ................................ ................................................... 11 5.6 Groundwater Resources.............................. ............................................... 14 6.0 Status of Groundwater Development .................. .....................15 7.0 Urban and Rural Water supply....................... ...........................15 8.0 Ground Water Related Issues & Problems ............. .................15 8.1 Water Logging...................................... ........................................................ 15 8.2 Water Quality Hazard............................... .................................................... 16 9.0 Ground Water Management Strategy ................... ....................16 9.1 Ground Water Development ........................... ............................................ 16 9.2 Well Design ........................................ .......................................................... 16 10.0 Recommendations.................................... .................................16
List of Figures 1. Map of Hanumangarh district showing administrat ive divisions and
locations of exploratory boreholes drilled by Centr al Ground Water Board
2. Hydrogeology of Hanumangarh district 3. Depth to Water Level (May, 2011) 4. Depth to Water Level (November, 2011) 5. Seasonal water level fluctuation map (May – Nov ember, 2011) 6. Decadal water level trend during Pre- monsoon ( May, 2002-May, 2011) 7. Decadal water level trend during Post-monsoon ( November, 2002-
November, 2011) 8. Distribution of Electrical Conductivity, Fluori de and Iron 9. Fluoride distribution in ground water in Hanuma ngarh district 10. Nitrate distribution in ground water in Hanuma ngarh district 11. Distribution of iron in ground water in Hanuma ngarh district
List of Tables 1. Scientific studies undertaken by Central Ground Water Board 2. Salient features of ground water exploration in Hanumangarh district 3. Annual rainfall data of Hanumangarh district du ring the period 2002 to
2011
ii ii
4. Details of various land forms occurring in Hanu mangarh district 5. Block wise details of depth to water level duri ng May, 2011 6. Block wise details of depth to water level dur ing November, 2011 7. Block wise details of water level fluctuation i n Hanumangarh district
(May – November, 2011) 8. Block wise details of decadal water level trend during pre- and post-
monsoon period (2002-2011) 9. Estimates of fresh ground water resources in Ha numangarh district
(As on 2009)
GROUND WATER SCENARIO DISTRICT – HANUMNGARH, RAJASTHAN
1.0 Introduction Hanumangarh district located between latitudes 28°45’35’’ and 29°57’25” N and longitudes 74°17’51” and 75°31’04” is the one of the northern most districts of Rajasthan. Occupying an area of around 9656.09 sq km, the district is surrounded by Churu and Sri Ganganagar districts of Rajasthan, Punjab and Haryana in the south, west, north and east respectively.
For administrative convenience, the district is divided into 7 tehsils and 3 development blocks viz. Bhadra, Hanumangarh, Nohar, Pilibanga, Rawatsar, Sangaria and Tibi Tehsils and Bhadra, Hanumangarh and Nohar blocks. It has a total population of 1774692 as per 2011 Census. The district has 1907 villages and 6 urban towns. Rural and urban population of the district is 14.29 lakh and 3.51 lakh respectively.
Central Ground Water Board has taken up various scientific studies in the district. A list of studies carried out in the district is given in Table 1.
Table 1: Scientific studies undertaken by Central Ground Water Board
S.No. Officer/ Project AAP Type of Study 1. M. Mehta 1971-72 Study on hydrogeological conditions (GSI) 2. O.P. Mathur 1971-72 Study on hydrogeological conditions (GSI) 3. Ghaggar River Basin
Project (UNDP) 1975-78 Water Balance Study
4. Dr. Ratesh Kumar 1983-84 Systematic Hydrogeological Survey 5. R.P. Mathur 1983-84 Systematic Hydrogeological Survey 6. Abrar Hussain 1984-85 Reappraisal Hydrogeological Survey 7. Suresh Kumar 1984-85 Reappraisal Hydrogeological Survey 8. S.C. Dhiman 1984-85 Reappraisal Hydrogeological Survey 9. Suresh Kumar 1985-86 Reappraisal Hydrogeological Survey 10. S.K. Jain 1984-85 Conjunctive use studies 11. CGWB 1992-95 Conjunctive use studies
The report on Hydrogeology of the district has been brought out by Central Ground Water Board in the year 2005. Since 1973, ground water regime monitoring is being regularly monitored by Central Ground Water Board carried out on regional scale. Ground water levels are monitored from a network of 43 observation wells. Water levels are monitored four times in a year during the months of January, May, August and November. Samples for water quality analyses are collected during May.
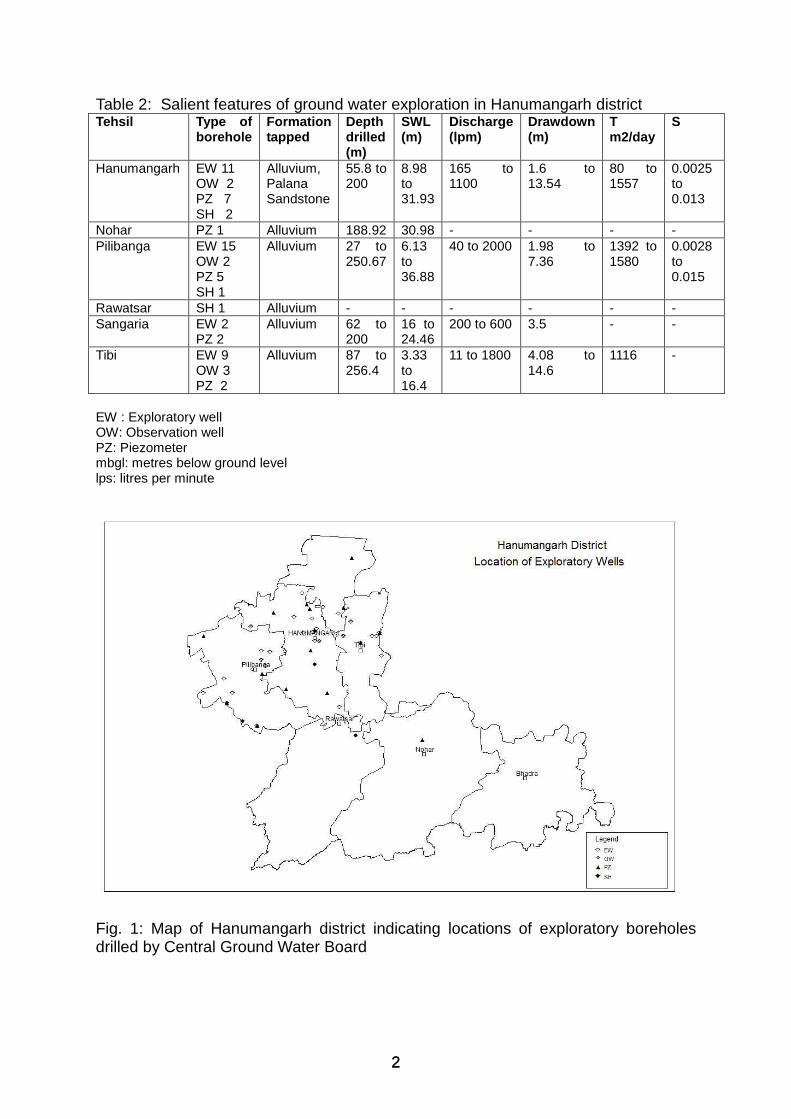
Under Ground Water Exploration Programme, 65 exploratory boreholes (37EW+7OW+4SH+17PZ) have been drilled as on March, 2011. Salient features of ground water exploration are listed in Table 2. A map of the district showing block boundaries and locations of exploratory boreholes is presented in Fig. 1.
2 2
Table 2: Salient features of ground water exploration in Hanumangarh district Tehsil Type of
borehole Formation tapped
Depth drilled (m)
SWL (m)
Discharge (lpm)
Drawdown (m)
T m2/day
S
Hanumangarh EW 11 OW 2 PZ 7 SH 2
Alluvium, Palana Sandstone
55.8 to 200
8.98 to 31.93
165 to 1100
1.6 to 13.54
80 to 1557
0.0025 to 0.013
Nohar PZ 1 Alluvium 188.92 30.98 - - - - Pilibanga EW 15
OW 2 PZ 5 SH 1
Alluvium 27 to 250.67
6.13 to 36.88
40 to 2000 1.98 to 7.36
1392 to 1580
0.0028 to 0.015
Rawatsar SH 1 Alluvium - - - - - - Sangaria EW 2
PZ 2 Alluvium 62 to
200 16 to 24.46
200 to 600 3.5 - -
Tibi EW 9 OW 3 PZ 2
Alluvium 87 to 256.4
3.33 to 16.4
11 to 1800 4.08 to 14.6
1116 -
EW : Exploratory well OW: Observation well PZ: Piezometer mbgl: metres below ground level lps: litres per minute
Fig. 1: Map of Hanumangarh district indicating locations of exploratory boreholes drilled by Central Ground Water Board
3 3
2.0 Climate and Rainfall The climate of the district is semi-arid to arid except southwest monsoon season during the period June to mid of September, which is followed by post monsoon period till the end of November. The winter season is from December to February and is followed by summer from March to June. The mean daily maximum temperature varies from 20.5°C during January to 42.2°C during June while mean daily minimum temperature in the district varies from 4.7°C during January to 28.1°C during July.
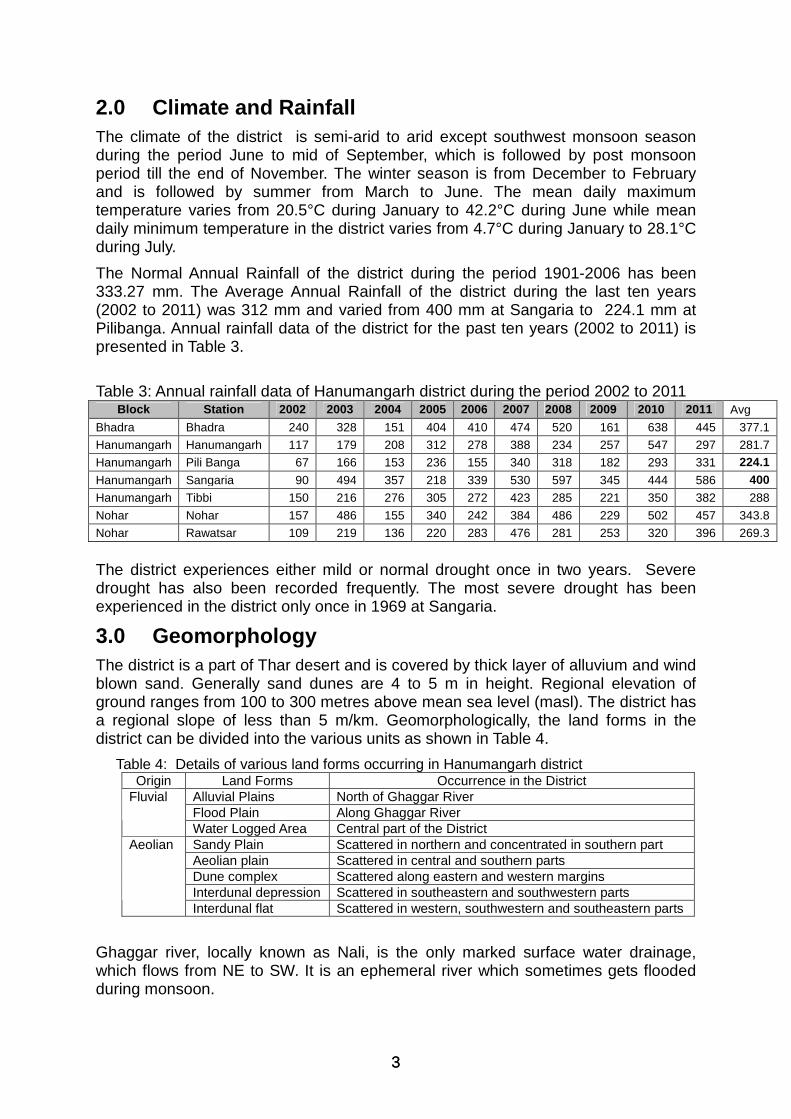
The Normal Annual Rainfall of the district during the period 1901-2006 has been 333.27 mm. The Average Annual Rainfall of the district during the last ten years (2002 to 2011) was 312 mm and varied from 400 mm at Sangaria to 224.1 mm at Pilibanga. Annual rainfall data of the district for the past ten years (2002 to 2011) is presented in Table 3.
Table 3: Annual rainfall data of Hanumangarh district during the period 2002 to 2011
Block Station 2002 2003 2004 2005 2006 2007 2008 2009 2010 2011 Avg
Bhadra Bhadra 240 328 151 404 410 474 520 161 638 445 377.1
Hanumangarh Hanumangarh 117 179 208 312 278 388 234 257 547 297 281.7
Hanumangarh Pili Banga 67 166 153 236 155 340 318 182 293 331 224.1
Hanumangarh Sangaria 90 494 357 218 339 530 597 345 444 586 400
Hanumangarh Tibbi 150 216 276 305 272 423 285 221 350 382 288
Nohar Nohar 157 486 155 340 242 384 486 229 502 457 343.8
Nohar Rawatsar 109 219 136 220 283 476 281 253 320 396 269.3
The district experiences either mild or normal drought once in two years. Severe drought has also been recorded frequently. The most severe drought has been experienced in the district only once in 1969 at Sangaria.
3.0 Geomorphology The district is a part of Thar desert and is covered by thick layer of alluvium and wind blown sand. Generally sand dunes are 4 to 5 m in height. Regional elevation of ground ranges from 100 to 300 metres above mean sea level (masl). The district has a regional slope of less than 5 m/km. Geomorphologically, the land forms in the district can be divided into the various units as shown in Table 4.
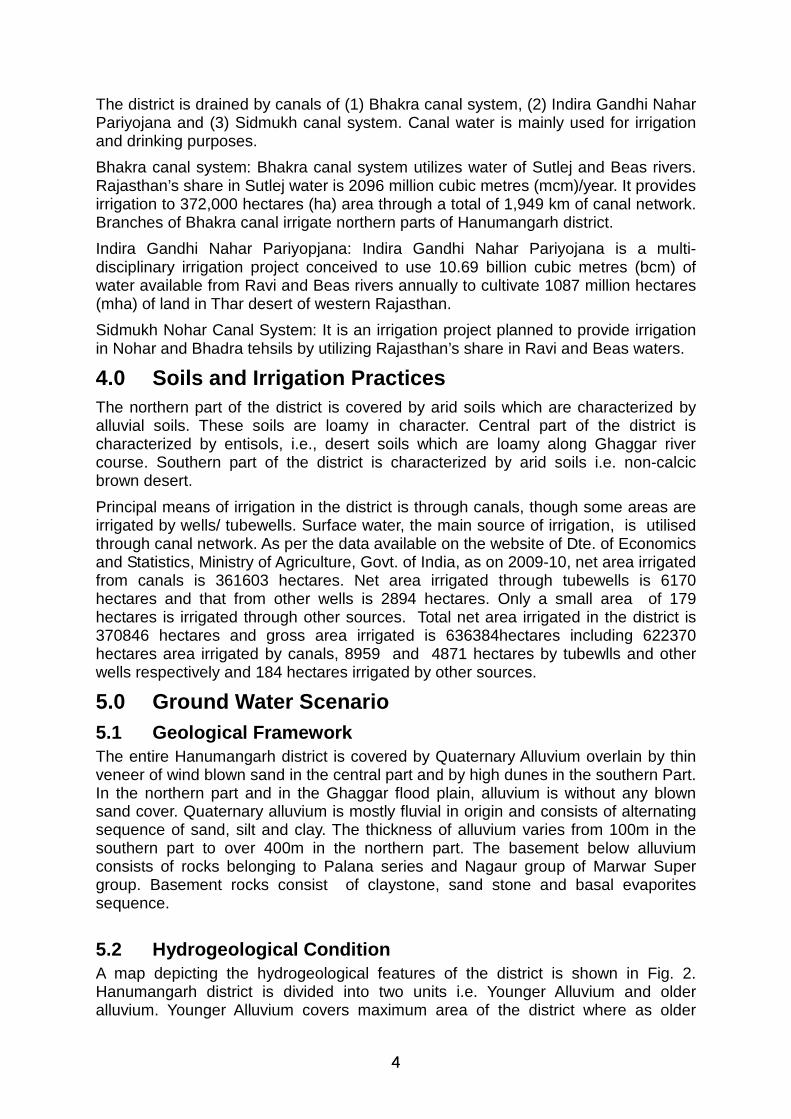
Table 4: Details of various land forms occurring in Hanumangarh district Origin Land Forms Occurrence in the District
Alluvial Plains North of Ghaggar River Flood Plain Along Ghaggar River
Fluvial
Water Logged Area Central part of the District Sandy Plain Scattered in northern and concentrated in southern part Aeolian plain Scattered in central and southern parts Dune complex Scattered along eastern and western margins Interdunal depression Scattered in southeastern and southwestern parts
Aeolian
Interdunal flat Scattered in western, southwestern and southeastern parts
Ghaggar river, locally known as Nali, is the only marked surface water drainage, which flows from NE to SW. It is an ephemeral river which sometimes gets flooded during monsoon.
4 4
The district is drained by canals of (1) Bhakra canal system, (2) Indira Gandhi Nahar Pariyojana and (3) Sidmukh canal system. Canal water is mainly used for irrigation and drinking purposes.
Bhakra canal system: Bhakra canal system utilizes water of Sutlej and Beas rivers. Rajasthan’s share in Sutlej water is 2096 million cubic metres (mcm)/year. It provides irrigation to 372,000 hectares (ha) area through a total of 1,949 km of canal network. Branches of Bhakra canal irrigate northern parts of Hanumangarh district.
Indira Gandhi Nahar Pariyopjana: Indira Gandhi Nahar Pariyojana is a multi-disciplinary irrigation project conceived to use 10.69 billion cubic metres (bcm) of water available from Ravi and Beas rivers annually to cultivate 1087 million hectares (mha) of land in Thar desert of western Rajasthan.
Sidmukh Nohar Canal System: It is an irrigation project planned to provide irrigation in Nohar and Bhadra tehsils by utilizing Rajasthan’s share in Ravi and Beas waters.
4.0 Soils and Irrigation Practices The northern part of the district is covered by arid soils which are characterized by alluvial soils. These soils are loamy in character. Central part of the district is characterized by entisols, i.e., desert soils which are loamy along Ghaggar river course. Southern part of the district is characterized by arid soils i.e. non-calcic brown desert.
Principal means of irrigation in the district is through canals, though some areas are irrigated by wells/ tubewells. Surface water, the main source of irrigation, is utilised through canal network. As per the data available on the website of Dte. of Economics and Statistics, Ministry of Agriculture, Govt. of India, as on 2009-10, net area irrigated from canals is 361603 hectares. Net area irrigated through tubewells is 6170 hectares and that from other wells is 2894 hectares. Only a small area of 179 hectares is irrigated through other sources. Total net area irrigated in the district is 370846 hectares and gross area irrigated is 636384hectares including 622370 hectares area irrigated by canals, 8959 and 4871 hectares by tubewlls and other wells respectively and 184 hectares irrigated by other sources.
5.0 Ground Water Scenario 5.1 Geological Framework The entire Hanumangarh district is covered by Quaternary Alluvium overlain by thin veneer of wind blown sand in the central part and by high dunes in the southern Part. In the northern part and in the Ghaggar flood plain, alluvium is without any blown sand cover. Quaternary alluvium is mostly fluvial in origin and consists of alternating sequence of sand, silt and clay. The thickness of alluvium varies from 100m in the southern part to over 400m in the northern part. The basement below alluvium consists of rocks belonging to Palana series and Nagaur group of Marwar Super group. Basement rocks consist of claystone, sand stone and basal evaporites sequence.
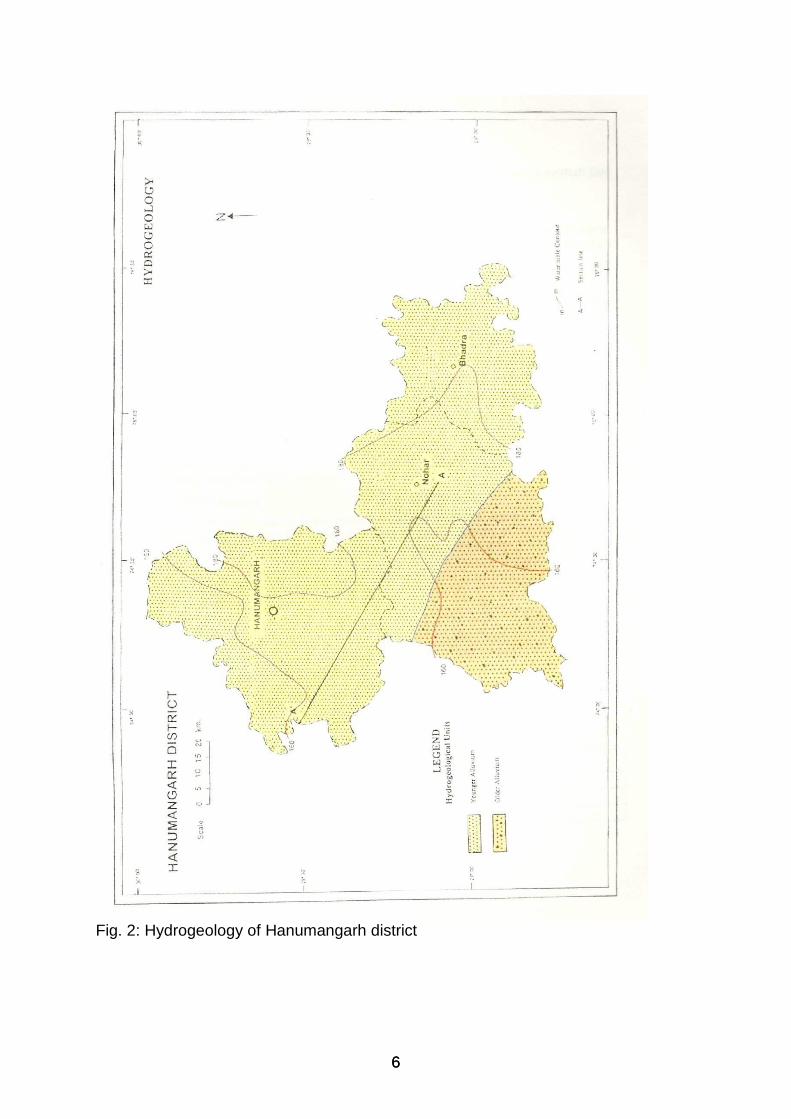
5.2 Hydrogeological Condition A map depicting the hydrogeological features of the district is shown in Fig. 2. Hanumangarh district is divided into two units i.e. Younger Alluvium and older alluvium. Younger Alluvium covers maximum area of the district where as older
5 5
alluvium occurs only in the southern part of the district. The ground water in the district occurs under water table condition but at a few places, it also occurs under semi-confined conditions due to presence of over lying impermeable clay horizons.
Younger Alluvium: It comprises of unconsolidated to loosely consolidated sediments of sand silt, clay and kankar. It forms the principal aquifer and all potential zones fall in this hydrogeological unit. Almost all tehsils have younger alluvial formation except Rawatsar.
Older Alluvium: It comprises of sandy and gypseous clay with kankar. It occurs in the southern parts of the district. The older alluvium does not contain any potential zone.
Aquifer Parameters: Based on groundwater exploration, transmissivity of the aquifer has been estimated to vary from 80 m2/day to 1600m2/day. Transmissivity and permeability values are higher around Ghaggar Flood plain area and decrease away from it. Average yield of dug wells and dug-cum bore wells/ tube wells in younger alluvium is 20,000 and 3,00,000 litres per day.
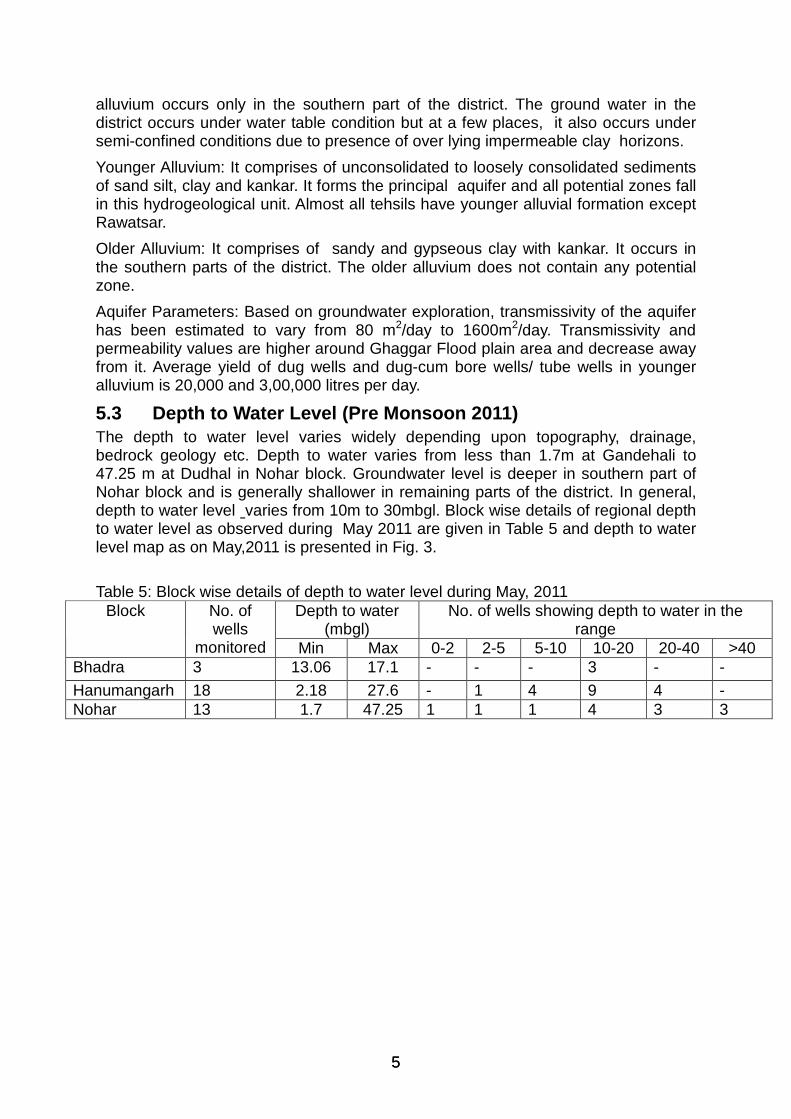
5.3 Depth to Water Level (Pre Monsoon 2011) The depth to water level varies widely depending upon topography, drainage, bedrock geology etc. Depth to water varies from less than 1.7m at Gandehali to 47.25 m at Dudhal in Nohar block. Groundwater level is deeper in southern part of Nohar block and is generally shallower in remaining parts of the district. In general, depth to water level varies from 10m to 30mbgl. Block wise details of regional depth to water level as observed during May 2011 are given in Table 5 and depth to water level map as on May,2011 is presented in Fig. 3.
Table 5: Block wise details of depth to water level during May, 2011
Depth to water (mbgl)
No. of wells showing depth to water in the range
Block No. of wells
monitored Min Max 0-2 2-5 5-10 10-20 20-40 >40 Bhadra 3 13.06 17.1 - - - 3 - -
Hanumangarh 18 2.18 27.6 - 1 4 9 4 - Nohar 13 1.7 47.25 1 1 1 4 3 3
6 6
Fig. 2: Hydrogeology of Hanumangarh district
7 7
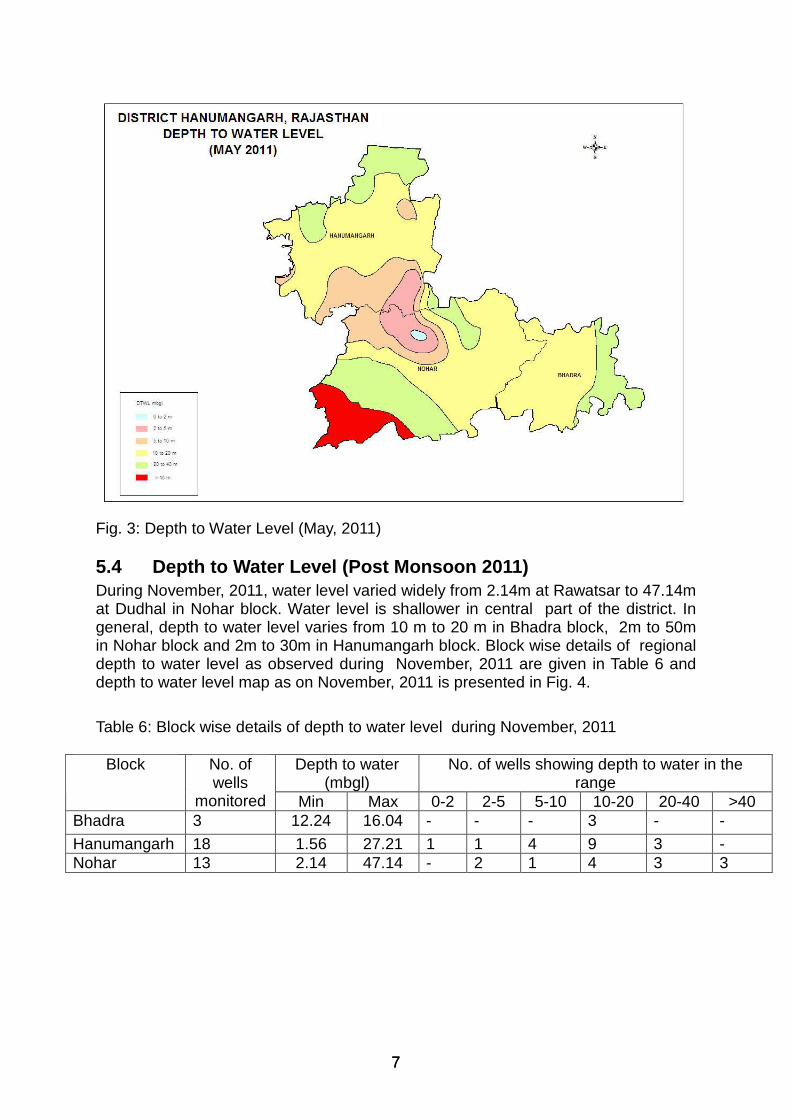
Fig. 3: Depth to Water Level (May, 2011) 5.4 Depth to Water Level (Post Monsoon 2011) During November, 2011, water level varied widely from 2.14m at Rawatsar to 47.14m at Dudhal in Nohar block. Water level is shallower in central part of the district. In general, depth to water level varies from 10 m to 20 m in Bhadra block, 2m to 50m in Nohar block and 2m to 30m in Hanumangarh block. Block wise details of regional depth to water level as observed during November, 2011 are given in Table 6 and depth to water level map as on November, 2011 is presented in Fig. 4.
Table 6: Block wise details of depth to water level during November, 2011
Depth to water (mbgl)
No. of wells showing depth to water in the range
Block No. of wells
monitored Min Max 0-2 2-5 5-10 10-20 20-40 >40 Bhadra 3 12.24 16.04 - - - 3 - -
Hanumangarh 18 1.56 27.21 1 1 4 9 3 - Nohar 13 2.14 47.14 - 2 1 4 3 3
8 8
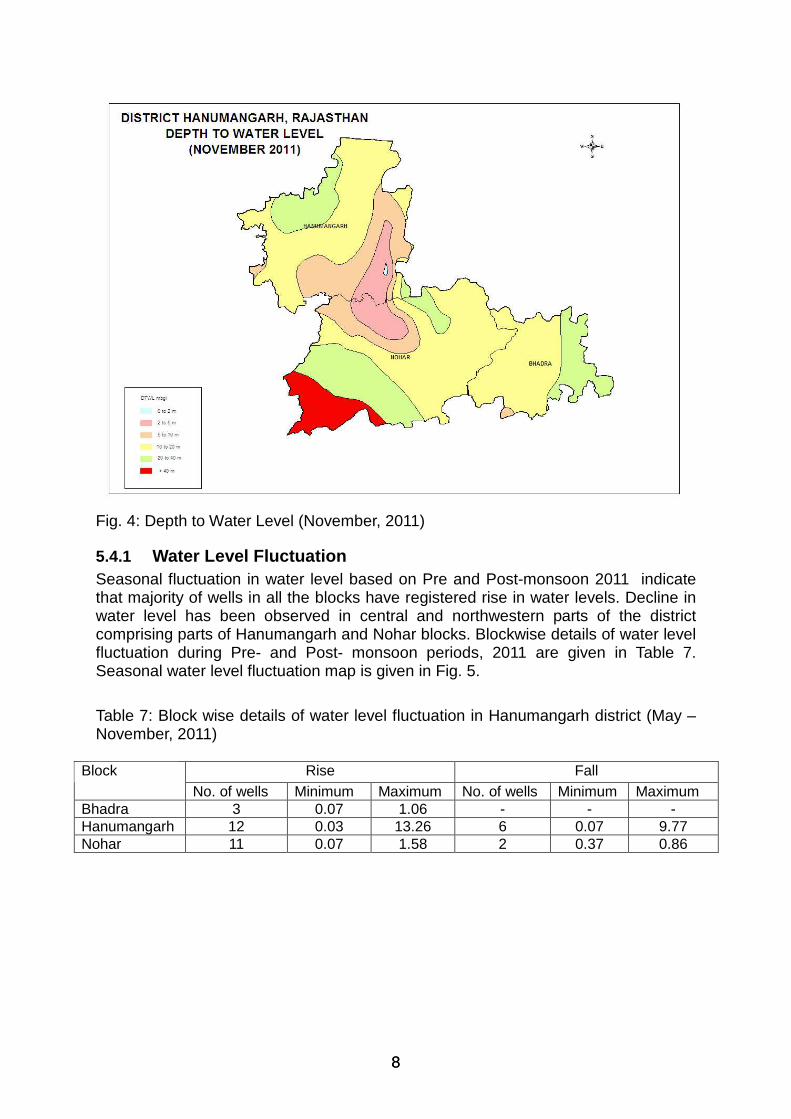
Fig. 4: Depth to Water Level (November, 2011)
5.4.1 Water Level Fluctuation Seasonal fluctuation in water level based on Pre and Post-monsoon 2011 indicate that majority of wells in all the blocks have registered rise in water levels. Decline in water level has been observed in central and northwestern parts of the district comprising parts of Hanumangarh and Nohar blocks. Blockwise details of water level fluctuation during Pre- and Post- monsoon periods, 2011 are given in Table 7. Seasonal water level fluctuation map is given in Fig. 5.
Table 7: Block wise details of water level fluctuation in Hanumangarh district (May – November, 2011)
Rise Fall Block No. of wells Minimum Maximum No. of wells Minimum Maximum
Bhadra 3 0.07 1.06 - - - Hanumangarh 12 0.03 13.26 6 0.07 9.77 Nohar 11 0.07 1.58 2 0.37 0.86
9 9
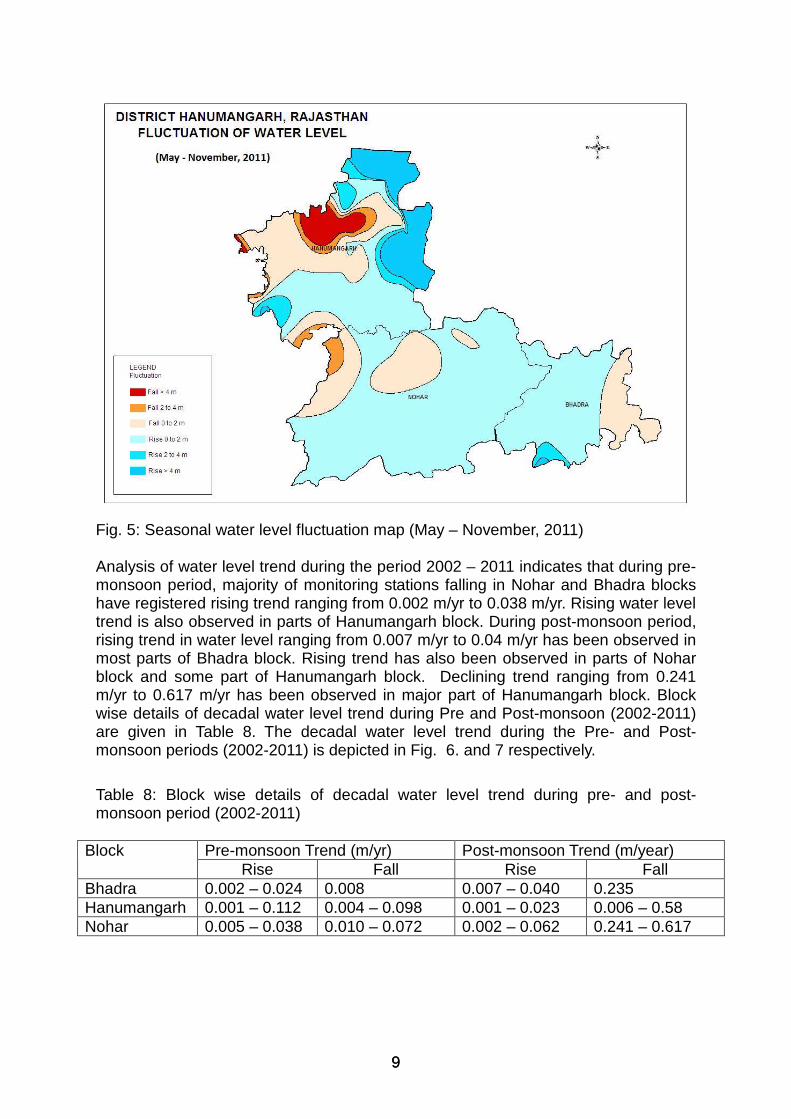
Fig. 5: Seasonal water level fluctuation map (May – November, 2011) Analysis of water level trend during the period 2002 – 2011 indicates that during pre-monsoon period, majority of monitoring stations falling in Nohar and Bhadra blocks have registered rising trend ranging from 0.002 m/yr to 0.038 m/yr. Rising water level trend is also observed in parts of Hanumangarh block. During post-monsoon period, rising trend in water level ranging from 0.007 m/yr to 0.04 m/yr has been observed in most parts of Bhadra block. Rising trend has also been observed in parts of Nohar block and some part of Hanumangarh block. Declining trend ranging from 0.241 m/yr to 0.617 m/yr has been observed in major part of Hanumangarh block. Block wise details of decadal water level trend during Pre and Post-monsoon (2002-2011) are given in Table 8. The decadal water level trend during the Pre- and Post-monsoon periods (2002-2011) is depicted in Fig. 6. and 7 respectively.
Table 8: Block wise details of decadal water level trend during pre- and post- monsoon period (2002-2011)
Pre-monsoon Trend (m/yr) Post-monsoon Trend (m/year) Block Rise Fall Rise Fall
Bhadra 0.002 – 0.024 0.008 0.007 – 0.040 0.235 Hanumangarh 0.001 – 0.112 0.004 – 0.098 0.001 – 0.023 0.006 – 0.58 Nohar 0.005 – 0.038 0.010 – 0.072 0.002 – 0.062 0.241 – 0.617
10 10
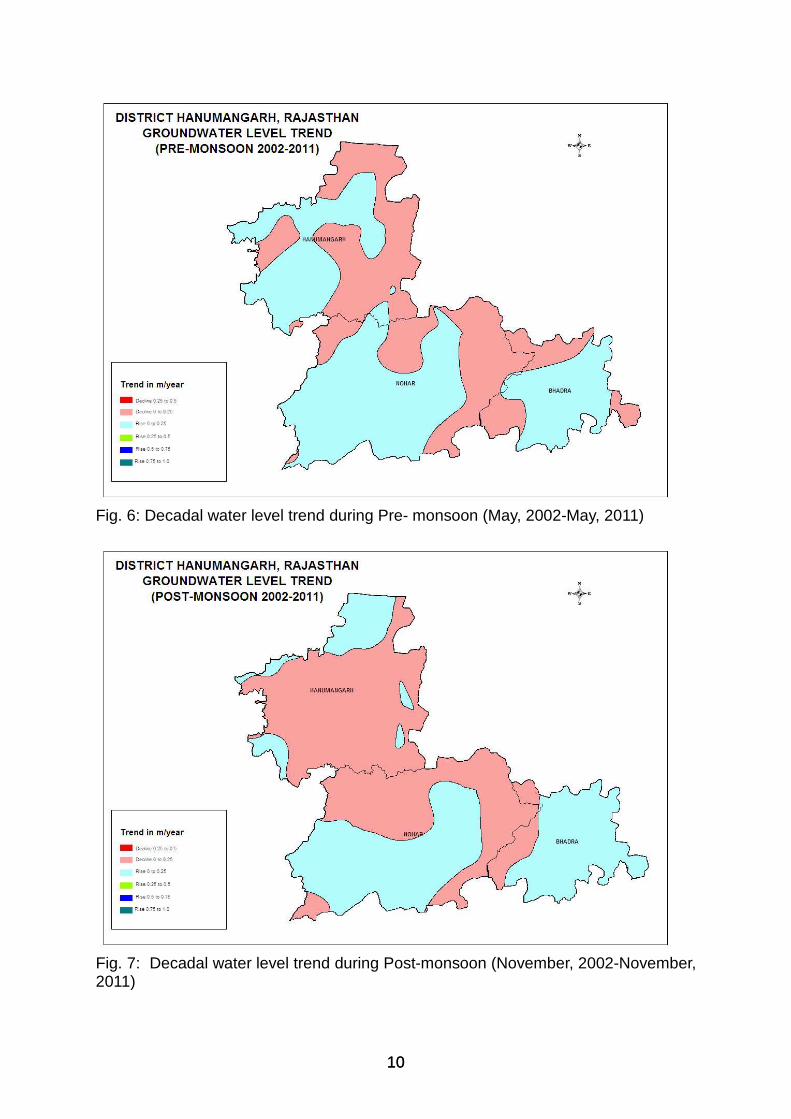
Fig. 6: Decadal water level trend during Pre- monsoon (May, 2002-May, 2011)
Fig. 7: Decadal water level trend during Post-monsoon (November, 2002-November, 2011)
11 11
5.5 Groundwater Quality
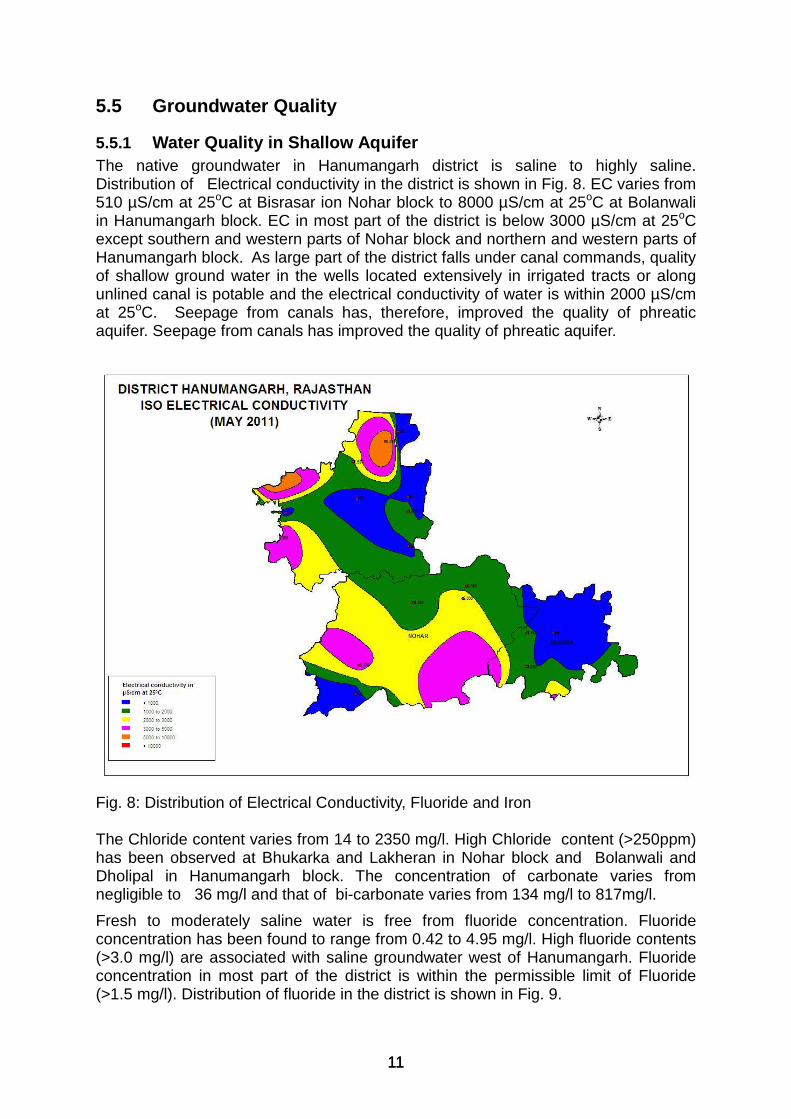
5.5.1 Water Quality in Shallow Aquifer The native groundwater in Hanumangarh district is saline to highly saline. Distribution of Electrical conductivity in the district is shown in Fig. 8. EC varies from 510 µS/cm at 25oC at Bisrasar ion Nohar block to 8000 µS/cm at 25oC at Bolanwali in Hanumangarh block. EC in most part of the district is below 3000 µS/cm at 25oC except southern and western parts of Nohar block and northern and western parts of Hanumangarh block. As large part of the district falls under canal commands, quality of shallow ground water in the wells located extensively in irrigated tracts or along unlined canal is potable and the electrical conductivity of water is within 2000 µS/cm at 25oC. Seepage from canals has, therefore, improved the quality of phreatic aquifer. Seepage from canals has improved the quality of phreatic aquifer.
Fig. 8: Distribution of Electrical Conductivity, Fluoride and Iron The Chloride content varies from 14 to 2350 mg/l. High Chloride content (>250ppm) has been observed at Bhukarka and Lakheran in Nohar block and Bolanwali and Dholipal in Hanumangarh block. The concentration of carbonate varies from negligible to 36 mg/l and that of bi-carbonate varies from 134 mg/l to 817mg/l.
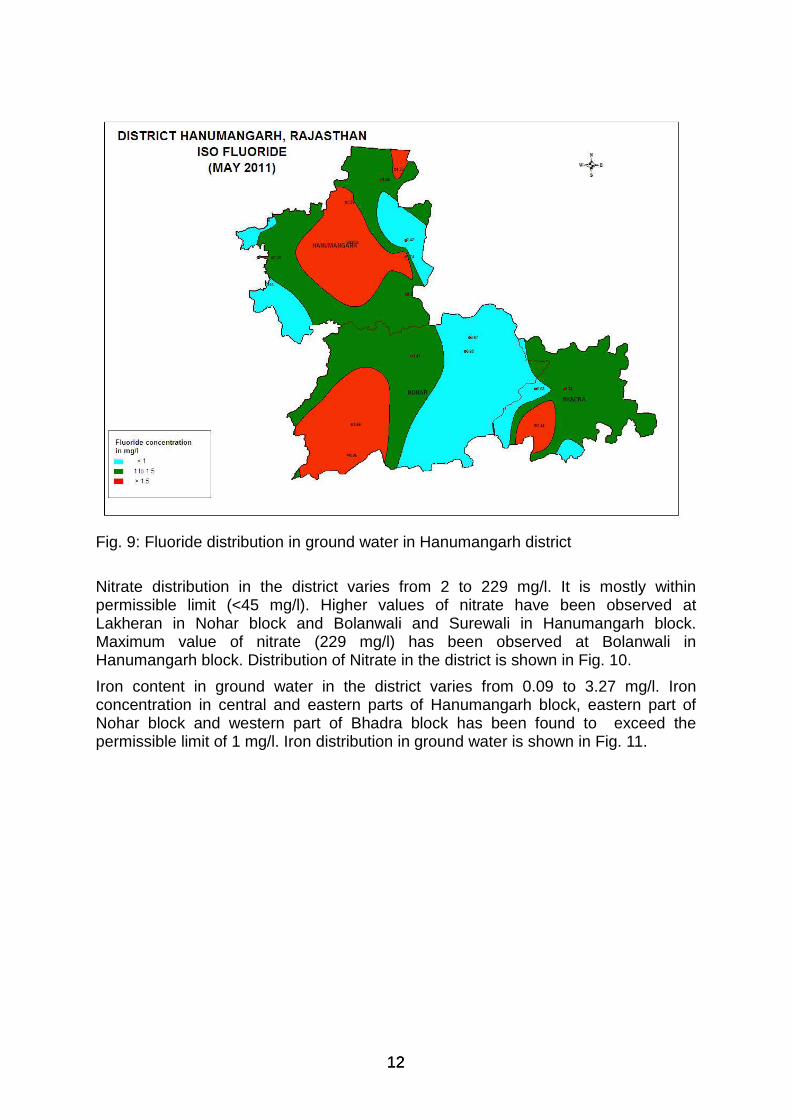
Fresh to moderately saline water is free from fluoride concentration. Fluoride concentration has been found to range from 0.42 to 4.95 mg/l. High fluoride contents (>3.0 mg/l) are associated with saline groundwater west of Hanumangarh. Fluoride concentration in most part of the district is within the permissible limit of Fluoride (>1.5 mg/l). Distribution of fluoride in the district is shown in Fig. 9.
12 12
Fig. 9: Fluoride distribution in ground water in Hanumangarh district
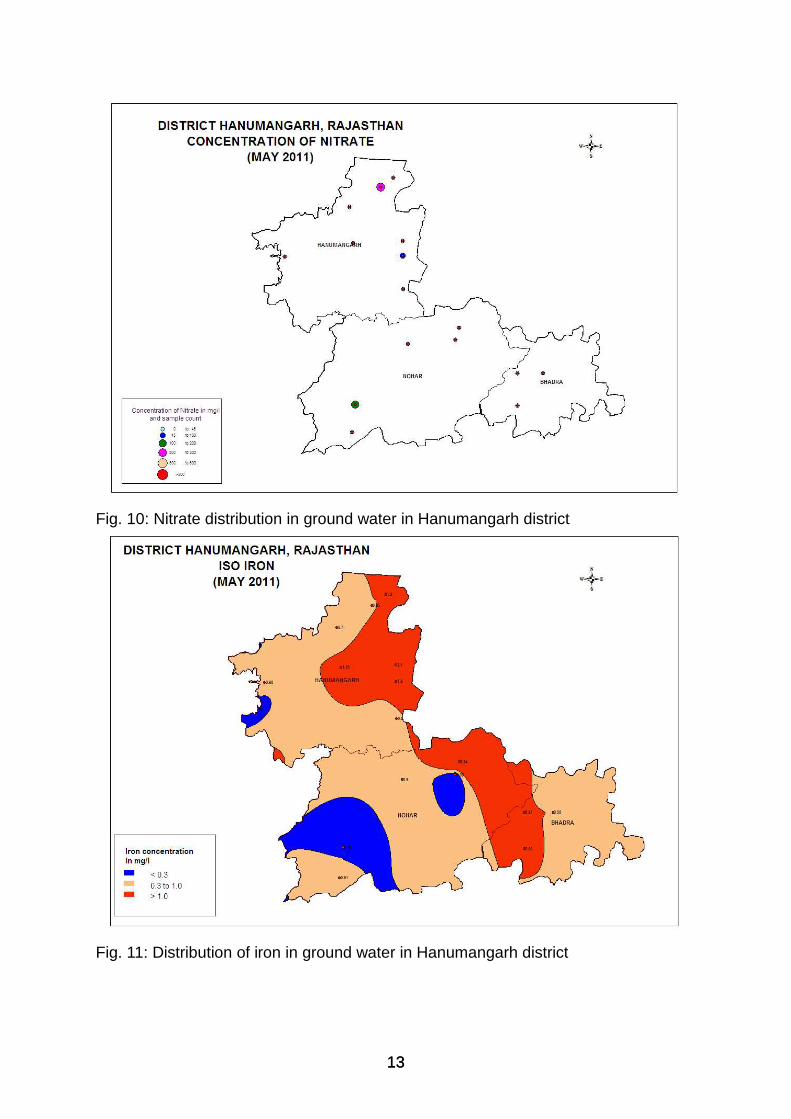
Nitrate distribution in the district varies from 2 to 229 mg/l. It is mostly within permissible limit (<45 mg/l). Higher values of nitrate have been observed at Lakheran in Nohar block and Bolanwali and Surewali in Hanumangarh block. Maximum value of nitrate (229 mg/l) has been observed at Bolanwali in Hanumangarh block. Distribution of Nitrate in the district is shown in Fig. 10.
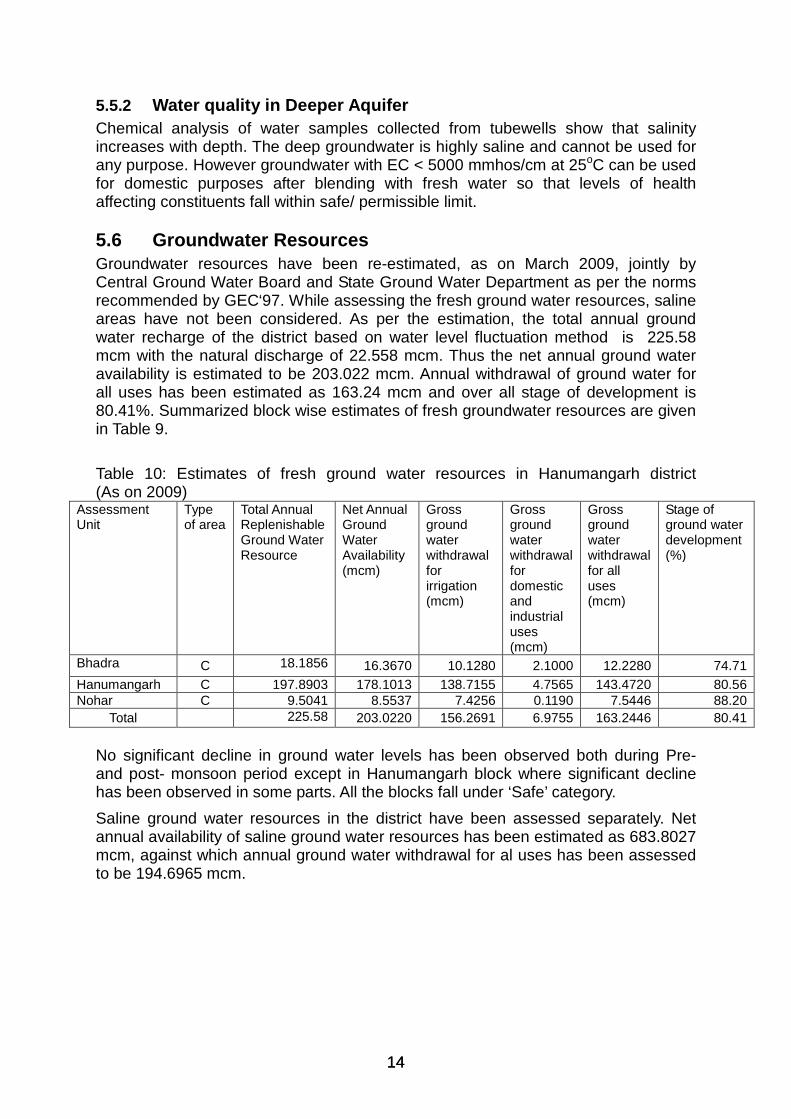
Iron content in ground water in the district varies from 0.09 to 3.27 mg/l. Iron concentration in central and eastern parts of Hanumangarh block, eastern part of Nohar block and western part of Bhadra block has been found to exceed the permissible limit of 1 mg/l. Iron distribution in ground water is shown in Fig. 11.
13 13
Fig. 10: Nitrate distribution in ground water in Hanumangarh district
Fig. 11: Distribution of iron in ground water in Hanumangarh district
14 14
5.5.2 Water quality in Deeper Aquifer Chemical analysis of water samples collected from tubewells show that salinity increases with depth. The deep groundwater is highly saline and cannot be used for any purpose. However groundwater with EC < 5000 mmhos/cm at 25oC can be used for domestic purposes after blending with fresh water so that levels of health affecting constituents fall within safe/ permissible limit. 5.6 Groundwater Resources Groundwater resources have been re-estimated, as on March 2009, jointly by Central Ground Water Board and State Ground Water Department as per the norms recommended by GEC‘97. While assessing the fresh ground water resources, saline areas have not been considered. As per the estimation, the total annual ground water recharge of the district based on water level fluctuation method is 225.58 mcm with the natural discharge of 22.558 mcm. Thus the net annual ground water availability is estimated to be 203.022 mcm. Annual withdrawal of ground water for all uses has been estimated as 163.24 mcm and over all stage of development is 80.41%. Summarized block wise estimates of fresh groundwater resources are given in Table 9.
Table 10: Estimates of fresh ground water resources in Hanumangarh district (As on 2009)
Assessment Unit
Type of area
Total Annual Replenishable Ground Water Resource
Net Annual Ground Water Availability (mcm)
Gross ground water withdrawal for irrigation (mcm)
Gross ground water withdrawal for domestic and industrial uses (mcm)
Gross ground water withdrawal for all uses (mcm)
Stage of ground water development (%)
Bhadra C 18.1856 16.3670 10.1280 2.1000 12.2280 74.71 Hanumangarh C 197.8903 178.1013 138.7155 4.7565 143.4720 80.56 Nohar C 9.5041 8.5537 7.4256 0.1190 7.5446 88.20
Total 225.58 203.0220 156.2691 6.9755 163.2446 80.41 No significant decline in ground water levels has been observed both during Pre- and post- monsoon period except in Hanumangarh block where significant decline has been observed in some parts. All the blocks fall under ‘Safe’ category.
Saline ground water resources in the district have been assessed separately. Net annual availability of saline ground water resources has been estimated as 683.8027 mcm, against which annual ground water withdrawal for al uses has been assessed to be 194.6965 mcm.
15 15
6.0 Status of Groundwater Development The principal aquifer in the district is alluvium comprising sand, silt, clay, and gravel. Its thickness varies from 100m to 400m. The bed rock below alluvium consists of Palana or Nagaur series of rocks, which do not outcrop anywhere in the district. Groundwater occurs both under water table and confined conditions.
Shallow Water Table Aquifer: The thickness of water table aquifer varies from a few meters to about 80m. Depth to water level varies from near surface to about 50m, being 20m in Ghaggar flood plain. Dug wells tapping the water table aquifer in Hanumangarh district range in depth from 10m to 25m with drilling to an additional 40m tapping deeper semi-confined aquifer.
Deeper Confined Aquifer: CGWB has carried out ground water in Hanumangarh district. Confined aquifer is found both in alluvium and under lying Palana and Nagaur sandstone. The first confined aquifer is encountered at depths ranging from 90 to 100m.
Yield of Wells: The yield of dug-cum-bore wells is reported to be between 42 to 110 m3/hr. The yield from tube wells is about 7 to 70m3/hr. Transmissivity of aquifer varies from 100 to 1600 m2/day, reaching maximum in Ghaggar flood plain.
7.0 Urban and Rural Water supply Since the native groundwater of entire district is brackish to saline except in small pockets, the urban and rural water supply schemes primarily depend upon surface water source. Maximum requirement is fulfilled from surface water supply through Bhakra canal and Indira Gandhi canal system. Urban areas of Hanumangarh and Pilibanga have water supply schemes from groundwater. Rest of urban areas i.e. Sangaria, Nohar, Bhadra, and Rawatsar entirely depend upon surface water source.
8.0 Ground Water Related Issues & Problems 8.1 Water Logging Natural inter-dunal depressions located in the west of Hanumangarh district are used to store excess floodwaters of Ghaggar river. As the depressions are filled with water, the area around depression experiences a sudden rise in ground water level causing wide spread water logging condition. The specific areas affected by water logging are west and southwest of Baropal, southeast and southwest of Manaktheri, southeast of Rangmahal, southwest of Kalanwali Dhani.
Impounding of Ghaggar flood water in natural depression is the main cause of water logging. The physiographic situation of these villages is such that villages in this belt are located at lower altitude than the depression, which creates a steep gradient and sand dunes being pervious, cause heavy seepage which results in water logging conditions in surrounding areas. The unlined canals from the saddles have further added to the problem.
Study on conjunctive use of surface and ground water was undertaken by CGWB in IGNP Stage I during 1992-1995. The following recommendations were made:
• To mitigate the problem of water logging, ground water development should be 18% of canal water release at the head.
• A total of 10.023 shallow tube wells be constructed in the command area.
16 16
• In areas where water level is shallow (< 10m,bgl) skimming wells have been recommended.
8.2 Water Quality Hazard There is a wide variation in the quality of ground water. The salinity varies from low (<1500 mmhos/cm) to very high (> 8000 mmhos/cm). Patches of very high EC are observed in southern and western parts of Nohar block and northern and western parts of Hanumangarh block. In the region comprising Ghaggar flood plain, EC ranges from 300 to 3000 mmhos/cm indicating medium to low salinity of ground water. EC of confined aquifer varies from 3000 to 3500 mmhos/cm. In the entire district the confined aquifer is saline except locally.
9.0 Ground Water Management Strategy 9.1 Ground Water Development Groundwater estimation reveals that all the blocks in the district fall under safe category. Ground water development needs to be promoted along with adoption of water conservation and rain water harvesting measures wherever feasible to avoid deleterious effects on ground water regime in future. Irrigation wells are required to be constructed in Ghaggar Plain area where groundwater is suitable for irrigation.
9.2 Well Design The district is underlain by unconsolidated to semi-consolidated formations where direct rotary drilling technique is used for construction of wells. Tube wells of screened assembly with gravel pack are recommended in the area. Before installation of assembly, it is essential to check alignment of borehole. The thickness of gravel pack may be 13 to 20 cm as recommended by UP Irrigation research Institute.
10.0 Recommendations • Agricultural potential in Hanumangarh block and NE of Bhadra block is high
with respect to ground water quality. Water having EC< 4000 mmhos occurs in major part of the district which can be used for growing semi tolerant to salt tolerant crops.
• In some areas, fresh water cushions have been developed due to seepage of canal water accumulated over impervious formation. Therefore attempt has to be made to locate those points where maximum thickness can be ascertained and ground water can be exploited judiciously.
• Anti water logging measures should be taken to avoid further water logging in the areas around natural depressions.
• It is strongly advocated that a massive ground water development programme may be launched especially in the Ghaggar flood plain area where the quality of ground water is suitable for irrigation.
• Saline ground water available in the district can be used for agriculture by blending with canal water or using in lean period. Batteries of tubewells tapping saline water can be constructed along Pilibanga branch for use in conjunction with fresh canal water.
• Modern agricultural management techniques have to be adopted for effective and optimum utilization of the water resources. Maintaining irrigation through

17 17
minimum pumping hours as per minimum requirement of water by the crop and also selecting most suitable cost effective cropping pattern can achieve this.
• High water requirement crops need to be discouraged. Proper agriculture extension services should be provided to the farmers so that they can go for alternate low water requirement economical crops.
• Implementation of further ground water development programme in the area must be under competent technical supervision to avoid well failures and saline water ingress.
• Sewage reclamation should be an important part of the development of irrigation sector. It is required to avoid contamination of water resources. This source of irrigation water is highly reliable, albeit only for non-edible crops.