Ground water resource evaluation
40
Report on SW820: Ground Water Hydrology Report on SW820: Ground Water Hydrology Renel M. Alucilja AE 820 Dr. Theody Sayco
-
Upload
renel-alucilja -
Category
Engineering
-
view
24 -
download
0
Transcript of Ground water resource evaluation

Report on SW820: Ground Water HydrologyReport on SW820: Ground Water Hydrology
Renel M. AluciljaAE 820
Dr. Theody Sayco
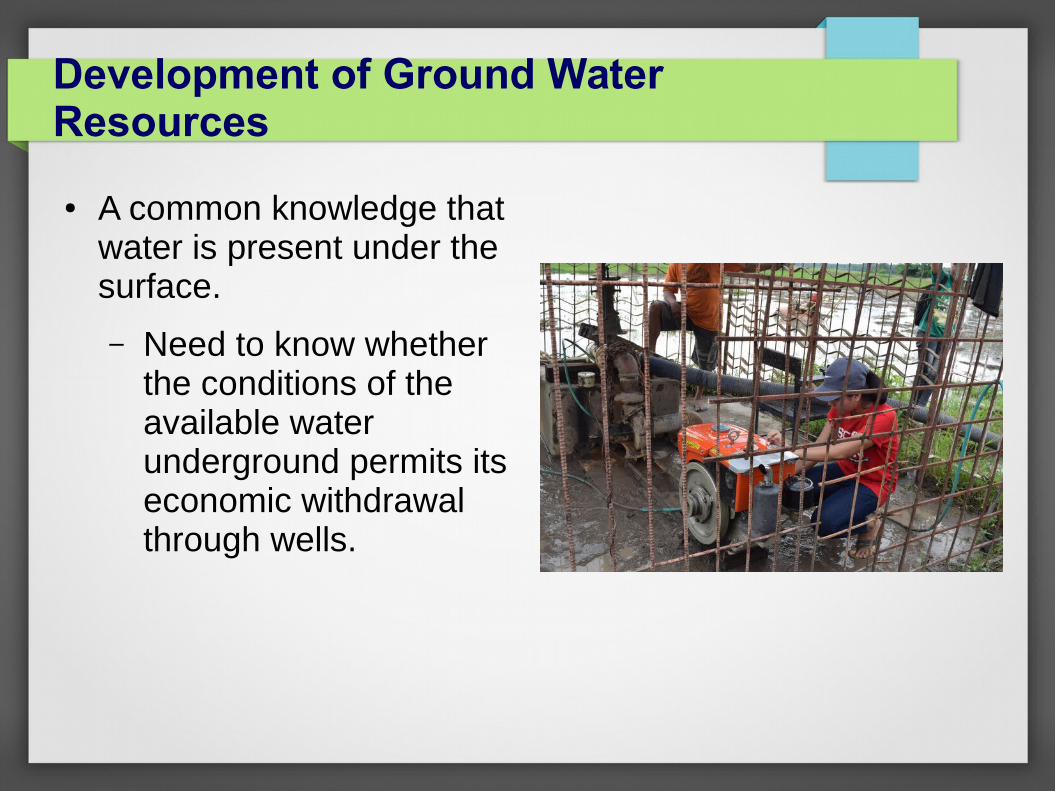
Development of Ground Water Resources
● A common knowledge that water is present under the surface.
– Need to know whether the conditions of the available water underground permits its economic withdrawal through wells.
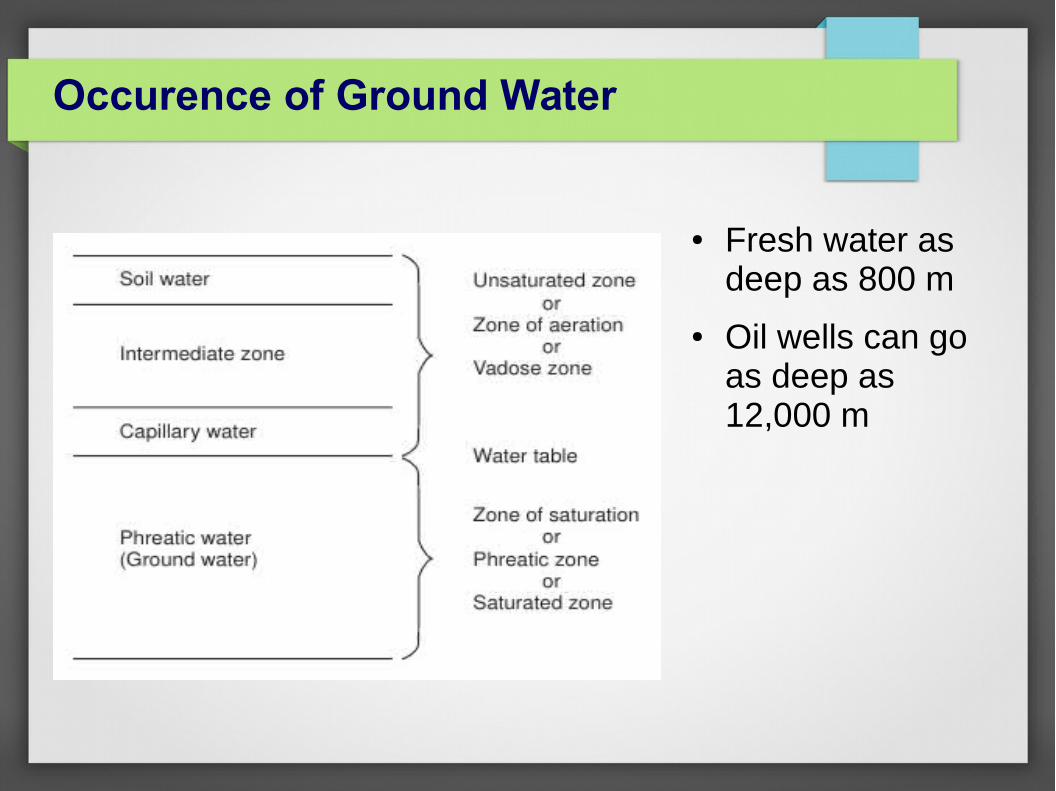
Occurence of Ground Water
● Fresh water as deep as 800 m
● Oil wells can go as deep as 12,000 m
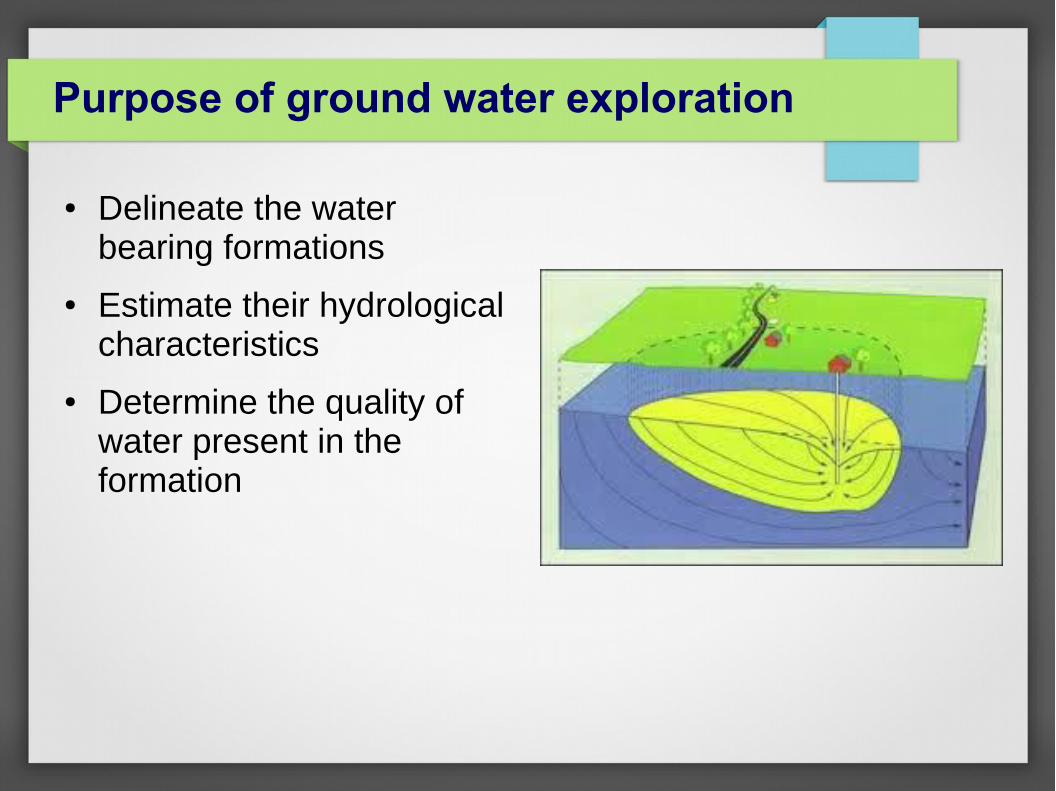
Purpose of ground water exploration
● Delineate the water bearing formations
● Estimate their hydrological characteristics
● Determine the quality of water present in the formation
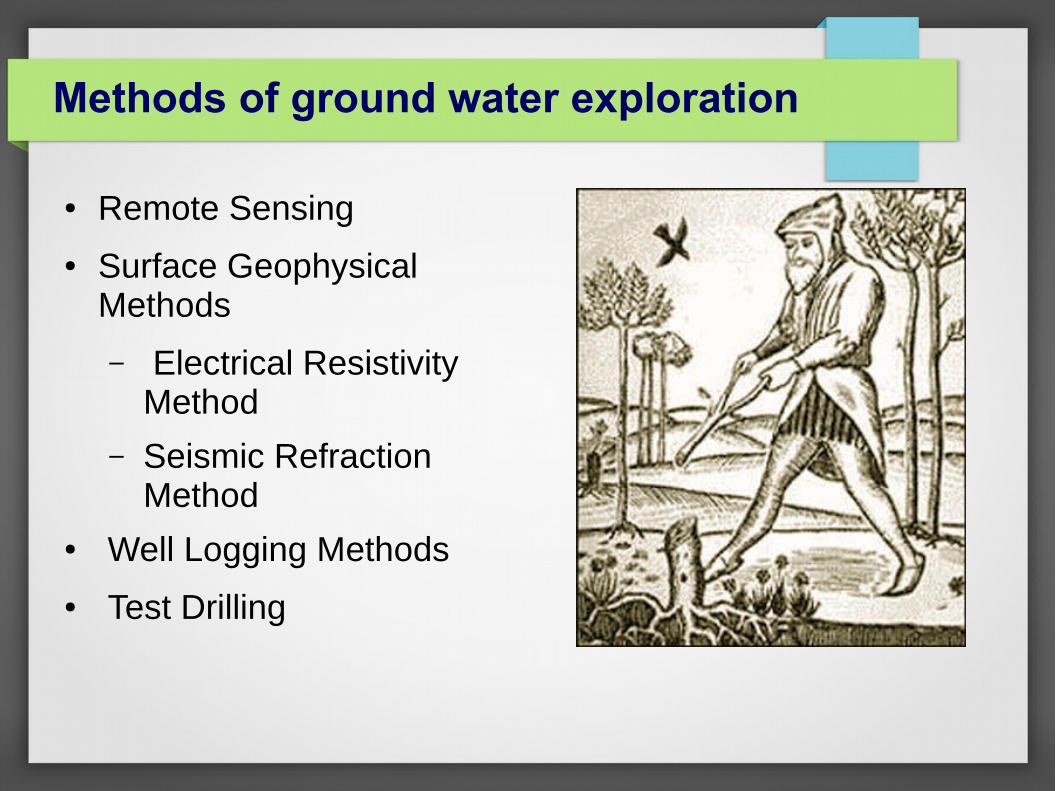
Methods of ground water exploration
● Remote Sensing
● Surface Geophysical Methods
– Electrical Resistivity Method
– Seismic Refraction Method
● Well Logging Methods
● Test Drilling
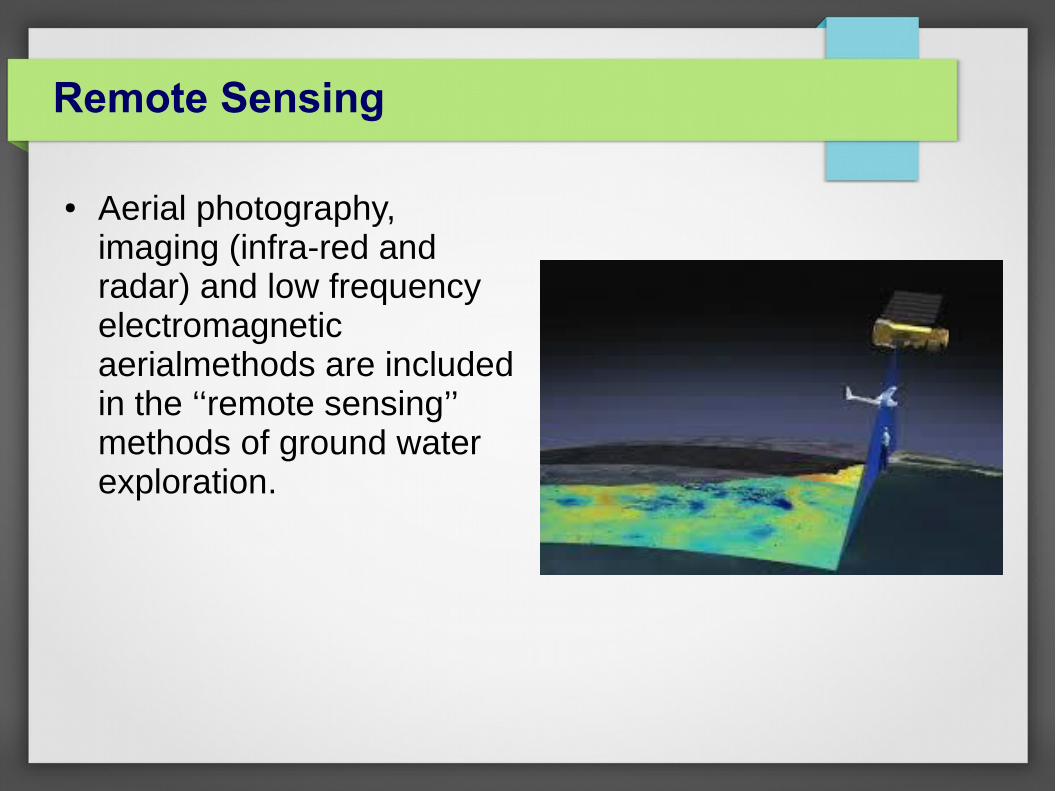
Remote Sensing
● Aerial photography, imaging (infra-red and radar) and low frequency electromagnetic aerialmethods are included in the ‘‘remote sensing’’ methods of ground water exploration.
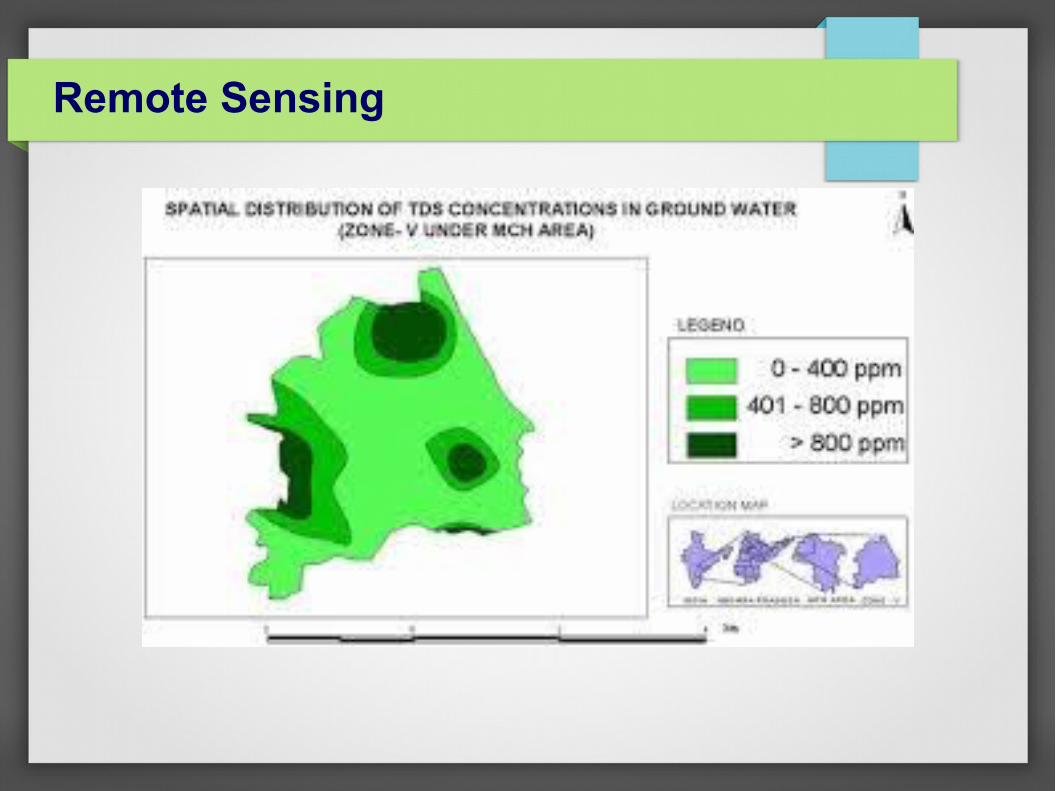
Remote Sensing
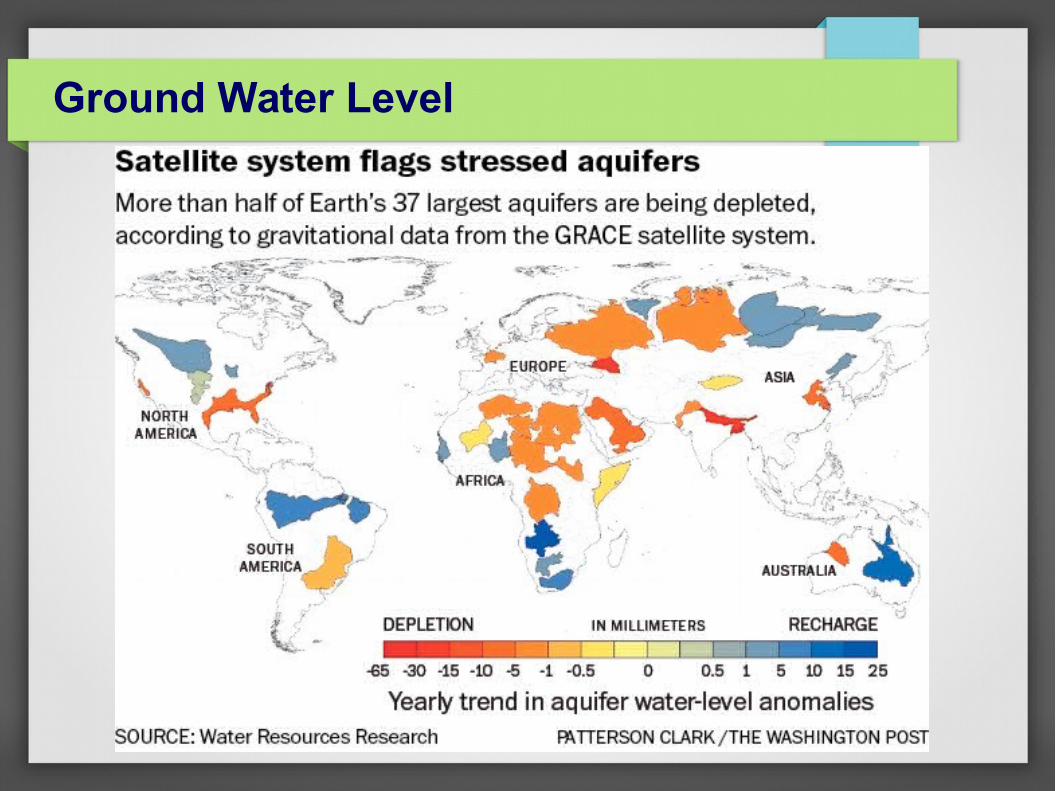
Ground Water Level

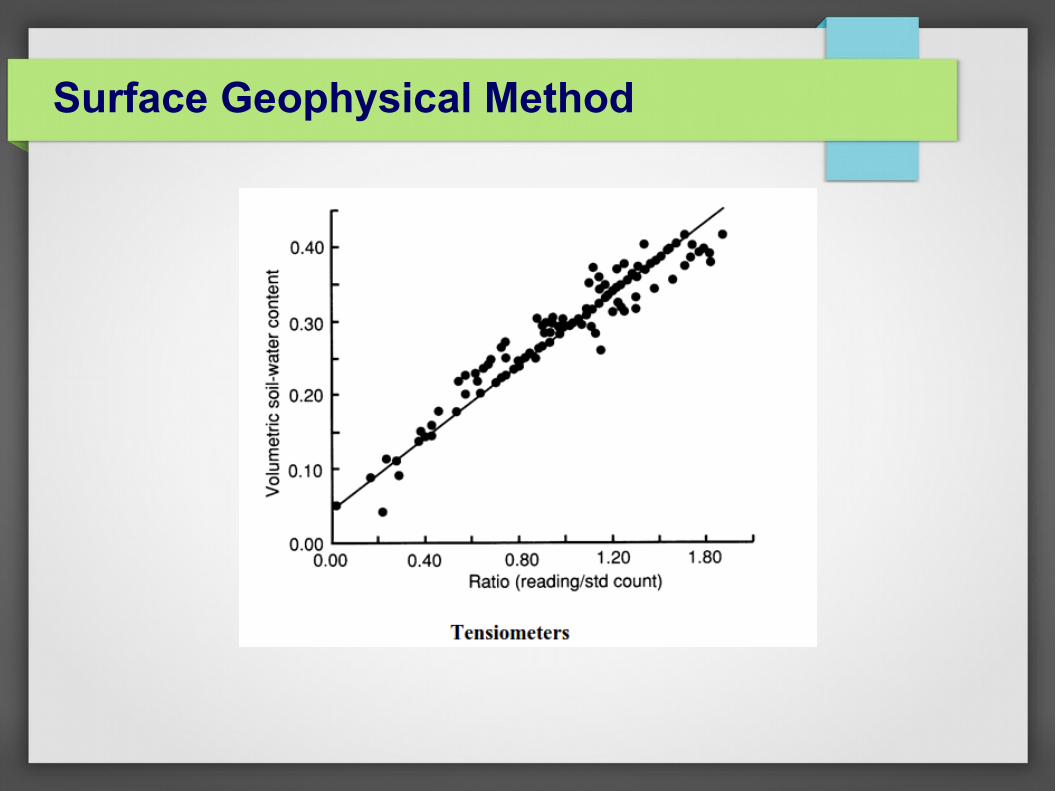
Surface Geophysical Method
● Surface geophysical methods reveal specific details of the physical characteristics of the local subsurface environment.
● This information can be interpreted suitably for the purpose of delineating the pre-glacial drainage pattern, mapping the location and extent of buried permeable deposits, direct exploration for ground water, and mapping of freshwater and salt water contact
● The electrical resistivity method and seismic refraction method are the surface geophysical methods commonly used for ground water exploration.

Surface Geophysical Method
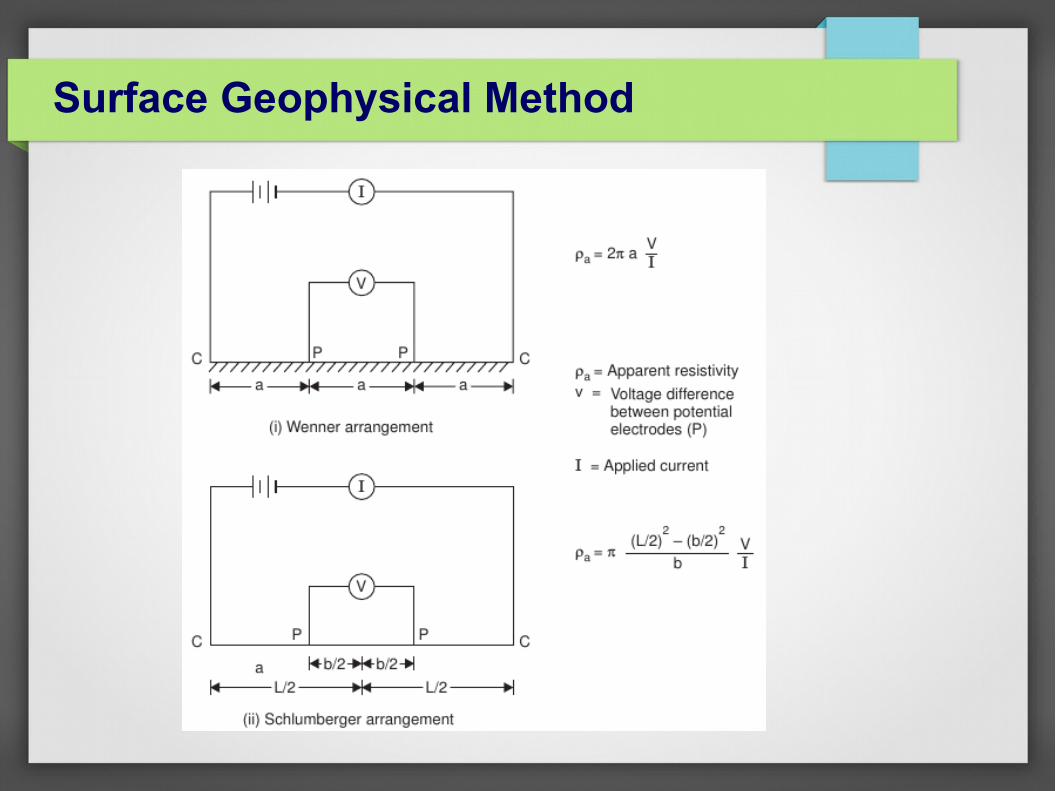
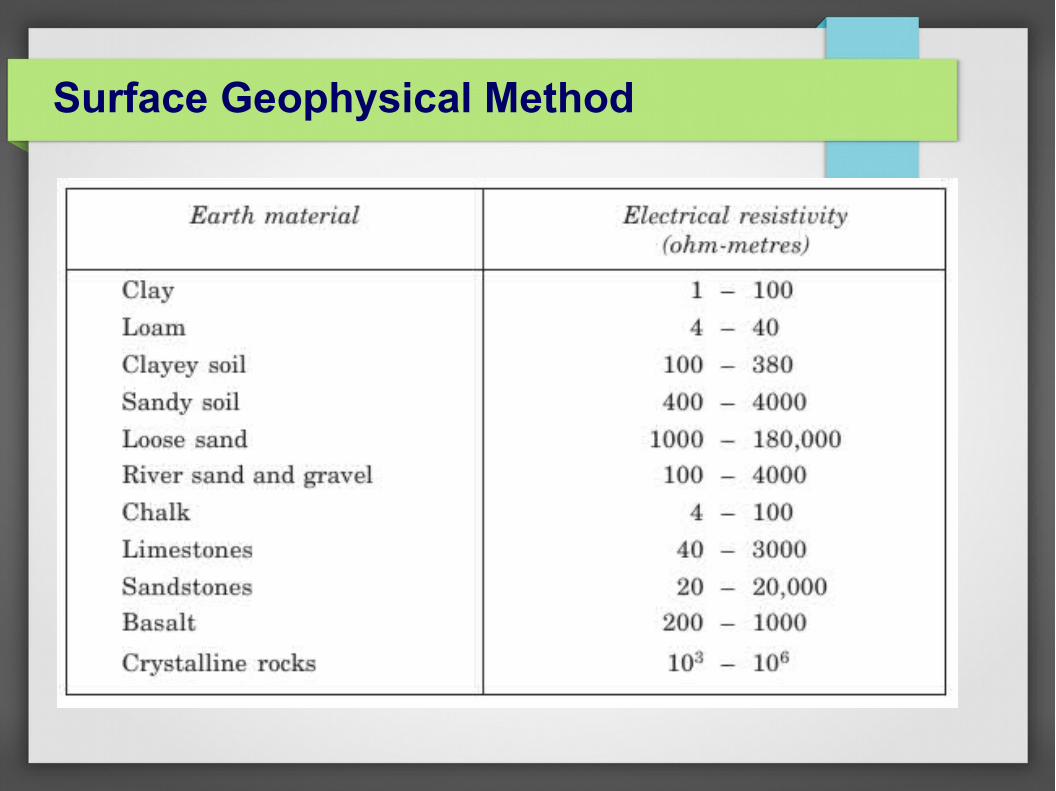
● Electrical Resistivity Method
– The electrical resistivity of a rock depends on porosity, salinity of the fluid in the pore spaces, straightness or tortuosity of the interconnected pore spaces, presence of solid conductors, such as clays or metallic minerals, and temperature.
– In the electrical resistivity method, electrical current is injected into the ground through two metal stakes (electrodes) and the resulting voltage between two other metal stakes is measured.
– The depth of measurement is decided by the distance and the arrangement pattern of the four electrodes and the standard calibration curves.
– The changes in the electrical resistance of different earth layers are thus determined.
– The electrical resistivity would vary with the salinity of the water included in the pores of earth material.
Surface Geophysical Method
Surface Geophysical Method
Surface Geophysical Method

Surface Geophysical Method

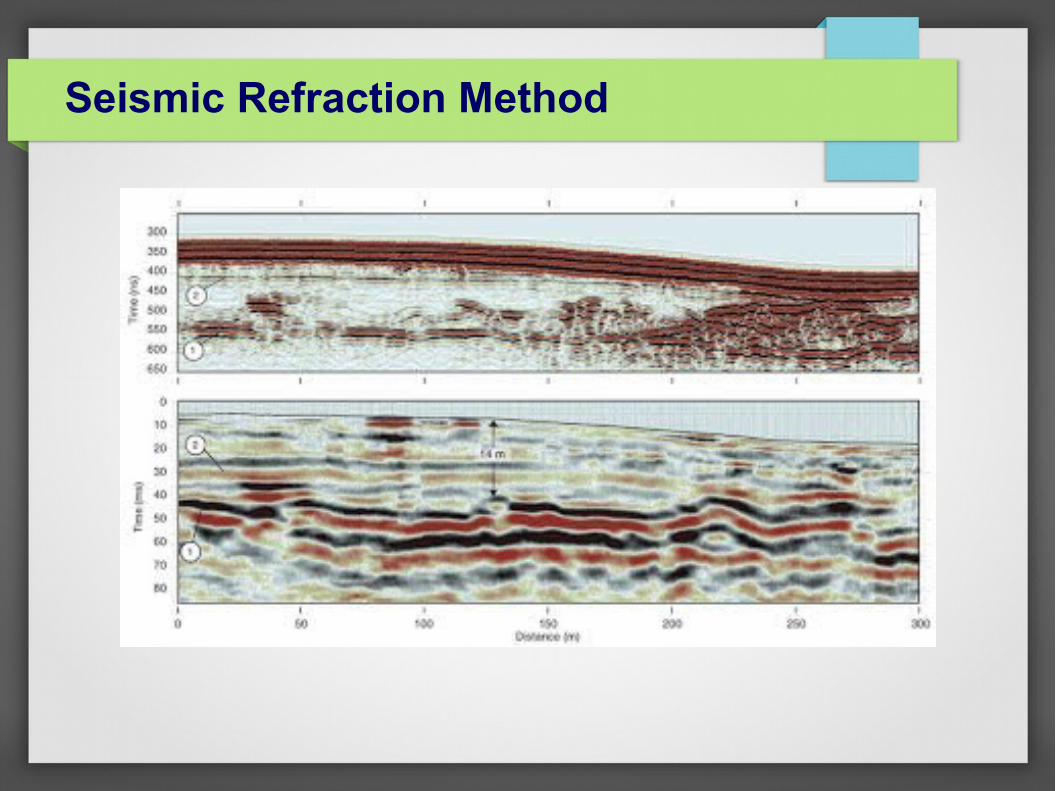
Seismic Refraction Method
● This geophysical method employs seismic waves to determine variations in the thickness of the unconfined aquifer and the zone where the most permeable strata are likely to exist.
● The method is based on the velocity variation of artificially generated seismic waves in the ground. Seismic waves are generated either by hammering on a metal plate, or by dropping a heavy ball, or by using explosives.

Seismic Refraction Method
Seismic Refraction Method

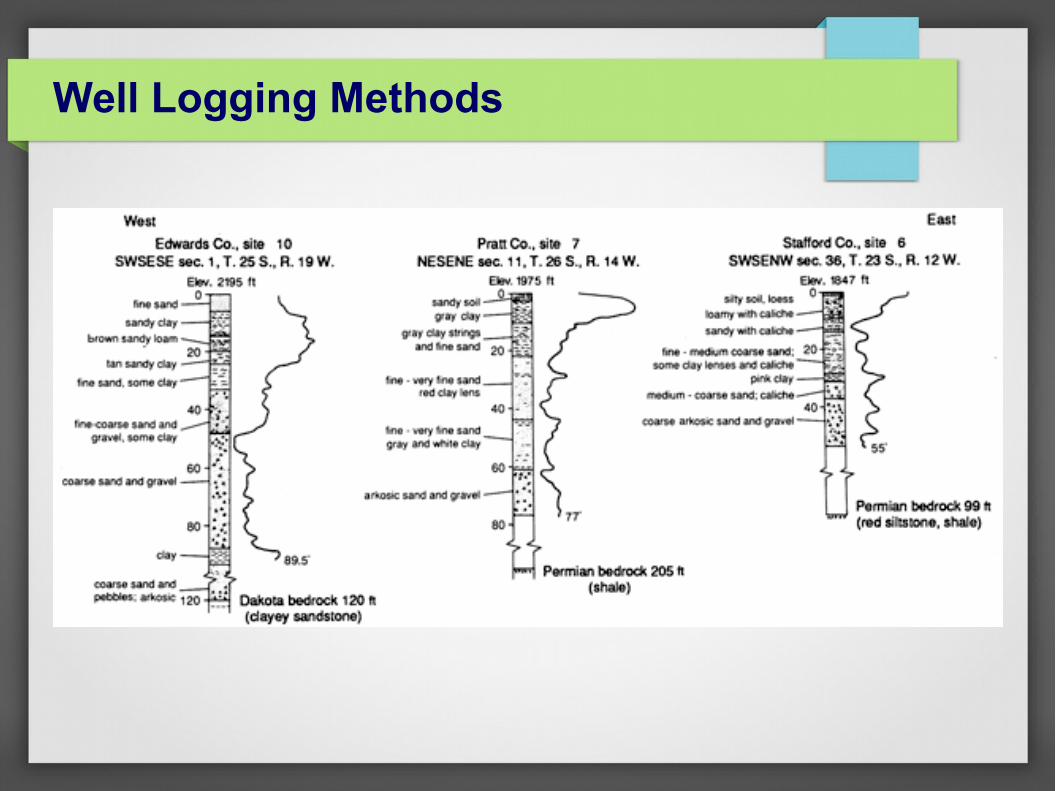
Well Logging Methods
● Surface methods of ground water exploration do not give exact quantitative information about the subsurface environment.
● Quantitative information about subsurface strata can only be obtained by subsurface investigations which are conducted by personnel working on the surface and the equipment being lowered underground.
● The equipment extending into the ground measures one of several geophysical quantities, such as electrical resistivity, self-potential, temperature, gamma rays, and so on.
Well Logging Methods

Well Logging Methods
Aquifer Tests
● Commonly known as pump testing
● Aquifer characteristics and its performance can be best described by its hydraulic conductivity, transmissivity, and storativity.
● These quantities can be determined by analysing the data collected during aquifer tests or pumping tests. Measurements during an aquifer test include water levels at observation wells
Aquifer Tests
● Aquifer pumping and slug tests are useful for providing information on aquifer properties that influence contaminant transport.
● These parameters provide important information for selecting and designing ground water cleanup remedies, and are used as input to mathematical calculations or computer models that are used to analyze ground water flowand contaminant movement.
Guidelines for Preliminary Aquifer Test
● Establishment of Geologic Conditions
– surface geology (including soil investigation(s)) of the site and nearby areas, both locally and regionally,\
– lithologic composition of the aquifer(s) and confining bed(s) of interest,
– lateral and/or vertical compositional changes of the aquifer(s) and confining bed(s) of interest, and
– thickness of the aquifer(s) and confining bed(s)of interest.

Guidelines for Preliminary Aquifer Test
● Establishment of Hydrogeologic Conditions
– Existence and nature of aquifer boundaries,
– direction of ground water flow in the aquifer(s) of interest,
– determination of the magnitude and direction of horizontal and vertical hydraulic gradients,
– existence of seasonal ground water fluctuations or any regional water level trends or ground water use operations that may influence the aquifer(s) and confining bed(s) of interest, and
– approximate estimates of the hydraulic properties for the zones of interest.
DESIGN OF AQUIFER PUMPING TESTS
● Establishment of the Configuration and Logistics of the Aquifer Test
● Guidelines for the Pumping Well
● Well Screen Length
● Determination of Screen Slot and Filter Pack Size
● Selection of the Pumping Rate
● Pump Selection
● Discharge and Disposal of Pumped Water
Guidelines for Observation Wells
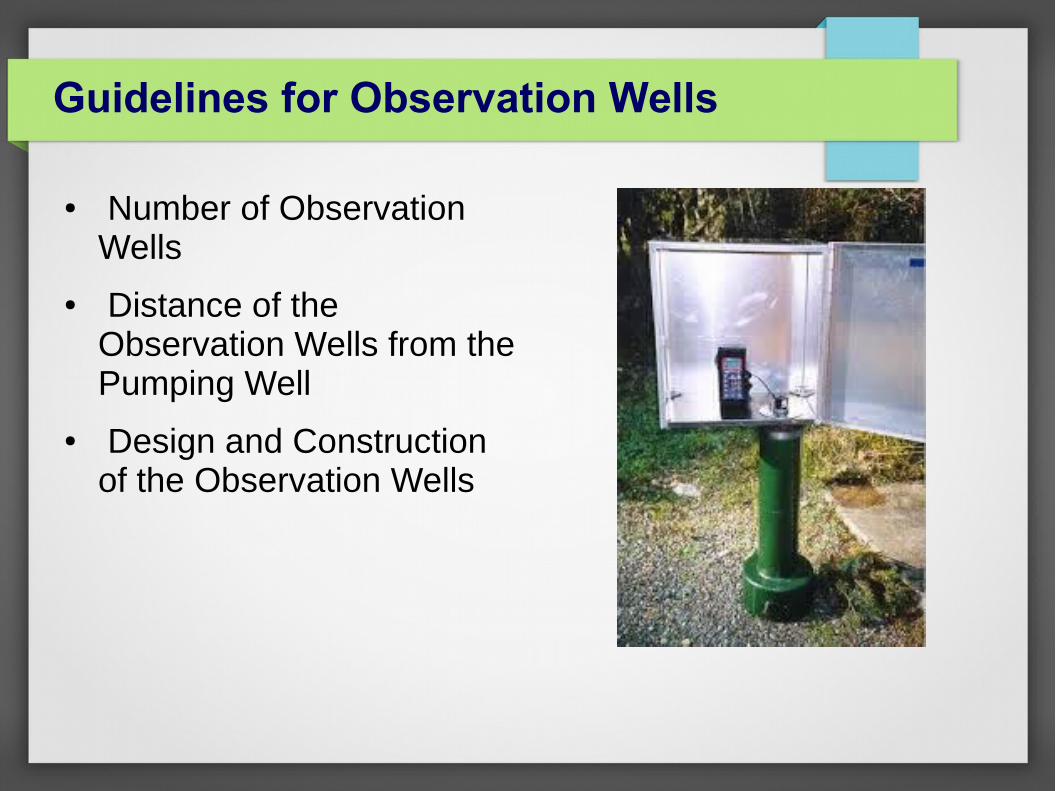
● Number of Observation Wells
● Distance of the Observation Wells from the Pumping Well
● Design and Construction of the Observation Wells

PERFORMANCE OF AQUIFER PUMPING TESTS
● Water Level Measurements Before Initiaion of the Aquifer Test
● Water Level Measurements During the Aquifer Test
– date and time the aquifer test began,
– initial and final water levels for the pumping phase,
– time since pumping started (in minutes),
– measured depth to water,
– drawdown, and
– comments noting any "unusual" events (such as stopping of the pump or changes in discharge rate, changing weather patterns, or passage of a train or heavy machinery).
● Consideration of Additional Influences

AQUIFER PUMPING TEST DATA ANALYSIS AND INTERPRETATION
● compilation of the data in the form of plots and tables,
● correction of the data for any "external influences" ,
● calculation of the hydraulic properties of the zone(s) of interest,
● evaluation of the assumptions and limitations of the analytical methods, and
● conceptualization of the hydrogeologic regime and its relationship with the hazardous waste site.
AQUIFER PUMPING TEST DATA ANALYSIS AND INTERPRETATION
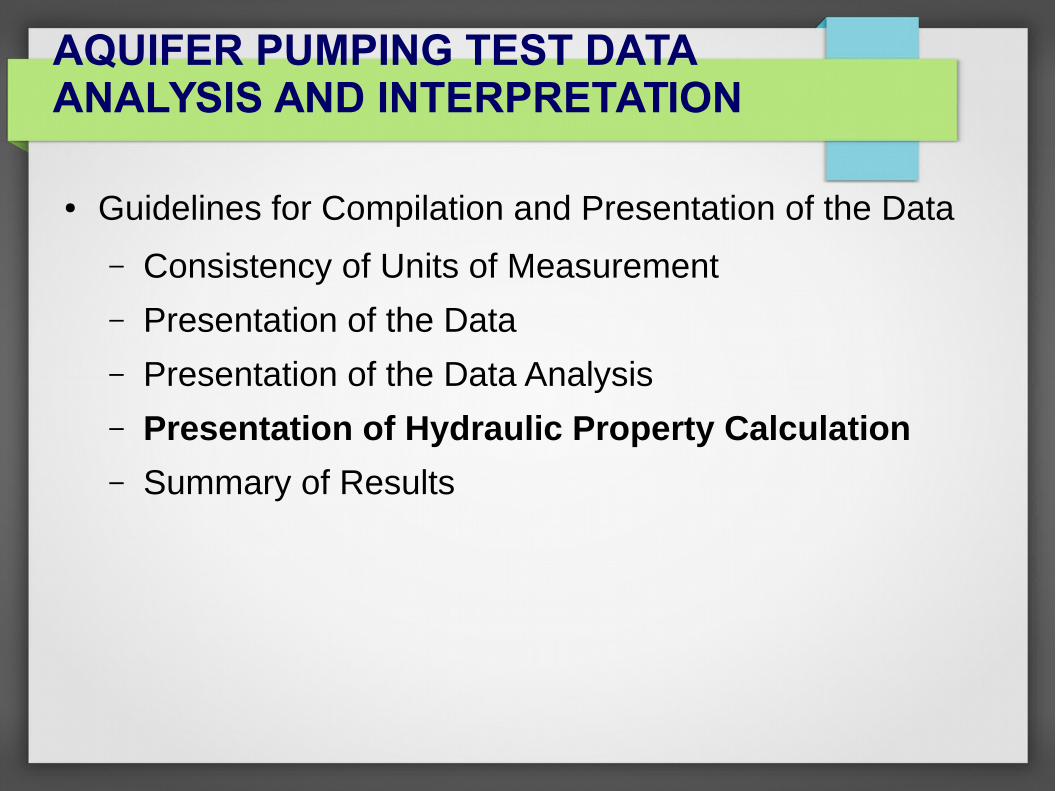
● Guidelines for Compilation and Presentation of the Data
– Consistency of Units of Measurement
– Presentation of the Data
– Presentation of the Data Analysis
– Presentation of Hydraulic Property Calculation
– Summary of Results
AQUIFER PUMPING TEST DATA ANALYSIS AND INTERPRETATION
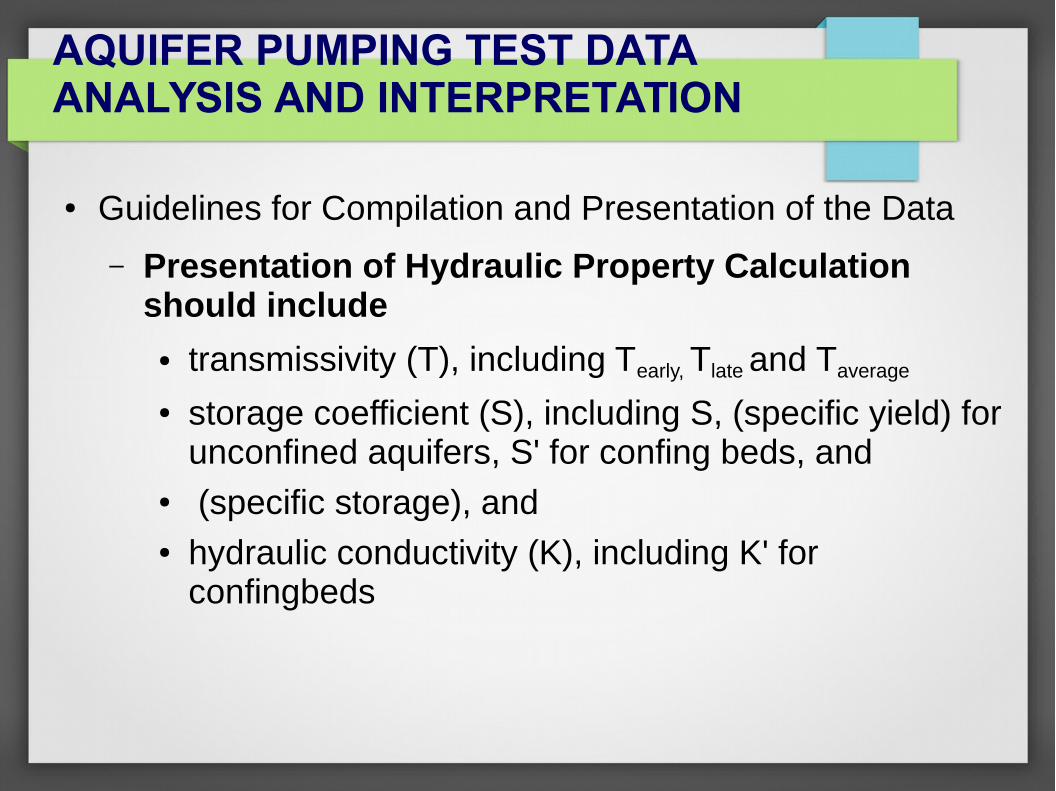
● Guidelines for Compilation and Presentation of the Data
– Presentation of Hydraulic Property Calculation should include
● transmissivity (T), including Tearly, Tlate and Taverage
● storage coefficient (S), including S, (specific yield) for unconfined aquifers, S' for confing beds, and
● (specific storage), and● hydraulic conductivity (K), including K' for
confingbeds

Aquifers and Wells
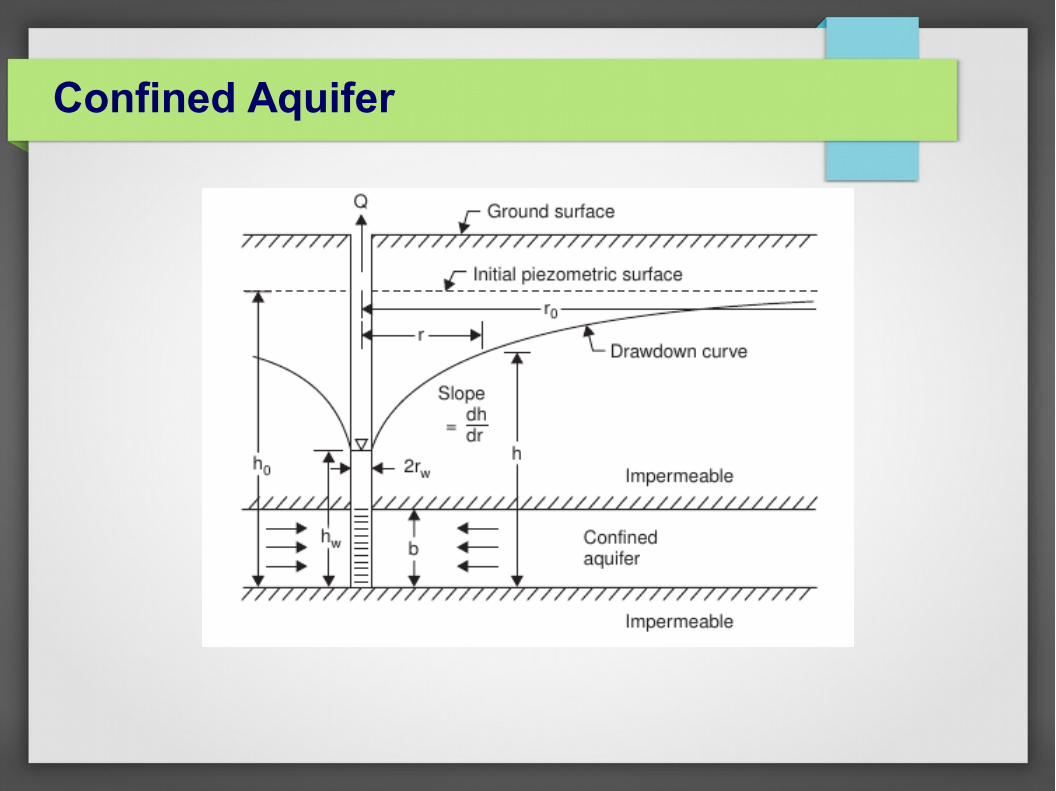
Confined Aquifer
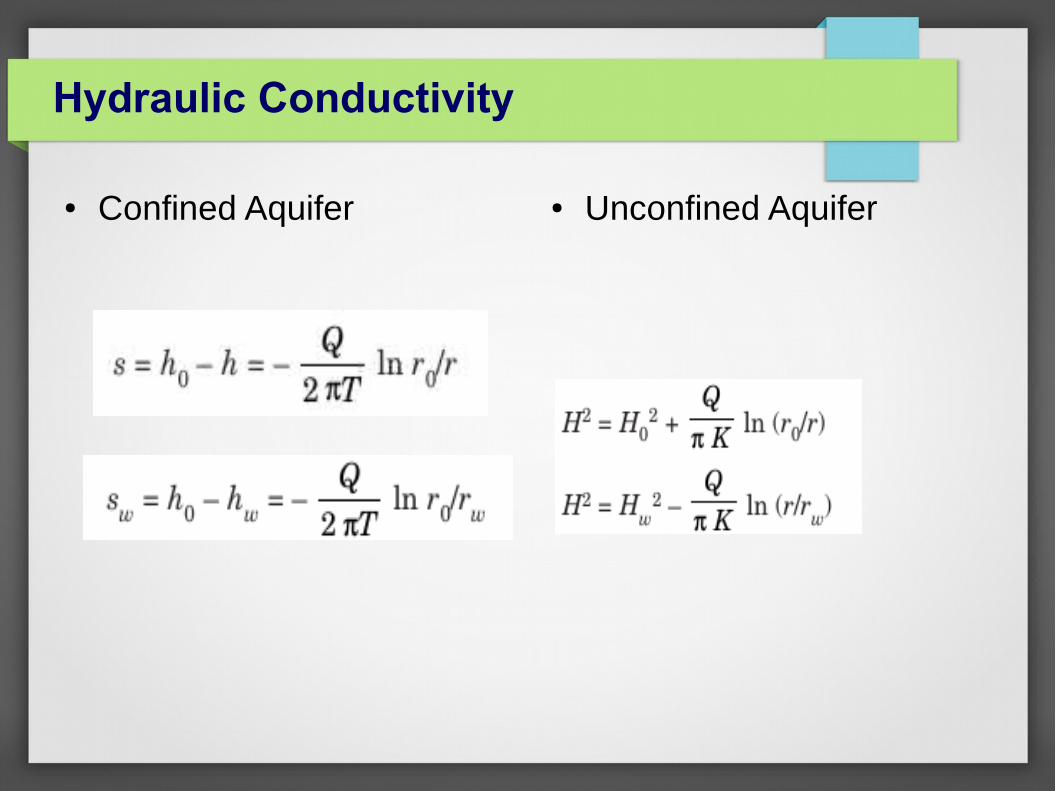
Hydraulic Conductivity
● Confined Aquifer ● Unconfined Aquifer
Hydraulic Conductivity
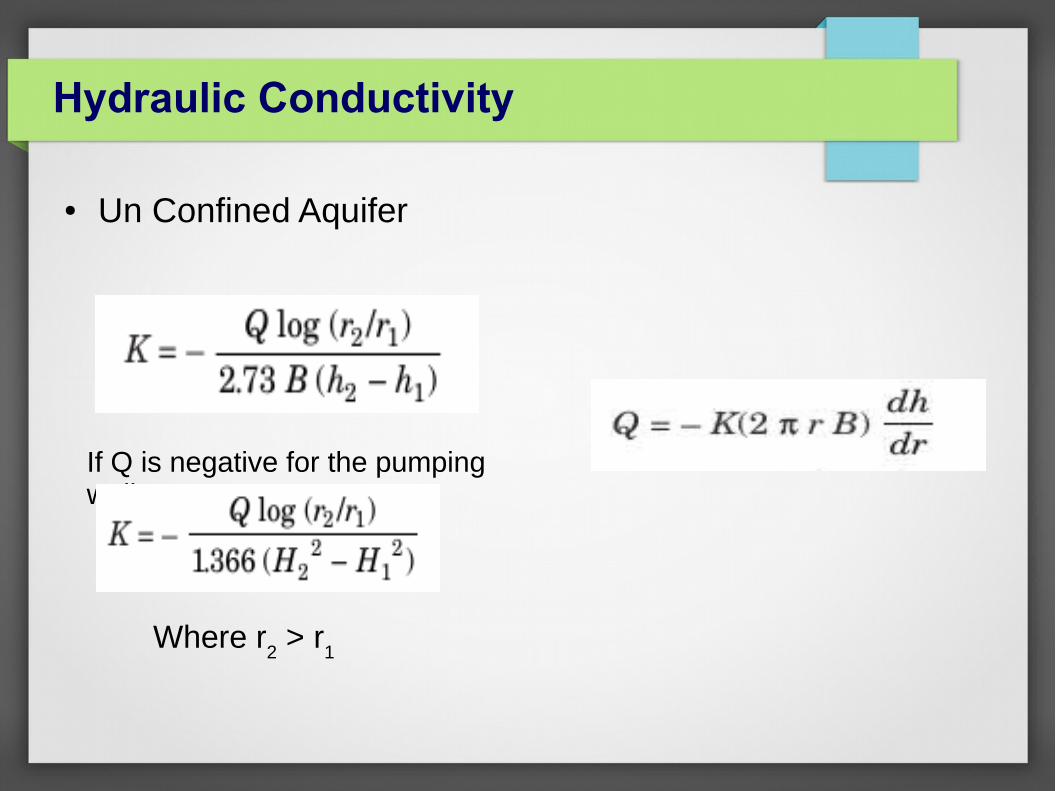
● Un Confined Aquifer
Where r2 > r
1
If Q is negative for the pumping well
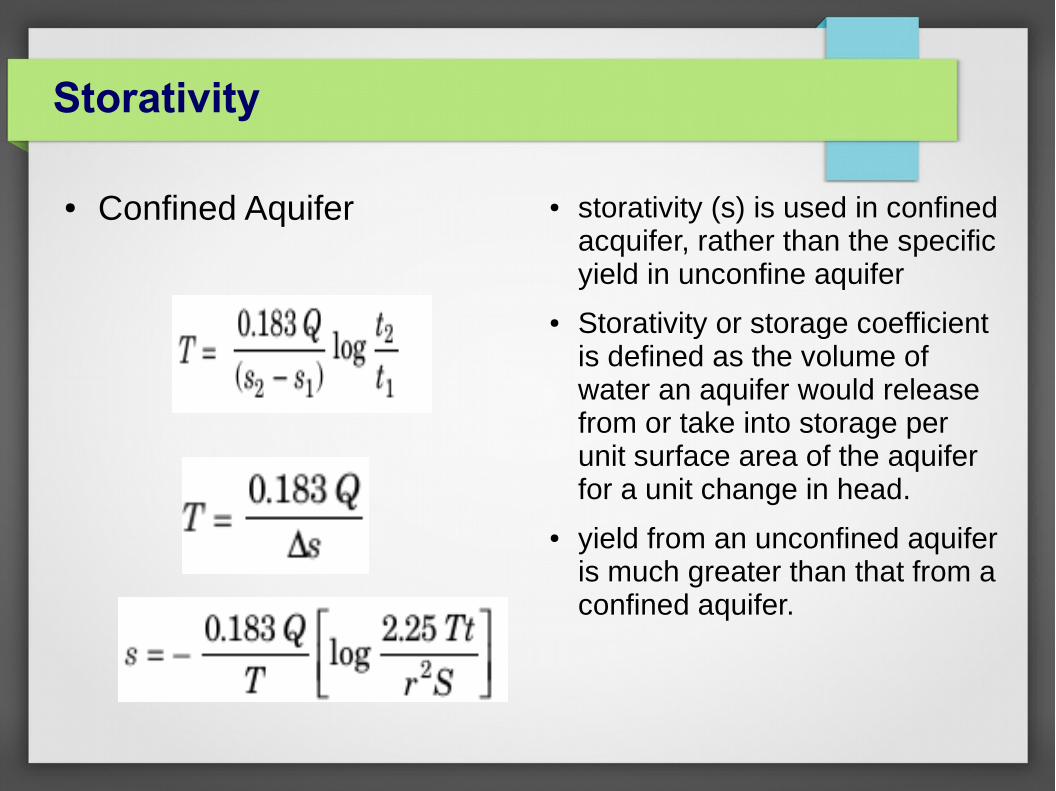
Storativity
● Confined Aquifer ● storativity (s) is used in confined acquifer, rather than the specific yield in unconfine aquifer
● Storativity or storage coefficient is defined as the volume of water an aquifer would release from or take into storage per unit surface area of the aquifer for a unit change in head.
● yield from an unconfined aquifer is much greater than that from a confined aquifer.
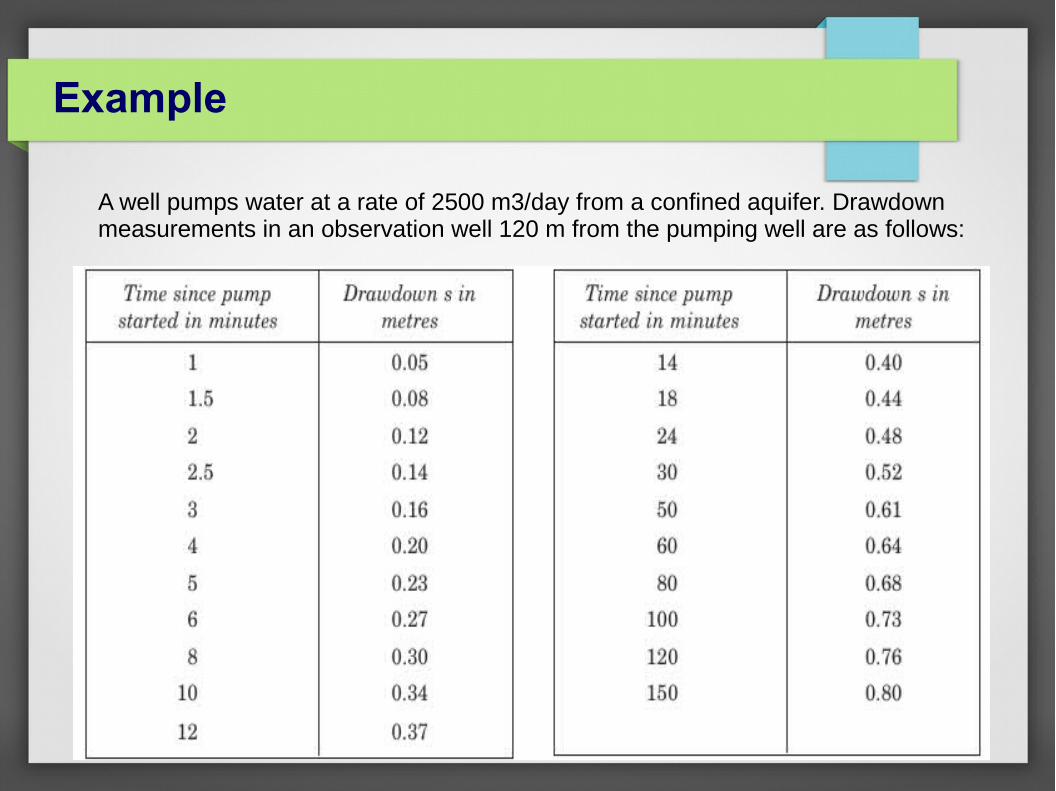
Example
A well pumps water at a rate of 2500 m3/day from a confined aquifer. Drawdown measurements in an observation well 120 m from the pumping well are as follows:

Time Drawn Graph
DESIGN OF WATER WELLS
● Main objectives of well design
– To obtain the highest yield with a minimum drawdown consistent with aquifer capability and well requirement,
– To obtain good quality water with proper protection from contamination,
– To obtain sand-free water.
– To ensure long life (30–40 years) of well, and
– To have reasonable installation, maintenance, and operation costs.

DESIGN OF WATER WELLS
● hydrogeologic information for making the design
– Stratigraphic information concerning the aquifer and overlying formations,
– Transmissivity and storage coefficient of the aquifer,
– The present and long-term water balance (i.e., inflow and outflow) conditions in the aquifer,
– Grain size analyses of unconsolidated aquifer materials and identification of rocks and minerals, and
– Water quality.
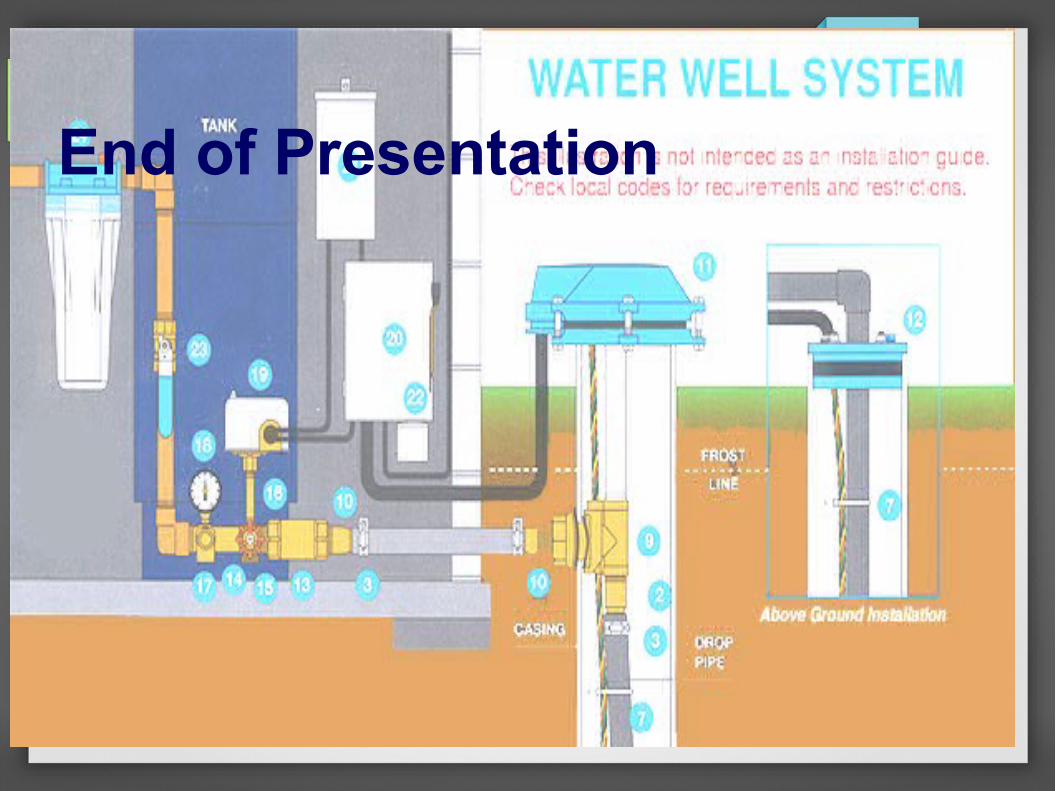
End of Presentation