GROUND-WATER HYDROLOGY OF THE AREA BORDERING … · GROUND-WATER HYDROLOGY OF THE AREA BORDERING...
58
GROUND-WATER HYDROLOGY OF THE AREA BORDERING THE KANAWHA RIVER IN WEST VIRGINIA By Robert A. Shultz, Melvin V. Mathes, and John S. Bader U.S. GEOLOGICAL SURVEY Open-File Report 95-712 Prepared in cooperation with the WEST VIRGINIA DIVISION OF ENVIRONMENTAL PROTECTION, OFFICE OF WATER RESOURCES Charleston, West Virginia 1997
Transcript of GROUND-WATER HYDROLOGY OF THE AREA BORDERING … · GROUND-WATER HYDROLOGY OF THE AREA BORDERING...
GROUND-WATER HYDROLOGY OF THE AREA BORDERING
THE KANAWHA RIVER IN WEST VIRGINIA
By Robert A. Shultz, Melvin V. Mathes, and John S. Bader
U.S. GEOLOGICAL SURVEY
Open-File Report 95-712
Prepared in cooperation with the
WEST VIRGINIA DIVISION OF ENVIRONMENTAL PROTECTION,
OFFICE OF WATER RESOURCES
Charleston, West Virginia
1997
U.S. DEPARTMENT OF THE INTERIOR
BRUCE BABBITT, Secretary
U.S. GEOLOGICAL SURVEY Gordon P. Eaton, Director
For additional information Copies of the report can bewrite to: purchased from:
District Chief Earth Science Information CenterU.S. Geological Survey Open-File Reports Section11 Dunbar Street Box 25286, MS 517Charleston, WV 25301 Denver Federal Center
Denver, CO 80225
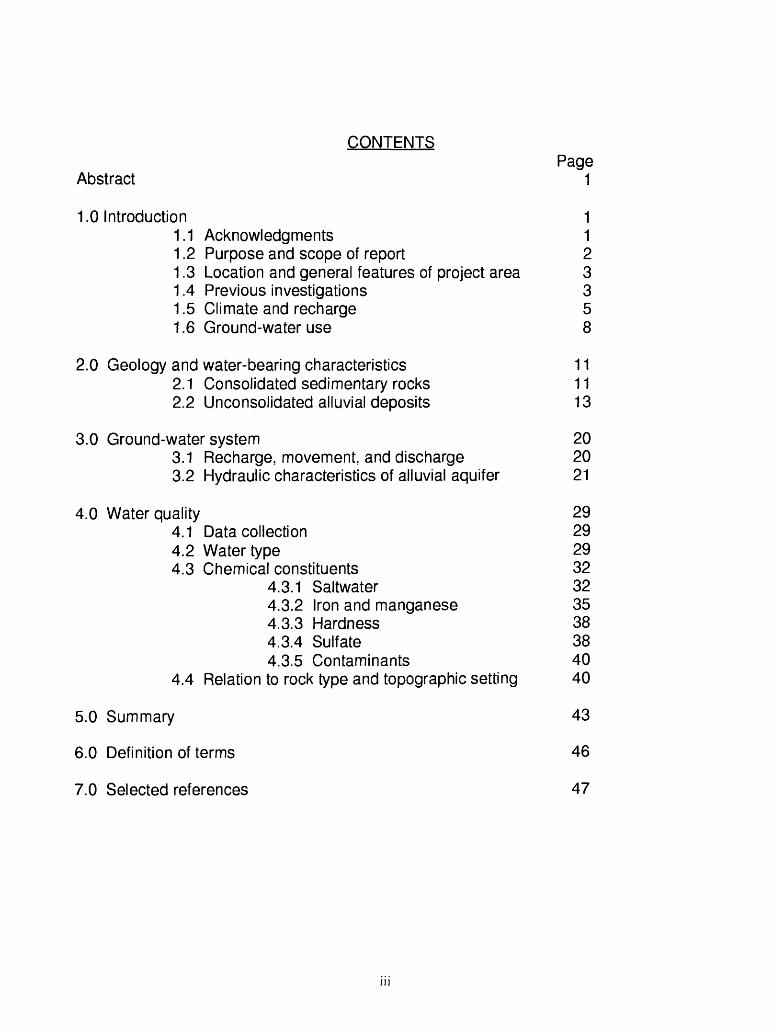
CONTENTSPage
Abstract 1
1.0 Introduction 11.1 Acknowledgments 11.2 Purpose and scope of report 21.3 Location and general features of project area 31.4 Previous investigations 31.5 Climate and recharge 51.6 Ground-water use 8
2.0 Geology and water-bearing characteristics 112.1 Consolidated sedimentary rocks 112.2 Unconsolidated alluvial deposits 13
3.0 Ground-water system 203.1 Recharge, movement, and discharge 203.2 Hydraulic characteristics of alluvial aquifer 21
4.0 Water quality 294.1 Data collection 294.2 Water type 294.3 Chemical constituents 32
4.3.1 Saltwater 324.3.2 Iron and manganese 354.3.3 Hardness 384.3.4 Sulfate 384.3.5 Contaminants 40
4.4 Relation to rock type and topographic setting 40
5.0 Summary 43
6.0 Definition of terms 46
7.0 Selected references 47
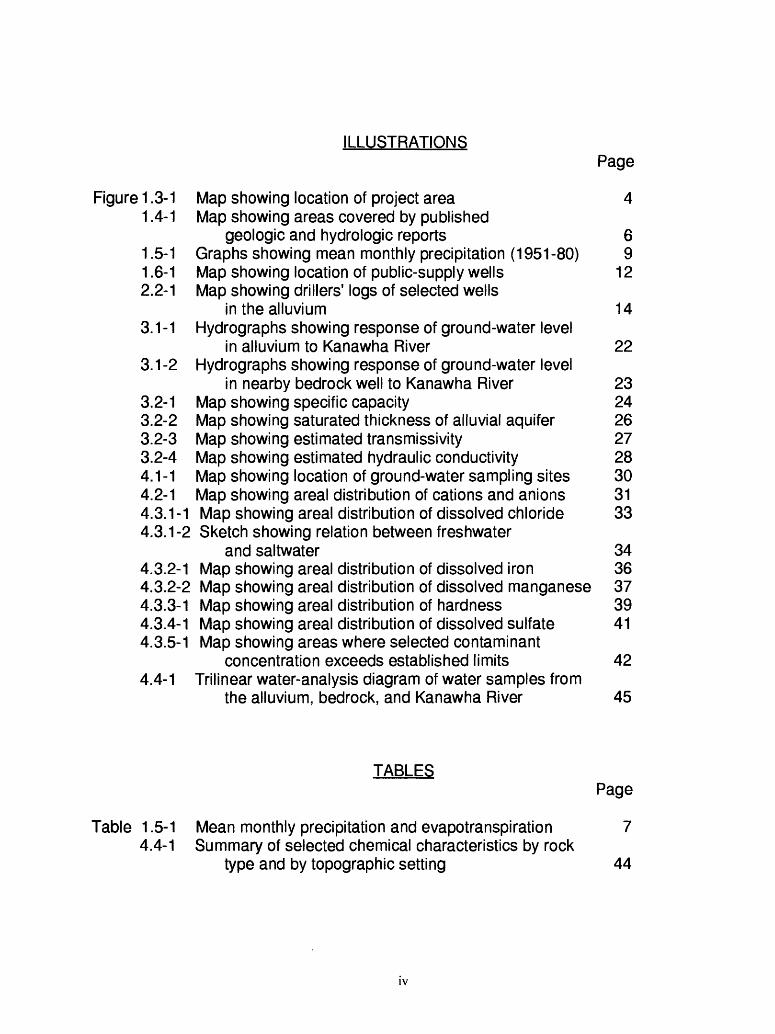
ILLUSTRATIONSPage
Figure 1.3-1 Map showing location of project area 41.4-1 Map showing areas covered by published
geologic and hydrologic reports 61.5-1 Graphs showing mean monthly precipitation (1951-80) 91.6-1 Map showing location of public-supply wells 12 2.2-1 Map showing drillers' logs of selected wells
in the alluvium 14 3.1-1 Hydrographs showing response of ground-water level
in alluvium to Kanawha River 22 3.1 -2 Hydrographs showing response of ground-water level
in nearby bedrock well to Kanawha River 23 3.2-1 Map showing specific capacity 24 3.2-2 Map showing saturated thickness of alluvial aquifer 26 3.2-3 Map showing estimated transmissivity 27 3.2-4 Map showing estimated hydraulic conductivity 284.1-1 Map showing location of ground-water sampling sites 304.2-1 Map showing areal distribution of cations and anions 31 4.3.1-1 Map showing areal distribution of dissolved chloride 334.3.1-2 Sketch showing relation between freshwater
and saltwater 344.3.2-1 Map showing areal distribution of dissolved iron 364.3.2-2 Map showing areal distribution of dissolved manganese 374.3.3-1 Map showing areal distribution of hardness 394.3.4-1 Map showing areal distribution of dissolved sulfate 414.3.5-1 Map showing areas where selected contaminant
concentration exceeds established limits 424.4-1 Trilinear water-analysis diagram of water samples from
the alluvium, bedrock, and Kanawha River 45
TABLESPage
Table 1.5-1 Mean monthly precipitation and evapotranspiration 7 4.4-1 Summary of selected chemical characteristics by rock
type and by topographic setting 44
IV
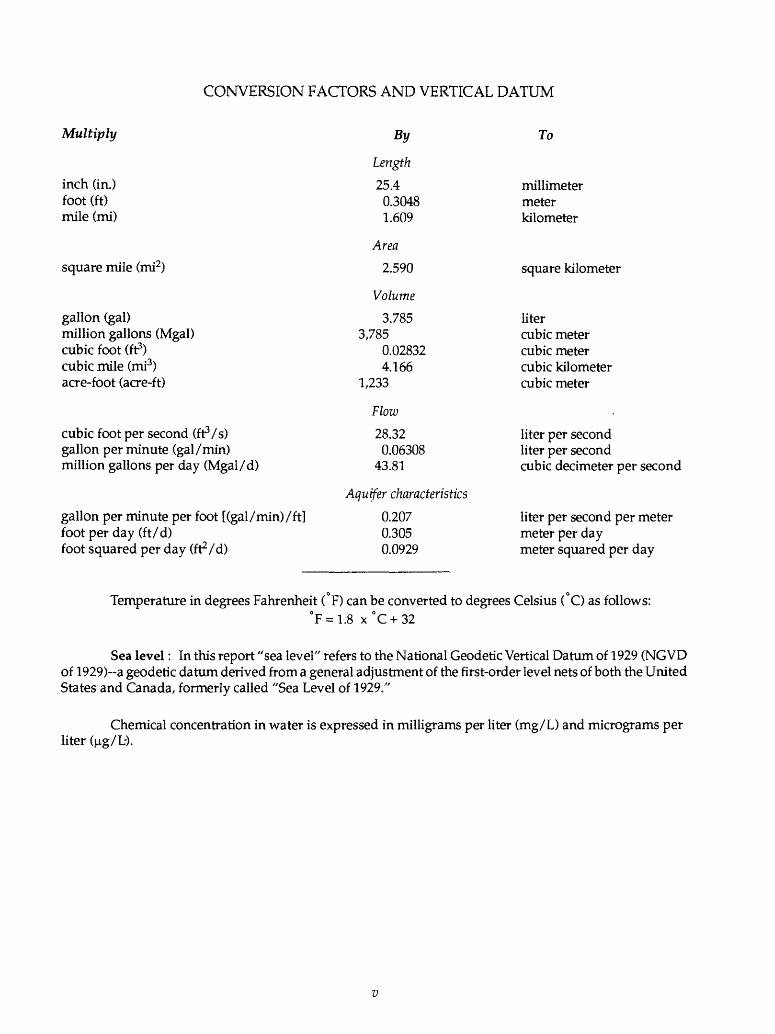
CONVERSION FACTORS AND VERTICAL DATUM
Multiply
inch (in.) foot (ft) mile (mi)
square mile (mi2)
gallon (gal) million gallons (Mgal) cubic foot (ft3) cubic mile (mi3) acre-foot (acre-ft)
cubic foot per second (ftVs) gallon per minute (gal/min) million gallons per day (Mgal/d)
gallon per minute per foot [(gal/min)/ft]foot per day (ft/d)foot squared per day (frVd)
By
Length
25.40.30481.609
Area
2.590
Volume
3.7853,785
0.028324.166
1,233
Flow
28.320.06308
43.81
Aquifer characteristics
0.2070.3050.0929
To
millimetermeterkilometer
square kilometer
litercubic meter cubic meter cubic kilometer cubic meter
liter per second liter per second cubic decimeter per second
liter per second per metermeter per daymeter squared per day
Temperature in degrees Fahrenheit (°F) can be converted to degrees Celsius (°C) as follows:°F = 1.8 x°C + 32
Sea level: In this report "sea level" refers to the National Geodetic Vertical Datum of 1929 (NGVD of 1929)-a geodetic datum derived from a general adjustment of the first-order level nets of both the United States and Canada, formerly called "Sea Level of 1929."
literChemical concentration in water is expressed in milligrams per liter (mg/L) and micrograms per
GROUND-WATER HYDROLOGY OF THE AREA BORDERING THE KANAWHA RIVER IN WEST VIRGINIA
By Robert A. Shultz, Melvin V. Mathes, and John S. Bader
ABSTRACT
Ground-water reserves in West Virginia are contained in the consolidated rock underlying the State and in the alluvium bordering the Ohio and Kanawha Rivers. The consolidated rock (bedrock) that crops out in the study area, which includes parts of Fayette, Kanawha, Mason, and Putnam Counties in south-central West Virginia, is of Pennsylvanian or Permian age. Alluvial deposits in the study area are limited mostly to the flood plain of the Kanawha River. The alluvium is not vertically homogenous; the lower part of the deposits consists mostly of sand with some gravel, and the upper part consists of clay and silt. In comparison to the Ohio River alluvium, the Kanawha River alluvium is less permeable and yields less ground water to wells. Ground water flows from the adjacent hills toward the river about 90 percent of the time. The alluvium is recharged by the following sources: (1) Inflow from fractures in the bedrock beneath and adjacent to the alluvium, (2) the Kanawha River at high stage, (3) inflow from tributary streams, and (4) precipitation on the floodplain. The water level in the alluvium and in the bedrock fracture system beneath the alluvium depends on the Kanawha River stage. In some ground-water samples, concentrations of chloride, iron, manganese, sulfate, barium, cadmium, lead, phenols, and zinc exceeded recommended limits for drinking water established by the West Virginia State Board of Health. Ground-water hardness exceeded 120 milligrams per liter in only 29 percent of the samples.
1.0 INTRODUCTION
1.1 Acknowledgments
The authors appreciate the cooperation of the corporations, municipalities, and private well owners who provided information about their wells and permitted samples of water to be taken for analysis. The cooperation of well drillers who provided well logs and well construction data also is acknowledged. Special appreciation is given to Dr. Steven M. Zekan, who provided access to his well and allowed the authors to install an automatic water-level recorder on it.
1.2 Purpose and Scope of Report
PROTECTION OF PUBLIC WATER SUPPLY IS PRIMARY CONCERN
The geologic and hydrologic properties of an aquifer system must be understood so it can be fully used and protected from overdevelopment and contamination.
Most ground water in West Virginia is derived from two aquifer systems. The most widespread is the system of fractures in the consolidated rock (bedrock) that underlies the State. The other is the narrow band of alluvium that borders the Ohio and Kanawha Rivers. Both aquifer systems can be contaminated by percolation or injection of harmful materials, and both can become uneconomical for water supply by overuse.
This report describes the results of an investigation to improve understanding of the hydrologic properties of the aquifer systems in the study area. Sensible and orderly development of the ground-water resources of an area requires a thorough understanding of the geology and hydrology of the area. The adequacy of a ground- water supply can be affected by many natural and human-induced processes. An understanding of the hydrologic environment can aid in making sound decisions that would protect the ground-water resources of an area from detrimental practices.
The scope of the work included ground-water data collection from numerous sources. Selected wells in the study area were visited. Details of well construction were obtained from owners and, where possible, depth to water was measured. If available, additional information on well construction was obtained from the driller. Water from many of the wells was analyzed for selected inorganic and organic chemical constituents. Reports from previous studies in the area were obtained, as were reports on other alluvial aquifers in and near the Kanawha River drainage. Data also were obtained from the files of the U.S. Geological Survey; the West Virginia Department of Natural Resources, Division of Water Resources; and the West Virginia Department of Health. Those data, together with those collected as part of this project, were analyzed and are reported herein.
1.3 Location and General Features of Project Area
PROJECT AREA IS IN SOUTH-CENTRAL WEST VIRGINIA AND INCLUDES PARTS OF FOUR COUNTIES
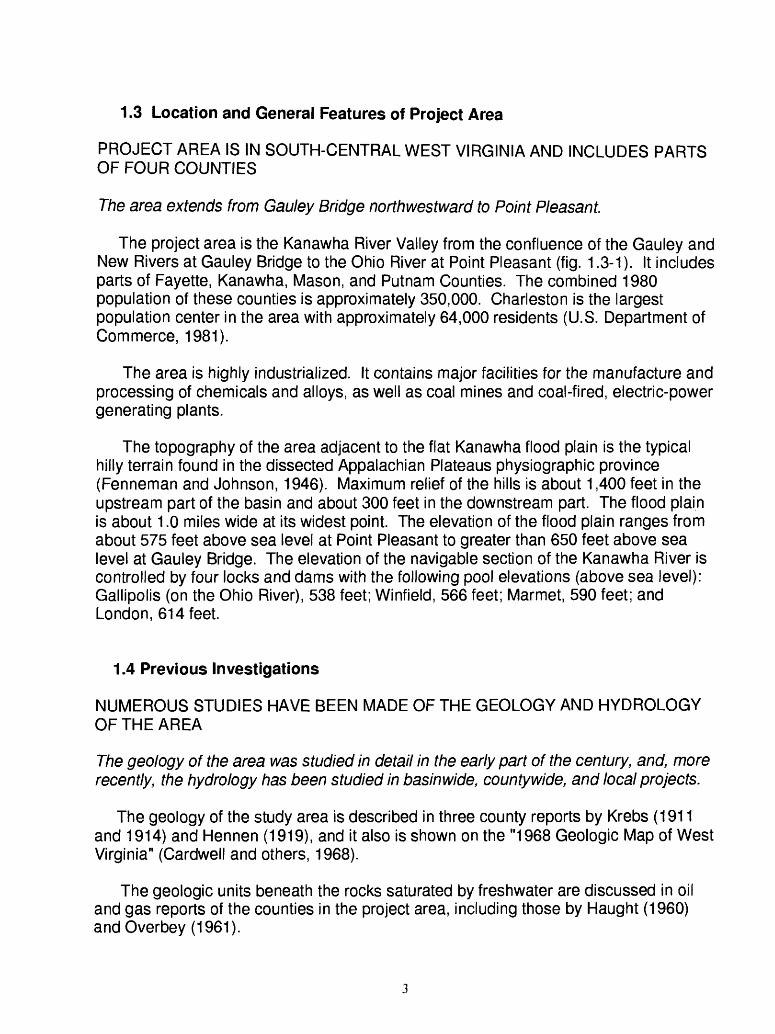
The area extends from Gauley Bridge northwestward to Point Pleasant.
The project area is the Kanawha River Valley from the confluence of the Gauley and New Rivers at Gauley Bridge to the Ohio River at Point Pleasant (fig. 1.3-1). It includes parts of Fayette, Kanawha, Mason, and Putnam Counties. The combined 1980 population of these counties is approximately 350,000. Charleston is the largest population center in the area with approximately 64,000 residents (U.S. Department of Commerce, 1981).
The area is highly industrialized. It contains major facilities for the manufacture and processing of chemicals and alloys, as well as coal mines and coal-fired, electric-power generating plants.
The topography of the area adjacent to the flat Kanawha flood plain is the typical hilly terrain found in the dissected Appalachian Plateaus physiographic province (Fenneman and Johnson, 1946). Maximum relief of the hills is about 1,400 feet in the upstream part of the basin and about 300 feet in the downstream part. The flood plain is about 1.0 miles wide at its widest point. The elevation of the flood plain ranges from about 575 feet above sea level at Point Pleasant to greater than 650 feet above sea level at Gauley Bridge. The elevation of the navigable section of the Kanawha River is controlled by four locks and dams with the following pool elevations (above sea level): Gallipolis (on the Ohio River), 538 feet; Winfield, 566 feet; Marmet, 590 feet; and London, 614 feet.
1.4 Previous Investigations
NUMEROUS STUDIES HAVE BEEN MADE OF THE GEOLOGY AND HYDROLOGY OF THE AREA
The geology of the area was studied in detail in the early part of the century, and, more recently, the hydrology has been studied in basinwide, countywide, and local projects.
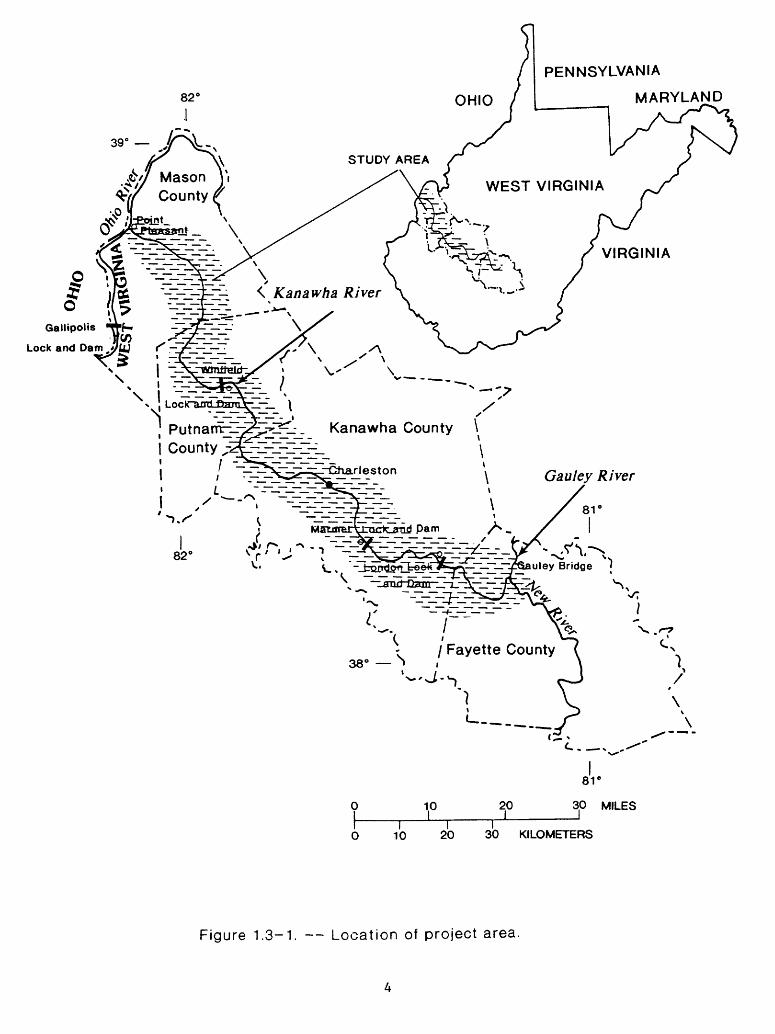
The geology of the study area is described in three county reports by Krebs (1911 and 1914) and Hennen (1919), and it also is shown on the "1968 Geologic Map of West Virginia" (Cardwell and others, 1968).
The geologic units beneath the rocks saturated by freshwater are discussed in oil and gas reports of the counties in the project area, including those by Haught (1960) and Overbey (1961).
82
PENNSYLVANIA
MARYLAND
39° '
IGallipolis
Lock and Dam
Kanawha County \
10 20
81 C
30 MILES
I I I 10 20 30 KILOMETERS
Figure 1.3-1. Location of project area.
A description of the hydrology of the entire Kanawha River basin is published in the "Kanawha River Basin Comprehensive Study" by Johnson and Williams (1969). Two atlases by Ferrell (1984a and 1984b) describe the geology and ground-water hydrology of the Elk River and the minor tributary basins of the Kanawha River. The ground- water hydrology of Kanawha County is described in "Water Resources in Kanawha County, West Virginia" by Doll and others (1960). U.S. Geological Survey Open-File Report 81-803 "Hydrology of Area 9, Eastern Coal Province, West Virginia," by Ehlke and others (1982) describes both the surface-water and ground-water resources of the Kanawha drainage basin. Areas described by several of the preceding reports are shown in figure 1.4-1.
Numerous reports that discuss the geology and hydrology of alluvial aquifers outside this project area are available. Some are listed as selected references in this report (section 7.0). Among the more noteworthy are: Gallaher and Price (1966), Grain (1966), Rorabaugh (1946 and 1956), Morris and Fidler (1969), Whitesides and Ryder (1969), Grubb and Zehner (1973), Jeffords (1945), and Morris and Eagon (1971).
1.5 Climate and Recharge
POTENTIAL FOR RECHARGE VARIES SEASONALLY
The potential for recharge to the ground-water reservoir is greater during winter and spring.
Potential for recharge to the ground-water reservoir is greater from November through April than during the rest of the year because precipitation is significantly greater than evapotranspiration during these months. Mean monthly precipitation was at least 1 inch greater than the estimated mean monthly evapotranspiration, according to the Munson P.E. Index (Munson, 1966) for each of these months for the period 1951 80 (table 1.5-1). Mean monthly precipitation slightly exceeded mean monthly evapotranspiration in May, July, September, and October and was less than mean monthly evapotranspiration in June and August. Mean annual evapotranspiration was estimated to be 28.87 inches (Munson, 1966). Mean annual evapotranspiration estimates of 29.44 and 29.00 inches were made by interpolating data in Chang and others (1976, p. 84) and Farnsworth and others (1982), respectively. Wilmoth (1966) adapted a water-budget study of the Pocatalico River basin and Mason and Putnam Counties and estimated a mean annual evapotranspiration of 25.2 inches.
82'
i
39'
Oil and Gas Report
(Overbcy. 1961)
\ County Report
\ (Krebs. 1911)
LARGER AREAS COVERED BY PUBLISHED GEOLOGIC AND HYDROLOGIC REPORTS
Geologic map of Weat Virginia (Cardwell and other*. 1868)
Hydrology of Area 0 (EMk* and other*. 1082)
Kanawha Basin comprehensive study (Johnson and Williams. 1060)
Kanawha River navigation study (U.S. Army Corp* of Engineer*. 1083)
Ground-water hydrology of the minor tributaries to the Kanawha River
(Ferrell. 1884a>
Drainage area* of the Kanawha River Basin (Mathes and others. 1982)
Ground-water Report (Doll and others. 1960)
/ xGrou.d-w.t.r Report Joutnam(wn.oin.iNO T*:ounty
Ground-water Atlas
(Ferrell./'7
County Report (Krebs. 1914)Kanawha County \
\ Oil and Gas Report (Haught, 1960)
Gauley River
County Report
(Hennen. 1919)
Ground-water Report
(Jeffords and Nace, 1946)
38'
<________
0
0
10
[ i 10 20
81*
20 30 MILES
30 rOLOMETERS
Figure 1.4-1. Areas covered by published geologic and hydrologic reports
(see selected references for complete citations).
6
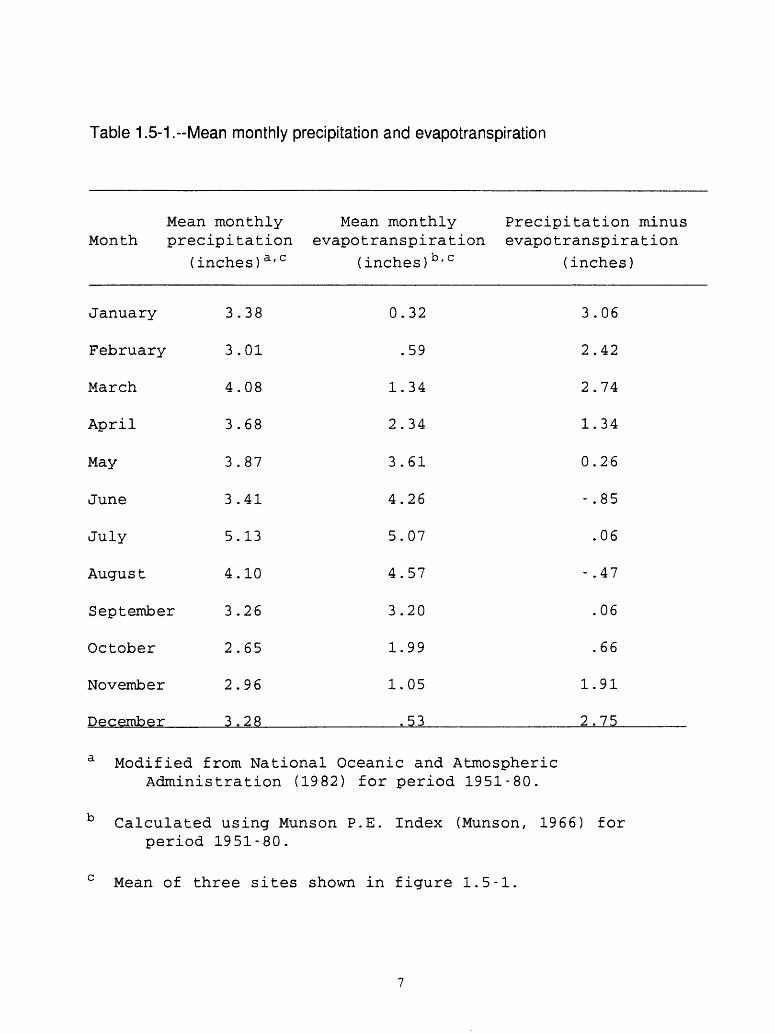
Table 1.5-1 .--Mean monthly precipitation and evapotranspiration
Mean monthly Mean monthly Month precipitation evapotranspiration
(inches) a ' c (inches) b ' c
January
February
March
April
May
June
July
August
September
October
November
December
3
3
4
3
3
3
5
4
3
2
2
3
.38
.01
.08
.68
.87
.41
.13
.10
.26
.65
.96
.28
0
1
2
3
4
5
4
3
1
1
.32
.59
.34
.34
.61
.26
.07
.57
.20
.99
.05
.53
Precipitation minus evapotranspiration
(inches)
3.06
2.42
2.74
1.34
0.26
- .85
.06
- .47
.06
.66
1.91
2.75
a Modified from National Oceanic and Atmospheric Administration (1982) for period 1951-80.
b Calculated using Munson P.E. Index (Munson, 1966) for period 1951-80.
c Mean of three sites shown in figure 1.5-1.
Fluctuations in ground-water level indicate that more recharge occurs in late winter and early spring than in summer and fall. Doll and others (1960) wrote the following about ground-water levels in Kanawha County: "The water level typically is highest in the late winter and early spring, when recharge to the ground-water reservoirs is greatest, and declines to be its lowest position in the late summer and early autumn, because evaporation and transpiration intercept most of the precipitation during the growing season and little remains for percolation down to the ground-water reservoirs." Water levels in an observation well in Putnam County studied by Wilmoth in 1966 indicated a reduction in ground-water storage during the summer and early fall and an increase during the remainder of the year when evapotranspiration was reduced and soils were nearly saturated.
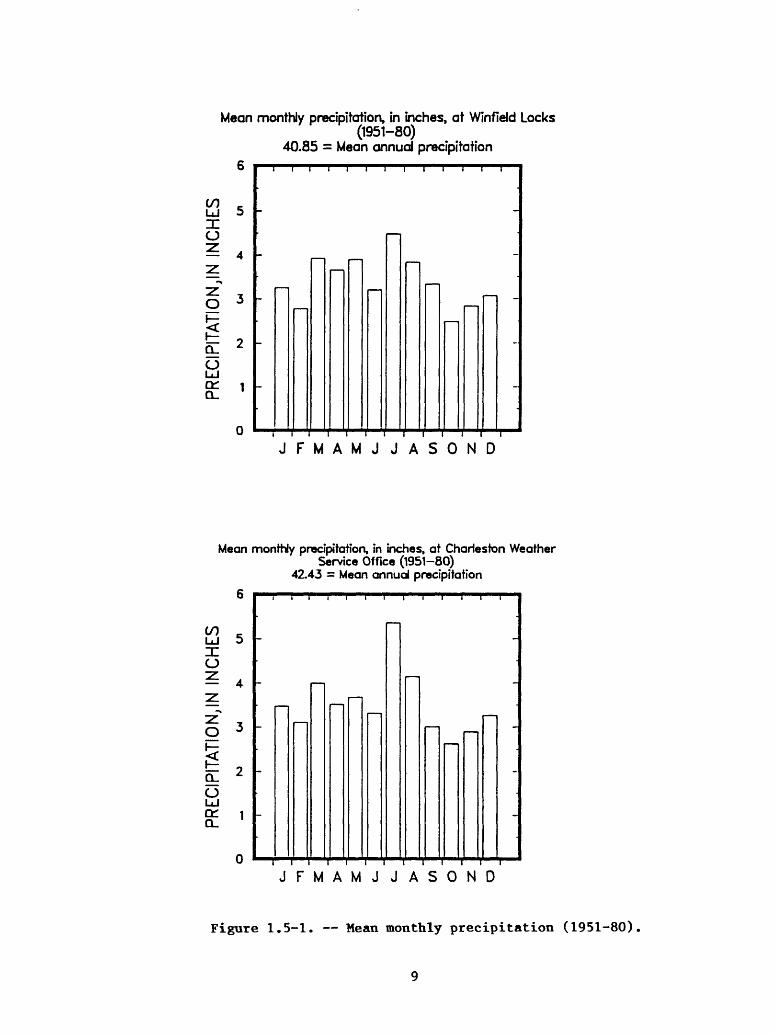
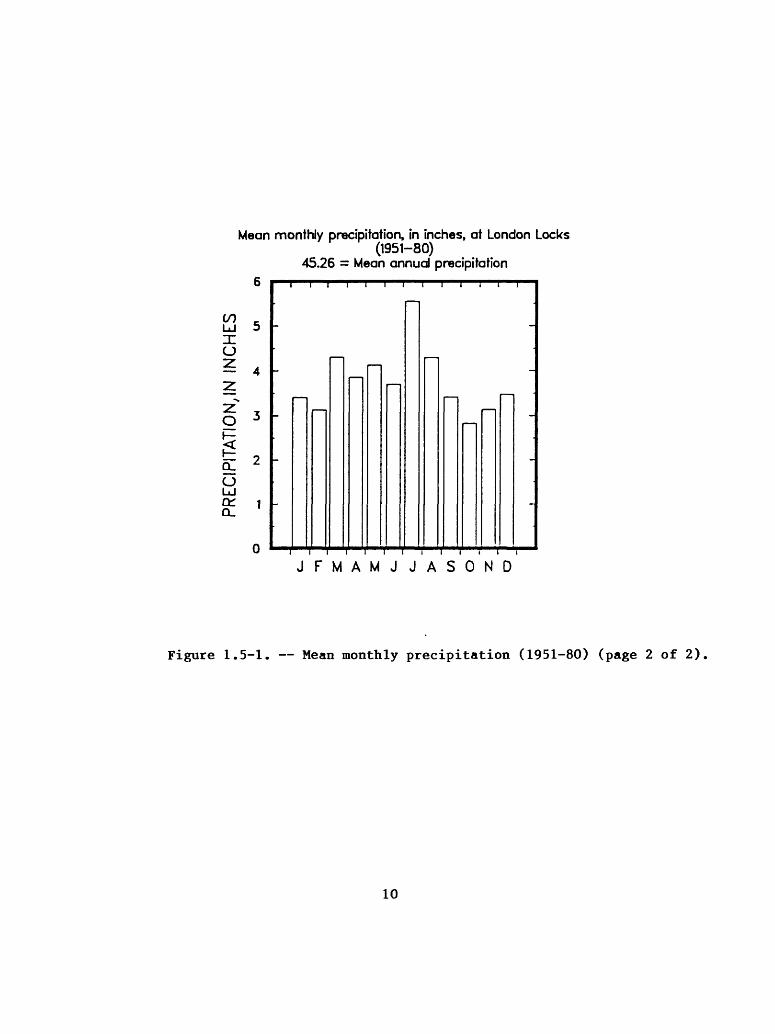
Recharge from precipitation also varies seasonally because of variations in the form and rate of precipitation, in the condition of the ground surface, and in the density of the forest canopy. During winter and early spring, precipitation is usually less intense and more widespread; thus, it is more conducive to recharge than summer thunderstorms of greater intensity and smaller coverage which are more conducive to runoff. If there is a snow pack, melting often increases soil moisture, except when the ground is frozen. Figure 1.5-1 shows the mean monthly and mean annual precipitation for three locations.
Forest areas reduce the water available for recharge because trees intercept precipitation before it hits the ground and the ground covering of leaves or litter absorbs a large amount of moisture. Based on two formulas given in Chang and others (1976, p. 78), the forest canopy intercepts 13 to 22 percent of the precipitation. More precipitation is intercepted from May through October when the leaf canopy is full than from November through April. Although the Kanawha River flood plain does not have a significant amount of forest area, the adjacent hills are covered mostly by deciduous and mixed forest.
1.6 Ground-Water Use
MORE THAN 4.8 BILLION GALLONS OF GROUND WATER PUMPED IN 1980
Ground water in the four-county project area is withdrawn for public supply, industry, mining, and domestic use.
Ground-water use in Fayette, Kanawha, Mason, and Putnam Counties was at least 4.8 billion gallons in 1980 for public supply, mining, and domestic purposes, according to Stevens and Lessing (1982). This includes the entire county areas, but does not include industrial use. Only a small percentage of the 4.8 billion-gallon withdrawal was from the alluvial and bedrock aquifers along the Kanawha River.
Mean montNy precipitation, in inches, at Winfield Locks(1951-80)
40.85 = Mean annual precipitation6
c LJ 531 O2 4
llO
JFMAMJJASOND
Mean monthly precipitation, in inches, at Charleston WeatherService Office (1951-80)
42.43 = Mean annual precipitation
LJ 5IE o 4
O LJ
JFMAMJJASOND
Figure 1.5-1. Mean monthly precipitation (1951-80)
Mean monthly precipitation, in inches, at London Locks(1951-80)
45.26 = Mean annual precipitationo
Ld 5 I (J
2 4 2
-«.
o 3
ol 2O Ld
0
-
-
-
-
-
1 1 1
1 |
i i i i i i
-
i -
-
-
i i i i i i i i i i i i i
JFMAMJJASOND
Figure 1.5-1. Mean monthly precipitation (1951-80) (page 2 of 2)
10
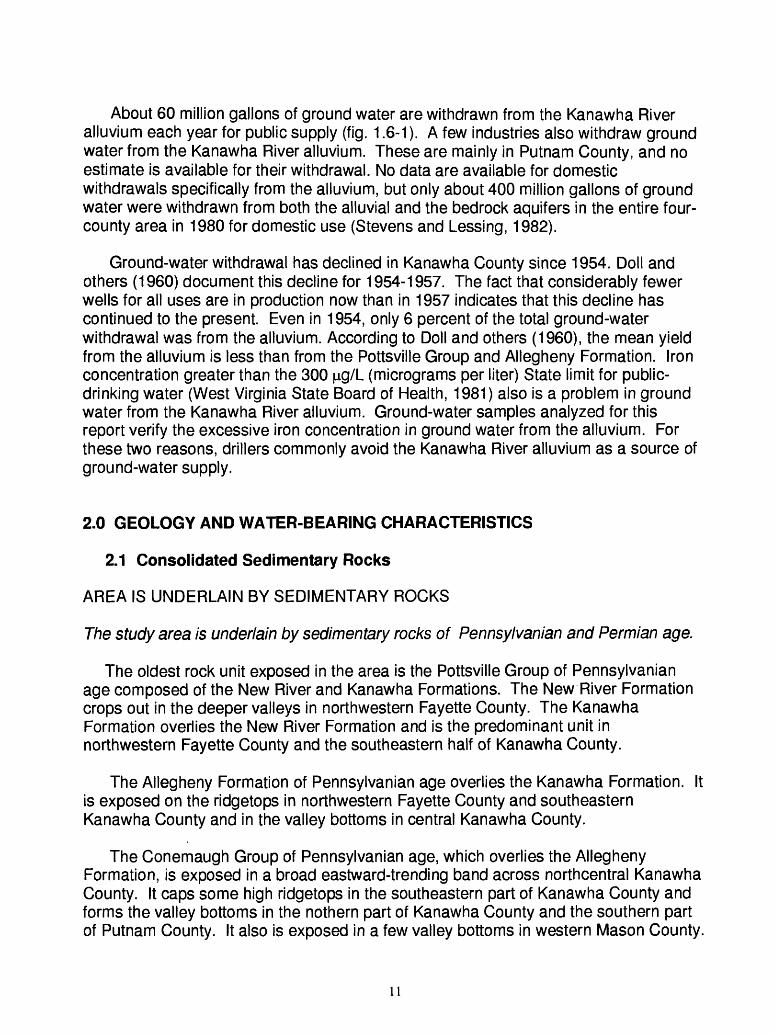
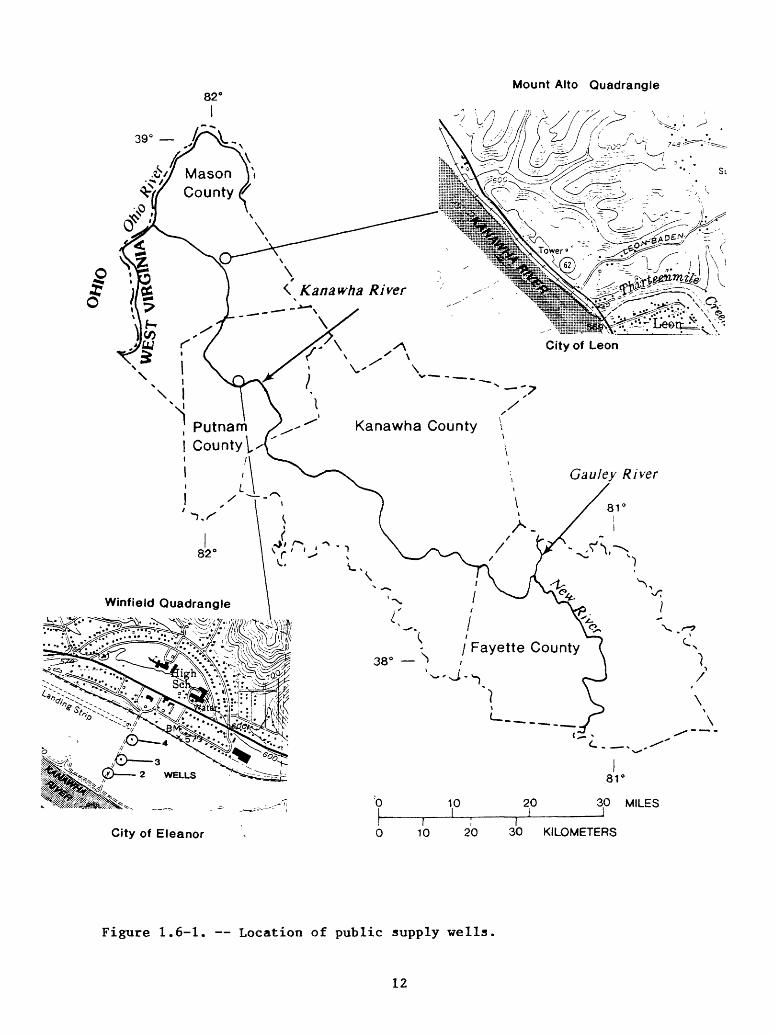
About 60 million gallons of ground water are withdrawn from the Kanawha River alluvium each year for public supply (fig. 1.6-1). A few industries also withdraw ground water from the Kanawha River alluvium. These are mainly in Putnam County, and no estimate is available for their withdrawal. No data are available for domestic withdrawals specifically from the alluvium, but only about 400 million gallons of ground water were withdrawn from both the alluvial and the bedrock aquifers in the entire four- county area in 1980 for domestic use (Stevens and Lessing, 1982).
Ground-water withdrawal has declined in Kanawha County since 1954. Doll and others (1960) document this decline for 1954-1957. The fact that considerably fewer wells for all uses are in production now than in 1957 indicates that this decline has continued to the present. Even in 1954, only 6 percent of the total ground-water withdrawal was from the alluvium. According to Doll and others (1960), the mean yield from the alluvium is less than from the Pottsville Group and Allegheny Formation. Iron concentration greater than the 300 j^g/L (micrograms per liter) State limit for public- drinking water (West Virginia State Board of Health, 1981) also is a problem in ground water from the Kanawha River alluvium. Ground-water samples analyzed for this report verify the excessive iron concentration in ground water from the alluvium. For these two reasons, drillers commonly avoid the Kanawha River alluvium as a source of ground-water supply.
2.0 GEOLOGY AND WATER-BEARING CHARACTERISTICS
2.1 Consolidated Sedimentary Rocks
AREA IS UNDERLAIN BY SEDIMENTARY ROCKS
The study area is underlain by sedimentary rocks of Pennsylvanian and Permian age.
The oldest rock unit exposed in the area is the Pottsville Group of Pennsylvanian age composed of the New River and Kanawha Formations. The New River Formation crops out in the deeper valleys in northwestern Fayette County. The Kanawha Formation overlies the New River Formation and is the predominant unit in northwestern Fayette County and the southeastern half of Kanawha County.
The Allegheny Formation of Pennsylvanian age overlies the Kanawha Formation. It is exposed on the ridgetops in northwestern Fayette County and southeastern Kanawha County and in the valley bottoms in central Kanawha County.
The Conemaugh Group of Pennsylvanian age, which overlies the Allegheny Formation, is exposed in a broad eastward-trending band across northcentral Kanawha County. It caps some high ridgetops in the southeastern part of Kanawha County and forms the valley bottoms in the nothern part of Kanawha County and the southern part of Putnam County. It also is exposed in a few valley bottoms in western Mason County.
11
82°Mount Alto Quadrangle
39°
D 10
81
20 30 MILES
City o1 Eleanor 10 20 30 KILOMETERS
Figure 1.6-1. Location of public supply wells
12
The Monongahela Group of Pennsylvanian age is exposed in a large crescent- shaped area from northern Kanawha County, across central Putnam County, and northward along the western side of Mason County.
The Dunkard Group of Pennsylvanian and Permian age overlies the Monongahela Group. It is exposed in the northern tip of Kanawha County and the eastern parts of Putnam and Mason Counties. The stratigraphic nomenclature used in this report follows the usage of the West Virginia Geological and Economic Survey and does not necessarily conform to that used by the U.S. Geological Survey.
The geologic structure in the study area is a series of gentle notheastward-trending anticlines and synclines. The regional dip is to the northwest (Cardwell and others, 1968).
The yield of water from wells that tap the consolidated rock units that underlie the Kanawha River flood plain and minor tributary basins is much lower on the average than the yield from the alluvium. The yield from all consolidated rock units ranges from 0.1 to 350 gal/min (gallons per minute); the median yield is approximately 8 gal/min. Most of the wells that tap the consolidated rock units derive water from the Monongahela and Conemaugh Groups. The median yield for both rock units is approximately 7 gal/min. A few wells derive water from the Pottsville Group, Allegheny Formation, and Dunkard Group. Well yields from the Pottsville Group and Allegheny Formation often exceed well yields from the alluvium (Doll and others, 1960).
2.2 Unconsoiidated Alluvial Deposits
THE ALLUVIUM, WHICH IS MORE THAN 70 FEET THICK IN SOME PLACES, PROVIDES CONSIDERABLE GROUND-WATER STORAGE
The alluvial deposits of Quaternary age are limited mostly to the flood plain of the Kanawha River but contain an estimated 74 billion gallons of ground water.
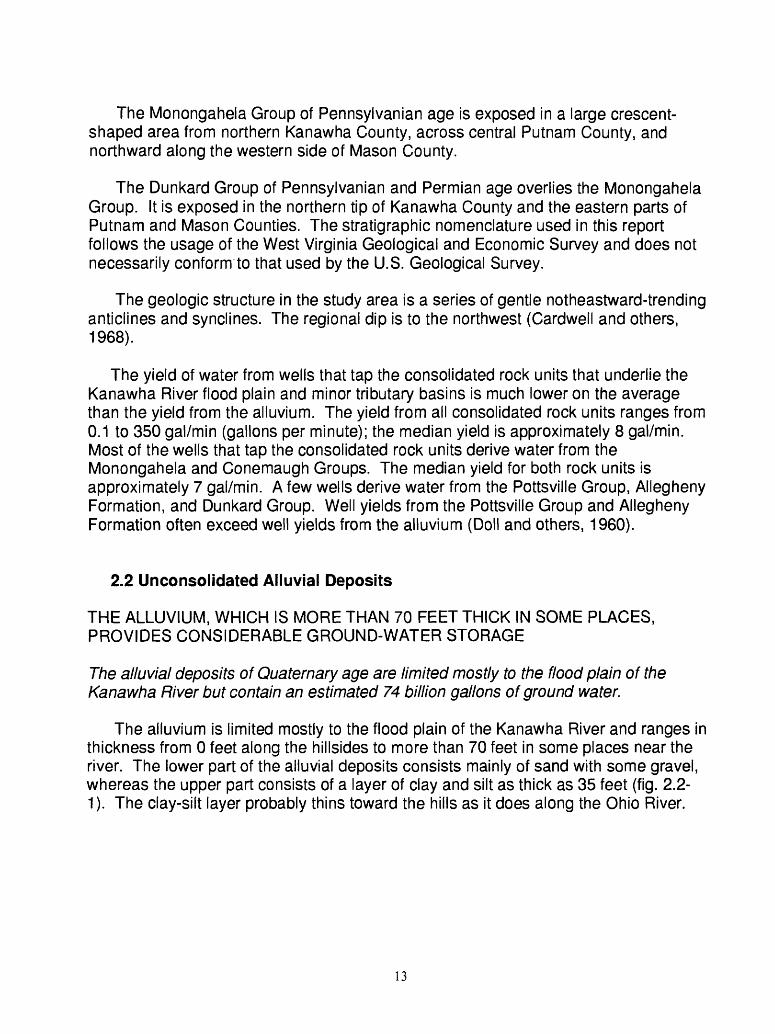
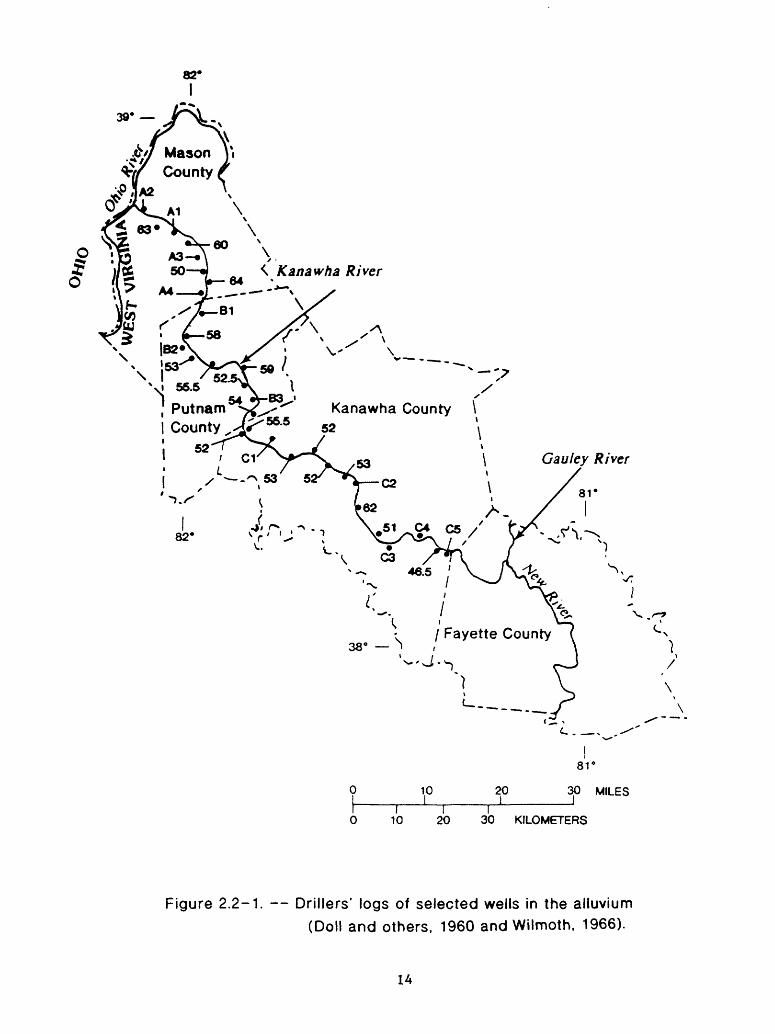
The alluvium is limited mostly to the flood plain of the Kanawha River and ranges in thickness from 0 feet along the hillsides to more than 70 feet in some places near the river. The lower part of the alluvial deposits consists mainly of sand with some gravel, whereas the upper part consists of a layer of clay and silt as thick as 35 feet (fig. 2.2- 1). The clay-silt layer probably thins toward the hills as it does along the Ohio River.
13
39*
%N1 54
; Putnam County
52
Kanawha County \t
s // Fayette County
0
0
10
I I10 20
81°
20 30 MILES
I 30 KILOMETERS
Figure 2.2-1. Drillers' logs of selected wells in the alluvium (Doll and others, 1960 and Wilmoth, 1966).
14
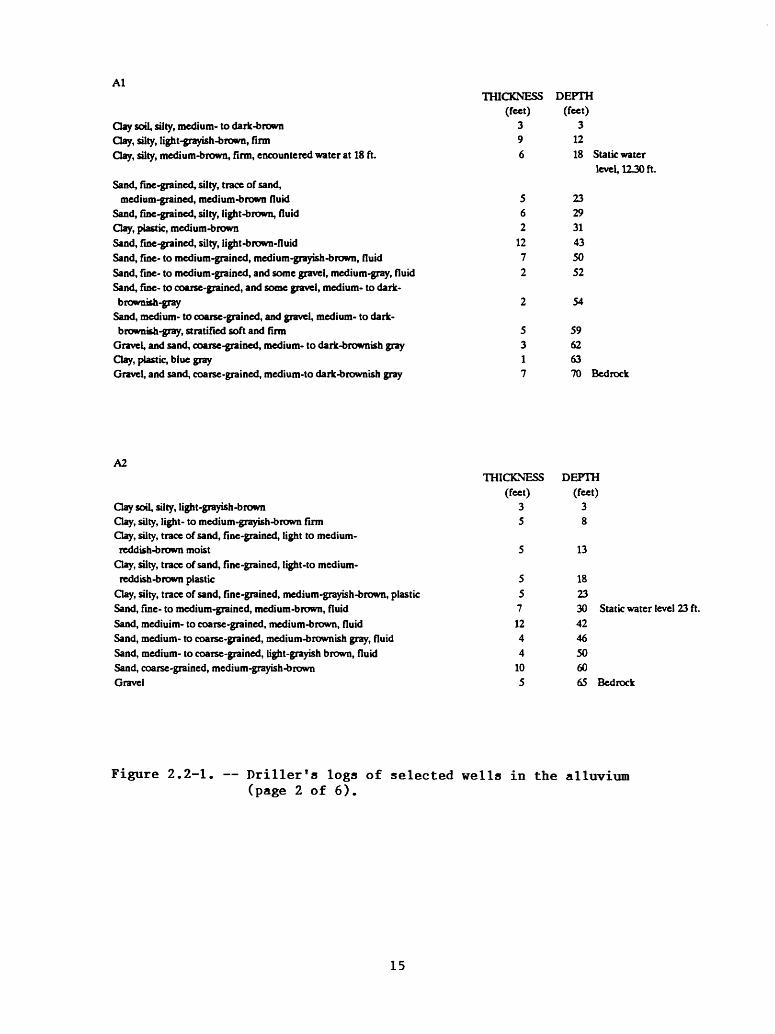
Al
Clay soil, silty, medium- to dark-brownClay, silty, light-grayish-brown, firmClay, silty, medium-brown, firm, encountered water at 18 ft.
Sand, fine-grained, silty, trace of sand, medium-grained, medium-brown fluid
Sand, fine-grained, silty, light-brown, fluidClay, plastic, medium-brownSand, fine-grained, silty, light-brown-fluidSand, fine- to medium-grained, medium-grayish-brown, fluidSand, fine- to medium-grained, and some gravel, medium-gray, fluidSand, fine- to coarse-grained, and some gravel, medium- to dark- brownish-gray
Sand, medium- to coarse-grained, and gravel, medium- to dark- brownish-gray, stratified soft and firm
Gravel, and sand, coarse-grained, medium- to dark-brownish grayClay, plastic, blue grayGravel, and sand, coarse-grained, medium-to dark-brownish gray
THICKNESS(feet)
396
562
1272
DEPTH (feet)
3 1218 Static water
level, 12JO ft
232931435052
54
59626370 Bedrock
A2
Clay soil, silty, iight-grayish-brown Qay, silty, light- to medium-grayish-brown firm Clay, silty, trace of sand, fine-grained, light to medium- reddish-brown moist
Clay, silty, trace of sand, fine-grained, light-to medium- reddish-brown plastic
Clay, silty, trace of sand, fine-grained, medium-grayish-brown, plastic Sand, fine- to medium-grained, medium-brown, fluid Sand, mediuim- to coarse-grained, medium-brown, fluid Sand, medium- to coarse-grained, medium-brownish gray, fluid Sand, medium- to coarse-grained, light-grayish brown, fluid Sand, coarse-grained, medium-grayish-brown Gravel
THICKNESS DEPTH(feet) (feet)
3 35 8
5 13
5 185 237 30 Static water level 23 ft.12 424 464 50
10 605 65 Bedrock
Figure 2.2-1. Driller's logs of selected wells in the alluvium (page 2 of 6).
15
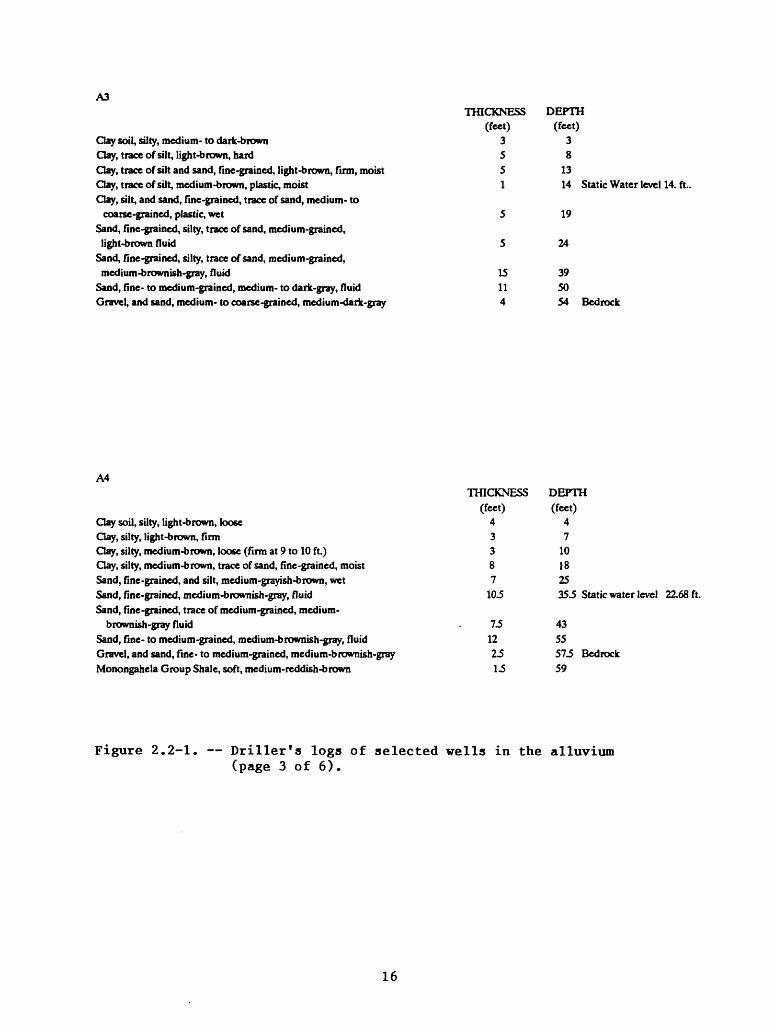
A3
Clay soil, silty, medium- to dark-brownClay, trace of silt, light-brown, hardClay, trace of silt and sand, fine-grained, light-brown, firm, moistClay, trace of silt, medium-brown, plastic, moistClay, silt, and sand, fine-grained, trace of sand, medium- to
coarse-grained, plastic, wet Sand, fine-grained, silty, trace of sand, medium-grained,light-brown fluid
Sand, fine-grained, silty, trace of sand, medium-grained,medium-brownish-gray, fluid
Sand, fine- to medium-grained, medium- to dark-gray, fluid Gravel, and sand, medium- to coarse-grained, medium-dark-gray
THICKNESS DEPTH(feet) (feet)
3 35 85 13I 14 Static Water level 14. ft,
5 19
5 24
15 39II 504 54 Bedrock
A4
Clay soil, silty, light-brown, loose Clay, silty, light-brown, firm Clay, silty, medium-brown, loose (firm at 9 to 10 ft.) day, silty, medium-brown, trace of sand, fine-grained, moist Sand, fine-grained, and silt, medium-grayish-brown, wet Sand, fine-grained, medium-brownish-gray, fluid Sand, fine-grained, trace of medium-grained, medium-
brownish-gray fluidSand, fine- to medium-grained, medium-brownish-gray, fluid Gravel, and sand, fine- to medium-grained, medium-brownish-gray Monongahela Group Shale, soft, medium-reddish-brown
THICKNESS DEPTH(feet) (feet)
4 43 73 108 |87 25
10.5 35.5 Static water level 22.68ft.
12 4312 5523 573 Bedrock13 59
Figure 2.2-1. Driller's logs of selected wells in the alluvium (page 3 of 6).
16
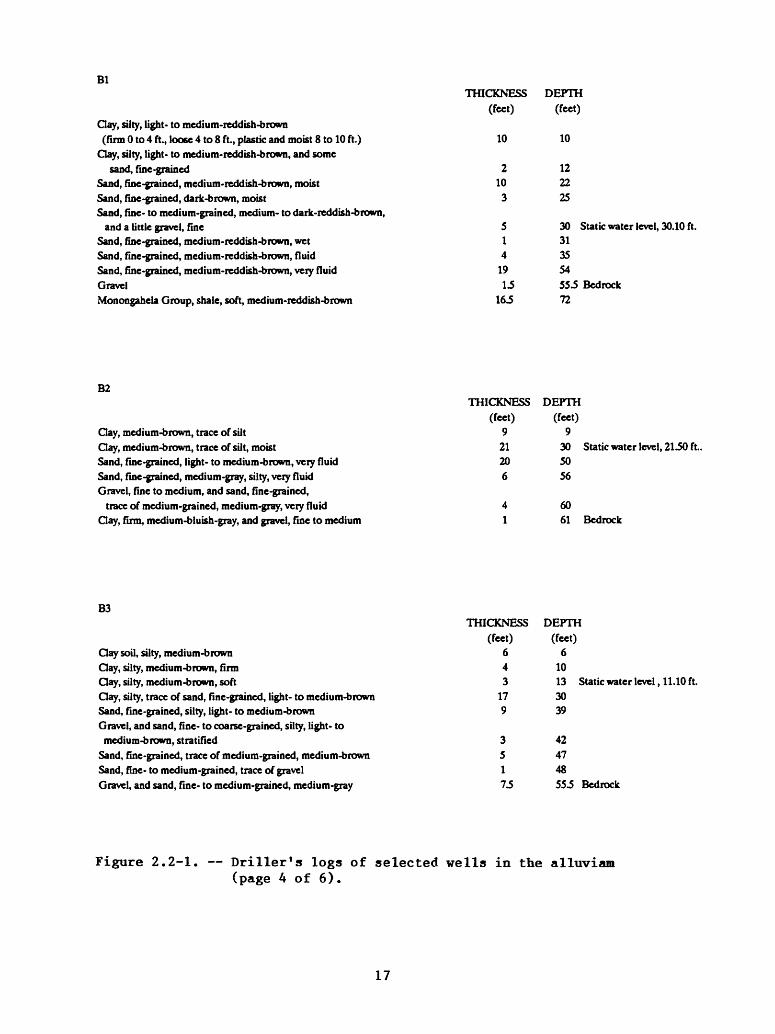
Bl
Clay, silty, light- to medium-reddish-brown(firm 0 to 4 ft., loose 4 to 8 ft., plastic and moist 8 to 10 ft.)
Clay, silty, light- to medium-reddish-brown, and somesand, fine-grained
Sand, fine-grained, medium-reddish-brown, moist Sand, fine-grained, dark-brown, moist Sand, fine- to medium-grained, medium- to dark-reddish-brown,
and a little gravel, fineSand, fine-grained, medium-reddish-brown, wet Sand, fine-grained, medium-reddish-brown, fluid Sand, fine-grained, medium-reddish-brown, very fluid Gravel Monongahela Group, shale, soft, medium-reddish-brown
THICKNESS DEPTH(feet) (feet)
10 10
2 1210 22
3 25
5 30 Static water level, 30.10 ft.1 314 35
19 5413 553 Bedrock
163 72
B2
Clay, medium-brown, trace of siltClay, medium-brown, trace of silt, moistSand, fine-grained, light- to medium-brown, very fluidSand, fine-grained, medium-gray, silty, very fluidGravel, fine to medium, and sand, fine-grained,
trace of medium-grained, medium-gray, very fluid Clay, firm, medium-bluish-gray, and gravel, fine to medium
THICKNESS DEPTH(feet) (feet)
9 921 30 Static water level, 2130 ft..20 506 56
4 601 61 Bedrock
B3
Clay soil, silty, medium-brown Clay, silty, medium-brown, firm Clay, silty, medium-brown, softClay, silty, trace of sand, fine-grained, light- to medium-brown Sand, fine-grained, silty, light- to medium-brown Gravel, and sand, fine- to coarse-grained, silty, light- to medium-brown, stratified
Sand, fine-grained, trace of medium-grained, medium-brown Sand, fine- to medium-grained, trace of gravel Gravel, and sand, fine- to medium-grained, medium-gray
THICKNESS DEPTH(feet) (feet)
6 64 103 13 Static water level, 11.10 ft.
17 309 39
3 425 471 4873 553 Bedrock
Figure 2.2-1. Driller's logs of selected wells in the alluviam (page 4 of 6).
17
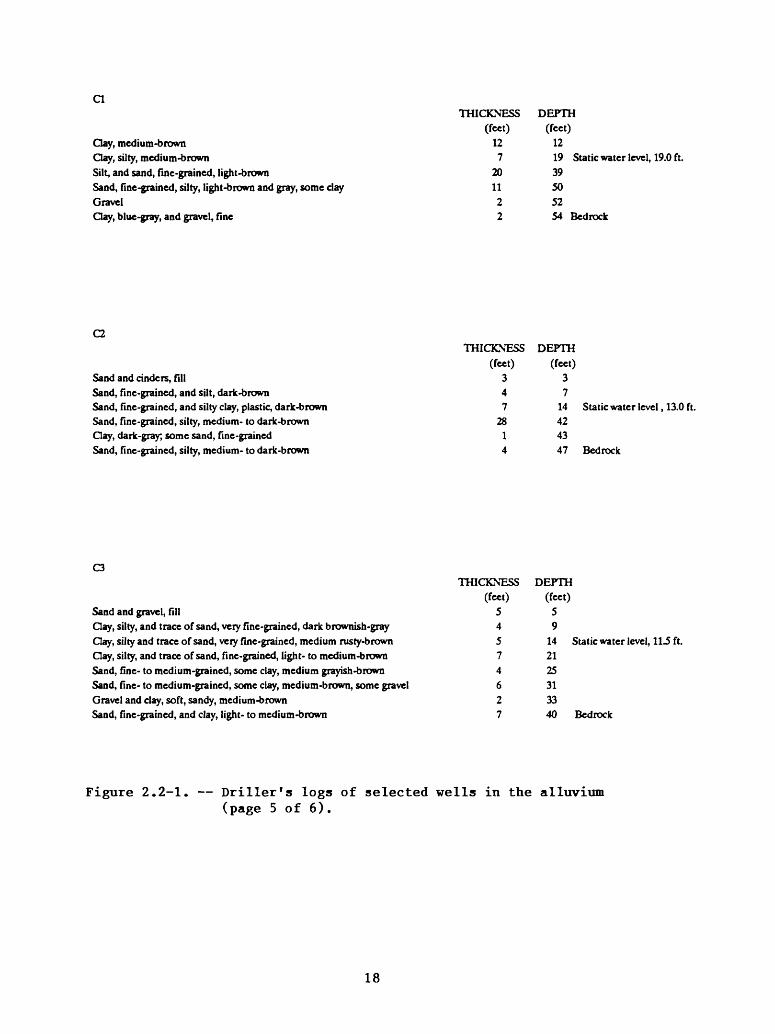
Clay, medium-brownClay, silty, medium-brownSilt, and sand, fine-grained, light-brownSand, fine-grained, silty, light-brown and gray, some clayGravelClay, blue-gray, and gravel, fine
THICKNESS DEPTH(feet) (feet)
12 127 19 Static water level, 19.0 ft.
20 3911 502 522 54 Bedrock
C2
Sand and cinders, fillSand, fine-grained, and silt, dark-brownSand, fine-grained, and silty clay, plastic, dark-brownSand, fine-grained, silty, medium- to dark-brownClay, dark-gray, some sand, fine-grainedSand, fine-grained, silty, medium- to dark-brown
THICKNESS DEPTH(feet) (feet)
3 34 77 14 Static water level, 13.0 ft.
28 421 434 47 Bedrock
C3
Sand and gravel, fillClay, silty, and trace of sand, very fine-grained, dark brownish-grayClay, silty and trace of sand, very fine-grained, medium rusty-brownClay, silty, and trace of sand, fine-grained, light- to medium-brownSand, fine- to medium-grained, some clay, medium grayish-brownSand, fine- to medium-grained, some clay, medium-brown, some gravelGravel and clay, soft, sandy, medium-brownSand, fine-grained, and clay, light- to medium-brown
THICKNESS DEPTH(feet)
54574627
(feet)59
142125313340
Static water level, 11.5 ft.
Bedrock
Figure 2.2-1. Driller's logs of selected wells in the alluvium (page 5 of 6).
18
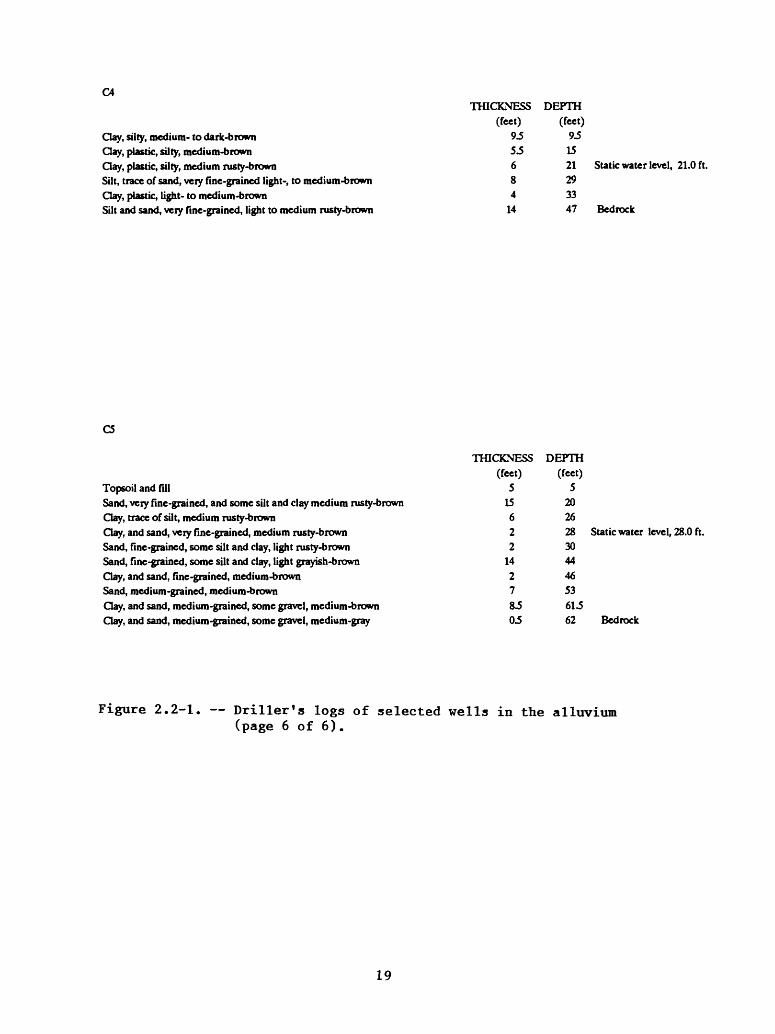
C4
Clay, silty, medium- to dark-brownClay, plastic, silty, medium-brownClay, plastic, silty, medium rusty-brownSilt, trace of sand, very fine-grained light-, to medium-brownClay, plastic, light- to medium-brownSilt and sand, very fine-grained, light to medium rusty-brown
THICKNESS DEPTH(feet)
95 53 6 8 4
14
(feet) 93 15 21 29 33 47
Static water level, 21.0ft.
Bedrock
C5
Topsoil and fillSand, very fine-grained, and some silt and clay medium rusty-brownClay, trace of silt, medium rusty-brownClay, and sand, very fine-grained, medium rusty-brownSand, fine-grained, some silt and clay, light rusty-brownSand, fine-grained, some silt and clay, light grayish-brownClay, and sand, fine-grained, medium-brownSand, medium-grained, medium-brownClay, and sand, medium-grained, some gravel, medium-brownClay, and sand, medium-grained, some gravel, medium-gray
THICKNESS DEPTH(feet) (feet)
5 515 206 262 28 Static water level, 28.0 ft.2 30
14 442 467 5383 61303 62 Bedrock
Figure 2.2-1. Driller's logs of selected wells in the alluvium (page 6 of 6).
19
The amount of water in storage in the Kanawha River alluvium can be estimated if certain assumptions are made. The areal extent of the alluvium is estimated to be about 64 square miles. The mean thickness of the saturated sand and gravel aquifer is estimated to be about 27 feet as determined from well logs and water-level measurements. This amounts to about 0.3 cubic mile of saturated aquifer, or about 1,100,000 acre-feet. Specific yield is assumed to be 20.5 percent, based on the porosity and specific retention of typical sand and gravel aquifers (Heath, 1983). Consequently, the amount of water in storage in the sand and gravel of the alluvial aquifer within the project area is approximately 228,000 acre-feet or 74 billion gallons.
The ground water in the alluvium is unconfined or semiconfined depending on whether the water table is in the clay-silt layer or not. In localities where the sand is relatively thick, semiconfined conditions probably exist. These conditions are more common at higher river stage.
Some alluvial wells along the Kanawha River are capable of yielding more than 100 gal/min. Yields from the Kanawha River alluvium are significantly less than yields from the Ohio River alluvium, which can exceed 1,000 gal/min. Yields of 24 alluvial wells ranged from 0.1 to 160 gal/min with a mean of 68 gal/min and a median of 60 gal/min.
3.0 GROUND-WATER SYSTEM
3.1 Recharge, Movement, and Discharge
AQUIFERS ARE IN A STATE OF EQUILIBRIUM
A state of natural equilibrium exists between the aquifers of the Kanawha River Valley and their sources of recharge and discharge. This equilibrium exists because ground- water withdrawal from these aquifers is negligible.
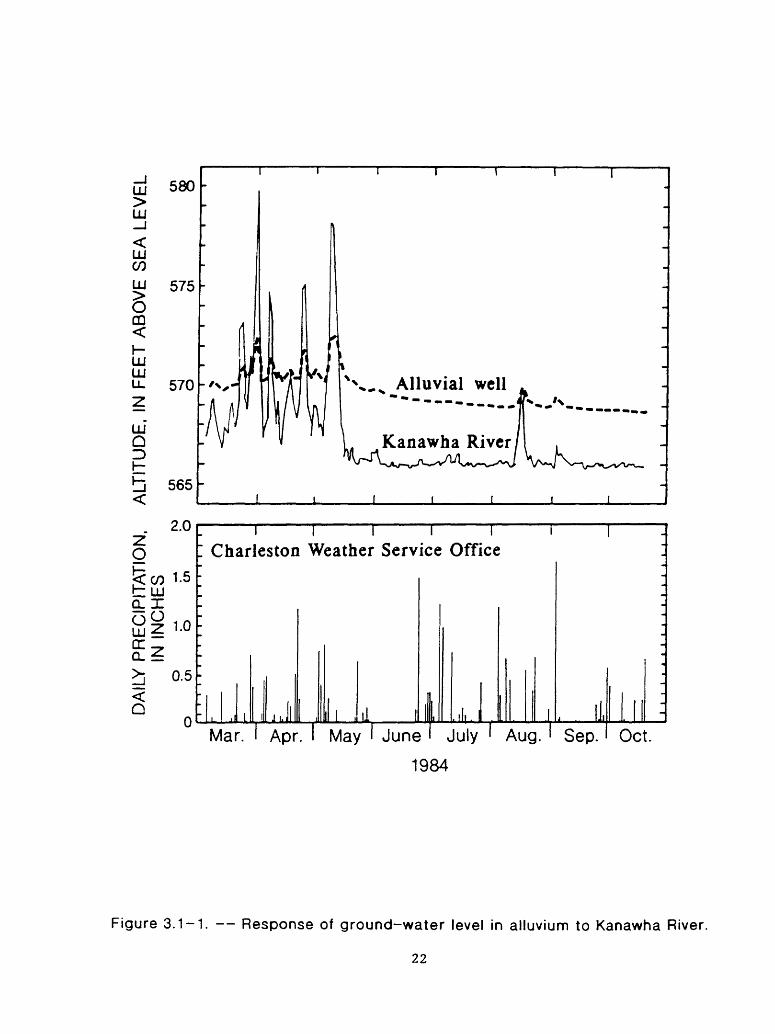
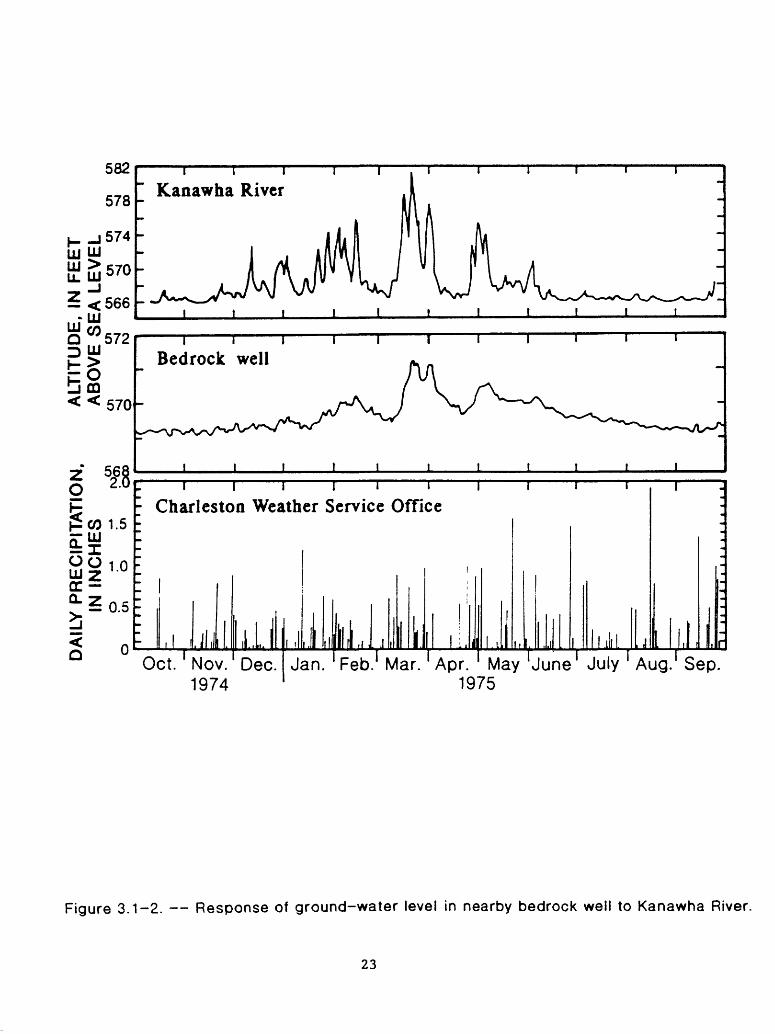
Static water levels in both the Kanawha River alluvium and the bedrock aquifer underlying the alluvium respond mainly to changes in the Kanawha River stage, indicating that the ground-water system is in a natural state of equilibrium with recharge and discharge sources. This equilibrium is especially pronounced in the Charleston area, where ground-water withdrawal is almost nonexistent. When the Kanawha River stage rises, the water level in the alluvial and bedrock wells rises in direct response. When the Kanawha River stage falls, ground-water levels return to their previous level within a few days. The ground-water levels do not indicate seasonal changes or changes in response to heavy preciptitation.
20
Figure 3.1-1 shows the water-level response of an alluvial well in the downtown Charleston area to the Kanawha River. The water level responds mainly to changes in river stage. Almost 90 percent of the time the water level in the well is higher than the river stage, indicating that the hydraulic gradient and direction of ground-water movement are toward the river and that the alluvial aquifer discharges into the Kanawha River. At the normal pool altitude of 566 feet, the water level in the well is approximately 3 feet higher than the river stage. Figure 3.1-2 shows that the water level in a bedrock well in the same vicinity responds similarly to changes in river stage.
Because of the equilibrium condition, it is difficult to determine the sources of recharge to the alluvium and bedrock aquifers. Because the permeability of the Kanawha River alluvium is much lower than that of the Ohio River alluvium (see next section, 3.2), recharge of the alluvial aquifer would be a slower process. The slope of the alluvial water table toward the Kanawha River as observed in figure 3.1-1 indicates that ground water in the adjacent hills could recharge the alluvium and underlying bedrock. The presence of saltwater at shallow depth under the Kanawha River alluvium (section 4.3) indicates the possible upward movement of ground water from the underlying bedrock to the alluvium. At high river stage, the Kanawha River could provide some recharge to the alluvium. Recharge from the Kanawha River also can be induced by pumping of wells close to the river. The natural hydraulic gradient in the alluvium toward the river is reversed from the river toward the alluvium about 10 percent of the time. Precipitation falling directly on the flood plain also could recharge the alluvium, although it does not show in figure 3.1-1 and the permeability of the upper part of the alluvium is relatively low. Finally, inflow from tributary streams is a possible source of recharge to the alluvium.
3.2 Hydraulic Characteristics of Alluvial Aquifer
SPECIFIC CAPACITY, SATURATED THICKNESS, TRANSMISSIVITY, AND HYDRAULIC CONDUCTIVITY WERE DETERMINED FOR THE KANAWHA RIVER ALLUVIUM
The alluvium has the following hydraulic characteristics: Mean specific capacity- 19 gallons per minute per foot of drawdown, mean saturated thickness of aquifer- 31 feet, mean transmissivity-390 feet squared per day, and mean hydraulic conductivity-17 feet per day.
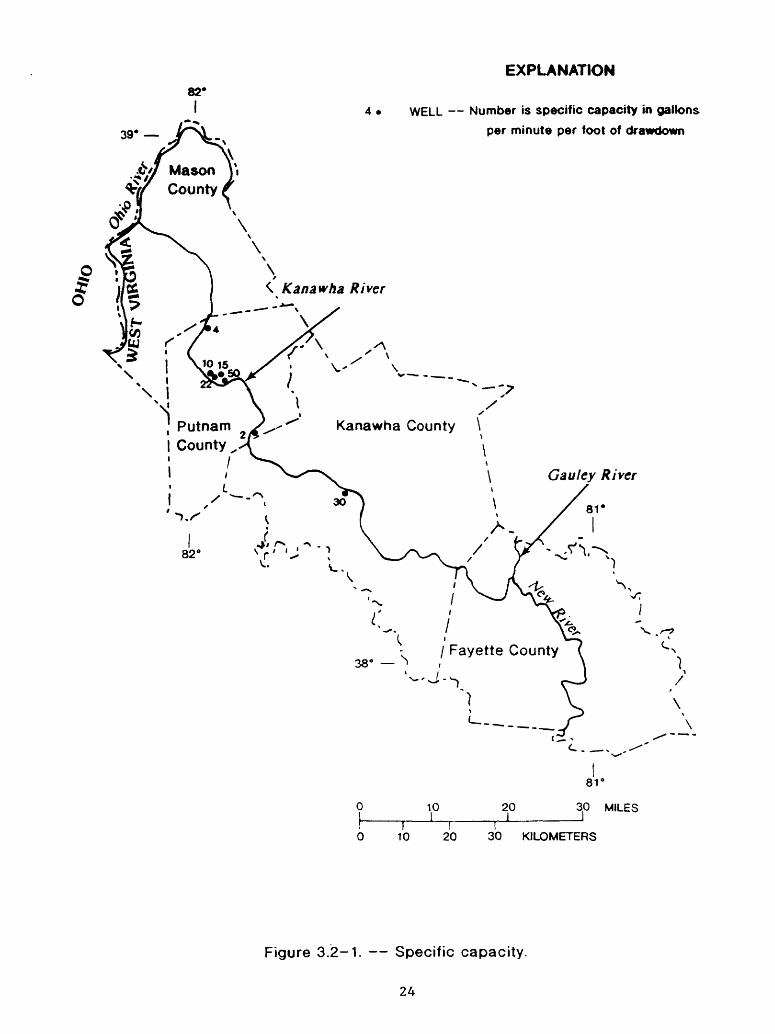
Specific capacity of seven wells in the study area ranged from 2 to 50 (gal/min)/ft (gallons per minute per foot of drawdown) with a mean of 19 (gal/min)/ft and a median of 15 (gal/min)/ft (fig.3.2-1). Specific-capacity data presented in this report were obtained from earlier studies by Wilmoth (1966) and Doll and others (1960). Drawdown for a given yield increases as well screens become partially clogged, and thus well efficiency decreases with time. Induced infiltration from the Kanawha River decreases drawdown and increases specific capacity.
21
LU 580 >LU
575
570
LU CO
LU
8CO<h-LU LU LJL
LUQ
b 565 <
2.02 O!<C01.5bLU CLX
^^ Alluvial well
Kanawha River
cr
Q
1.0
0.5
I I I I I
Charleston Weather Service Office
J L I . JlMar. I Apr. I May I June I July" Aug. ' Sep. Oct.
1984
Figure 3.1-1. Response of ground-water level in alluvium to Kanawha River.
22
to OJ
(D C
-*i
(D CO T ro T3 o (D o * (Q -^
O c 3 a I 0)
(D (D <
(D (D
0) -*i
(T »< cr
a> a -^ o o O * 0) D
0)
DA
ILY
PR
EC
IPIT
AT
ION
, IN
IN
CH
ES
P
r-
-
fog
O
en
O
en
AL
TIT
UD
E,
IN F
EE
T
AB
OV
E S
EA
LE
VE
Len
en
en
en
en
en
en
O_____[^
(J>
o
-U
oo
roI
I '
"~1
T 1
I
I I
I T
82*
39*
EXPLANATION
4 WELL Number is specific capacity in gallons
per minute per foot of drawdown
Kanawha County \
82
011 6
10ii i10 20
81°
20 30 MILESI I
I30 KILOMETERS
Figure 3.2-1. Specific capacity.
24
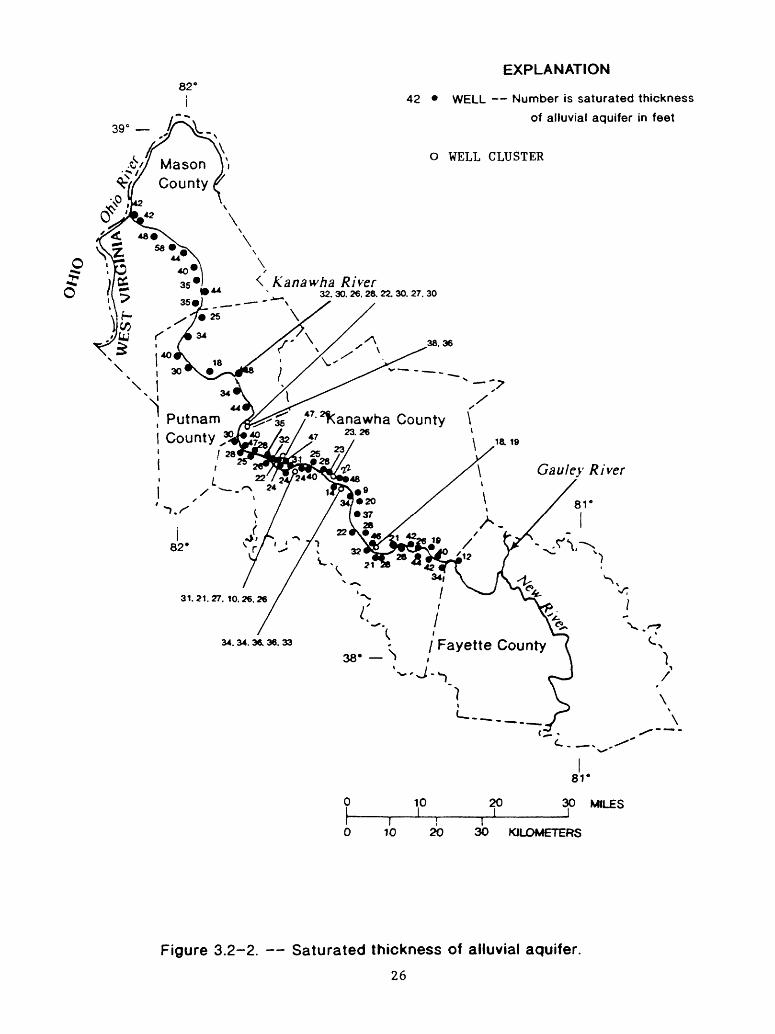
The saturated thickness of the alluvium ranged from 9 to 58 feet, with a mean of 31 feet and a median of 30 feet (fig. 3.2-2). These values are similar to those obtained for the Ohio River alluvium. Approximately 4 feet of the saturated zone is in the clay-silt layer that overlies the sand and gravel. Thus, semiconfined or confined conditions probably exist in much of the Kanawha River alluvium. Forty-seven of 87 alluvial wells had static water levels that were in the clay-silt zone that overlies the sand and gravel. Saturated thickness was determined by subtracting the depth to the static water level from the depth to bedrock.
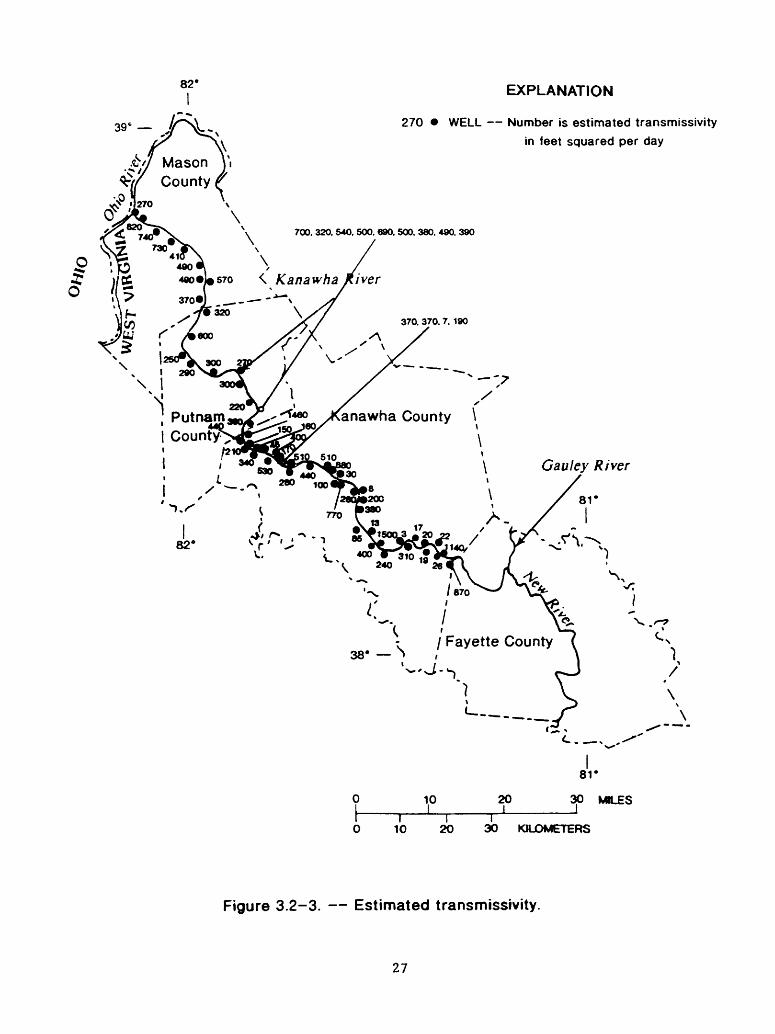
Estimated transmissivities ranged from 3 to 1,500 ft2/d (feet squared per day) with a mean of 390 ft2/d and a median of 370 ft2/d (fig. 3.2-3). These transmissivity values are smaller by a factor of 10 than the transmissivity values reported for the Ohio River alluvium. Transmissivity gives an indication of the rate of movement of ground water. Transmissivities were estimated from 67 well logs and the hydraulic conductivity of the alluvial material contained in these logs as determined by laboratory analysis in past studies by Wilmoth (1966) and Doll and others (1960).
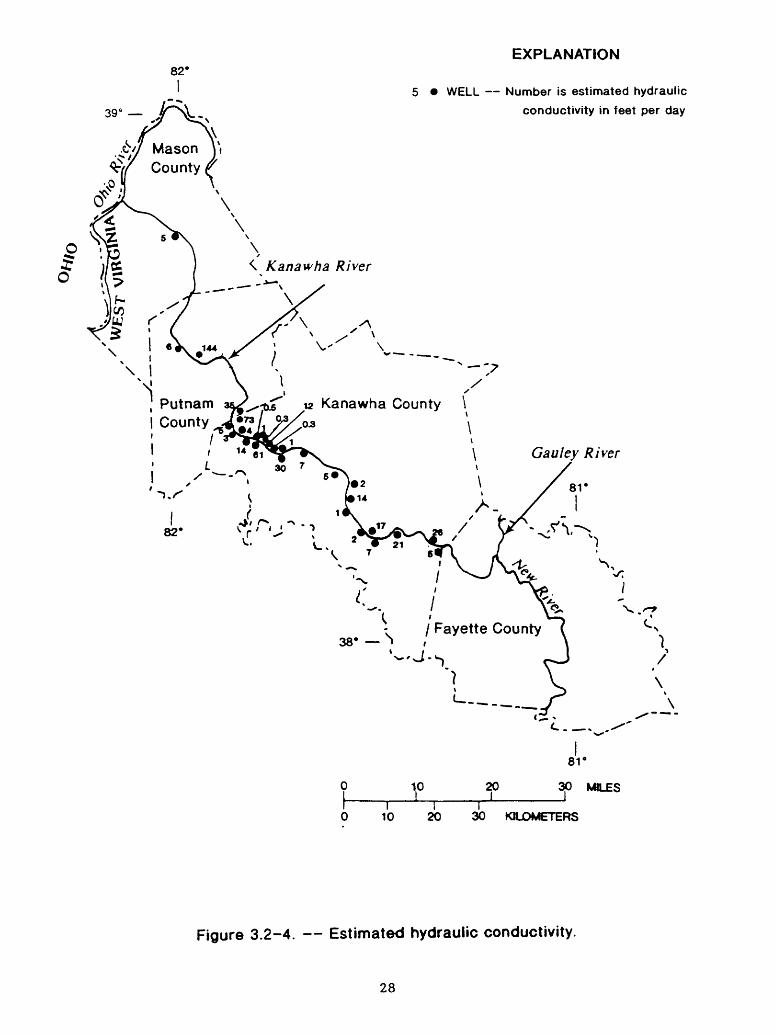
Hydraulic conductivity was estimated for 28 wells from permeability coefficients determined by laboratory testing of alluvial material and contained in previous reports by Wilmoth (1966) and Doll and others (1960). These coefficients were multiplied by 13 to obtain estimated hydraulic conductivities. Wilmoth (1966) discovered that permeability coefficients determined by aquifer tests for both the Ohio and Kanawha River alluvium were 13 times greater than those determined by laboratory analysis of alluvial material. The estimated hydraulic conductivities ranged from 0.3 to 144 ft/day (feet per day) with a mean of 17 ft/d and a median of 5 ft/d (fig. 3.2-4). The values are several times less than hydraulic conductivity values estimated for the Ohio River alluvium. The maximum of 144 ft/d was determined from an aquifer test. The hydraulic conductivity can be used to compute the specific discharge if the hydraulic gradient is known. Ground- water movement is in the direction of the hydraulic gradient. Under natural conditions, the hydraulic gradient slopes gently from the hills to the Kanawha River 90 percent of the time. Withdrawal of large quantities of water from wells close to the Kanawha River can reverse this gradient between the pumped wells and the river. The gradient can also be reversed during high river stage as noted in section 3.1. The direction and slope of the hydraulic gradient in the alluvium is affected close to lock and dam sites, where river pools of different elevations meet abruptly. Sources of recharge such as ponds, lakes, and streams on the alluvial flood plain also affect the hydraulic gradient.
All aquifer characteristics calculated in this report are variable with time and geographical location and should be used with discretion.
25
EXPLANATION
42 WELL Number is saturated thickness
of alluvial aquifer in feet
O WELL CLUSTER
Kanawha River_ 32. 30. 26. 28. 22. 30. 27. 30
Putnam County
/28
34. 34. 36, 36. 33
D 10
I ! D 10 20
81*
20 30 MILES
I 30 KILOMETERS
Figure 3.2-2. Saturated thickness of alluvial aquifer.
26
EXPLANATION
270 WELL Number is estimated transmissivity
in feet squared per day
700. 320, 540. 500. 690. 500. 380. 480. 380
anawha County \
10 20
81°
30 MILES
10I I __
20 30 KILOMETERS
Figure 3.2-3. Estimated transmissivity.
27
82°
39- - /%v
EXPLANATION
5 WELL Number is estimated hydraulic
conductivity in feet per day
20
81°
30 MILES
10 20I
30 KILOMETERS
Figure 3.2-4. Estimated hydraulic conductivity.
28
4.0 WATER QUALITY
4.1 Data Collection
GROUND-WATER SAMPLES FROM MORE THAN THIRTY WELLS WERE ANALYZED
Water samples from alluvial wells and bedrock wells on or near the alluvial flood plain were analyzed.
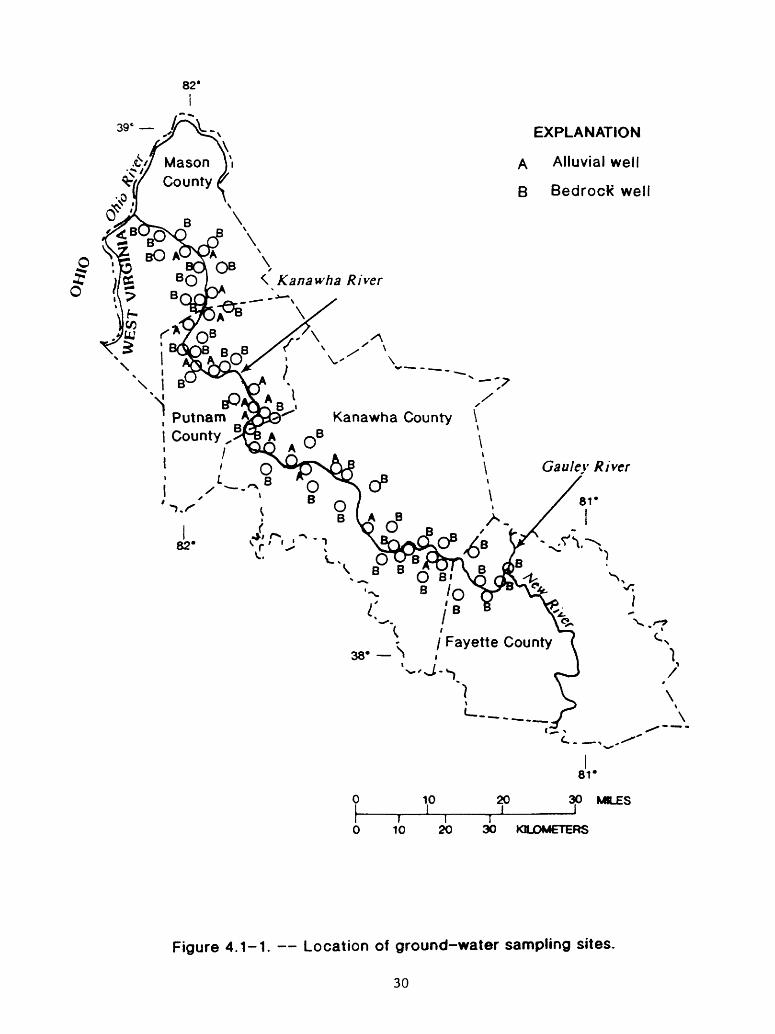
Thirty-six ground-water samples were analyzed during the study. Samples were collected from wells drilled into alluvium and wells drilled through the alluvium and into the underlying bedrock. Analyses included all major cations and anions, several metals, phenols, and dissolved organic carbon. Several additional samples from bedrock wells near the alluvial flood plain were collected during a previous study (Ferrell, 1984a) and are incorporated into this report. These wells were sampled for major cations and anions arid common metals. The location of sampled wells is shown on figure 4.1-1. Alluvial wells are designated with an "A" and bedrock wells with a "B". The data collected as part of this study are in U.S. Geological Survey files.
4.2 Water Type
SODIUM BICARBONATE WAS THE MOST COMMON WATER TYPE
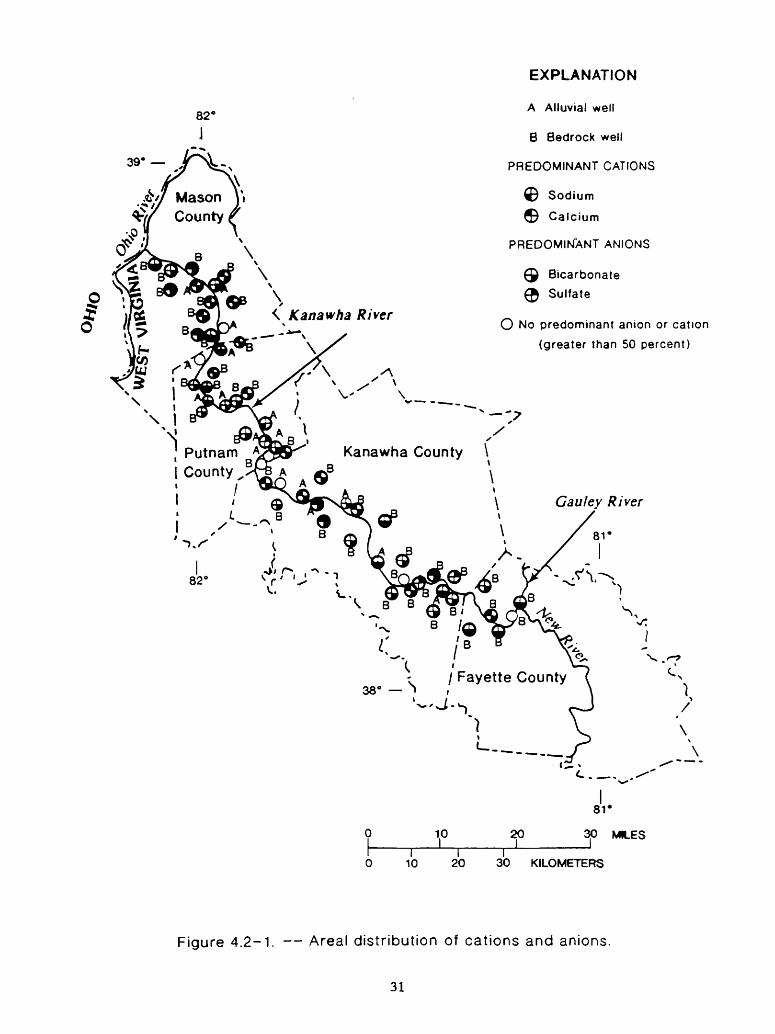
Sodium bicarbonate was the predominant water type in 25 percent of the well samples.
Water type was determined for well samples collected during the study and for those samples incorporated from other studies (fig. 4.2-1). Water type is based on predominant cations and anions. Sodium bicarbonate was the most common water type, accounting for 25 percent of the samples. Calcium bicarbonate was the second most common type, comprising 19 percent of the samples. Sodium chloride was the predominant water type in 10 percent of the samples.
Sodium was the predominant cation in 36 percent of the samples. Calcium was the second most common cation and was predominant in 20 percent of the samples. The remaining samples were various mixtures of calcium, sodium, and magnesium, with no single cation predominating.
Bicarbonate was the predominant anion in 71 percent of the samples. Chloride and sulfate were predominant in 10 and 5 percent of the samples, respectively. The remaining 14 percent were various mixtures of bicarbonate, sulfate, and chloride, with no single anion predominating.
29
82*
39' _
s\ .£// Mason Vi
County
EXPLANATION
A Alluvial well
B Bedrock well
IO
^ &
\\
\BO Kanawha River
BI
KoS 0B
B^B\
\ I B'
, Putnam I County
/
B0>
7'
B t
.^
V-
Kanawha County \*o'B
\
"»,/^
82*
/ Q^^/ L-- B 'X »
V«*> ^ .^' -
PNQ-!^o^cP8 o
B(OA OB^ i XBfv
V... ^0V B B
x ^^
'^w
t:"\38* '^
t
\ Gaulcy RiverV /
' / T*ys&A yOw>"ko*^A^ / )B *r5n B 6B
O BI \o f£N^ X8 ''?Y^v i/ B B ^' \^ V .^' ''" > c j Fayette County ( ^^
' i ^ J-^ rO /
^ V \
81*
D
r3 10
1I°I
20
20 30 MB_£S
I 30 KILOMETERS
Figure 4.1-1. Location of ground-water sampling sites.
30
82°
J
39°
(5
i
EXPLANATION
A Alluvial well
B Bedrock well
PREDOMINANT CATIONS
® Sodium
^ Calcium
PREDOMINANT ANIONS
0 Bicarbonate
(£ Sulfate
O No predominant anion or cation
(greater than 50 percent)
Kanawha County \
D
1D 10
10I
I20
81*
20 30 MILESI |
I30 KILOMETERS
Figure 4.2-1. Areal distribution of cations and anions.
31
4.3 Chemical Constituents
4.3.1 Saltwater
TEN PERCENT OF SAMPLED WELLS CONTAINED SALTWATER
Although saltwater underlies all of the area at varying depth, only 10 percent of the sampled wells contained sodium chloride-type water.
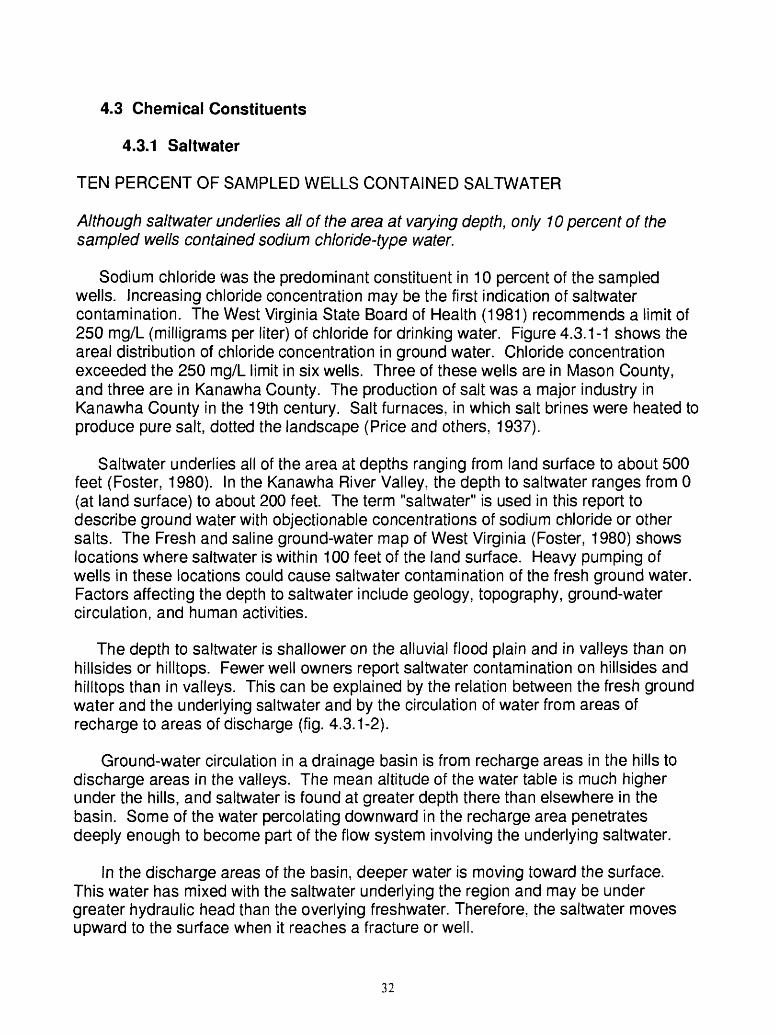
Sodium chloride was the predominant constituent in 10 percent of the sampled wells. Increasing chloride concentration may be the first indication of saltwater contamination. The West Virginia State Board of Health (1981) recommends a limit of 250 mg/L (milligrams per liter) of chloride for drinking water. Figure 4.3.1-1 shows the areal distribution of chloride concentration in ground water. Chloride concentration exceeded the 250 mg/L limit in six wells. Three of these wells are in Mason County, and three are in Kanawha County. The production of salt was a major industry in Kanawha County in the 19th century. Salt furnaces, in which salt brines were heated to produce pure salt, dotted the landscape (Price and others, 1937).
Saltwater underlies all of the area at depths ranging from land surface to about 500 feet (Foster, 1980). In the Kanawha River Valley, the depth to saltwater ranges from 0 (at land surface) to about 200 feet. The term "saltwater" is used in this report to describe ground water with objectionable concentrations of sodium chloride or other salts. The Fresh and saline ground-water map of West Virginia (Foster, 1980) shows locations where saltwater is within 100 feet of the land surface. Heavy pumping of wells in these locations could cause saltwater contamination of the fresh ground water. Factors affecting the depth to saltwater include geology, topography, ground-water circulation, and human activities.
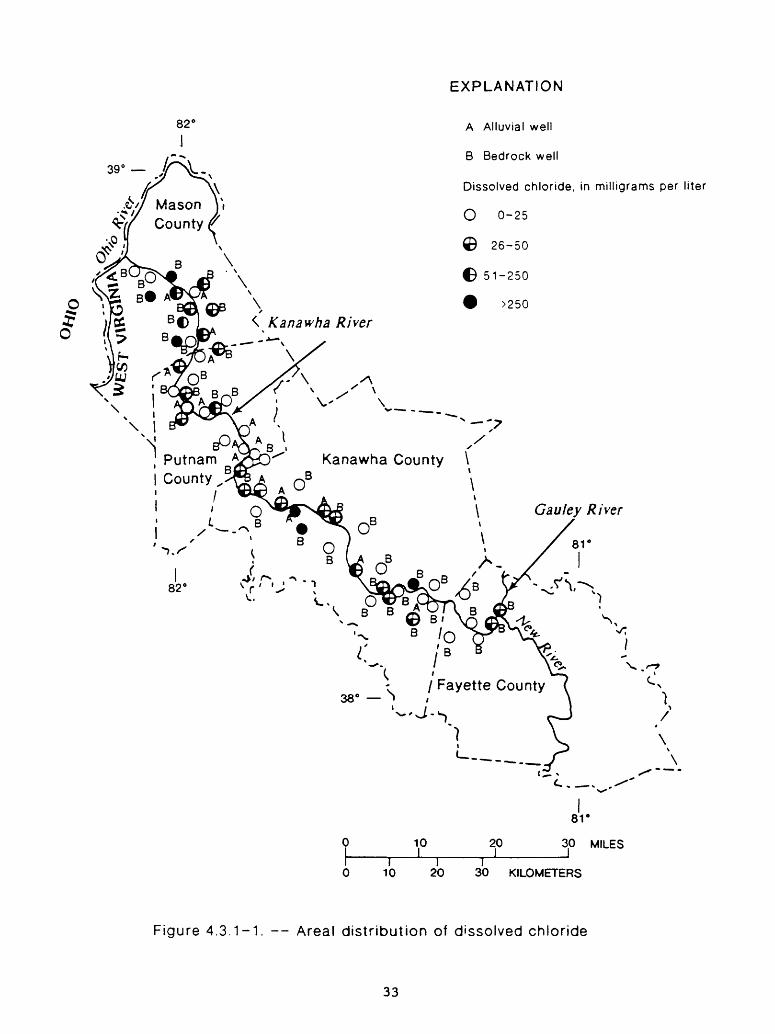
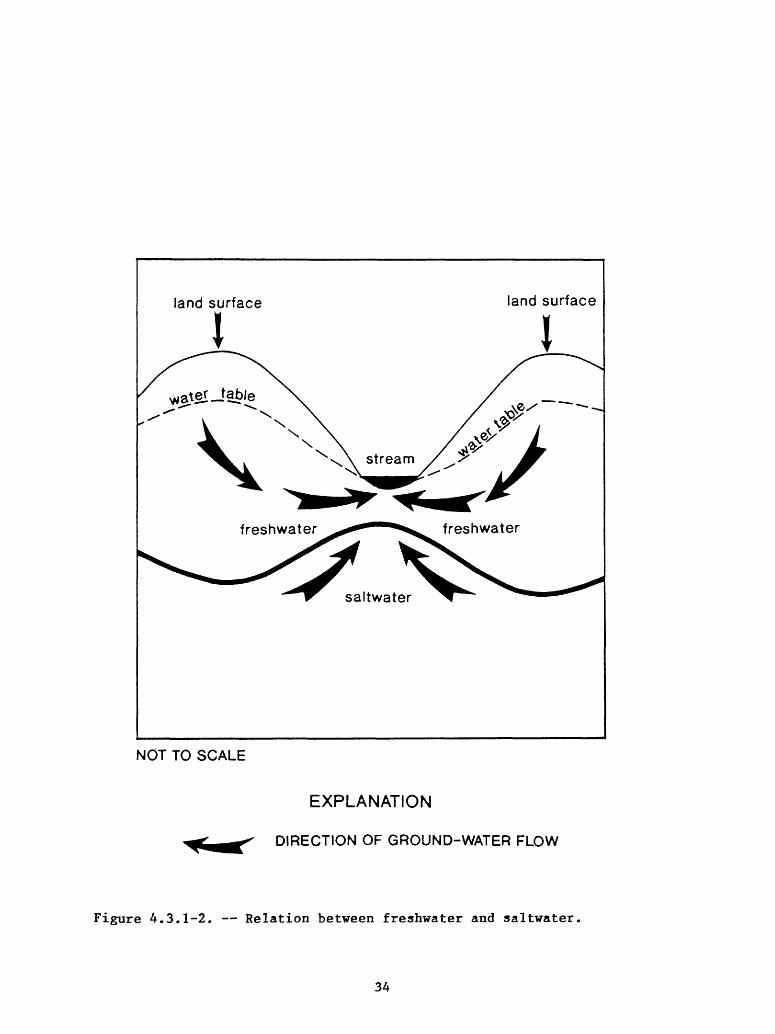
The depth to saltwater is shallower on the alluvial flood plain and in valleys than on hillsides or hilltops. Fewer well owners report saltwater contamination on hillsides and hilltops than in valleys. This can be explained by the relation between the fresh ground water and the underlying saltwater and by the circulation of water from areas of recharge to areas of discharge (fig. 4.3.1-2).
Ground-water circulation in a drainage basin is from recharge areas in the hills to discharge areas in the valleys. The mean altitude of the water table is much higher under the hills, and saltwater is found at greater depth there than elsewhere in the basin. Some of the water percolating downward in the recharge area penetrates deeply enough to become part of the flow system involving the underlying saltwater.
In the discharge areas of the basin, deeper water is moving toward the surface. This water has mixed with the saltwater underlying the region and may be under greater hydraulic head than the overlying freshwater. Therefore, the saltwater moves upward to the surface when it reaches a fracture or well.
32
EXPLANATION
39°
A Alluvial well
B Bedrock well
Dissolved chloride, in milligrams per liter
O 0-25
26-50
51-250
>250
Kanawha County \
I \e» iI Fayette County
10 20
81°
30 MILES
I 10
I 20 30 KILOMETERS
Figure 4.3.1-1. Areal distribution of dissolved chloride
33
land surface land surface
NOT TO SCALE
EXPLANATION
DIRECTION OF GROUND-WATER FLOW
Figure 4.3.1-2. Relation between freshwater and saltwater
34
Man can also influence the depth to saltwater. Heavy pumping from the overlying freshwater zone can cause upward migration of the saltwater in areas where saltwater is at shallow depth. Saltwater in oil and gas reservoirs is frequently under sufficient head to flow upward through wells. When deep wells are uncased or improperly cased, contamination of upper freshwater zones may occur (Bain and Friel, 1972). Oil and gas fields are present in Fayette, Kanawha, and Putnam Counties (Patchen, 1982).
4.3.2 Iron and Manganese
IRON AND MANGANESE POSE A PROBLEM FOR GROUND-WATER USE
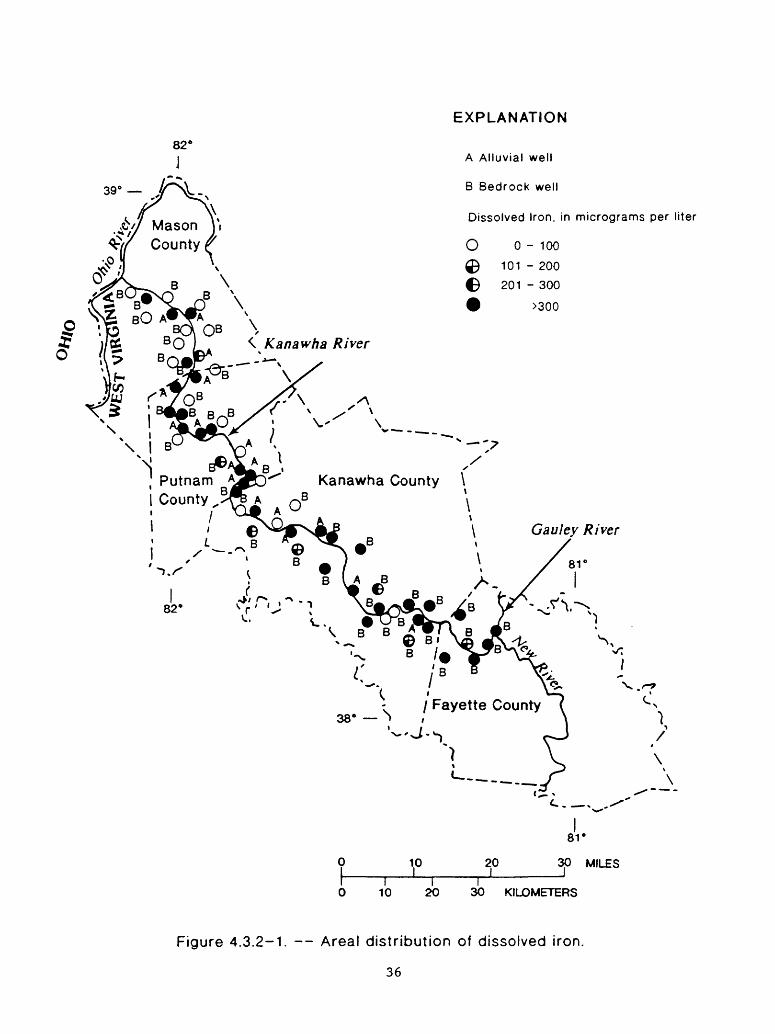
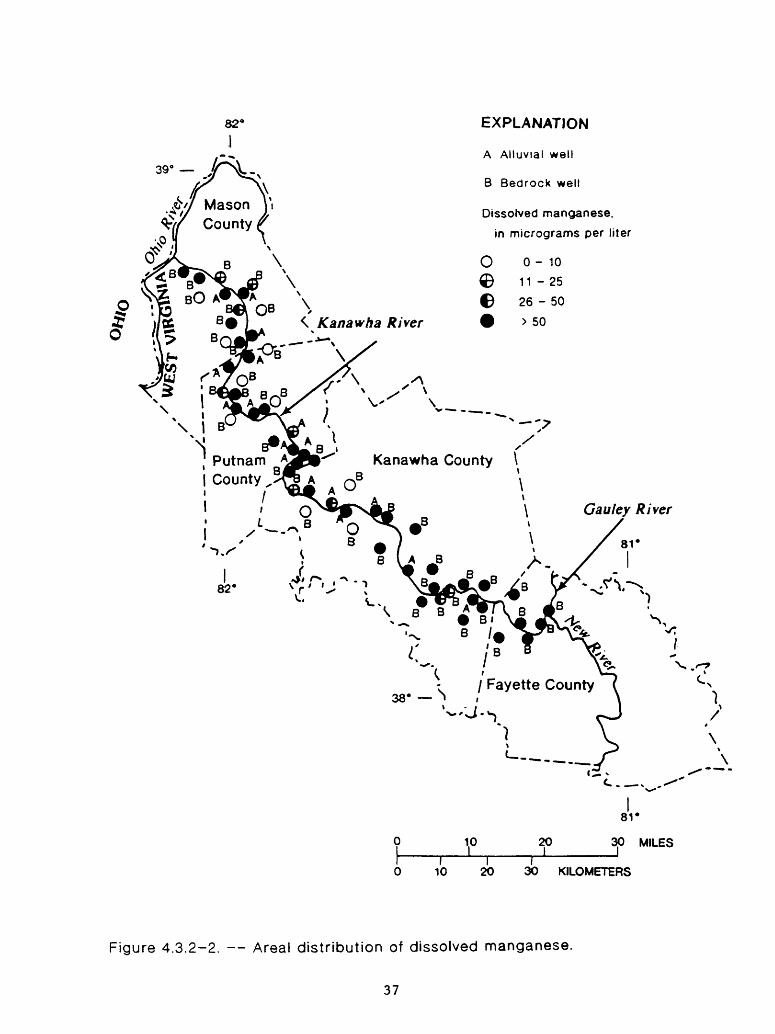
Iron and manganese concentrations exceeded State drinking-water limits in many wells along and near the Kanawha River.
Dissolved iron exceeded the 300 ug/L (micrograms per liter) limit for drinking water (West Virginia State Board of Health, 1981) in 33 of 59 wells, and dissolved manganese exceeded the 50 ug/L limit for drinking water in 40 of 59 wells (figs. 4.3.2-1 and 4.3.2-2). Elevated iron and manganese concentrations in drinking water are not serious health hazards, but can cause problems in wells, distribution systems, food processing, and industrial processes.
Elevated iron and manganese concentrations in ground water can cause precipitates to form on well screens and in distribution lines. Iron and manganese can be removed from ground water after it has been withdrawn from a well. Thus, distribution lines usually can be protected from such precipitates, whereas well screens are more difficult to protect. Precipitates of iron and manganese and calcium carbonate clog screens and thus decrease well efficiency. As well efficiency decreases, increased drawdown can lower the water level below the top of the screen. Oxygen brought into contact with the screen further accelerates precipitation. Clogged well screens necessitate expensive cleaning or even the need for new wells (Jeffords, 1945).
The concentration of dissolved iron in ground water from both alluvial and bedrock wells ranged from less than 3 to 58,000 ug/L. The concentration of dissolved manganese ranged from less than 1 to 1,900 ug/L. Iron and manganese concentrations were both significantly higher in ground water from alluvial wells than in ground water from bedrock wells. The median iron concentration was 11,000 ug/L in alluvial wells and 250 ug/L in bedrock wells. Likewise, median manganese concentration was 750 ug/L in alluvial wells and 92 ug/L in bedrock wells.
Dissolved-iron concentration was greater than dissolved-manganese concentration in ground water from all but one alluvial well. The ground water from this well did not contain a significantly greater concentration of manganese than iron. This is in contrast to ground water from some alluvial wells along the Ohio River, which has a greater concentration of manganese than iron.
35
EXPLANATION
82*
O
39° A Alluvial well
B Bedrock well
Dissolved Iron, in micrograms per liter
O 0-100
® 101 - 200
O 201 - 300
>300
Gauley River
20
81°
30 MILES
10 20 30 KILOMETERS
Figure 4.3.2-1. Areal distribution of dissolved iron.
36
82*
I
39- - ,/H^
EXPLANATION
A Alluvial well
B Bedrock well
Dissolved manganese,
in micrograms per liter
O 0-10
11-25
26 - 50
> 50Kanawha River
Putnam A County s<rv A
Gaulcy River
// Fayette County
82°
38°
10 20
81°
30 MILES
10 20 30 KILOMETERS
Figure 4.3.2-2. Areal distribution of dissolved manganese.
37
4.3.3 Hardness
GROUND WATER IS TYPICALLY SOFT TO MODERATELY HARD
Ground water in the majority of both alluvial and bedrock wells was soft to moderately hard. Hardness was greater in bedrock wells than in alluvial wells.
Forty-two of 59 ground-water samples were soft to moderately hard (hardness less than or equal to 120 mg/L). Fourteen of 17 alluvial wells and 28 of 42 bedrock wells had ground water that was soft to moderately hard. This is in contrast to the very hard water found in wells drilled into the alluvium and the bedrock underlying the alluvium along the Ohio River.
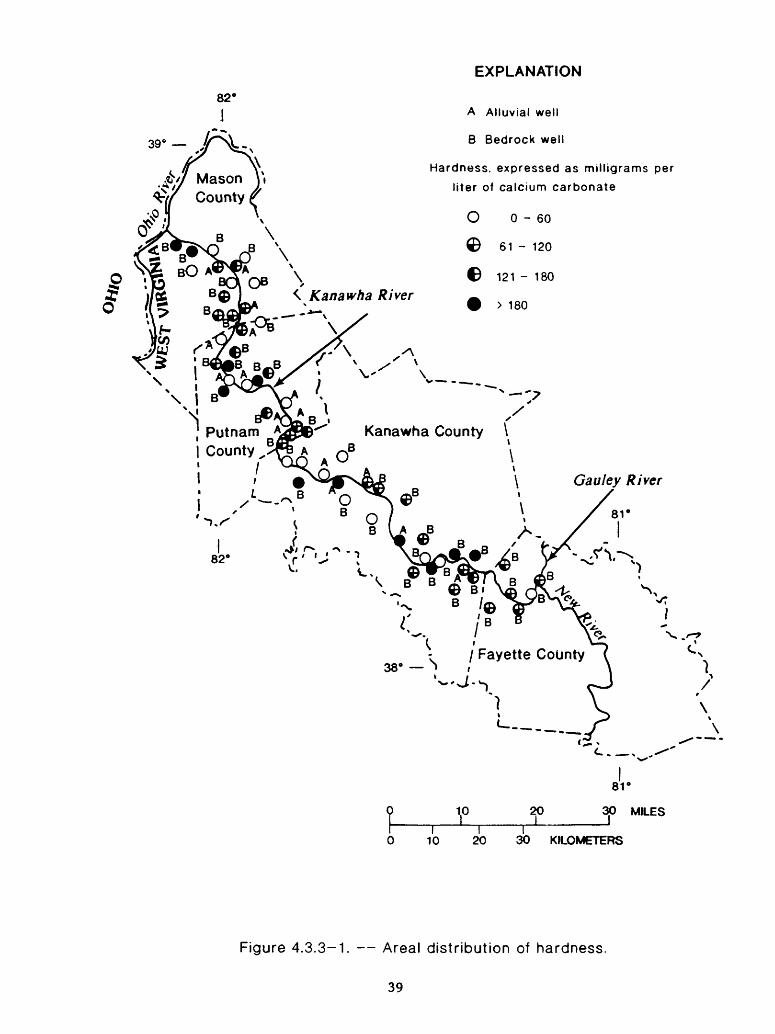
Figure 4.3.3-1 shows the aereal distribution of hardness. Hardness is classified by the U.S. Geological Survey (Durfor and Becker, 1964) based on the following ranges of equivalent calcium carbonate concentration expressed in milligrams per liter: 0 to 60 is soft, 61 to 120 is moderately hard, 121 to 180 is hard, and greater than 180 is very hard. Calculations were based on the summation of calcium, magnesium, strontium, iron, aluminum, zinc, manganese, and barium concentrations (American Public Health Association, Inc., 1960, p. 132).
The median hardness of ground water in bedrock wells was 110 mg/L as compared to only 71 mg/L in alluvial wells. Hardness ranged from 3 to 460 mg/L for all ground- water samples. Two alluvial wells and nine bedrock wells had very hard water. This indicates that ground-water hardness is a problem for some alluvial and bedrock wells in the Kanawha River valley.
4.3.4 Sulfate
GROUND WATER HAS LOW SULFATE CONCENTRATION
Sulfate concentration was less than 50 mg/L in ground water from most bedrock and alluvial wells.
Sulfate concentration was less than 50 mg/L in ground water from 14 of 17 alluvial wells and from 32 of 42 bedrock wells. Ground water from only one well (an alluvial well) had a sulfate concentration that exceeded the 250 mg/L limit of sulfate in public- drinking water (West Virginia State Board of Health, 1981). This well was adjacent to a fly-ash pond and contained ground water that had elevated concentrations of several chemical constituents.
38
82°
J
39°
EXPLANATION
A Alluvial well
B Bedrock well
Hardness, expressed as milligrams per
liter of calcium carbonate
Kanawha County \
81'
t-0
10 20 30I I I
I 10
I20 30 KILOMETERS
MILES
Figure 4.3.3-1. Areal distribution of hardness.
39
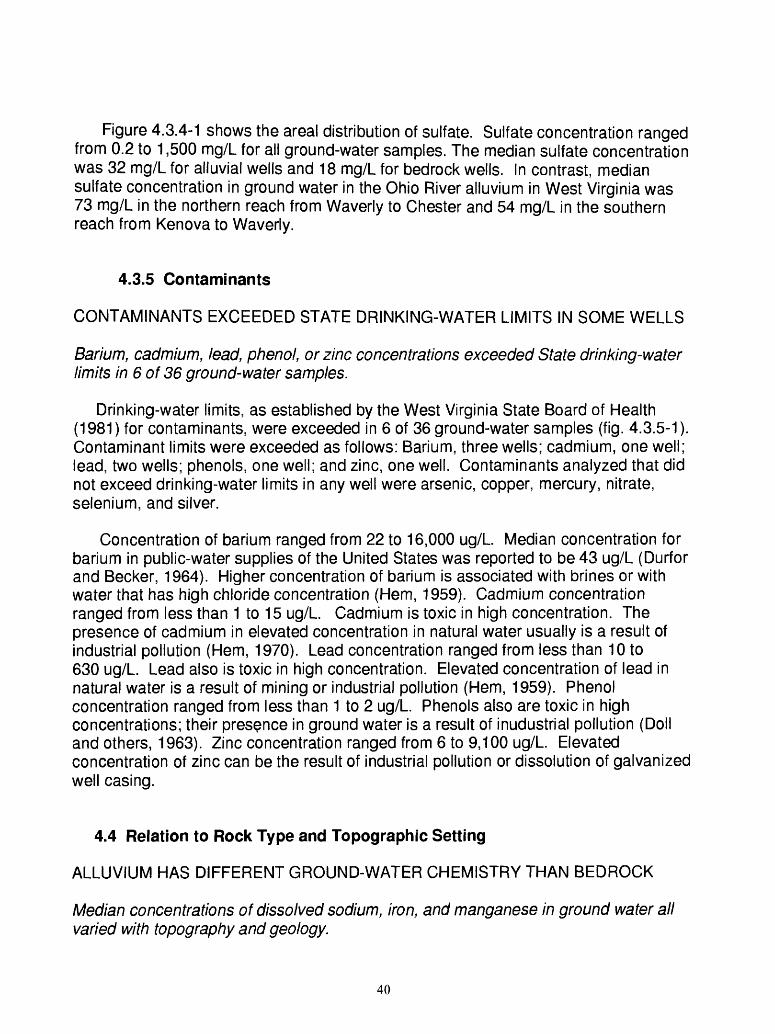
Figure 4.3.4-1 shows the areal distribution of sulfate. Sulfate concentration ranged from 0.2 to 1,500 mg/L for all ground-water samples. The median sulfate concentration was 32 mg/L for alluvial wells and 18 mg/L for bedrock wells. In contrast, median sulfate concentration in ground water in the Ohio River alluvium in West Virginia was 73 mg/L in the northern reach from Waverly to Chester and 54 mg/L in the southern reach from Kenova to Waverly.
4.3.5 Contaminants
CONTAMINANTS EXCEEDED STATE DRINKING-WATER LIMITS IN SOME WELLS
Barium, cadmium, lead, phenol, or zinc concentrations exceeded State drinking-water limits in 6 of 36 ground-water samples.
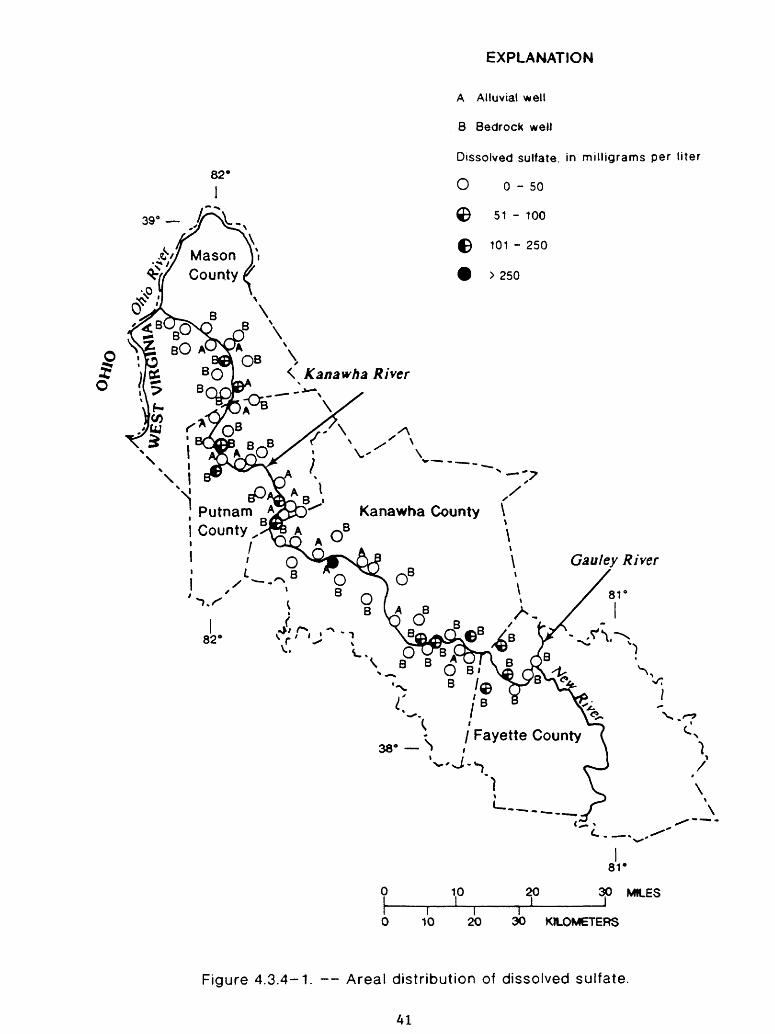
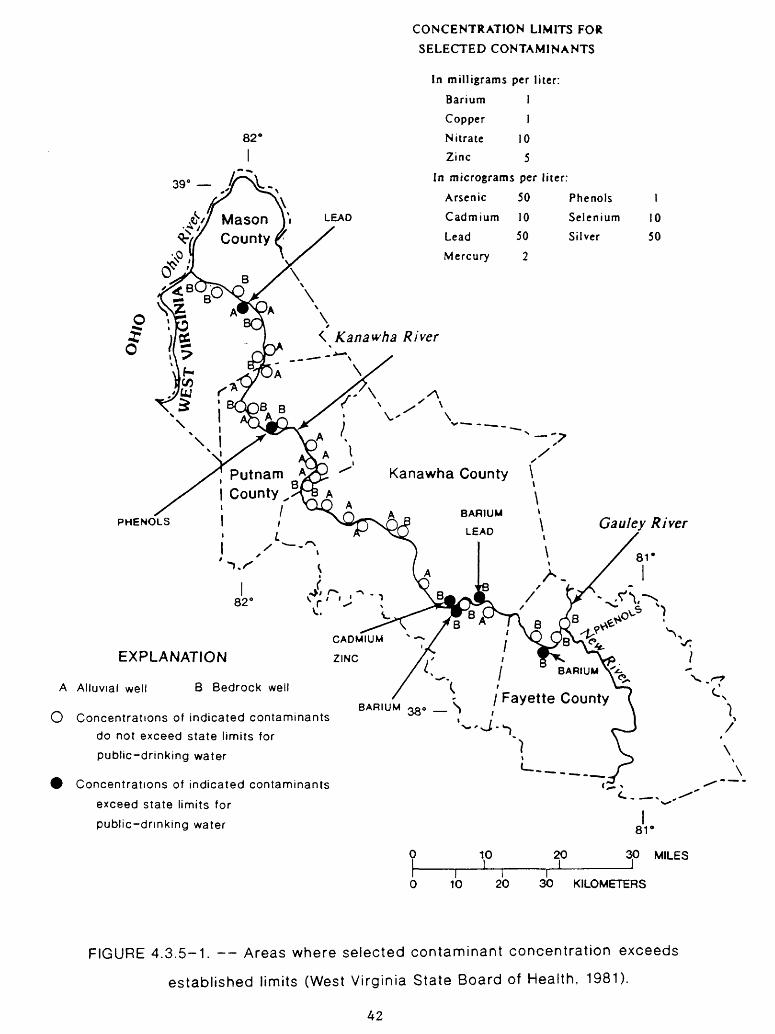
Drinking-water limits, as established by the West Virginia State Board of Health (1981) for contaminants, were exceeded in 6 of 36 ground-water samples (fig. 4.3.5-1). Contaminant limits were exceeded as follows: Barium, three wells; cadmium, one well; lead, two wells; phenols, one well; and zinc, one well. Contaminants analyzed that did not exceed drinking-water limits in any well were arsenic, copper, mercury, nitrate, selenium, and silver.
Concentration of barium ranged from 22 to 16,000 ug/L Median concentration for barium in public-water supplies of the United States was reported to be 43 ug/L (Durfor and Becker, 1964). Higher concentration of barium is associated with brines or with water that has high chloride concentration (Hem, 1959). Cadmium concentration ranged from less than 1 to 15 ug/L. Cadmium is toxic in high concentration. The presence of cadmium in elevated concentration in natural water usually is a result of industrial pollution (Hem, 1970). Lead concentration ranged from less than 10 to 630 ug/L. Lead also is toxic in high concentration. Elevated concentration of lead in natural water is a result of mining or industrial pollution (Hem, 1959). Phenol concentration ranged from less than 1 to 2 ug/L. Phenols also are toxic in high concentrations; their presence in ground water is a result of inudustrial pollution (Doll and others, 1963). Zinc concentration ranged from 6 to 9,100 ug/L. Elevated concentration of zinc can be the result of industrial pollution or dissolution of galvanized well casing.
4.4 Relation to Rock Type and Topographic Setting
ALLUVIUM HAS DIFFERENT GROUND-WATER CHEMISTRY THAN BEDROCK
Median concentrations of dissolved sodium, iron, and manganese in ground water all varied with topography and geology.
40
EXPLANATION
82"
39
A Alluvial well
B Bedrock well
Dissolved sulfate. in milligrams per liter
O 0-50
© 51 - 100
O 101 - 250
> 250
IO
Kanawha County \
20 30 MILES
10 20 30 KILOMETERS
Figure 4.3.4-1. Areal distribution of dissolved sulfate.
41
82°
39
CONCENTRATION LIMITS FOR
SELECTED CONTAMINANTS
In milligrams per liter:
Barium 1
Copper 1
Nitrate 10
Zinc 5
In micrograms per liter:
Arsenic 50 Phenols
Cadmium 10 Selenium
Lead 50 Silver
Mercury 2
1050
Kanawha County \
PHENOLS
EXPLANATION
A Alluvial well B Bedrock well
O Concentrations of indicated contaminants
do not exceed state limits for
public-drinking water
Concentrations of indicated contaminants
exceed state limits for
public-drinking water
BARIUM
10 20
81°
30 MILES
10 20 30 KILOMETERS
FIGURE 4.3.5-1. Areas where selected contaminant concentration exceeds
established limits (West Virginia State Board of Health, 1981).
42
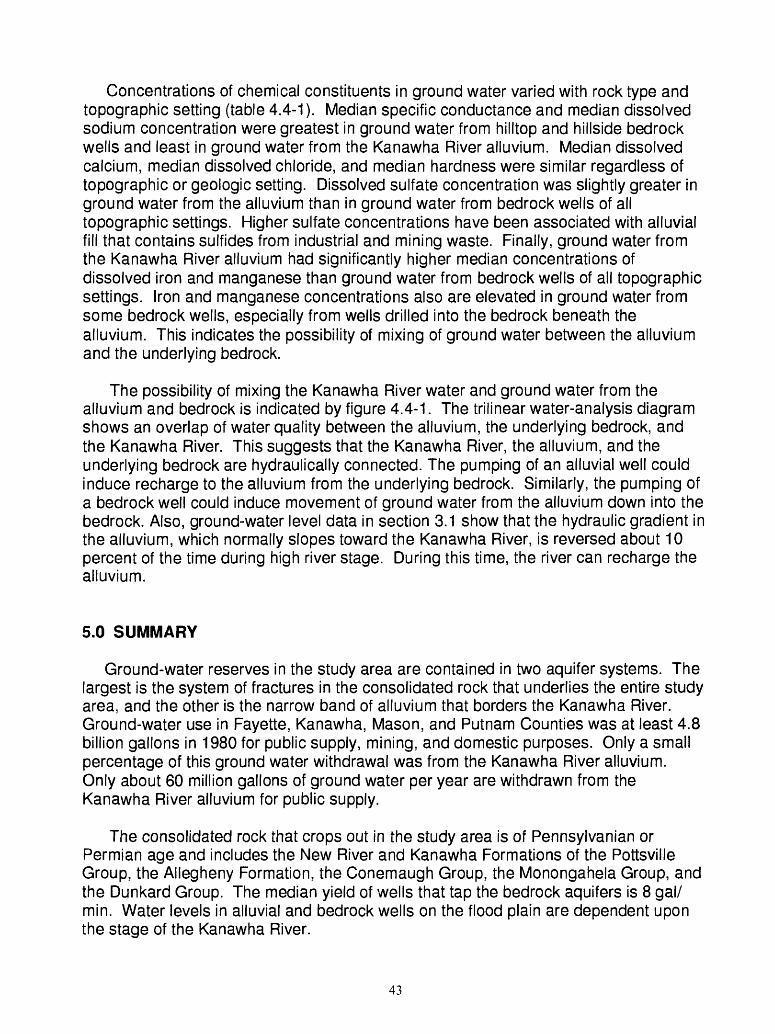
Concentrations of chemical constituents in ground water varied with rock type and topographic setting (table 4.4-1). Median specific conductance and median dissolved sodium concentration were greatest in ground water from hilltop and hillside bedrock wells and least in ground water from the Kanawha River alluvium. Median dissolved calcium, median dissolved chloride, and median hardness were similar regardless of topographic or geologic setting. Dissolved sulfate concentration was slightly greater in ground water from the alluvium than in ground water from bedrock wells of all topographic settings. Higher sulfate concentrations have been associated with alluvial fill that contains sulfides from industrial and mining waste. Finally, ground water from the Kanawha River alluvium had significantly higher median concentrations of dissolved iron and manganese than ground water from bedrock wells of all topographic settings. Iron and manganese concentrations also are elevated in ground water from some bedrock wells, especially from wells drilled into the bedrock beneath the alluvium. This indicates the possibility of mixing of ground water between the alluvium and the underlying bedrock.
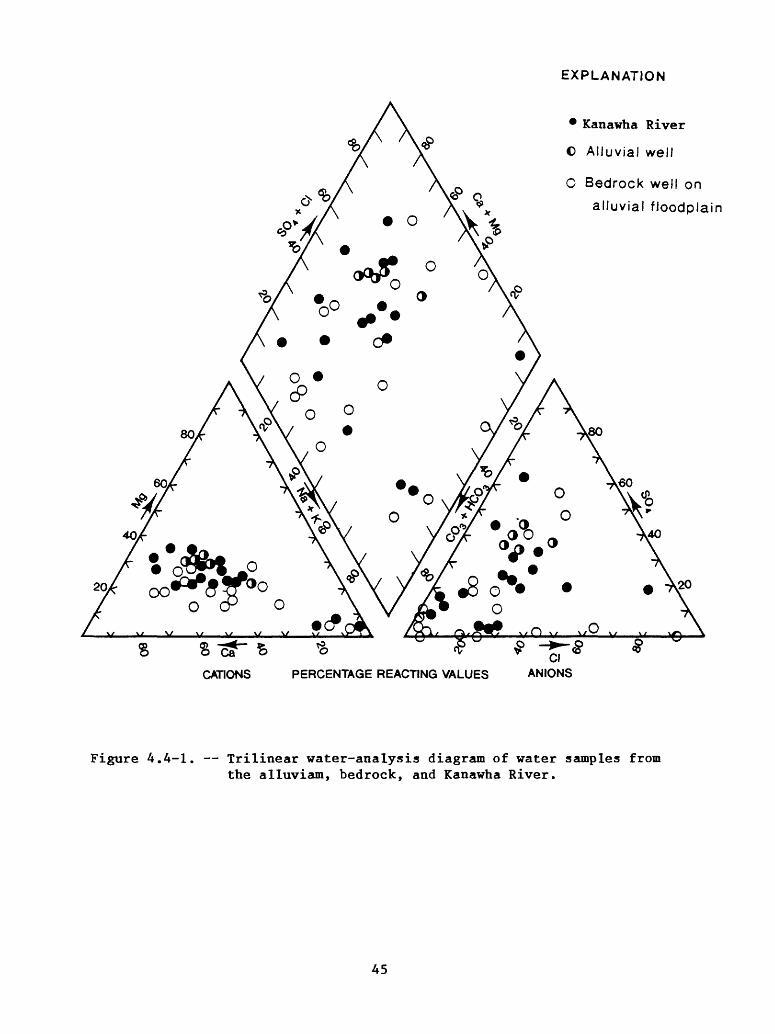
The possibility of mixing the Kanawha River water and ground water from the alluvium and bedrock is indicated by figure 4.4-1. The trilinear water-analysis diagram shows an overlap of water quality between the alluvium, the underlying bedrock, and the Kanawha River. This suggests that the Kanawha River, the alluvium, and the underlying bedrock are hydraulically connected. The pumping of an alluvial well could induce recharge to the alluvium from the underlying bedrock. Similarly, the pumping of a bedrock well could induce movement of ground water from the alluvium down into the bedrock. Also, ground-water level data in section 3.1 show that the hydraulic gradient in the alluvium, which normally slopes toward the Kanawha River, is reversed about 10 percent of the time during high river stage. During this time, the river can recharge the alluvium.
5.0 SUMMARY
Ground-water reserves in the study area are contained in two aquifer systems. The largest is the system of fractures in the consolidated rock that underlies the entire study area, and the other is the narrow band of alluvium that borders the Kanawha River. Ground-water use in Fayette, Kanawha, Mason, and Putnam Counties was at least 4.8 billion gallons in 1980 for public supply, mining, and domestic purposes. Only a small percentage of this ground water withdrawal was from the Kanawha River alluvium. Only about 60 million gallons of ground water per year are withdrawn from the Kanawha River alluvium for public supply.
The consolidated rock that crops out in the study area is of Pennsylvanian or Permian age and includes the New River and Kanawha Formations of the Pottsville Group, the Allegheny Formation, the Conemaugh Group, the Monongahela Group, and the Dunkard Group. The median yield of wells that tap the bedrock aquifers is 8 gal/ min. Water levels in alluvial and bedrock wells on the flood plain are dependent upon the stage of the Kanawha River.
43
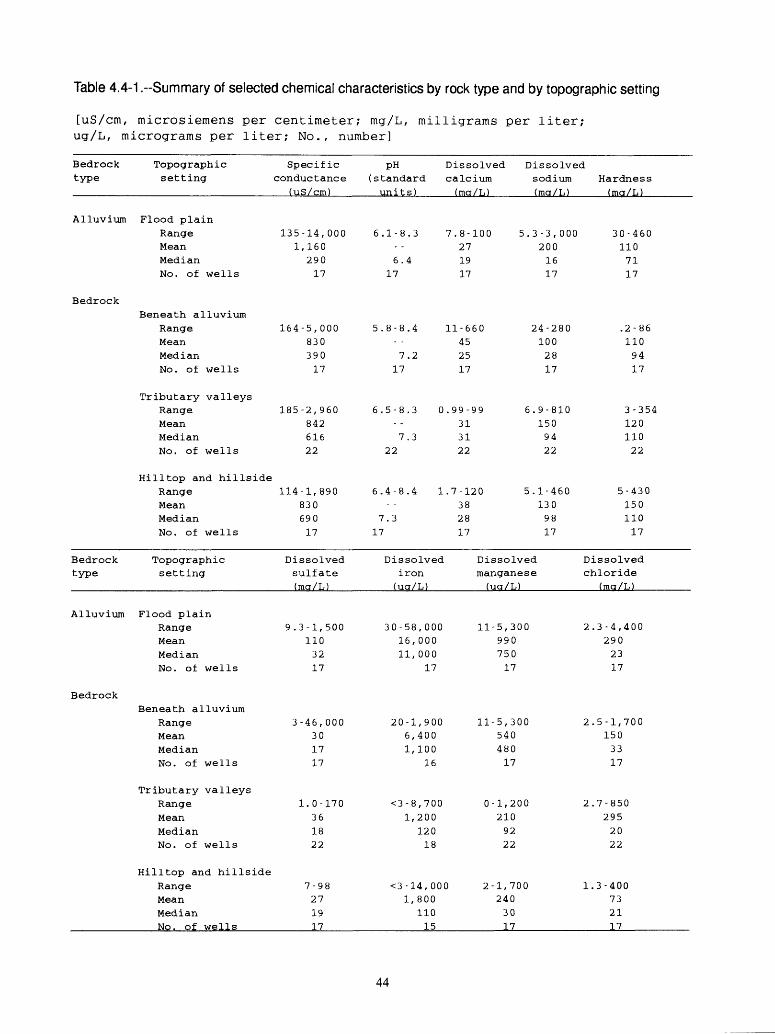
Table 4.4-1 .--Summary of selected chemical characteristics by rock type and by topographic setting
[uS/cm, microsiemens per centimeter; mg/L, milligrams per liter; ug/L, micrograms per liter; No., number]
Bedrocktype
Alluvium
Bedrock
Bedrocktype
Alluvium
Bedrock
Topographicsetting
Flood plainRangeMeanMedianNo. of wells
Beneath alluviumRangeMeanMedianNo. of wells
Tributary valleysRangeMeanMedianNo. of wells
Hilltop and hillsideRangeMeanMedianNo. of wells
Topographicsetting
Flood plainRangeMeanMedianNo. of wells
Beneath alluviumRangeMeanMedianNo. of wells
Tributary valleysRangeMeanMedianNo. of wells
Hilltop and hillsideRangeMeanMedianNo. of wells
Specificconductance
(uS/cm)
135-14, 0001,16029017
164-5,00083039017
185-2,96084261622
114-1,89083069017
Dissolvedsulf ate(ma/L)
9.3-1,5001103217
3-46,000301717
1.0-170361822
7-98
271917
pH Dissolved Dissolved(standard calcium sodium Hardnessunits) (ma/L) (ma/L) (ma/L)
6.1-8.3 7.8-100 5.3-3,000 30-46027 200 110
6.4 19 16 7117 17 17 17
5.8-8.4 11-660 24-280 .2-8645 100 110
7.2 25 28 9417 17 17 17
6.5-8.3 0.99-99 6.9-810 3-35431 150 120
7.3 31 94 11022 22 22 22
6.4-8.4 1.7-120 5.1-460 5-43038 130 150
7.3 28 98 11017 17 17 17
Dissolved Dissolved Dissolvediron manganese chloride(ua/L) (ua/L) (ma/L)
30-58,000 11-5,300 2.3-4,40016,000 990 29011,000 750 23
17 17 17
20-1,900 11-5,300 2.5-1,7006,400 540 1501,100 480 33
16 17 17
<3-8,700 0-1,200 2.7-8501,200 210 295
120 92 2018 22 22
<3-14,000 2-1,700 1.3-4001,800 240 73
110 30 2115 17 17
44
EXPLANATION
Kanawha River
O Alluvial well
O Bedrock well on
alluvial floodplain
8 cT fcCATIONS PERCENTAGE REACTING VALUES ANIONS
Figure 4.4-1. Trilinear water-analysis diagram of water samples from the alluviam, bedrock, and Kanawha River.
45
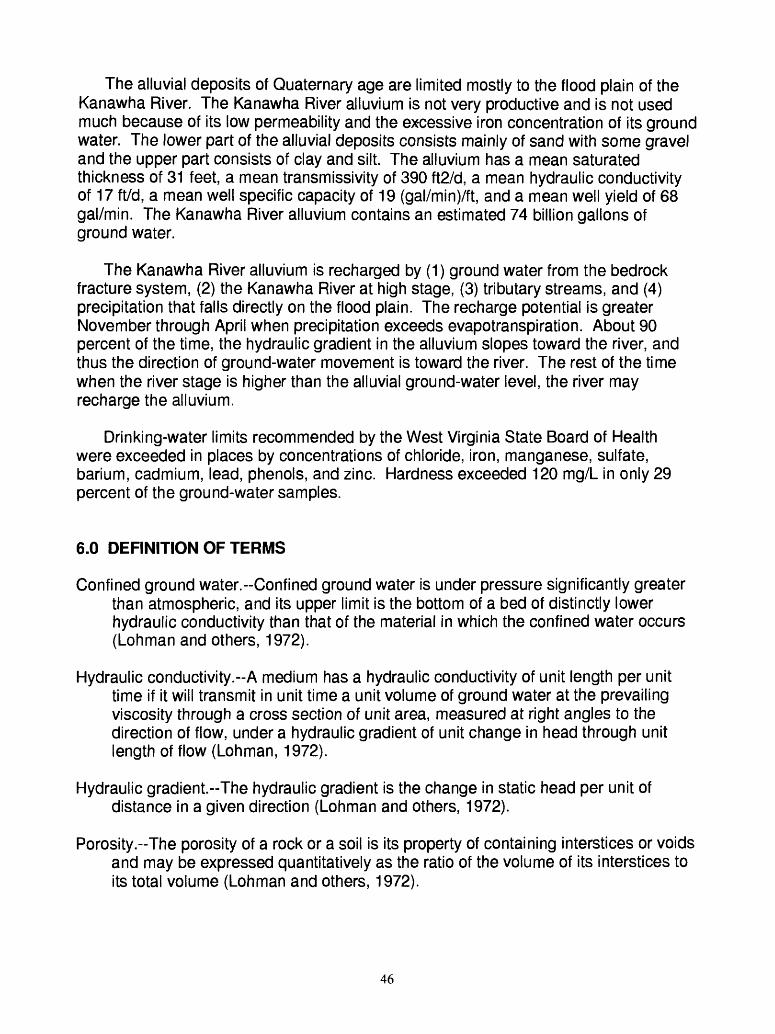
The alluvial deposits of Quaternary age are limited mostly to the flood plain of the Kanawha River. The Kanawha River alluvium is not very productive and is not used much because of its low permeability and the excessive iron concentration of its ground water. The lower part of the alluvial deposits consists mainly of sand with some gravel and the upper part consists of clay and silt. The alluvium has a mean saturated thickness of 31 feet, a mean transmissivity of 390 ft2/d, a mean hydraulic conductivity of 17 ft/d, a mean well specific capacity of 19 (gal/min)/ft, and a mean well yield of 68 gal/min. The Kanawha River alluvium contains an estimated 74 billion gallons of ground water.
The Kanawha River alluvium is recharged by (1) ground water from the bedrock fracture system, (2) the Kanawha River at high stage, (3) tributary streams, and (4) precipitation that falls directly on the flood plain. The recharge potential is greater November through April when precipitation exceeds evapotranspiration. About 90 percent of the time, the hydraulic gradient in the alluvium slopes toward the river, and thus the direction of ground-water movement is toward the river. The rest of the time when the river stage is higher than the alluvial ground-water level, the river may recharge the alluvium.
Drinking-water limits recommended by the West Virginia State Board of Health were exceeded in places by concentrations of chloride, iron, manganese, sulfate, barium, cadmium, lead, phenols, and zinc. Hardness exceeded 120 mg/L in only 29 percent of the ground-water samples.
6.0 DEFINITION OF TERMS
Confined ground water.--Confined ground water is under pressure significantly greater than atmospheric, and its upper limit is the bottom of a bed of distinctly lower hydraulic conductivity than that of the material in which the confined water occurs (Lohman and others, 1972).
Hydraulic conductivity.-A medium has a hydraulic conductivity of unit length per unit time if it will transmit in unit time a unit volume of ground water at the prevailing viscosity through a cross section of unit area, measured at right angles to the direction of flow, under a hydraulic gradient of unit change in head through unit length of flow (Lohman, 1972).
Hydraulic gradient.~The hydraulic gradient is the change in static head per unit of distance in a given direction (Lohman and others, 1972).
Porosity.~The porosity of a rock or a soil is its property of containing interstices or voids and may be expressed quantitatively as the ratio of the volume of its interstices to its total volume (Lohman and others, 1972).
46
Semiconfinement.--The distinction between confined and unconfined water is entirely gradational. The term semiconfined is used for the intermediate conditions. The material overlying an aquifer may be semipermeable so that water is only semiconfined (Davisand DeWiest, 1966).
Specific capacity.-The specific capacity of a well is the rate of discharge of water from the well divided by the drawdown of water level within the well (Lohman and others, 1972).
Specific discharge.-The specific discharge, or specific flux, for ground water is the rate of discharge of ground water per unit area measured at right angles to the direction of flow (Lohman and others, 1972).
Specific retention.--The specific retention of a rock or soil is the ratio of the volume of water which the rock or soil, after being saturated, will retain against the pull of gravity to the volume of the rock or soil (Lohman and others, 1972).
Specific yield.--The specific yield of a rock or soil is the ratio of the volume of water which the rock or soil, after being saturated, will yield by gravity to the volume of the rock or soil (Lohman and others, 1972).
Storage Coefficient.~The storage coefficient is the volume of water an aquifer releases from or takes into storage per unit surface area of the aquifer per unit change in head (Lohman and others, 1972).
Transmissivity.--Transmissivity is the rate at which water of the prevailing kinematic viscosity is transmitted through a unit width of the aquifer under a unit hydraulic gradient (Lohman and others, 1972).
Unconfined ground water.-Unconfined ground water is water in an aquifer that has a water table (Lohman and others, 1972).
7.0 SELECTED REFERENCES
American Public Health Association, Inc., 1960, Standard methods for the examination of water and wastewater (11 th edition): New York, 626 p.
Bain, G. L, and Friel, E. A., 1972, Water resources of the Little Kanawha River basin, West Virginia: West Virginia Geological and Economic Survey River Basin Bulletin 2, 122 p.
Beckwith, D. S., 1984, Ground-water hydrology of the Coal River basin, West Virginia: West Virginia Department of Natural Resources, map report, scale 1:250,000, 1 sheet.
47
Bentall, Ray, compiler, 1963, Methods of determining permeability, transmissibility and drawdown: U.S. Geological Survey Water-Supply Paper 1536-1, p. 243-341.
Cardwell, D. H., Erwin, R. B., and Woodward, H. P., compilers, 1968, 1968 Geologic map of West Virginia: West Virginia Geological and Economic Survey Map, scale 1:250,000.
Carlston, C. W., and Graeff, G. D., Jr., 1955, Ground-water resources of the Ohio River valley in West Virginia, pt. Ill of Geology and economic resources of the Ohio River valley in West Virginia, 1956: West Virginia Geological and Economic Survey v. XXII, p. 1-131.
Chang, Mingteh, Lee, Richard, and Dickerson, W. H., 1976, Adequacy of hydrologic data for application in West Virginia: West Virginia University Water Research Institute Bulletin 7, series 78, no. 8-3, 1978, p. 78 and 84.
Clark, W. E., Chisholm, J. L, and Frye, P. M., 1976, Water resources of the Upper New River basin, West Virginia: West Virginia Geological and Economic Survey River Basin Bulletin 4, 87 p.
Grain, L J., 1966, Ground-water resources of the Jamestown area, New York, with emphasis on the hydrology of the major stream valleys: New York Conservation Department, Water Resources Commission, Bulletin 58, 167 p.
Cross, A. T. and Scheme!, M. P., Geology of the Ohio River valley in West Virginia, pt. I of Geology and economic resources of the Ohio River valley in West Virginia, 1956: West Virginia Geological and Economic Survey v. XXII, p. 1-149.
Davis, S. N. and DeWiest, R. J. M., 1966, Hydrogeology: New York, John Wiley and Sons, Inc., 463 p.
Deutsch, Morris, Dove, G. D., Jordan, P. R., and Wallace, J. C., 1966, Ground-water distribution and potential in the Ohio River basin, in Ohio River basin comprehensive survey, v. VI, Appendix E, ground water: The Corps of Engineers, U.S. Army Engineer Division, Ohio River, Cincinnati, Ohio, report, 197 p., 32 plates.
Doll, W. L., Meyer, Gerald, and Archer, R. J., 1963, Water resources of West Virginia: West Virginia Department of Natural Resources, Division of Water Resources Report, 134 p.
Doll, W. L., Wilmoth, B. M., and Whetstone, G. W., 1960, Water resources of Kanawha County, West Virginia: West Virginia Geological and Economic Survey Bulletin 20, 189 p.
48
Dove, G. D., and Wallace, J. C., 1966, Preliminary survey of ground-water distribution and potential in the Ohio River basin, sub-drainage area 5, Little Kanawha and Kanawha River basins (including southside drainage area to the Ohio River between Marietta and Point Pleasant), in Ohio River basin comprehensive survey, v. VI, Appendix E, ground water: The Corps of Engineers, U.S. Army Engineer Division, Ohio River, Cincinatti, Ohio, report, p. 5-1 to 5-18, 1 plate.
Durfor, C. N., and Becker, Edith, 1964, Public water supplies of the 100 largest cities in the United States, 1962: U.S. Geological Survey Water-Supply Paper 1812, 364 p.
Ehlke, T. A., Runner, G. S., and Downs, S. C., 1982, Hydrology of area 9, eastern coal province, West Virginia: U.S. Geological Survey Water-Resources Investigations, Open-File Report 81-803, 63 p.
Farnsworth, R. K., Thompson, E. S., and Peck, E. S., 1982, Evaporation atlas for the contiguous 48 United States: National Oceanic and Atmospheric Administration Technical Report NWS 33, 26 p.
Fenneman, N. M., and Johnson, D. W., 1946, Physical divisions of the United States: U.S. Geological Survey Map prepared in cooperation Physiographic Commission, U.S. Geological Survey, scale 1:7,000,000. (Reprinted 1964).
Ferrell, G. M., 1984a, Ground-water hydrology of the minor tributary basins of the Kanawha River, West Virginia: West Virginia Department of Natural Resources, map report, scale 1:250,000, 1 sheet.
__ 1984b, Ground-water hydrology of the Elk River basin, West Virginia: WestVirginia Department of Natural Resources, map report, scale 1:250,000,1 sheet.
Foster, J. B., 1980, Fresh and saline ground-water map of West Virginia: West Virginia Geological Survey Map WV-12, scale 1:250,000, 4 plates.
Fridley, H. M., 1950, The geomorphic history of the New-Kanawha River system: West Virginia Geological and Economic Survey Report of Investigation 7,12 p.
Gallaher, J. T. and Price, W. E., Jr., 1966, Hydrology of the alluvial deposits in the Ohio River valley in Kentucky: U.S. Geological Survey Water-Supply Paper 1818, 80 p.
Grubb, H. F., 1975, simulated drawdown for selected well fields in the Ohio River alluvial aquifer: U.S. Geological Survey Water-Resources Investigations, 2-74, 38 p.
Grubb, H. F. and Zehner, H. H., 1973, Aquifer diffusivity of the Ohio River alluvial aquifer by the flood-wave response method: U.S. Geological Survey Journal of research, v. 1, no. 5, September-October 1973, p. 597-601.
49
Naught, O. L, 1960, Oil and gas report and map of Kanawha County, West Virginia: West Virginia Geological and Economic Survey Bulletin 19, 24 p.
__ 1968, Geology of the Charleston area: West Virginia Geological Survey Bulletin 34, 38 p.
Heath, R. C., 1983, Basic ground-water hydrology: U.S. Geological Survey Water- Supply Paper 2220, 84 p.
Hem, J. D., 1959a, Study and interpretation of the chemical characteristics of natural water: U.S. Geological Survey Water-Supply Paper 1473, 269 p.
__ 1959b, Survey of ferrous-ferric chemical equilibria and redox potentials: U.S. Geological Survey Water-Supply Paper 1459-A, 31 p.
__1960a, Some chemical relationships among sulfur species and dissolved ferrous iron: U.S. Geological Survey Water-Supply Paper 1459-C, 73 p.
__ 1960b, Restraints on dissolved ferrous iron imposed by bicarbonate, redox potential, and pH: U.S. Geological Survey Water-Supply Paper 1459-B, 55 p.
__1963, Chemical equilibria and rates of manganese oxidation: U.S.Geological Survey Water-Supply Paper 1667-A, 64 p.
__ 1964, Deposition and solution of manganese oxides: U.S. Geological Survey Water-Supply Paper 1667-B, 42 p.
__ 1970, Study and interpretation of the chemical characteristics of natural water, 2nd ed.: U.S. Geological Survey Water-Supply Paper 1473, 363 p.
__ 1972, Chemical factors that influence the availability of iron and manganese in aqueous systems: The Geological Society of America Special Paper 140, p. 17-24.
Hennen, R. V., 1919, [Detailed geologic report of] Fayette County: West Virginia Geological Survey County report, 1002 p., 24 plates.
Jeffords, R. M., and Nace, R. L, 1946, Ground-water conditions at Charleston, W. Va.: American Water Works Association Journal, v. 38, no. 11, part 1, November 1946, p. 1309-1314.
Johnson, P. W., and Williams, T. E., 1969, Kanawha basin comprehensive study, Appendix C, hydrology, part two, ground water: U.S. Army Corps of Engineers, Huntington District report, 258 p.
50
Kernodle, J. M., 1977, Theoretical drawdown due to simulated pumpage from the Ohio River alluvial aquifer near Siloam, Kentucky: U.S. Geological Survey Water- Resources Investigations 77-24, 39 p.
Krebs, C. E., 1911, [Detailed geologic report of] Jackson, Mason, and Putnam Counties: West Virginia Geological Survey County Report, 387 p., 31 plates.
__ 1914, [Detailed geologic report of] Kanawha County: West Virginia Geological Survey County Report, 679 p., 33 plates.
Lohman, S. W., 1972, Ground-water hydraulics: U. S. Geological Survey Professional Paper 708, 70 p.
Lohman, S. W., and others, 1972, Definitions of selected ground-water terms-revisions and conceptual refinements: U.S. Geological Survey Water-Supply Paper 1988, 21 p.
Mathes, M. V., Kirby, J. R., Payne, D. D. and Shultz, R. A., 1982, Drainage areas of the Kanawha River basin, West Virginia: U.S. Geological Survey Open-File Report 82-351, 222 p.
McCue, J. B., Lucke, J. B. and Woodward, H. P., 1939, Limestones of West Virginia: West Virginia Geological Survey, v. XII, 560 p.
Morris, F. O., Bader, J. S., Chisholm, J. L, and Downs, S. C., 1976 Hydrologic data for the Coal River basin, West Virginia: West Virginia Geological and Economic Survey Basic Data Report 5, 215 p.
Munson, W. C., 1966, Estimating consumptive use, Munson, P. E., index method, in Methods for estimating evapotranspiration: American Society of Civil Engineers Irrigation and Drainage Specialty Conference, Las Vegas, Nevada, November 1966, p. 65-107.
National Oceanic and Atmospheric Administration, October 1973 - November 1983, Climatological data, West Virginia: National Climatic Center, Asheville, North Carolina. (Issued monthly).
__ 1977, Climate of West Virginia: Asheville, North Carolina, 19 p.
__ 1982, Monthly normals of temperature, precipitation, and heating and cooling degree days 1951-80, West Virginia: Asheville, North Carolina, 10 p.
Norris, S. E., 1970, The effect of stream discharge on streambed leakage to a glacial outwash aquifer: U.S. Geological Survey Professional Paper 700-D, p. 262-265.
51
Morris, S. E. and Fidler, R. E., 1969, Hydrogeology of the Scioto River Valley near Piketon, south-central Ohio: U.S. Geological Survey Water-Supply Paper 1872, 70 p.
Overbey, W. K., Jr., 1961, Oil and gas report and map of Jackson, Mason and Putnam Counties, West Virginia: West Virginia Geological and Economic Survey Bulletin 23, 26 p.
Patchen, D. G., 1982, Oil and gas activity in West Virginia, 1970-1979: West Virginia Geological and Economic Survey Circular C-29, 187 p.
Pettyjohn, W. A., 1971, Water pollution by oil-field brines and related industrial wastes in Ohio: The Ohio Journal of Science 71 (5), September 1971, p. 257-269.
Price, P. H., Hare, C. E., McCue, J. B. and Hoskins, H. A., 1937, Salt brines of West Virginia: West Virginia Geological Survey, v. VIII, 203 p.
Rhodehamel, E. C., and Carlston, C. W., 1963, Geologic history of the Teays Valley in West Virginia: Geological Society of America Bulletin, v. 74, p. 251-274.
Rorabaugh, M. I., 1946, Ground-water resources of the southwestern part of the Louisville area, Kentucky: U.S. Geological Survey Open-File Report, 39 p.
__ 1956, Ground water in northeastern Louisville, Kentucky: U.S. Geological Survey Water-Supply Paper 1360-B, 69 p.
Shultz, R. A., 1984a, Ground-water hydrology of the upper New River Basin, West Virginia: West Virginia Department of Natural Resources, map report, scale 1:250,000, 1 sheet.
__ 1984b, Ground-water hydrology of the minor tributary basins of the Ohio River, West Virginia: West Virginia Department of Natural Resources, map report, scale 1:250,000, 1 sheet.
Stevens, H. C. and Lessing, Peter, 1982, Water use in West Virginia for 1980: West Virginia Geological and Economic Survey Circular C-27, 31 p.
Tarver, G. R., Downs, S. C., Chisholm, J. L, and Frye, P. M., 1976, Hydrologic data for the Elk River Basin, West Virginia: West Virginia Geologic and Economic Survey Basic Data Report 6, 106 p.
U.S. Army Corps of Engineers, 1983, Kanawha River navigation study: Huntington District report, 165 p.
U.S. Department of Commerce, 1981, 1980 census of population and housing, West Virginia: Bureau of the Census, Advance Report PHC 80-V-50, 15 p.
52
Wallace, J. C., Shamsi, R. A., and Deutsch, Morris, 1966, Preliminary survey of ground- water distribution and potential in the Ohio River basin, sub-drainage area 7, Guyandotte, Big Sandy, and Little Sandy River basins (including southside drainage area to the Ohio River and Ohio River alluvium between Point Pleasant and Maysville), in Ohio River basin comprehensive survey, v. VI, Appendix E, ground water: The Corps of Engineers, U.S. Army Engineer Division, Ohio River, Cincinatti, Ohio, report, p. 7-1 to 7-13, 1 plate.
West Virginia State Board of Health, 1981, Public water-supply regulations: 47 p.
Whitesides, D. V., and Ryder, P. D., 1969, Effects of pumping from the Ohio River valley alluvium between Carrolton and Ghent, Kentucky: Kentucky Geological Survey Information Circular 18, 20 p.
Wilmoth, B. M., 1960, Particle-size and permeability studies of the Quarternary alluvium in Kanawha County, W. Va.: West Virginia Academy of Science Proceedings, v. 31 and 32, Geology and Mining Section, p. 174-179.
__ 1966, Ground water in Mason and Putnam Counties, West Virginia: West Virginia Geological and Economic Survey Bulletin 32, 152 p.
Wyrick, G. G., and Borchers, J. W., 1981, Hydrologic effects of stress-relief fracturing in an Appalachian valley: U.S. Geological Survey Water-Supply Paper 2177, 51 p.
53


![Hydrology of - USGS · 2012-10-29 · Hydrology of Aquifer Systems in the Memphis Area, Tennessee By ]. H. CRINER, P-C. P. SUN, and D. ]. NYMAN CONTRIBUTIONS TO THE HYDROLOGY OF THE](https://static.fdocuments.us/doc/165x107/5e659f858350ee4a7867a865/hydrology-of-usgs-2012-10-29-hydrology-of-aquifer-systems-in-the-memphis-area.jpg)