Ground-Truthing Social Indicators of Fishing in North ... · These discrepancies may be explained...
35
1 Ground-Truthing Social Indicators of Fishing in North Carolina, South Carolina, Georgia, and east Florida Coastal Communities David Griffith Institute for Coastal Science and Policy East Carolina University Greenville, NC 27858 [email protected] Brent Stoffle NOAA Southeast Fisheries Science Center Miami, FL [email protected] Michael Jepson NOAA Fisheries Southeast Regional Office St. Petersburg, FL [email protected] With the Research Assistance of: Vernon Kelley Monica Heppel Flavia Tonioli and Elizabeth Brown-Pickren Volume I: Comparing Remote and Direct Observations August 15, 2013
Transcript of Ground-Truthing Social Indicators of Fishing in North ... · These discrepancies may be explained...
1
Ground-Truthing Social Indicators of Fishing in
North Carolina, South Carolina, Georgia, and east Florida Coastal Communities
David Griffith
Institute for Coastal Science and Policy
East Carolina University
Greenville, NC 27858
Brent Stoffle
NOAA Southeast Fisheries Science Center
Miami, FL
Michael Jepson
NOAA Fisheries Southeast Regional Office
St. Petersburg, FL
With the Research Assistance of:
Vernon Kelley
Monica Heppel
Flavia Tonioli
and
Elizabeth Brown-Pickren
Volume I:
Comparing Remote and Direct Observations
August 15, 2013

2
Ground-Truthing Social Indicators of Fishing in North Carolina, South Carolina, Georgia, and
Florida Coastal Communities
Executive Summary
Based on field research in 21 South Atlantic coastal communities reaching from Wanchese, North
Carolina to Palm Beach Shores, Florida, this report compares data from direct observations and
interviews in the communities to data from remote sources such as landings and the U.S. census, profiles
each of the communities in terms of its dependence and engagement with commercial and recreational
fisheries, and provides base-line information for social impact assessments, fisheries management plans,
and other policy initiatives. Its findings speak principally to the health of commercial and recreational
fisheries in the communities, the extent to which gentrification has changed the communities, and the
resilience and vulnerability of coastal communities in light of a variety of challenges, including fishing
regulations, high and rising fuel prices, and declining market opportunities with the loss of fish houses
and other fishing infrastructure. The principal findings of the report are as follows:
1. In general, the indices of dependence (or reliance) on commercial and recreational fisheries
developed with remote data sources and those developed through ground-truthing (e.g. site visits,
observations, and open-ended and guided interviews) yielded nearly identical information for
eight of the 21 ports, similar information for an additional seven ports, and different information
for six of the ports. Thus, the indicators developed from remote data sources were accurate in
slightly over 71% of the cases; for 29% of the cases the measures of dependence were less
accurate.
2. Three of those ports where discrepancies existed between the ground-truthing and indices were
the large metropolitan centers of Wilmington, North Carolina, Charleston, South Carolina, and
Savannah, Georgia. These discrepancies may be explained by the fact that the development of
the indices included the total population in their calculations; the large populations in these three
metropolitan areas (>200,000) may have diluted the indices developed for those ports.
3. A second measure developed from the remote data—an “average ranking” that combined
recreational and commercial fishing data—ranked 12 of the 21 fishing communities more or less
in line with the ground-truthing data, indicating that it is a less accurate measure of dependence
than the indices.
4. Overall, we found some residents in all of the ports included in this study who had strong ties to
the recreational and commercial fisheries of their communities, although residents in the smaller,
more remote, rural communities are more likely to characterize their communities as “fishing
communities” than residents of large metropolitan centers, where fishing communities are
confined to small areas or dispersed over the population.
5. In general, across South Atlantic fisheries, both the ground-truthing data and the indices suggest
that recreational fishing communities are “healthier” than commercial fishing communities, in the
sense that they are economically stronger, faced with fewer challenges, and less vulnerable to
decline.
6. On a ten point scale (1=weak, 10=strong), the average score for the strength of the local
commercial fishing community was 5.57 (sd=3.15) while the average score for the strength of the
local recreational fishing community was 7.79 (sd=2.38).
7. On a similar ten point scale, the average score for the overall economic health of the local
commercial fishing community was 3.66 (sd=2.25) while the average score for the overall
economic health of the recreational fishing community was 5.70 (sd=2.65).
8. When asked to describe their community, the highest percentage (39.5%) described their
community as a fishing community, indicating that, even with declines in commercial fishing in
recent years, the presence of fishing activity in a community can make a powerful impression on
its residents.
3
9. All of the communities in the study have experienced substantial change in the last five to ten
years, in most cases witnessing increases in their populations; four changes made up 75.5% of the
changes mentioned by those interviewed: 1) population increase (39.7%); 2) economic decline
(14.2%); 3) reduced fishing due to regulations (13.3%); and 4) more focus on tourism and retirees
(11.3%). Many of these changes made the fisheries of the communities more vulnerable to
decline.
10. The principal threats to commercial fishing mentioned by those interviewed were: 1) fishing
regulations (mentioned by 43.5%); 2) fuel prices (17.1%); 3) access to the resource (8.8%); and
imported seafood (6.2%).
11. The principal threats to recreational fishing mentioned were: 1) fishing regulations (30.6%); 2)
fuel costs (21.8%); and pollution (4.6%). Nearly one-fifth of those interviewed (17.1%) believed
that there were no threats to recreational fishing.
12. Based on both the ground-truthing information and the social indicators of dependence developed
by Jepson and Colburn (2013), Wanchese, North Carolina, ranked number one in terms of
dependence on commercial fishing. By contrast, barrier island communities like Wrightsville
Beach and Georgia’s Golden Isles (Brunswick, St. Simons, and St. Marys) ranked much lower by
both sets of measures.
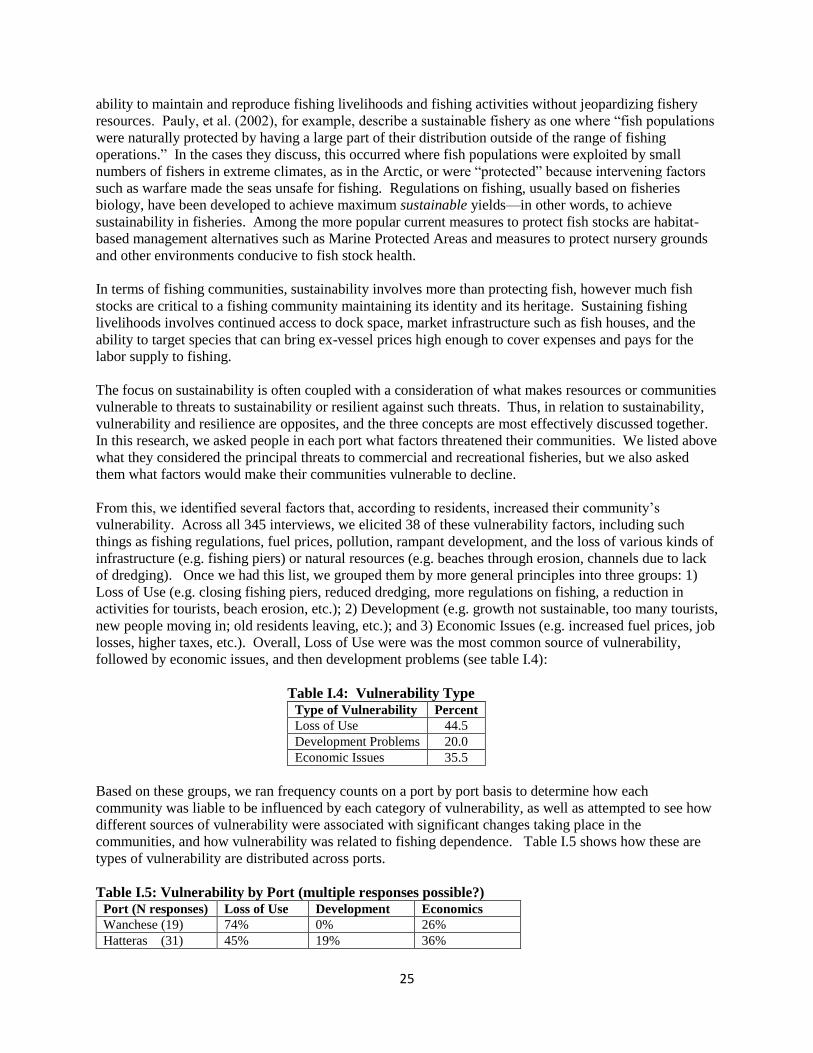
13. Three kinds of vulnerability account for the majority of the challenges facing these communities:
1) loss of use of the resource, due to fishing regulations, access problems, the loss of
infrastructure, etc. (mentioned by 44.5% of those interviewed); 2) development problems, such as
unsustainable growth, more activities directed toward tourists, etc. (20%); and 3) economic
issues, such as job losses, higher taxes, rising costs of living, etc. (35.5%).
14. Communities highly dependent on fishing economically are more likely to suffer from loss of use
than communities that are less dependent on fishing economically.
15. Communities less dependent on fishing are more likely to suffer from development problems than
communities highly dependent on fishing.
16. Changes taking place in the communities were significantly more likely to negatively affect
commercial fisheries than recreational fisheries.
17. All of the communities are experiencing gentrification, but in some gentrification is far more
advanced than in others. Florida’s communities all ranked highly in terms of gentrification, as
did the barrier island communities of Wrightsville Beach, St. Simons, and Atlantic Beach. Again,
the more remote, rural communities appeared to have experienced less gentrification.
While these are the principal findings of this study, they draw mainly on the work in Volume I of this
report; in the community profiles (Volume II), we present additional, more specific information about the
problems each community or cluster of communities is experiencing or has experienced in the past. The
information from Volume II will be particularly important for the development of Fishery Management
Plans, Social Impact Assessments, and other demands of National Standard 8.

4
Chapter 1: An Introduction to South Atlantic Fisheries
Based on field research in 21 South Atlantic coastal communities reaching from Wanchese, North
Carolina to Palm Beach Shores, Florida, this report compares data from direct observations and
interviews in the communities to data from remote sources such as landings and the U.S. census, profiles
each of the communities in terms of its dependence and engagement with commercial and recreational
fisheries, and provides base-line information for social impact assessments, fisheries management plans,
and other policy initiatives. The study emerged from ongoing attempts to meet the mandate of National
Standard 8 --Communities (50 CFR Ch. VI (10-1-10 Edition: §600.345), or the mandate that
“Conservation and management measures shall…take into account the importance of fishery resources to
fishing communities by utilizing economic and social data that are based on the best scientific
information available.” While concern for fishing communities is secondary to the concern for rebuilding
and maintaining healthy fishery resources, National Standard 8 (NS8) nevertheless demands that social
and economic data be developed to address questions such as a community’s dependence on or
engagement with fishery resources, its ability for sustained participation in fisheries, and whether or not a
Fishery Management Plan or policy initiative will adversely affect the community. National Standard 8
defines a fishing community as:
“a community that is substantially dependent on or substantially engaged in the harvesting or
processing of fishery resources to meet social and economic needs, and includes fishing vessel
owners, operators, and crew, and fish processors that are based in such communities. [It] is a
social or economic group whose members reside in a specific location and share a common
dependency on commercial, recreational, or subsistence fishing or on directly related fisheries-
dependent services and industries (for example, boatyards, ice suppliers, tackle shops)” (50 CFR
Ch. VI (10-1-10 Edition: §600.345: 61).
Clearly, in order to satisfy NS8, social scientists need to develop methods and measures that assess such
factors as dependence on and engagement with fisheries, what it means to have “sustained participation,”
and what constitutes adverse effects for fishing communities, the people who reside in them, and others
who provide support services to community and regional fisheries. Related issues include determining
the extent of vulnerability and resilience of communities to developments more or less beyond their
control, such as state and federal fishing regulations; storms, climate change, and other weather-related
phenomena; and economic changes in the form of higher fuel prices, property values, and gentrification.
In addition, recent works (e.g. Jepson and Colburn 2013; Pollnac, et al. 2006) have expanded these efforts
to address such features as community, family, individual well-being, satisfaction, happiness, and other
quality of life variables. These efforts are in line with the more general recognition that conventional
economic measures, such as per capita income or gross domestic product (GDP), do not adequately
reflect the lived experiences of people living from day to day in communities that may be experiencing
widespread poverty, marginalization, dislocation, and other negative social developments.
Much of this effort emerged from the influence of social science in fisheries research and policy,
particularly input from anthropologists, political scientists, and sociologists. Since the passage of the
Magnuson-Stevens Act of 1976, social scientific influence in fisheries policy has been expanding in terms
of disciplinary presence and the extent to which NOAA and other regulatory bodies have hired
anthropologists, political scientists, and sociologists. Prior to 1976, economics was the primary
disciplinary perspective which drove fisheries social science. While economic analyses are critical to
fisheries social science, particularly their advanced modeling capability, they usually represent primarily
those parts of fishing communities that can be quantified using economic data. Unfortunately, culture,
power, family, class, community, and other factors that influence fishing behavior and the composition of
fishing communities are not easily quantified and often fall outside of what is considered economic.
5
Ironically, it was a team of economists who initially pushed the analytical envelope beyond neoclassical
economics. Working on the research that produced the book, The New England Fishing Economy,
Doeringer, Moss, and Terkla (1987) differentiated between kinship based fishing operations and those
that conformed more to capitalist principles, finding that those in the kinship sector could weather
economic downturns more effectively than those in the capitalist sector. This set the stage to consider
more anthropological and sociological variables in assessing fishing behavior, fishing communities, and
even fishing economies, including the influence of family and ethnicity over fishing, the social relations
of fishing, fishing as a way of life rather than an occupation, and the broader power relations in which
fishing families find themselves. The community work of anthropologists like Acheson (1987), who
studied the lobster fishery of Maine, and McCay (1988), who studied the fisheries of New Jersey, began
to receive more attention outside of academics as they challenged notions such as the tragedy of the
commons and other assumptions held (and still widely espoused) in many fisheries policy circles.
Among some of the more important theoretical developments since then have come from Durrenberger’s
work on the fisheries of the Gulf of Mexico, Durrenberger and King’s (2000) critique of fisheries
management, and Menzies et al.’s (2001) work on traditional ecological and environmental knowledge
among fishers, hunters, foragers, and others. Conceptually, this work broadened the contexts in which
commercial and recreational fishing take place, initially drawing on peasant community and household
studies to understand commercial fishing families’ ways of life and later drawing on the social science of
class, culture, and power to understand processes challenging fisheries everywhere: gentrification; the
political economy of stock allocation; environmental movements; international trade, mariculture/
aquaculture, and imported seafood, pollution events such as the BP oil spill in the Gulf of Mexico, and so
forth. While it is beyond the scope of this work to deal with each of these works in detail here, it is
important to note that these works, and others, expanded the social science of fishing communities in
ways that have led to the recent and current efforts to understand fisheries dependence, engagement,
resilience, vulnerability, and other concepts central to the health and well-being of fishing families and
communities.
The emphasis on well-being or, stated another way, happiness, has been central to this work, deriving
principally from Richard Pollnac’s vision in relation to fishing communities (Pollnac, et al. 2006) but part
of a broader scholarly effort to consider quality-of-life measures and characteristics in evaluating social
and economic conditions around the world (e.g. Sen, Stiglitz, and Fitoussi 2010). Pollnac has been
tireless in his efforts to bring attention to and measure well-being or happiness as an alternative to
considering fishing communities healthy based on landings, ex-vessel prices, and other economic
variables. We know from the New England work cited above (Doeringer, Moss and Terkla 1987) that
kinship-organized fleets were more resilient than capital-organized fleets in the region, able to keep
individuals employed during economic downturns even if their levels of household income fell. That
many individuals and families chose to stay in fishing under such conditions, and that many still remain
in fishing despite regulated reductions in catch and income, suggested that their work in fishing was as
much a source of satisfaction, well-being, and happiness as it was a livelihood that enabled their families
to survive. This report is a direct descendant of this emphasis on well-being, concerned with multiple
dimensions of South Atlantic fisheries that indicate whether or not they are capable of providing families
of commercial and recreational fishers the means to achieve happiness.
Community Profiles and the Development of Social Indicators of Fishing Dependence, Vulnerability,
Resilience, and Sustainability
While ethnographic accounts and profiles of fishing communities have been produced as far back as the
19th century, with Goode’s (1887) comprehensive The Fisheries and Fishery Industries of the United
States, the work of writing fishing community profiles oriented specifically toward developing social
indicators of fishing dependence, vulnerability, resilience, and sustainability is more recent, dating to the
6
1990s and receiving additional impetus following the reauthorization of the Magnuson-Stevens Fishery
Conservation and Management Act in 1996, which added National Standard 8. Since that time, several
social scientists have been hired in NOAA Fisheries and Fishery Management Council offices and others,
both in and out of NOAA, have been enlisted to develop community profiles and work on social
indicators. These efforts, combined with other efforts in other federal agencies that track community
dependence on natural resources, have resulted in a variety of reports and other publications about fishing
communities (e.g. Blount 2006; Griffith, Valdes-Pizzini, and García Quijano 2007; Jepson, et al. 2001),
the loss of working waterfronts and fish houses (Garrity-Blake and Nash 2012), methodological work on
how to construct social indicators, and work more explicitly focusing on dependence, vulnerability, and
so forth (e.g. Cutter, Byron and Shirley 2003; Jepson and Colburn 2013; Jacob, et al. 2012).
Some of this work developed out of workshops, seminars, and sessions at professional meetings that
brought together social scientists to brainstorm about what were meant by such terms as fisheries
dependence and engagement and the other related concepts listed above (e.g. Jacob, et al. 2010). From
these activities, initially, emerged checklists of indicators of “substantial dependence” with and
“substantial engagement” on fisheries. For example, under the general category, Level and Type of
Fishing Activity, substantial dependence was indicated by landings, vessels, fishing techniques, access to
fishing opportunity outside the community, and types of fishing (i.e. commercial, charter, recreational,
subsistence). Substantial engagement was indicated by the quality and quantity of fishing infrastructure
in the community, number and types of permits, and number of households with people engaged in
fishing or related businesses.
Presumably, researchers could initially check which of these were present and subsequently tally up those
with quantitative values. A community that had all of the items in the list was considered more dependent
on fishing than a community with fewer, and if two or more communities had all the items on the list,
those with higher numbers of pounds landed, vessels, etc. were considered more dependent on fishing
than those with fewer pounds, vessels, etc. If the number of items fell below a certain threshold, the
community was no longer considered dependent on fishing; instead, it was considered engaged with
fishing. On these checklists were general categories for Economic, Social, and Cultural Roles and
Importance of fishing. Each category had its own lists of items, some of which could be quantified.
It was relatively easy to move from simple counts of items to creating indices, essentially boiling down
vast amounts of data into one measure of dependence or engagement. Such measures, of course, often
lose a good deal of contextual information in their construction, yet once these measures have been
developed they can be used to track changes in fisheries and to plug into models or quantitative analyses
that demonstrate positive or negative relationships between, say, fishing dependence and gentrification or
fishing dependence and natural hazards. Through this process, moreover, they enable predictive power,
allowing fishing families, owners of fishing and fishing-related businesses, fishery managers, and others
to make educated guesses about what might happen to fisheries following a hurricane or the development
of a condominium-marina complex.
The drawback of developing indices with these checklists is that they are costly, in time and money, often
requiring fieldwork to compile accurate, up-to-date information in each category. While such checklists
can be effective guides to fishing community profiles, such work is difficult to sustain financially over the
long term. For this reason, others began developing similar indices—social indicators—using readily
available data sources: the U.S. census, landings, fishing license/ permit data, real estate information,
labor force data, and so forth. For example, Jacob, et al. (2002), drawing on central place theory, used
census employment and fisheries permit data in Florida to determine the state’s dependent centers and
hinterlands of fishing. They defined a community as commercial fishery dependent if more than 15% of
its population were employed in fishing or fishing related activities, isolating the five Florida

7
communities that they considered dependent on fishing: Steinhatchee, Apalachicola, Panama City,
Ochobee/ Everglades City, and Panacea.
Jepson, et al. (2003) also used census data and state and federal fishing permit information to identify
fishing communities across the South Atlantic states of the Carolinas, Georgia, and Florida,
supplementing the remote data collection with rapid ethnographic assessment procedures (REAP) in
many of the communities identified. Among the problems they encountered was defining what
constituted a fishing community from census and permit data, given that many of the communities they
were examining were enmeshed in broader economic sectors, such as services and tourism, that often
“subsumed” fishing activity. The problem of isolating fishing communities encouraged Griffith, Valdes
Pizzini, and García Quijano (2007) to entitle their report of Puerto Rican fishing communities “Entangled
Communities”—a reference to fishing communities’ entanglements in economic and social sectors
outside of fishing.
It is, of course, these broader social and economic sectors that often infringe on fishing community
identity through gentrification and other social and political economic processes, leading to the
replacement of working waterfronts by recreational boating marinas, condominiums, and other types of
infrastructure. The loss of fish houses has been part of this process, yet fish houses, seafood processing
facilities, and wholesale and retail markets for seafood have also been undermined by imports of
seafood—particularly seafood imported from locations around the world where labor costs are lower and
environmental restrictions less stringent than in the United States. Yet seafood imports are often critical
to seafood retail outlets and restaurants during times of the year that local or domestic seafood is not
readily available. At the same time, employment in service sectors, tourism, construction, and other
economic sectors fueled by gentrification often provide employment to members of fishing families that
allow them to remain in commercial fishing at least part-time. Determining how these different political
economic developments affect fishing communities—qualitatively and quantitatively—hinges on our
understandings of community, dependence on fishing, vulnerability, and other concepts discussed in this
report.
Fishing Communities of the South Atlantic
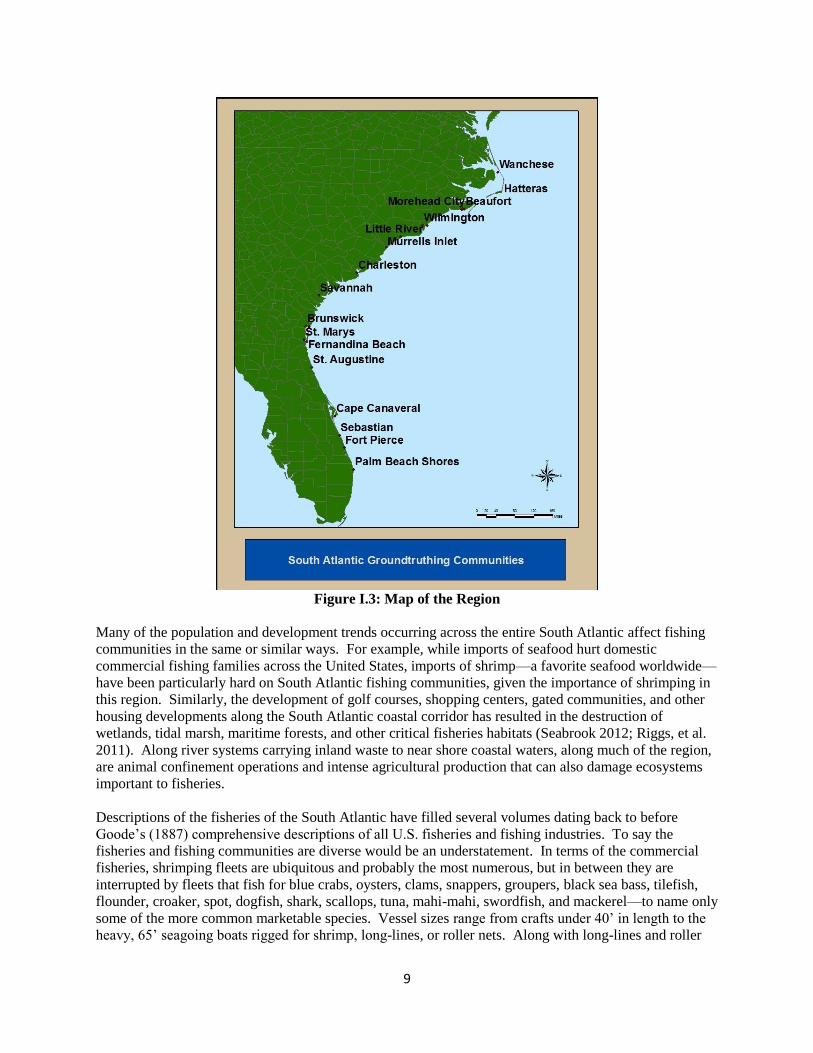
The 21 fishing communities we profile in this report, and where we collected data, are listed below and
noted on the accompanying map. They range from small, unincorporated communities like Wanchese or
Sneads Ferry to large metropolitan areas like Wilmington, North Carolina, Charleston, South Carolina,
Savannah, Georgia, or the heavily populated strip of south Florida coast around Palm Beach Shores. In
Volume II of this report, we profile each of the communities in more detail, although several of them we
discuss together, given that they are either contiguous or share history.
1. Wanchese, North Carolina
2. Hatteras Village, North Carolina
3. Beaufort, North Carolina
4. Morehead City, North Carolina
5. Atlantic Beach, North Carolina
6. Sneads Ferry, North Carolina
7. Wrightsville Beach, North Carolina
8. Wilmington, North Carolina
9. Little River, South Carolina
10. Murrells Inlet, South Carolina
11. Charleston, South Carolina
12. Savannah, Georgia
13. Brunswick, Georgia
8
14. St. Simons, Georgia
15. St. Marks, Georgia
16. Fernandina Beach, Florida
17. St. Augustine, Florida
18. Cape Canaveral, Florida
19. Sebastian, Florida
20. Ft. Pierce, Florida
21. Palm Beach Shores, Florida
Although these are individual ports, we understand that many of them are connected to other South
Atlantic ports, often in interdependent ways. The marine support services offered in Wilmington, for
example, may be used by fishing families across Brunswick County, in Southport, Varnumtown, and
Calabash, for example, as well as communities in northern South Carolina, such as Little River and
Murrells Inlet. By the same token, the communities of Brunswick, St. Simon, and St. Marys, Georgia
have ties of family and crew to one another and to the shrimping fleet Darien, Georgia, north of
Brunswick. Fishing families in the greater Charleston metropolitan area, who handle their own seafood
sales, buy fish from as far away as Cape Canaveral, Florida. Some charter boat captains who work out of
North and South Carolina ports during the summer months work out of Florida ports during the winter
months.
These and other interconnections recommend a regional view of South Atlantic fishing and fishing
communities. A regional approach carries the added benefit of understanding those fishing communities
that are difficult to isolate geographically: that is, those that exist as networks of fishing families spread
across larger metropolitan areas rather than as politically defined territories. While clearly demarcated
communities like Wanchese, Hatteras Village, and Sneads Ferry in North Carolina or Brunswick in
Georgia are relatively easy to view as places where commercial and recreational fishing are central to
community identities, it is far more difficult to consider places like Wilmington, North Carolina,
Charleston, South Carolina, or Savannah, Georgia as fishing communities. Instead, they are large
metropolitan areas that contain minorities of commercial fishing families, charter boat captains and crew,
and recreational fishers. These observations are important to keep in mind as we consider the data
collected from remote sources, such as the census, and used to develop indices for reliance on recreational
and commercial fishing; fishing activity is often difficult to tease out of surpluses of census, labor force,
and other data.
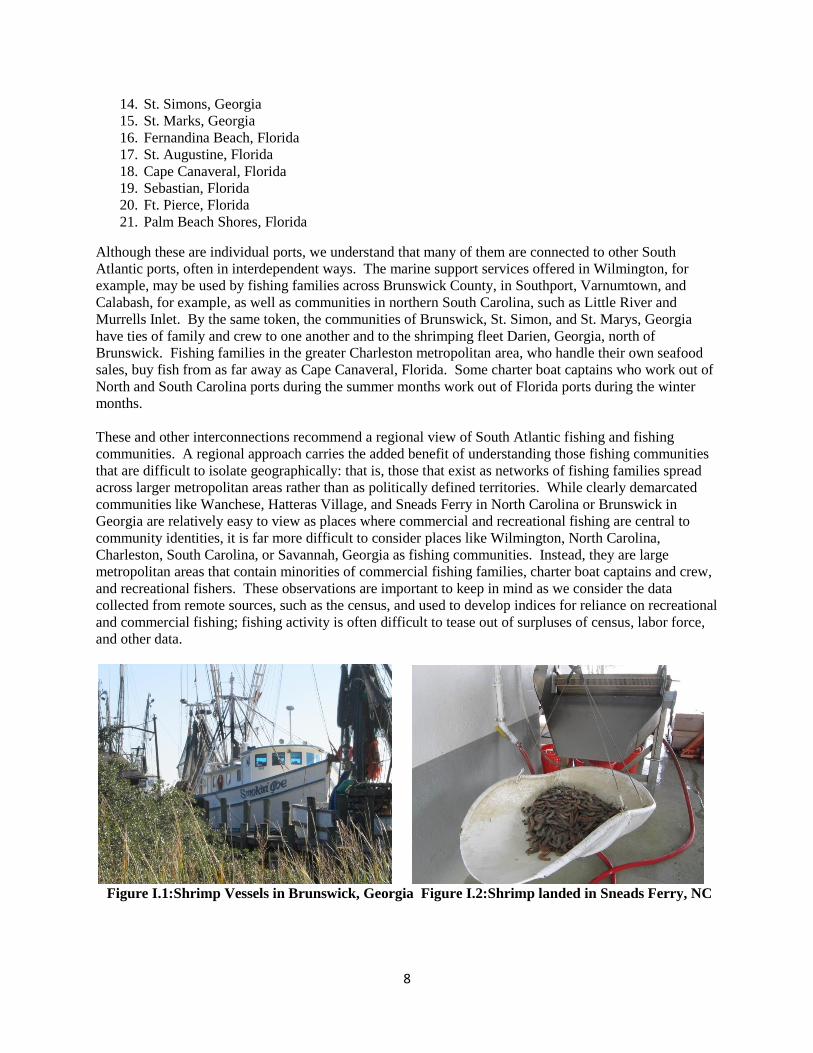
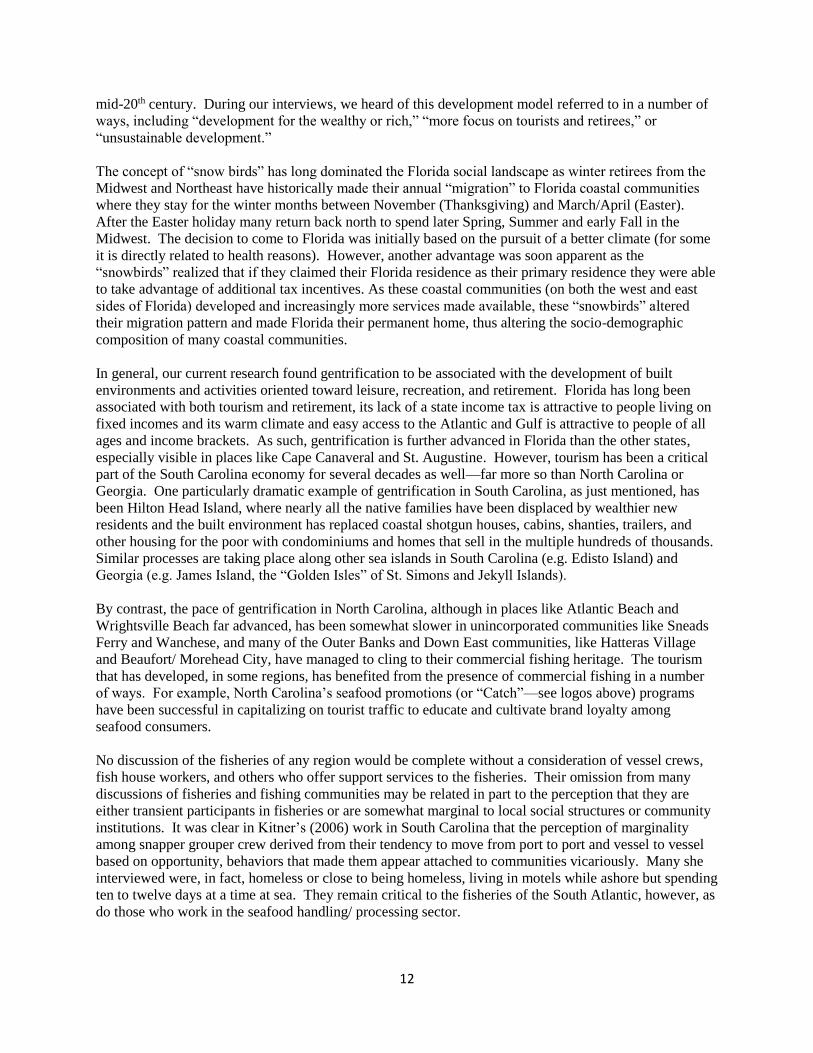
Figure I.1:Shrimp Vessels in Brunswick, Georgia Figure I.2:Shrimp landed in Sneads Ferry, NC
9
Figure I.3: Map of the Region
Many of the population and development trends occurring across the entire South Atlantic affect fishing
communities in the same or similar ways. For example, while imports of seafood hurt domestic
commercial fishing families across the United States, imports of shrimp—a favorite seafood worldwide—
have been particularly hard on South Atlantic fishing communities, given the importance of shrimping in
this region. Similarly, the development of golf courses, shopping centers, gated communities, and other
housing developments along the South Atlantic coastal corridor has resulted in the destruction of
wetlands, tidal marsh, maritime forests, and other critical fisheries habitats (Seabrook 2012; Riggs, et al.
2011). Along river systems carrying inland waste to near shore coastal waters, along much of the region,
are animal confinement operations and intense agricultural production that can also damage ecosystems
important to fisheries.
Descriptions of the fisheries of the South Atlantic have filled several volumes dating back to before
Goode’s (1887) comprehensive descriptions of all U.S. fisheries and fishing industries. To say the
fisheries and fishing communities are diverse would be an understatement. In terms of the commercial
fisheries, shrimping fleets are ubiquitous and probably the most numerous, but in between they are
interrupted by fleets that fish for blue crabs, oysters, clams, snappers, groupers, black sea bass, tilefish,
flounder, croaker, spot, dogfish, shark, scallops, tuna, mahi-mahi, swordfish, and mackerel—to name only
some of the more common marketable species. Vessel sizes range from crafts under 40’ in length to the
heavy, 65’ seagoing boats rigged for shrimp, long-lines, or roller nets. Along with long-lines and roller
10
nets, gear include gill nets, seines, otter trawls, pound nets, crab traps, fish pots, dredges, bandit rigs,
hooks, and spears. Commercial marinas or docking facilities can be individual piers inside small creeks
to large industrial parks to historical waterfronts. Seafood marketing strategies range from the individual
fishmonger selling his or her catch in farmers markets or from roadside stands to large fish houses
shipping everything they land to New York, Boston, or Canada.
Professional recreational fishermen—captains and crew of charter boats, head boats, party boats, and the
like—are somewhat less diverse than the commercial fleets but no less common than the shrimp fleets,
often docking in close proximity to commercial vessels and occasionally owned by former or current
commercial fishers and crewed by former or current commercial mates. In many communities,
commercial fishers and charter boat captains come from the same families and same cultural
backgrounds, and typically support one another against groups determined to designate certain species of
fish exclusively game fish. Hatteras Village’s blessing of the fleet explicitly includes charter boats to
show this solidarity. Some marinas no longer welcome commercial vessels, having been highly
gentrified and converted largely to recreational and leisure uses. In Wilmington, North Carolina, for
example, a dock master we interviewed said that the marina no longer allowed commercial vessels to
operate out of their marina, yet the marina had a handful of fishing charter boats moored in their slips and
advertising their services. This is also an increasingly common trend in Florida’s coastal communities as
commercial fishing ports and marinas are increasingly being converted either to recreational and charter
facilities or are completely overhauled and redeveloped into more tourist friendly businesses.
Across the South Atlantic, shrimping has been, historically and traditionally, one of the more important
fisheries, but it is also the fishery that is most vulnerable to competition from imports. Pond-raised
shrimp are common across the world, particularly in poorer countries where labor costs allow growers in
places like Malaysia, China, India, Vietnam, and Ecuador to flood U.S. markets with low-cost, fully
processed, uniformly-sized, raw or cooked shrimp. Large retail outlets and supermarket chains like Wal-
Mart, Sam’s Club, Kroger, and Food Lion routinely buy more imported, farm-raised rather than domestic
wild caught shrimp. In response to imports, many fishing community members have been engaging in
marketing campaigns designed to promote local shrimp, including branding them as “wild caught” or
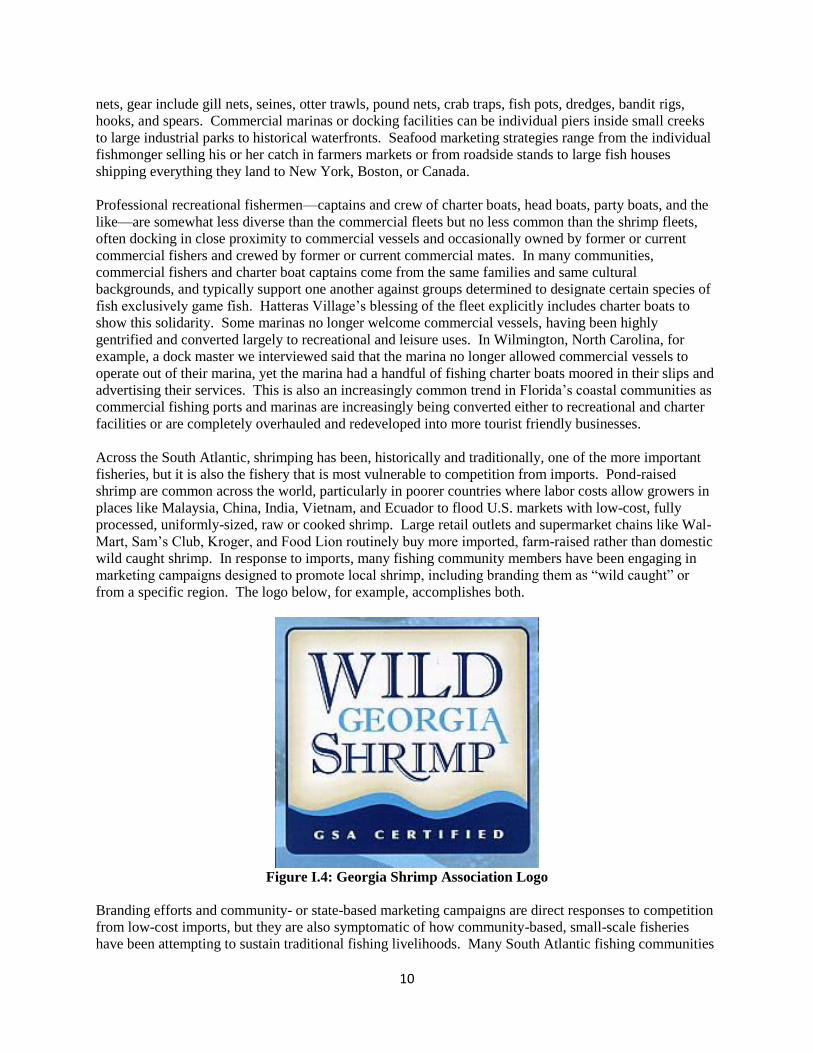
from a specific region. The logo below, for example, accomplishes both.
Figure I.4: Georgia Shrimp Association Logo
Branding efforts and community- or state-based marketing campaigns are direct responses to competition
from low-cost imports, but they are also symptomatic of how community-based, small-scale fisheries
have been attempting to sustain traditional fishing livelihoods. Many South Atlantic fishing communities

11
have attempted to distinguish themselves from large, fish-house based fishing fleets, casting themselves
as tied to community traditions and heritage, local economies and local culinary traditions, and cultural
values oriented toward conserving (while not preserving) fisheries and other marine resources.
Community festivals and blessings of the fleet have been part of otherwise multi-stranded efforts to
mobilize fishing families to resist the many assaults on commercial and recreational fishing. In Hatteras
Village’s Days at the Docks, Sneads Ferry’s annual shrimp festival, and Shem Creek’s A Taste of Shem
Creek are three examples of festivals oriented toward educating the public about the importance of local,
community-based fisheries. The Hatteras festivities are perhaps the most innovative, given their
emphasis on the connections between the local commercial fishing fleet and the local charter boat fleet,
showing that they need not be in competition with one another.
At the same time, fish-house based fisheries are not as distinct from community-based fisheries as many
suggest, in part because fish houses themselves are varied in terms of the numbers of vessels, nature of
activities at their sites, relations between the fish house and the vessels that land fish at them, and so forth.
The fish houses of Wanchese, North Carolina, for example, vary from those who specialize in large
vessels (e.g. 65’ and over) to those that have smaller vessels capable of negotiating Oregon Inlet. The
three fish houses on Shem Creek, in the greater Charleston area of Mt. Pleasant, vary in terms of their
relations with the fishing vessels that land fish with them, the services they provide, and whether or not
their sites are centers for fishers to gather before and after landing their fish. Owners of fish houses in
Brunswick County, just south of Wilmington, North Carolina, have been active participants in the
branding program known as Brunswick Catch, a campaign designed to support community-based
fisheries, which joins three other North Carolina catch programs promoting local seafood (see logos
below).
Figure I.5: North Carolina Catch Logos
All of the communities profiled here have been affected by gentrification, or the process of wealthier,
often newer residents displacing poorer residents who have grown up in the communities. This process
can be far advanced, as on Hilton Head Island, South Carolina, where few of the native residents remain,
or can be relatively new, as in Sneads Ferry, where the lack of incorporation has stalled development.
Nevertheless, all the communities in our sample have experienced some degree of gentrification, and that
gentrification has had uneven impacts on community fishing. We will discuss gentrification in more
detail below, but here describe some of its general contours and state and regional differences. It is
perhaps most advanced in the Florida communities, where coastal tourist, marina, condominium, golf
course, and other forms of development typically associated with gentrification have occurred since the
12
mid-20th century. During our interviews, we heard of this development model referred to in a number of
ways, including “development for the wealthy or rich,” “more focus on tourists and retirees,” or
“unsustainable development.”
The concept of “snow birds” has long dominated the Florida social landscape as winter retirees from the
Midwest and Northeast have historically made their annual “migration” to Florida coastal communities
where they stay for the winter months between November (Thanksgiving) and March/April (Easter).
After the Easter holiday many return back north to spend later Spring, Summer and early Fall in the
Midwest. The decision to come to Florida was initially based on the pursuit of a better climate (for some
it is directly related to health reasons). However, another advantage was soon apparent as the
“snowbirds” realized that if they claimed their Florida residence as their primary residence they were able
to take advantage of additional tax incentives. As these coastal communities (on both the west and east
sides of Florida) developed and increasingly more services made available, these “snowbirds” altered
their migration pattern and made Florida their permanent home, thus altering the socio-demographic
composition of many coastal communities.
In general, our current research found gentrification to be associated with the development of built
environments and activities oriented toward leisure, recreation, and retirement. Florida has long been
associated with both tourism and retirement, its lack of a state income tax is attractive to people living on
fixed incomes and its warm climate and easy access to the Atlantic and Gulf is attractive to people of all
ages and income brackets. As such, gentrification is further advanced in Florida than the other states,
especially visible in places like Cape Canaveral and St. Augustine. However, tourism has been a critical
part of the South Carolina economy for several decades as well—far more so than North Carolina or
Georgia. One particularly dramatic example of gentrification in South Carolina, as just mentioned, has
been Hilton Head Island, where nearly all the native families have been displaced by wealthier new
residents and the built environment has replaced coastal shotgun houses, cabins, shanties, trailers, and
other housing for the poor with condominiums and homes that sell in the multiple hundreds of thousands.
Similar processes are taking place along other sea islands in South Carolina (e.g. Edisto Island) and
Georgia (e.g. James Island, the “Golden Isles” of St. Simons and Jekyll Islands).
By contrast, the pace of gentrification in North Carolina, although in places like Atlantic Beach and
Wrightsville Beach far advanced, has been somewhat slower in unincorporated communities like Sneads
Ferry and Wanchese, and many of the Outer Banks and Down East communities, like Hatteras Village
and Beaufort/ Morehead City, have managed to cling to their commercial fishing heritage. The tourism
that has developed, in some regions, has benefited from the presence of commercial fishing in a number
of ways. For example, North Carolina’s seafood promotions (or “Catch”—see logos above) programs
have been successful in capitalizing on tourist traffic to educate and cultivate brand loyalty among
seafood consumers.
No discussion of the fisheries of any region would be complete without a consideration of vessel crews,
fish house workers, and others who offer support services to the fisheries. Their omission from many
discussions of fisheries and fishing communities may be related in part to the perception that they are
either transient participants in fisheries or are somewhat marginal to local social structures or community
institutions. It was clear in Kitner’s (2006) work in South Carolina that the perception of marginality
among snapper grouper crew derived from their tendency to move from port to port and vessel to vessel
based on opportunity, behaviors that made them appear attached to communities vicariously. Many she
interviewed were, in fact, homeless or close to being homeless, living in motels while ashore but spending
ten to twelve days at a time at sea. They remain critical to the fisheries of the South Atlantic, however, as
do those who work in the seafood handling/ processing sector.

13
Among the latter are immigrants from Mexico and Central America, many arriving in the region since the
last major immigration reform in the 1980s, known as the Immigration Reform and Control Act of 1986
(IRCA). Part of IRCA expanded the use of temporary foreign workers in industries that typically have
trouble finding workers, which in the South Atlantic fisheries included the seafood processing sector.
Beginning in 1988, seafood processing houses, particularly in North Carolina and Virginia, began
importing women with H-2B visa (temporary work visas) primarily from the Mexican states of Sinaloa
and Tabasco to work in crab-picking houses, shrimp, and fish processing (Griffith 2006). This legal
immigration dovetailed with other temporary foreign labor programs in forestry and agriculture, as well
as undocumented immigration, to make many of the South Atlantic states “new immigrant destinations”
(Massey 2008; Zuñiga and Hernández-Leon 2005). While Florida has had a significant Latino
population—of Cubans, Guatemalans, and Mexicans—since the 1960s, it wasn’t until the 1990s that the
Carolinas and Georgia witnessed substantial increases in their Latino populations, with some counties
experiencing increases in the multiple hundreds of percent. Seafood houses along the coast took
advantage of these new immigrants, hiring them into fish processing/ packing and other support services.
Today many of the fish houses along the South Atlantic coast employ Latino workers; although many of
the seafood processing plants that originally hired H-2B workers closed through the 1990s and into the
21st century, a handful of firms continue importing H-2B workers today.
Marine Business/ Infrastructure Checklist
As part of our research for this report, we filled out observational checklists of marine-related businesses
and infrastructure. To complete these we relied on our own observations in each port, on websites, and
on local directories such as phone books. Often referred to as windshield surveys, these included
checking to see each whether or not the items listed in the table below were present in each community.
In some cases, the checklists may be incomplete, in that we may not have been able to observe 100% of a
community’s infrastructure if that community was either large, like Savannah, Georgia, or embedded in a
sprawling metropolitan area, like Palm Beach Shores, Florida. Of the 40 items on the check list, the
average number of items per port was 25 and the range was 16 to 36.
Table I.1: Marine Businesses & Infrastructure in South Atlantic Fisheries Marine Business/ Infrastructure Percent
___Air fill stations (diving) 76
___Bait houses (commercial) 71
___Bars/ clubs (dockside or in town) 100
___Boat builders 52
___Boat insurance companies 81
___Churches with maritime touch 33
___Cold storage for bait, catch 86
___Docking facilities (commercial) 86
___Electronic, navigational, computer equipment/repair 62
___Fishing associations 57
___Wholesale Seafood/Fish House 86
___Fisheries research laboratories 43
___Fishing monuments 24
___Fishing pier 57
___Fish processors 62
___Fishing supplier 91
___Fuel company for recreational/commercial fisheries 100
___Harbormaster 67
___Hotels/Inns (dockside) 71
___Ice houses 67
___Labor unions (seafarers) 14
14
___Lawyers (admiralty/ working with fisheries) 52
___Marine conservation organization office 19
___Marine railways/haul out facilities 38
___Marine boating suppliers (type) 71
___Marine surveyors 48
___Museums—fishing/marine-related 57
___Net makers 29
___NMFS or state fisheries office (port agent, etc.) 14
___Public boat launches 86
___Recreational docks/marinas 95
___Bait & Tackle/fishing supplies 91
___Sea Grant Extension office 19
___Seafood restaurants 100
___Seafood retail markets 95
___Trucking operations 52
___Welding and welding suppliers 52
___Whale watching/pleasure tours 76
___Charter/Party Boats 100
___Commercial Boats 86
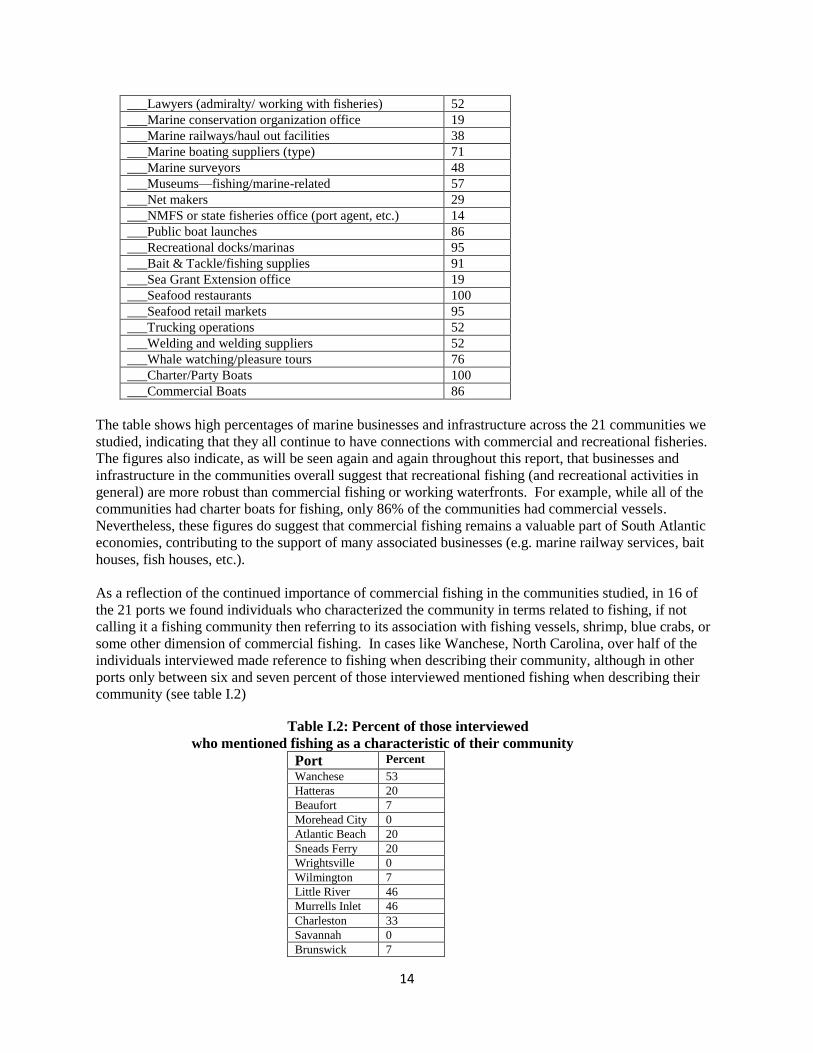
The table shows high percentages of marine businesses and infrastructure across the 21 communities we
studied, indicating that they all continue to have connections with commercial and recreational fisheries.
The figures also indicate, as will be seen again and again throughout this report, that businesses and
infrastructure in the communities overall suggest that recreational fishing (and recreational activities in
general) are more robust than commercial fishing or working waterfronts. For example, while all of the
communities had charter boats for fishing, only 86% of the communities had commercial vessels.
Nevertheless, these figures do suggest that commercial fishing remains a valuable part of South Atlantic
economies, contributing to the support of many associated businesses (e.g. marine railway services, bait
houses, fish houses, etc.).
As a reflection of the continued importance of commercial fishing in the communities studied, in 16 of
the 21 ports we found individuals who characterized the community in terms related to fishing, if not
calling it a fishing community then referring to its association with fishing vessels, shrimp, blue crabs, or
some other dimension of commercial fishing. In cases like Wanchese, North Carolina, over half of the
individuals interviewed made reference to fishing when describing their community, although in other
ports only between six and seven percent of those interviewed mentioned fishing when describing their
community (see table I.2)
Table I.2: Percent of those interviewed
who mentioned fishing as a characteristic of their community
Port Percent
Wanchese 53
Hatteras 20
Beaufort 7
Morehead City 0
Atlantic Beach 20
Sneads Ferry 20
Wrightsville 0
Wilmington 7
Little River 46
Murrells Inlet 46
Charleston 33
Savannah 0
Brunswick 7

15
St. Simons 0
St. Marys 0
Fernandina 33
St. Augustine 20
Cape Canaveral 33
Sebastian 20
Ft. Pierce 46
Palm Beach 40
The following chapter presents the bulk of the data from the ground-truthing work, in many places
comparing it to the data that Jepson and Colburn (2013), as well as others (e.g. Jacob, et al. 2010) used to
develop social indicators of dependence, vulnerability, resilience, and other characteristics of fishing
communities.

16
Chapter 2:
Comparing Data from Ground-Truthing to Remotely Sourced Data in the South Atlantic
Methodology
This research, conducted from August 2012 to June 2013, combined direct observations and interviews
with background data collection in 21 ports from Wanchese, North Carolina to Palm Beach Shores,
Florida. In each port, we initially visited fishing centers, fish packing facilities (commonly known as fish
houses), recreational and commercial marinas, docks, fishing regulatory offices, seafood retail markets
and restaurants, marine- or water-oriented museums, and other sites related to commercial and
recreational fishing. At these sites we observed activities, took photographs, interviewed people both
casually and in more depth about local recreational and commercial fishing, and completed Marine
Business Checklists. In addition, we conducted web-based searches about each community, collecting
data on fishing and seafood related businesses, demographics, and other public data. Finally, we
collected or perused published and printed materials from local bookstores, archives, local libraries, and
other repositories.
Following these activities, we developed an informal interview protocol and interviewed up to 15
individuals per port (some being interviewed multiple times), completing a total of 345 usable interviews
with a range of individuals knowledgeable about a variety of topics related to their communities,
including fishing. These informal interviews were then post-coded for the qualitative and quantitative
discussions below. Our informal interviews were with commercial and recreational fishermen (including
charter boat captains and mates), local realtors, seafood workers, local politicians, librarians, school
teachers, and residents from a variety of other occupations. In all, those we interviewed spanned 63
occupations.
In terms of sampling, the people interviewed in each community were not randomly sampled but selected
because of their long-time knowledge of the community or direct involvement in recreational or
commercial fisheries. Interviewers were instructed to probe individuals about their knowledge of local
fishing or selected people referred to them as people particularly knowledgeable about local fishing.
Thus, informants in all communities were either active commercial or recreational fishers, people related
to the fishing industry in some way (e.g. an owner of a seafood market), or were people who had lived in
the community many years and claimed knowledge of the community’s fisheries. In the social sciences,
this is referred to as a judgment sample—a sample of individuals who represent a domain of knowledge
(Babbie 2010; Bernard 2011). While they cannot be said to represent, statistically, the community in the
same way a census or a random sample might, they can give us sound information about the trajectories
of each community’s fisheries, data that, replicated across communities, can be used to compare to other
community fisheries visited in the study. Sampling procedures of this kind are widely used in the
cognitive social sciences, guided by a general logic that people most qualified to provide information
about a specific domain, such as community fisheries, are those who are actively involved with that
domain. A random sample even in a small community like Wanchese might well include residents who
know little to nothing about fishing.
Given the fact that these data were collected in interview formats, they were post-coded for quantitative
presentation. This is a time-consuming process of teasing from the texts of the interviews similar
information for comparative purposes. The result of this process is that percentage counts are presented
for many variables and, in some cases, new variables were constructed from a number of comments made
by those interviewed. For example, we asked the general question of how people characterized their
community, which resulted in over 80 descriptors; of these we developed a “gentrification” variable that
included descriptors such as “wealthy,” “high cost of living,” “high taxes,” and so forth.
17
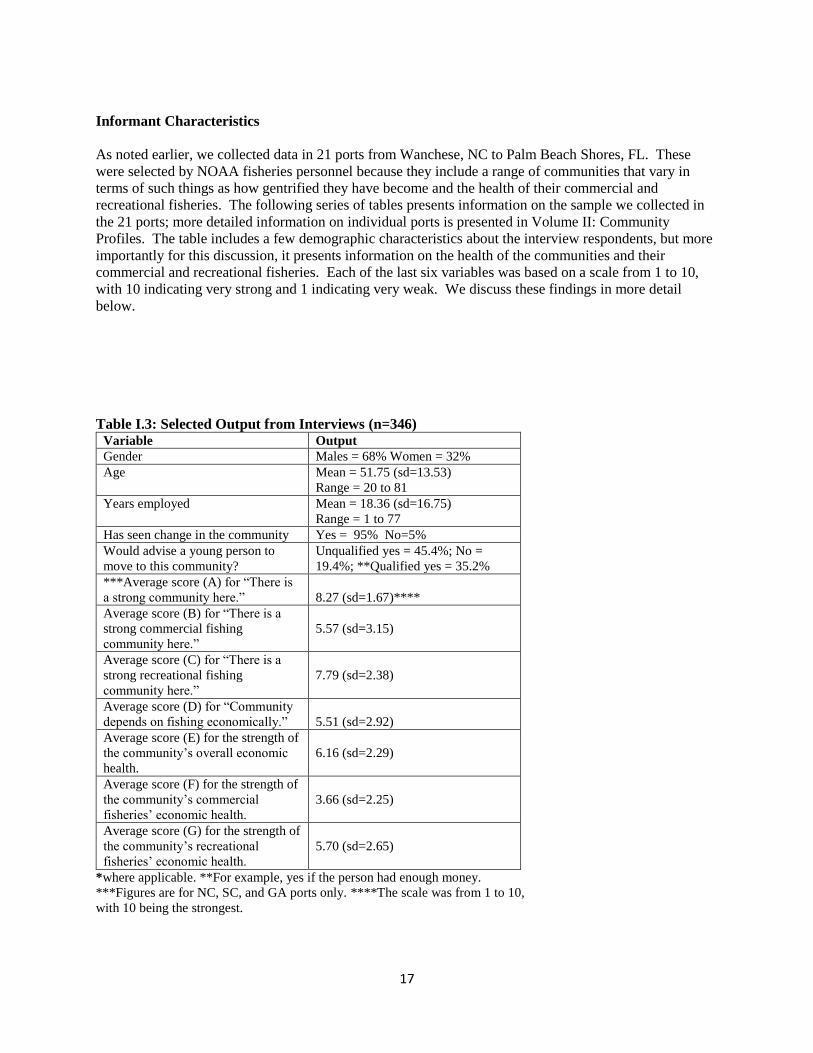
Informant Characteristics
As noted earlier, we collected data in 21 ports from Wanchese, NC to Palm Beach Shores, FL. These
were selected by NOAA fisheries personnel because they include a range of communities that vary in
terms of such things as how gentrified they have become and the health of their commercial and
recreational fisheries. The following series of tables presents information on the sample we collected in
the 21 ports; more detailed information on individual ports is presented in Volume II: Community
Profiles. The table includes a few demographic characteristics about the interview respondents, but more
importantly for this discussion, it presents information on the health of the communities and their
commercial and recreational fisheries. Each of the last six variables was based on a scale from 1 to 10,
with 10 indicating very strong and 1 indicating very weak. We discuss these findings in more detail
below.
Table I.3: Selected Output from Interviews (n=346) Variable Output
Gender Males = 68% Women = 32%
Age Mean = 51.75 (sd=13.53)
Range = 20 to 81
Years employed Mean = 18.36 (sd=16.75)
Range = 1 to 77
Has seen change in the community Yes = 95% No=5%
Would advise a young person to
move to this community?
Unqualified yes = 45.4%; No =
19.4%; **Qualified yes = 35.2%
***Average score (A) for “There is
a strong community here.”
8.27 (sd=1.67)****
Average score (B) for “There is a
strong commercial fishing
community here.”
5.57 (sd=3.15)
Average score (C) for “There is a
strong recreational fishing
community here.”
7.79 (sd=2.38)
Average score (D) for “Community
depends on fishing economically.”
5.51 (sd=2.92)
Average score (E) for the strength of
the community’s overall economic
health.
6.16 (sd=2.29)
Average score (F) for the strength of
the community’s commercial
fisheries’ economic health.
3.66 (sd=2.25)
Average score (G) for the strength of
the community’s recreational
fisheries’ economic health.
5.70 (sd=2.65)
*where applicable. **For example, yes if the person had enough money.
***Figures are for NC, SC, and GA ports only. ****The scale was from 1 to 10,
with 10 being the strongest.
18
These figures seem to confirm what many observers of commercial fisheries and many members of
commercial fishing families perceive: that commercial fishing communities and their economic health are
not as strong or healthy as are recreational fishing communities. They also suggest the people
interviewed believe that the coastal communities of North Carolina, South Carolina, and Georgia—most
of which are communities with a lengthy history of fishing—have strong senses of community in general;
the average “community strength” score of 8.27 (out of 10) and a standard deviation of 1.6 indicates little
variability. Indeed, in the community profiles (Volume II), the ways people talk about their communities
suggest that they feel strong ties to them. This is also reflected in the fact that over 80% of those
interviewed said that they would advise a young person to move to their community.
On the other hand, 95% of those interviewed have witnessed changes in their communities, in most cases
the kinds of changes that have meant a decreasing economic importance of commercial fishing and an
increase in the economic importance of recreational fishing and tourism/ leisure activities generally. The
most common change cited was an increase in population, cited by over one-third of those interviewed,
but four types of changes made up 75.5% of the changes mentioned:
Population Increase 39.7%
Economic Decline 14.2%
Less fishing due to regulations 13.3%
More focus on tourism & retirees 11.3%
Comparing scores (B) and (C) in table 3 above with one another and scores (F) and (G) with one another
shows that community residents tended to believe that, first, the recreational fishing community in their
port was stronger than the commercial fishing community and that the economic health of recreational
fisheries was stronger than the economic health of commercial fisheries.
Particularly troubling for commercial fisheries is the low score on economic health of 3.66, especially
given that many policy initiatives are based on the economic importance of an occupation or industrial
sector. The higher score for the strength of the commercial fishing community, however, lends support to
our contention, above, that economic measures alone are not necessarily the most effective tool for
valuing a community, an occupation, or an economic activity. In addition, when asked what came to
mind when people considered their community, the highest percentage (39.5%) described their
community as a fishing community. Other characteristics associated with these ports included: that they
were small, quiet, safe, clean, family-oriented communities (37%); their attachment to water-based
resources, including beaches, boardwalks, etc. (33%); and their history or heritage (16%). As we will see
in more detail in the community profiles, the links among these characteristics are common particularly in
the smaller, more rural communities that are not heavily influenced by nearby large metropolitan areas,
suggesting that a community that residents consider a fishing community is also a community that
residents consider safe, clean, family-oriented, and so forth.
In terms of the threats to commercial fishing, four threats accounted for 75.6% of the responses:
Fishing regulations 43.5%
Fuel prices 17.1%
Access to the resource 8.8%
Imported seafood 6.2%
Other threats listed were the lack of dredging, pollution, recreational commercial conflicts/ competition,
weather, low catch prices, and costs other than fuel.

19
The threats to recreational fishing were not considerably different, with fuel costs and regulations also
topping the list, although 17.1% of those interviewed believed that there were no threats to recreational
fishing. The top three threats to recreational fishing listed were:
Fishing regulations 30.6%
Fuel costs 21.8%
Pollution 4.7%
Perceived problems with fishing regulations came up in other contexts as well. In response to what
would affect the community most, over one quarter (27.5%) mentioned fishing regulations; in terms of
what would make the community vulnerable to decline, 18.5% mentioned fishing regulations.
Regulations are only one of several ways these communities are vulnerable to decline, however. Other
sources of vulnerability included economic downturns (29.4%) and weather (19.4%). That weather plays
no small role in coastal communities should not be surprising, especially in light of weather/ climate
related problems such as increased hurricane strength, sea level rise, and general warming trends. Some
of the ports studied have experienced severe storms more than once over the past five years, making
weather a key player in community profiles.
Comparative Analysis
In essence, this work directly compares data from remote sources to data from direct, on-the-ground field
research to determine how accurately the remote source data can be used to develop social indicators that
estimate dependence on and engagement with commercial and recreational fishing, sustainability,
vulnerability, resilience, and gentrification. Specifically, we draw on the work of Jepson and Colburn
(2013) and Jacobs, Weeks, and Blount (2010) as our principal sources for the ways in which estimates
from remote data sources were developed. Jepson and Colburn’s study was particularly useful.
Dependence on and Engagement with Commercial and Recreational Fishing
During both the open-ended interviewing phase of the research and the more guided interviews, we asked
several pointed questions about communities’ relationships with commercial and recreational fishing.
These included the five questions asking community residents to rank the strength or health of their
fishing community and fishing economy on a scale of one to ten, including the general statement that
“This community depends on fishing economically.” Second, we asked two open-ended questions on the
principal threats facing recreational fishing and commercial fishing.
We presented some of the data for all of the ports in the tables below; here we examine these on a port by
port basis. Table I.4 draws on the ground-truthing data—or those data from direct observations and
interviews in the 21 communities. Below, table I.5 compares the ground-truthing data with data from
remote sources developed by Jepson and others in their work to meet the criteria of National Standard 8 in
their preparation of fishery management plans and social impact assessments.
Table I.4: Fishing Dependence & Engagement by Port, Interview Data
Port Dependence
on fishing
economically
[Rank]
Commercial
fishing
community
strength
Recreational
fishing
community
strength
Commercial
fishing
economic
health
Recreational
fishing
economic
health
Mean New
Rank
Wanchese 8.29 [1] 8.71 8.57 4.71 6.00 7.26 1
Hatteras Village 7.93 [2] 7.53 8.07 4.00 5.80 6.67 5
Beaufort 6.81 [3] 6.37 8.50 4.44 7.31 6.69 4
Morehead City 6.00 [6] 5.64 8.50 4.14 6.07 6.22 6
Atlantic Beach 5.13 [12] 4.00 7.00 3.73 5.87 5.15 16
Sneads Ferry 6.00 [6] 8.15 7.62 5.08 6.77 6.72 3
Wrightsville 3.33 [19] 2.40 6.53 2.60 5.67 4.11 21
20
Wilmington 5.67 [10] 5.40 7.27 4.60 6.07 5.80 9
Little River 6.40 [4] 6.40 7.33 3.33 4.27 5.55 12
Murrells Inlet 6.27 [5] 7.80 7.67 3.13 4.87 5.95 7
Charleston 6.00 [6] 6.87 8.60 5.27 6.93 6.73 2
Savannah 4.87 [13] 6.20 8.40 3.67 5.60 5.75 11
Brunswick 3.87 [17] 4.47 6.53 3.00 4.20 4.41 20
St. Simons 4.80 [15] 5.73 7.87 3.40 5.33 5.43 13
St. Marys 2.87 [20] 3.27 8.67 2.73 6.20 4.75 19
Fernandina 4.82 [14] 3.94 6.41 3.82 5.35 4.87 18
St. Augustine 5.24 [11] 4.57 7.62 2.81 5.29 5.11 17
Cape Canaveral 4.00 [16] 5.40 7.30 3.70 5.65 5.21 15
Sebastian 5.95 [7] 4.85 7.90 2.90 4.85 5.23 14
Ft. Pierce 5.87 [9] 5.54 8.29 3.25 6.00 5.79 10
Palm Beach 5.91 [8] 5.27 8.59 3.55 5.86 5.84 8
Totals 5.51 5.57 7.79 3.66 5.70 5.65
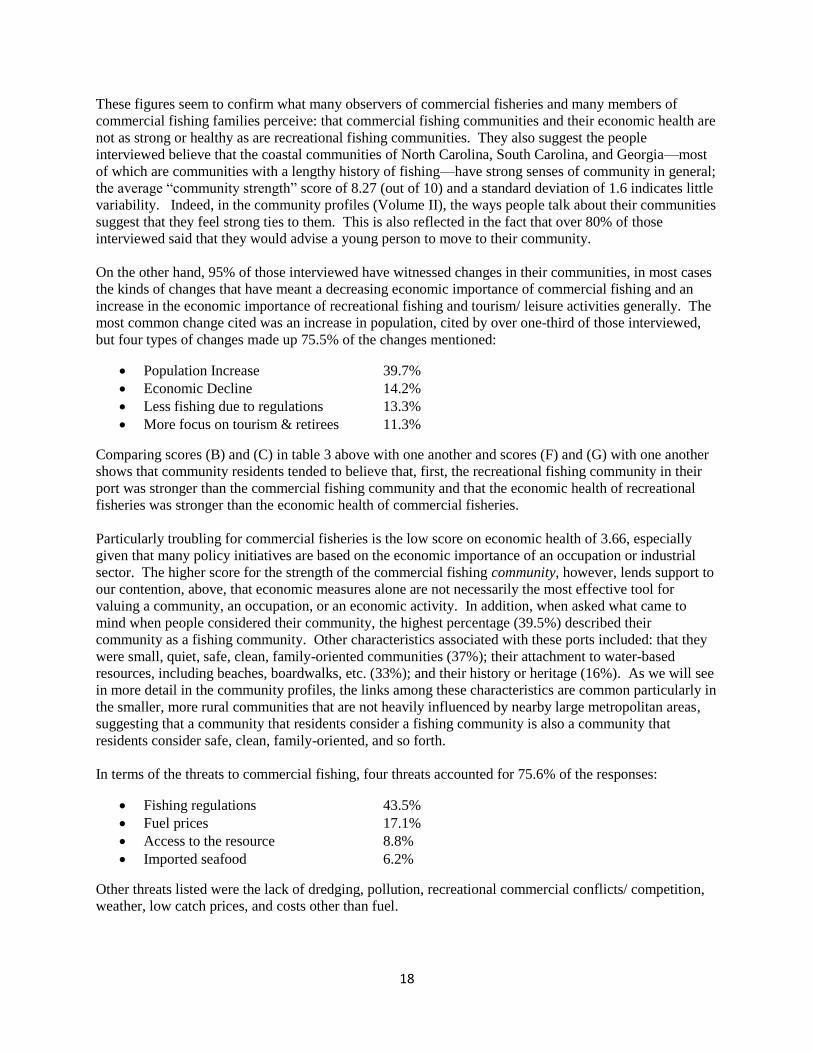
In Table I.4., the “new rank” is based on the average of the five scores, thus combining all the data on
commercial and recreational fishing. Among other things, the new ranks shows that a community highly
dependent on commercial fishing economically, such as Hatteras Village, may be less highly ranked when
both commercial and recreational fishing data are considered together. According to these data,
Wanchese, NC emerges as the community most attached to fishing, with other important fishing locations
being Charleston (ranks 6 & 2), Sneads Ferry (ranks 6 & 3), Beaufort (ranks 3 & 4), and Hatteras Village
(ranks 2 & 5).
Table I.5 lists all the above communities in terms of four indices developed primarily by Michael Jepson,
Steve Jacobs, and a few other social scientists. These are:
1. The Commercial Fishing Reliance Index includes the value of fish landings by the population, the
number of commercial permits by population, the number of dealers with landings by population,
and the percentage of population employed in agriculture, forestry, and fishing. Scores are either
negative or positive based on whether or not they are less then or more than one standard
deviation from the mean.
2. The Recreational Fishing Reliance Index includes recreational charter boat fishing by population,
private recreational fishing by population, and shore recreational fishing by population.
3. The Commercial Fishing Engagement Index includes the total value of landings, total commercial
permits, total number of dealers with landings, and the pounds of landings—all without reference
to the size of the population.
4. The Recreational Fishing Engagement Index includes recreational charter boat fishing pressure
(i.e. fishing trips), private recreational fishing pressure, and shore recreational fishing pressure—
again without reference to the size of the community’s population.
Table I.5: Fishing Dependence & Engagement by Port, Remote Data
Port Dependence on
fishing
economically
[Rank]
Commercial
fishing
reliance
[Rank]
Recreational
fishing reliance
Commercial
fishing
engaged
Recreational
fishing
engaged
Average
Rank**
Wanchese 8.29 [1] 4.020 [1] 0.785 2.117 0.964 5
Hatteras n.d. n.d. n.d. n.a.
Beaufort 6.81 [3] 1.109 [3] 2.511 2.419 2.133 8
Morehead City 6.00 [6] -0.013 [9] 2.447 1.040 2.959 7
Atlantic Beach 5.13 [12] 0.300 [4] 4.476 0.265 4.155 7
Sneads Ferry 6.00 [6] 2.565 [2] 0.478 2.137 0.409 8
Wrightsville 3.33 [18] -0.173 [14] 1.520 -0.061 1.472 9
Wilmington 5.67 [10] -0.206 [16] 1.521 3.215 1.284 10
Little River 6.40 [4] -0.077 [10] 0.226 0.375 0.489 8

21
Murrells Inlet 6.27 [5] 0.103 [6] 1.479 0.685 1.662 6
Charleston 6.00 [6] -0.222 [15] 0.163 1.716 0.265 12
Savannah 4.87 [13] -0.251 [20] 2.534 -0.045 3.515 14
Brunswick 3.87 [17] 0.004 [8] 2.749 1.313 2.368 12
St. Simons 4.80 [15] -0.251 [19] 1.803 0.058 1.679 18
St. Marys 2.87 [19] -0.224 [17] 1.372 0.381 1.206 19
Fernandina 4.82 [14] -0.086 [11] 4.499 0.572 4.414 12
St. Augustine 5.24 [11] 0.084 [7] 7.153 1.769 7.013 8
Cape Canaveral 4.00 [16] -0.137 [13] 2.892 0.455 3.380 13
Sebastian 5.95 [7] -0.225 [18] 1.334 0.293 -0.284 9
Ft. Pierce 5.87 [9] 0.120 [5] 7.203 1.012 6.716 9
Palm Beach 5.91 [8] -0.095 [12] 1.454 -0.099 1.160 13
Totals 5.51
*No remote data were collected for Hatteras Village, which ranked # 2 based on the ground-truthing data. **Measure developed
based on remote data, combining recreational and commercial data.
The figures in Table I.5 are simple to interpret where the higher the score the more resilient or engaged
the community is in commercial or recreational fishing. While the rankings are based on hard data, we
must be careful not to consider the rankings precise measures, like actual counts of vessels or pounds of
fish, but somewhat rough estimates based on a number of data sources, not all of which may be of equal
quality. Indices are susceptible to fault at any point in their construction; the more data sources used to
construct them, the more fallible they tend to be. Yet they are helpful in attempts to measure complex
phenomena that cannot be reduced to mere counts or modeling exercises.
Due to the problems with indices, however, another way to consider these data is to group the ports with
rankings close to one another, as we have done in Table I.6 below:
Table I.6: Ports Grouped by Quartiles from Most to Least Dependent on Fishing
Groups of Ports Ground-Truthing Rank Remote Rank
Group 1: Most Dependent Wanchese
Hatteras Village
Beaufort
Little River
Murrells Inlet
Wanchese
Beaufort
Atlantic Beach
Snead’s Ferry
Ft. Pierce
Group 2: 2nd Most Dependent Morehead City/ Charleston/
Snead’s Ferry*
Sebastian
Palm Beach
Ft. Pierce
Wilmington
Murrells Inlet
St. Augustine
Brunswick
Morehead City
Little River
Group 3: 3rd Most Dependent St. Augustine
Atlantic Beach
Savannah
Fernandina
St. Simons
Fernandina
Palm Beach
Cape Canaveral
Wrightsville Beach
Charleston
Group 4: Least Dependent Cape Canaveral
Brunswick
Wrightsville Beach
St. Mary’s
Wilmington
St. Mary’s
Sebastian
St. Simons
Savannah
*All three communities had the same rank.

22
Again, we see considerable overlap between the two rankings, yet the differences are also interesting.
Based on these figures, of the 21 ports, Wanchese emerges as the highest in terms of reliance on
commercial fishing. Beyond this, although the rankings are not identical, there are other similarities.
Beaufort ranks three in both lists, and North Carolina communities north of Wrightsville Beach—all
except Snead’s Ferry in and around the Albemarle-Pamlico Estuarine System—ranked in the top ten.
Similar rankings were also found for Murrells Inlet, St. Marys, and Cape Canaveral.
Only four to five places separated Snead’s Ferry, Wrightsville Beach, St. Simons, St. Augustine,
Fernandina, Ft. Pierce, and Palm Beach. By contrast, larger discrepancies between the remote and
ground-truthing data were found with regard to Atlantic Beach (group 3 in in the ground-truthing
rankings, 1 in the remote), Wilmington (Group 2 in the ground-truthing data, 4 in the remote), Charleston
(High in group 2 in the ground-truthing rankings, low in Group 3 in the remote), and Sebastian (Group 2
in the ground-truthing, 4 in the remote).
While it is troubling that we found large discrepancies between the ground-truthing and remote data in
four of 21 ports (19%), two of them can be explained, in part, by their size. Remember that the
commercial fishing resilience index is based largely on variables relative to population size. The three
most heavily populated cities in the sample are Wilmington, Charleston, and Savannah—each of which
contains over 200,000 residents, in the midst of which live relatively few fishing families. In all three
cases, the ground-truthing data collection targeted areas within these three metropolitan centers where we
learned substantial fishing activity took place (e.g. marinas, piers, around fish houses, at charter boat
docks, etc.), where local residents were more likely to view fishing as a key part of their local economy—
even if not a major element in the larger metropolitan area. In Wilmington, for example, early on in the
research we were steered toward Carolina Beach, a community that is part of the Wilmington
metropolitan area known for its fishing charters. In this area of Wilmington, where at least ten fishing
charters and a large head boat dock, fishing is, clearly, quite important, which accounts for Wilmington’s
higher rank in the ground-truthing data. The following two photos from Carolina Beach attest to the
importance of fishing there.
Figure I.6: Carolina Beach Fishing Charters Figure I.7: Carolina Beach Bench Sticker
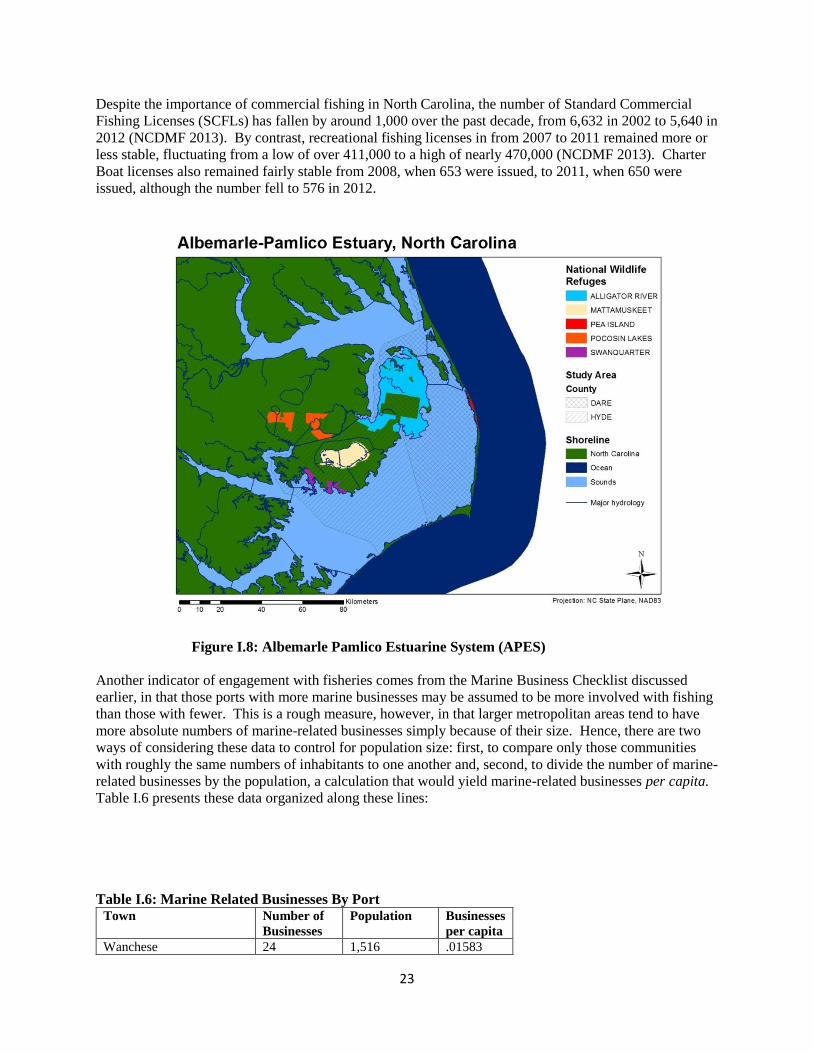
The rankings of fishing communities show the overall importance of fishing in North Carolina in
particular, with five of the eight communities listed falling into the top six ranks. By contrast, none of
Georgia’s communities ranked highly, and Florida’s and South Carolina’s were mixed. The importance
of fishing to North Carolina is understandable in light of its complex coastline, particularly the Albemarle
Pamlico Estuary, which includes three sounds rich in blue crabs, mullet, croaker, spot, and other estuarine
resources, the Outer Banks, and several inlets and ferry channels facilitating marine navigation.
23
Despite the importance of commercial fishing in North Carolina, the number of Standard Commercial
Fishing Licenses (SCFLs) has fallen by around 1,000 over the past decade, from 6,632 in 2002 to 5,640 in
2012 (NCDMF 2013). By contrast, recreational fishing licenses in from 2007 to 2011 remained more or
less stable, fluctuating from a low of over 411,000 to a high of nearly 470,000 (NCDMF 2013). Charter
Boat licenses also remained fairly stable from 2008, when 653 were issued, to 2011, when 650 were
issued, although the number fell to 576 in 2012.
Figure I.8: Albemarle Pamlico Estuarine System (APES)
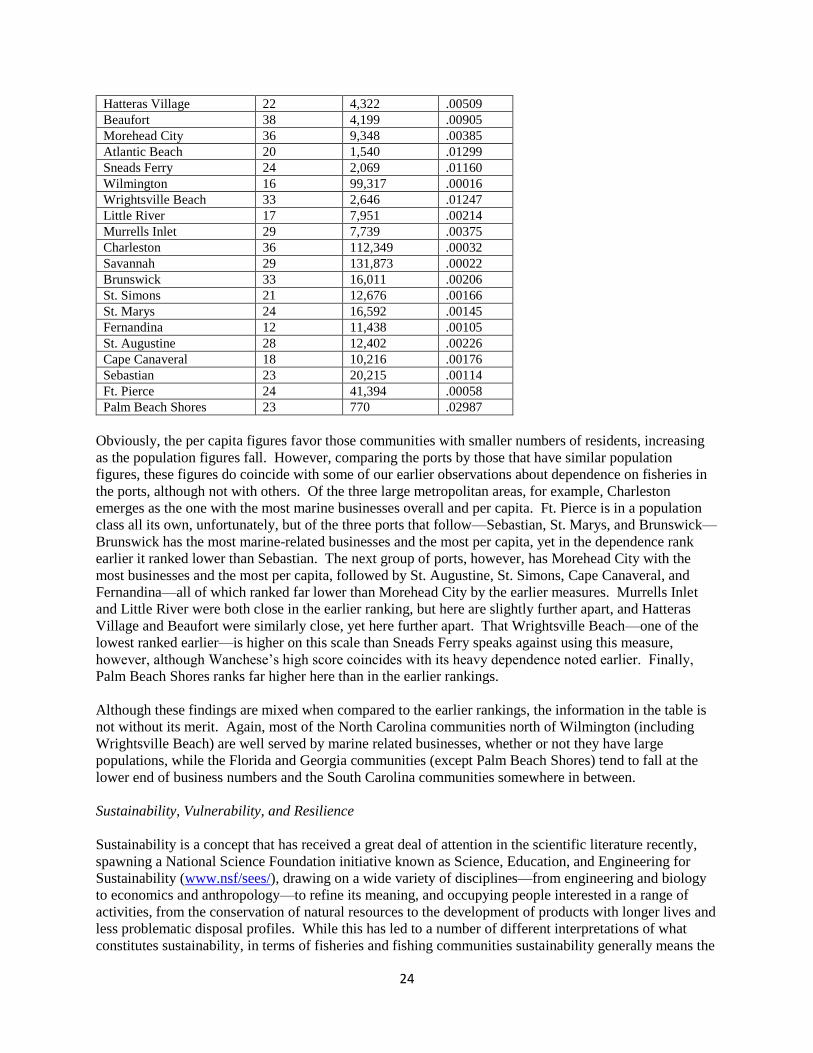
Another indicator of engagement with fisheries comes from the Marine Business Checklist discussed
earlier, in that those ports with more marine businesses may be assumed to be more involved with fishing
than those with fewer. This is a rough measure, however, in that larger metropolitan areas tend to have
more absolute numbers of marine-related businesses simply because of their size. Hence, there are two
ways of considering these data to control for population size: first, to compare only those communities
with roughly the same numbers of inhabitants to one another and, second, to divide the number of marine-
related businesses by the population, a calculation that would yield marine-related businesses per capita.
Table I.6 presents these data organized along these lines:
Table I.6: Marine Related Businesses By Port Town Number of
Businesses
Population Businesses
per capita
Wanchese 24 1,516 .01583
24
Hatteras Village 22 4,322 .00509
Beaufort 38 4,199 .00905
Morehead City 36 9,348 .00385
Atlantic Beach 20 1,540 .01299
Sneads Ferry 24 2,069 .01160
Wilmington 16 99,317 .00016
Wrightsville Beach 33 2,646 .01247
Little River 17 7,951 .00214
Murrells Inlet 29 7,739 .00375
Charleston 36 112,349 .00032
Savannah 29 131,873 .00022
Brunswick 33 16,011 .00206
St. Simons 21 12,676 .00166
St. Marys 24 16,592 .00145
Fernandina 12 11,438 .00105
St. Augustine 28 12,402 .00226
Cape Canaveral 18 10,216 .00176
Sebastian 23 20,215 .00114
Ft. Pierce 24 41,394 .00058
Palm Beach Shores 23 770 .02987
Obviously, the per capita figures favor those communities with smaller numbers of residents, increasing
as the population figures fall. However, comparing the ports by those that have similar population
figures, these figures do coincide with some of our earlier observations about dependence on fisheries in
the ports, although not with others. Of the three large metropolitan areas, for example, Charleston
emerges as the one with the most marine businesses overall and per capita. Ft. Pierce is in a population
class all its own, unfortunately, but of the three ports that follow—Sebastian, St. Marys, and Brunswick—
Brunswick has the most marine-related businesses and the most per capita, yet in the dependence rank
earlier it ranked lower than Sebastian. The next group of ports, however, has Morehead City with the
most businesses and the most per capita, followed by St. Augustine, St. Simons, Cape Canaveral, and
Fernandina—all of which ranked far lower than Morehead City by the earlier measures. Murrells Inlet
and Little River were both close in the earlier ranking, but here are slightly further apart, and Hatteras
Village and Beaufort were similarly close, yet here further apart. That Wrightsville Beach—one of the
lowest ranked earlier—is higher on this scale than Sneads Ferry speaks against using this measure,
however, although Wanchese’s high score coincides with its heavy dependence noted earlier. Finally,
Palm Beach Shores ranks far higher here than in the earlier rankings.
Although these findings are mixed when compared to the earlier rankings, the information in the table is
not without its merit. Again, most of the North Carolina communities north of Wilmington (including
Wrightsville Beach) are well served by marine related businesses, whether or not they have large
populations, while the Florida and Georgia communities (except Palm Beach Shores) tend to fall at the
lower end of business numbers and the South Carolina communities somewhere in between.
Sustainability, Vulnerability, and Resilience
Sustainability is a concept that has received a great deal of attention in the scientific literature recently,
spawning a National Science Foundation initiative known as Science, Education, and Engineering for
Sustainability (www.nsf/sees/), drawing on a wide variety of disciplines—from engineering and biology
to economics and anthropology—to refine its meaning, and occupying people interested in a range of
activities, from the conservation of natural resources to the development of products with longer lives and
less problematic disposal profiles. While this has led to a number of different interpretations of what
constitutes sustainability, in terms of fisheries and fishing communities sustainability generally means the
25
ability to maintain and reproduce fishing livelihoods and fishing activities without jeopardizing fishery
resources. Pauly, et al. (2002), for example, describe a sustainable fishery as one where “fish populations
were naturally protected by having a large part of their distribution outside of the range of fishing
operations.” In the cases they discuss, this occurred where fish populations were exploited by small
numbers of fishers in extreme climates, as in the Arctic, or were “protected” because intervening factors
such as warfare made the seas unsafe for fishing. Regulations on fishing, usually based on fisheries
biology, have been developed to achieve maximum sustainable yields—in other words, to achieve
sustainability in fisheries. Among the more popular current measures to protect fish stocks are habitat-
based management alternatives such as Marine Protected Areas and measures to protect nursery grounds
and other environments conducive to fish stock health.
In terms of fishing communities, sustainability involves more than protecting fish, however much fish
stocks are critical to a fishing community maintaining its identity and its heritage. Sustaining fishing
livelihoods involves continued access to dock space, market infrastructure such as fish houses, and the
ability to target species that can bring ex-vessel prices high enough to cover expenses and pays for the
labor supply to fishing.
The focus on sustainability is often coupled with a consideration of what makes resources or communities
vulnerable to threats to sustainability or resilient against such threats. Thus, in relation to sustainability,
vulnerability and resilience are opposites, and the three concepts are most effectively discussed together.
In this research, we asked people in each port what factors threatened their communities. We listed above
what they considered the principal threats to commercial and recreational fisheries, but we also asked
them what factors would make their communities vulnerable to decline.
From this, we identified several factors that, according to residents, increased their community’s
vulnerability. Across all 345 interviews, we elicited 38 of these vulnerability factors, including such
things as fishing regulations, fuel prices, pollution, rampant development, and the loss of various kinds of
infrastructure (e.g. fishing piers) or natural resources (e.g. beaches through erosion, channels due to lack
of dredging). Once we had this list, we grouped them by more general principles into three groups: 1)
Loss of Use (e.g. closing fishing piers, reduced dredging, more regulations on fishing, a reduction in
activities for tourists, beach erosion, etc.); 2) Development (e.g. growth not sustainable, too many tourists,
new people moving in; old residents leaving, etc.); and 3) Economic Issues (e.g. increased fuel prices, job
losses, higher taxes, etc.). Overall, Loss of Use were was the most common source of vulnerability,
followed by economic issues, and then development problems (see table I.4):
Table I.4: Vulnerability Type Type of Vulnerability Percent
Loss of Use 44.5
Development Problems 20.0
Economic Issues 35.5
Based on these groups, we ran frequency counts on a port by port basis to determine how each
community was liable to be influenced by each category of vulnerability, as well as attempted to see how
different sources of vulnerability were associated with significant changes taking place in the
communities, and how vulnerability was related to fishing dependence. Table I.5 shows how these are
types of vulnerability are distributed across ports.
Table I.5: Vulnerability by Port (multiple responses possible?) Port (N responses) Loss of Use Development Economics
Wanchese (19) 74% 0% 26%
Hatteras (31) 45% 19% 36%
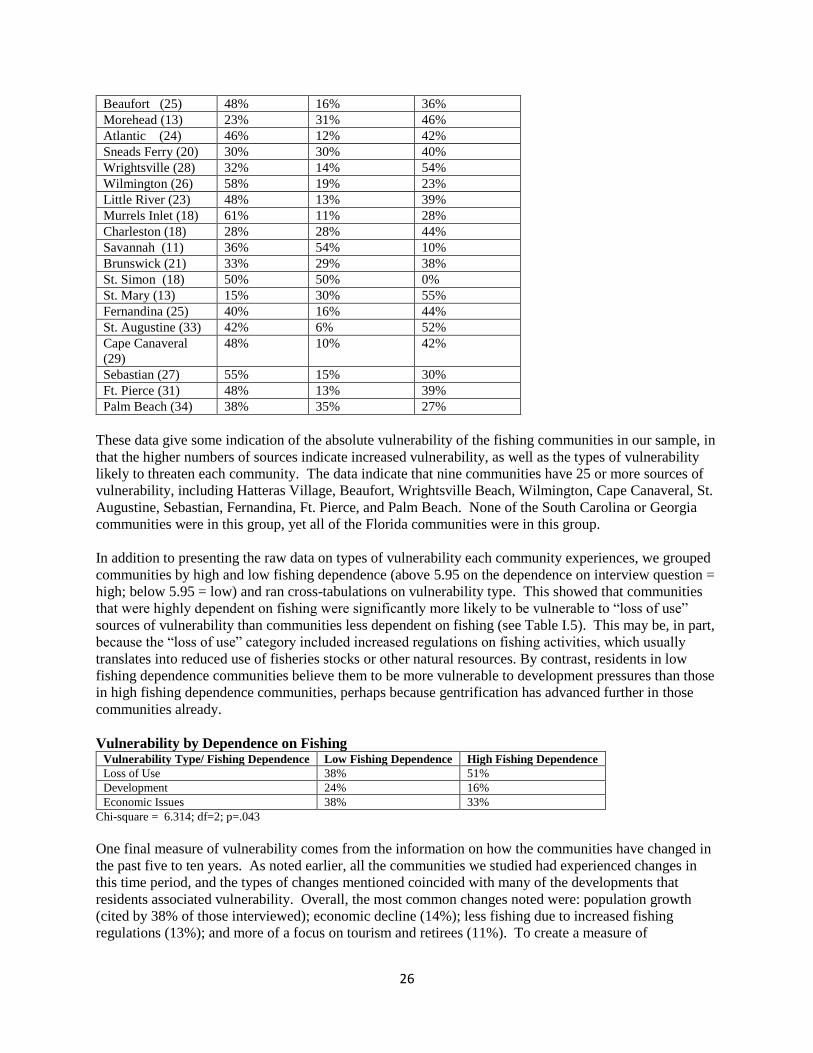
26
Beaufort (25) 48% 16% 36%
Morehead (13) 23% 31% 46%
Atlantic (24) 46% 12% 42%
Sneads Ferry (20) 30% 30% 40%
Wrightsville (28) 32% 14% 54%
Wilmington (26) 58% 19% 23%
Little River (23) 48% 13% 39%
Murrels Inlet (18) 61% 11% 28%
Charleston (18) 28% 28% 44%
Savannah (11) 36% 54% 10%
Brunswick (21) 33% 29% 38%
St. Simon (18) 50% 50% 0%
St. Mary (13) 15% 30% 55%
Fernandina (25) 40% 16% 44%
St. Augustine (33) 42% 6% 52%
Cape Canaveral
(29)
48% 10% 42%
Sebastian (27) 55% 15% 30%
Ft. Pierce (31) 48% 13% 39%
Palm Beach (34) 38% 35% 27%
These data give some indication of the absolute vulnerability of the fishing communities in our sample, in
that the higher numbers of sources indicate increased vulnerability, as well as the types of vulnerability
likely to threaten each community. The data indicate that nine communities have 25 or more sources of
vulnerability, including Hatteras Village, Beaufort, Wrightsville Beach, Wilmington, Cape Canaveral, St.
Augustine, Sebastian, Fernandina, Ft. Pierce, and Palm Beach. None of the South Carolina or Georgia
communities were in this group, yet all of the Florida communities were in this group.
In addition to presenting the raw data on types of vulnerability each community experiences, we grouped
communities by high and low fishing dependence (above 5.95 on the dependence on interview question =
high; below 5.95 = low) and ran cross-tabulations on vulnerability type. This showed that communities
that were highly dependent on fishing were significantly more likely to be vulnerable to “loss of use”
sources of vulnerability than communities less dependent on fishing (see Table I.5). This may be, in part,
because the “loss of use” category included increased regulations on fishing activities, which usually
translates into reduced use of fisheries stocks or other natural resources. By contrast, residents in low
fishing dependence communities believe them to be more vulnerable to development pressures than those
in high fishing dependence communities, perhaps because gentrification has advanced further in those
communities already.
Vulnerability by Dependence on Fishing Vulnerability Type/ Fishing Dependence Low Fishing Dependence High Fishing Dependence
Loss of Use 38% 51%
Development 24% 16%
Economic Issues 38% 33%
Chi-square = 6.314; df=2; p=.043
One final measure of vulnerability comes from the information on how the communities have changed in
the past five to ten years. As noted earlier, all the communities we studied had experienced changes in
this time period, and the types of changes mentioned coincided with many of the developments that
residents associated vulnerability. Overall, the most common changes noted were: population growth
(cited by 38% of those interviewed); economic decline (14%); less fishing due to increased fishing
regulations (13%); and more of a focus on tourism and retirees (11%). To create a measure of
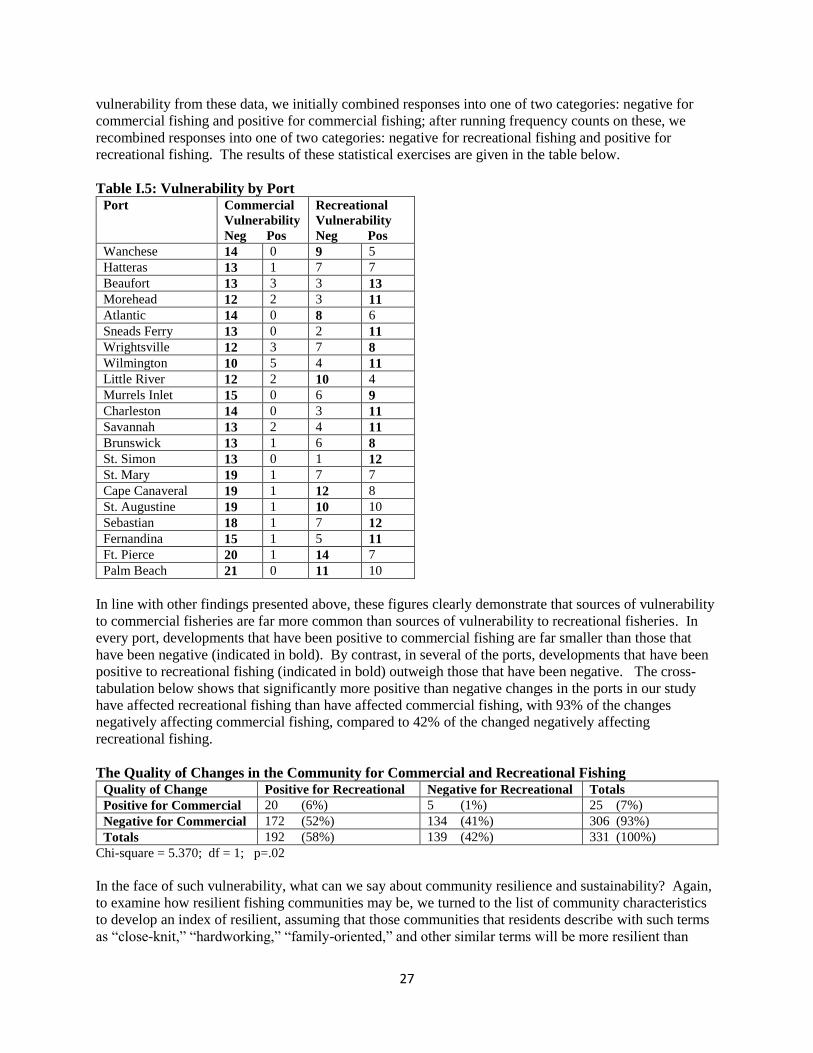
27
vulnerability from these data, we initially combined responses into one of two categories: negative for
commercial fishing and positive for commercial fishing; after running frequency counts on these, we
recombined responses into one of two categories: negative for recreational fishing and positive for
recreational fishing. The results of these statistical exercises are given in the table below.
Table I.5: Vulnerability by Port Port Commercial
Vulnerability
Neg Pos
Recreational
Vulnerability
Neg Pos
Wanchese 14 0 9 5
Hatteras 13 1 7 7
Beaufort 13 3 3 13
Morehead 12 2 3 11
Atlantic 14 0 8 6
Sneads Ferry 13 0 2 11
Wrightsville 12 3 7 8
Wilmington 10 5 4 11
Little River 12 2 10 4
Murrels Inlet 15 0 6 9
Charleston 14 0 3 11
Savannah 13 2 4 11
Brunswick 13 1 6 8
St. Simon 13 0 1 12
St. Mary 19 1 7 7
Cape Canaveral 19 1 12 8
St. Augustine 19 1 10 10
Sebastian 18 1 7 12
Fernandina 15 1 5 11
Ft. Pierce 20 1 14 7
Palm Beach 21 0 11 10
In line with other findings presented above, these figures clearly demonstrate that sources of vulnerability
to commercial fisheries are far more common than sources of vulnerability to recreational fisheries. In
every port, developments that have been positive to commercial fishing are far smaller than those that
have been negative (indicated in bold). By contrast, in several of the ports, developments that have been
positive to recreational fishing (indicated in bold) outweigh those that have been negative. The cross-
tabulation below shows that significantly more positive than negative changes in the ports in our study
have affected recreational fishing than have affected commercial fishing, with 93% of the changes
negatively affecting commercial fishing, compared to 42% of the changed negatively affecting
recreational fishing.
The Quality of Changes in the Community for Commercial and Recreational Fishing Quality of Change Positive for Recreational Negative for Recreational Totals
Positive for Commercial 20 (6%) 5 (1%) 25 (7%)
Negative for Commercial 172 (52%) 134 (41%) 306 (93%)
Totals 192 (58%) 139 (42%) 331 (100%)
Chi-square = 5.370; df = 1; p=.02
In the face of such vulnerability, what can we say about community resilience and sustainability? Again,
to examine how resilient fishing communities may be, we turned to the list of community characteristics
to develop an index of resilient, assuming that those communities that residents describe with such terms
as “close-knit,” “hardworking,” “family-oriented,” and other similar terms will be more resilient than
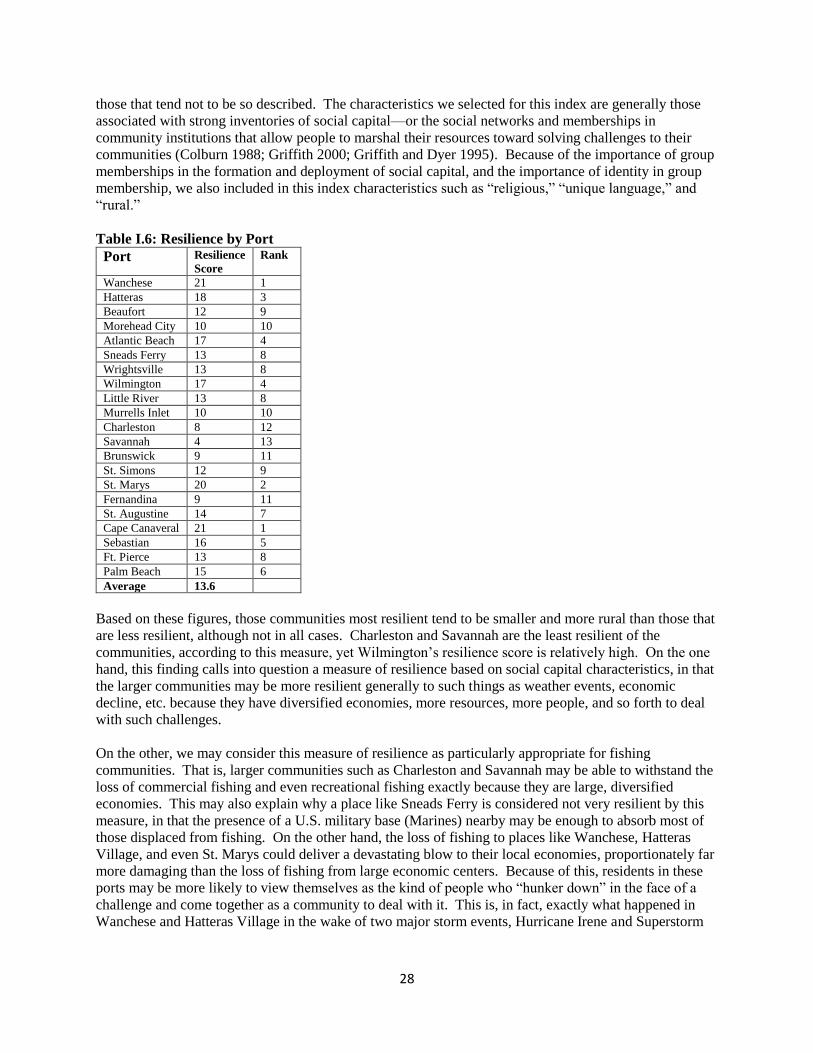
28
those that tend not to be so described. The characteristics we selected for this index are generally those
associated with strong inventories of social capital—or the social networks and memberships in
community institutions that allow people to marshal their resources toward solving challenges to their
communities (Colburn 1988; Griffith 2000; Griffith and Dyer 1995). Because of the importance of group
memberships in the formation and deployment of social capital, and the importance of identity in group
membership, we also included in this index characteristics such as “religious,” “unique language,” and
“rural.”
Table I.6: Resilience by Port
Port Resilience
Score
Rank
Wanchese 21 1
Hatteras 18 3
Beaufort 12 9
Morehead City 10 10
Atlantic Beach 17 4
Sneads Ferry 13 8
Wrightsville 13 8
Wilmington 17 4
Little River 13 8
Murrells Inlet 10 10
Charleston 8 12
Savannah 4 13
Brunswick 9 11
St. Simons 12 9
St. Marys 20 2
Fernandina 9 11
St. Augustine 14 7
Cape Canaveral 21 1
Sebastian 16 5
Ft. Pierce 13 8
Palm Beach 15 6
Average 13.6
Based on these figures, those communities most resilient tend to be smaller and more rural than those that
are less resilient, although not in all cases. Charleston and Savannah are the least resilient of the
communities, according to this measure, yet Wilmington’s resilience score is relatively high. On the one
hand, this finding calls into question a measure of resilience based on social capital characteristics, in that
the larger communities may be more resilient generally to such things as weather events, economic
decline, etc. because they have diversified economies, more resources, more people, and so forth to deal
with such challenges.
On the other, we may consider this measure of resilience as particularly appropriate for fishing
communities. That is, larger communities such as Charleston and Savannah may be able to withstand the
loss of commercial fishing and even recreational fishing exactly because they are large, diversified
economies. This may also explain why a place like Sneads Ferry is considered not very resilient by this
measure, in that the presence of a U.S. military base (Marines) nearby may be enough to absorb most of
those displaced from fishing. On the other hand, the loss of fishing to places like Wanchese, Hatteras
Village, and even St. Marys could deliver a devastating blow to their local economies, proportionately far
more damaging than the loss of fishing from large economic centers. Because of this, residents in these
ports may be more likely to view themselves as the kind of people who “hunker down” in the face of a
challenge and come together as a community to deal with it. This is, in fact, exactly what happened in
Wanchese and Hatteras Village in the wake of two major storm events, Hurricane Irene and Superstorm
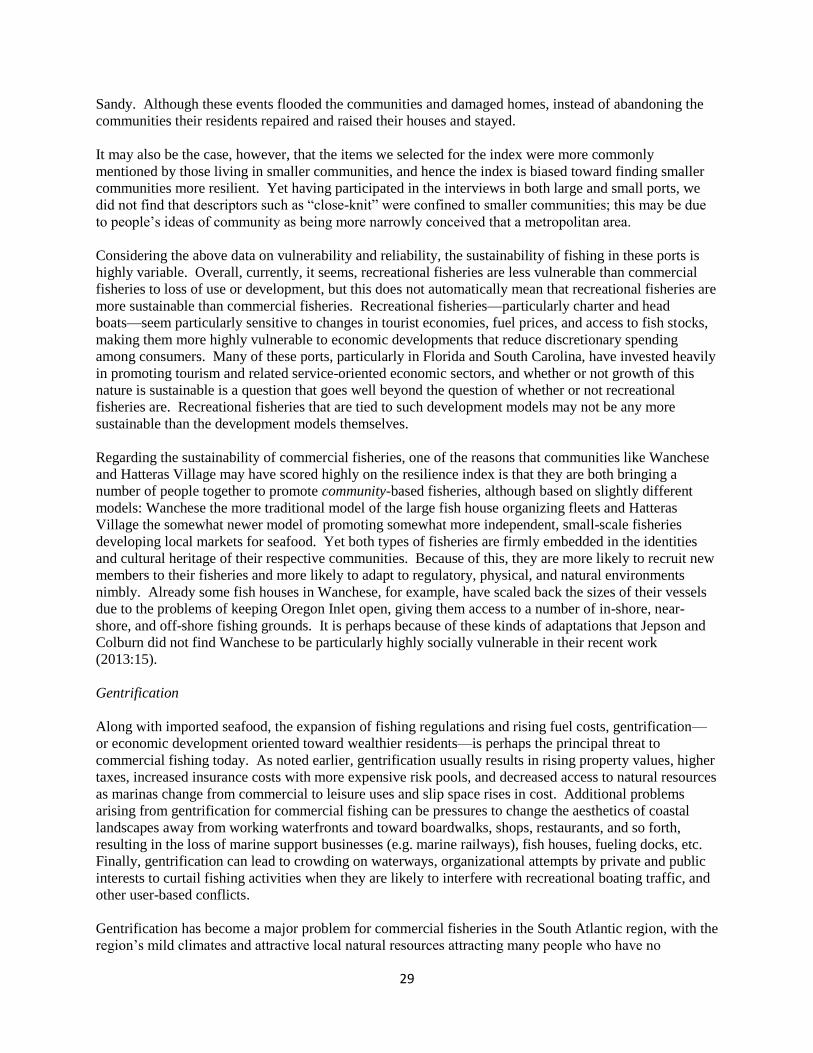
29
Sandy. Although these events flooded the communities and damaged homes, instead of abandoning the
communities their residents repaired and raised their houses and stayed.
It may also be the case, however, that the items we selected for the index were more commonly
mentioned by those living in smaller communities, and hence the index is biased toward finding smaller
communities more resilient. Yet having participated in the interviews in both large and small ports, we
did not find that descriptors such as “close-knit” were confined to smaller communities; this may be due
to people’s ideas of community as being more narrowly conceived that a metropolitan area.
Considering the above data on vulnerability and reliability, the sustainability of fishing in these ports is
highly variable. Overall, currently, it seems, recreational fisheries are less vulnerable than commercial
fisheries to loss of use or development, but this does not automatically mean that recreational fisheries are
more sustainable than commercial fisheries. Recreational fisheries—particularly charter and head
boats—seem particularly sensitive to changes in tourist economies, fuel prices, and access to fish stocks,
making them more highly vulnerable to economic developments that reduce discretionary spending
among consumers. Many of these ports, particularly in Florida and South Carolina, have invested heavily
in promoting tourism and related service-oriented economic sectors, and whether or not growth of this
nature is sustainable is a question that goes well beyond the question of whether or not recreational
fisheries are. Recreational fisheries that are tied to such development models may not be any more
sustainable than the development models themselves.
Regarding the sustainability of commercial fisheries, one of the reasons that communities like Wanchese
and Hatteras Village may have scored highly on the resilience index is that they are both bringing a
number of people together to promote community-based fisheries, although based on slightly different
models: Wanchese the more traditional model of the large fish house organizing fleets and Hatteras
Village the somewhat newer model of promoting somewhat more independent, small-scale fisheries
developing local markets for seafood. Yet both types of fisheries are firmly embedded in the identities
and cultural heritage of their respective communities. Because of this, they are more likely to recruit new
members to their fisheries and more likely to adapt to regulatory, physical, and natural environments
nimbly. Already some fish houses in Wanchese, for example, have scaled back the sizes of their vessels
due to the problems of keeping Oregon Inlet open, giving them access to a number of in-shore, near-
shore, and off-shore fishing grounds. It is perhaps because of these kinds of adaptations that Jepson and
Colburn did not find Wanchese to be particularly highly socially vulnerable in their recent work
(2013:15).
Gentrification
Along with imported seafood, the expansion of fishing regulations and rising fuel costs, gentrification—
or economic development oriented toward wealthier residents—is perhaps the principal threat to
commercial fishing today. As noted earlier, gentrification usually results in rising property values, higher
taxes, increased insurance costs with more expensive risk pools, and decreased access to natural resources
as marinas change from commercial to leisure uses and slip space rises in cost. Additional problems
arising from gentrification for commercial fishing can be pressures to change the aesthetics of coastal
landscapes away from working waterfronts and toward boardwalks, shops, restaurants, and so forth,
resulting in the loss of marine support businesses (e.g. marine railways), fish houses, fueling docks, etc.
Finally, gentrification can lead to crowding on waterways, organizational attempts by private and public
interests to curtail fishing activities when they are likely to interfere with recreational boating traffic, and
other user-based conflicts.
Gentrification has become a major problem for commercial fisheries in the South Atlantic region, with the
region’s mild climates and attractive local natural resources attracting many people who have no
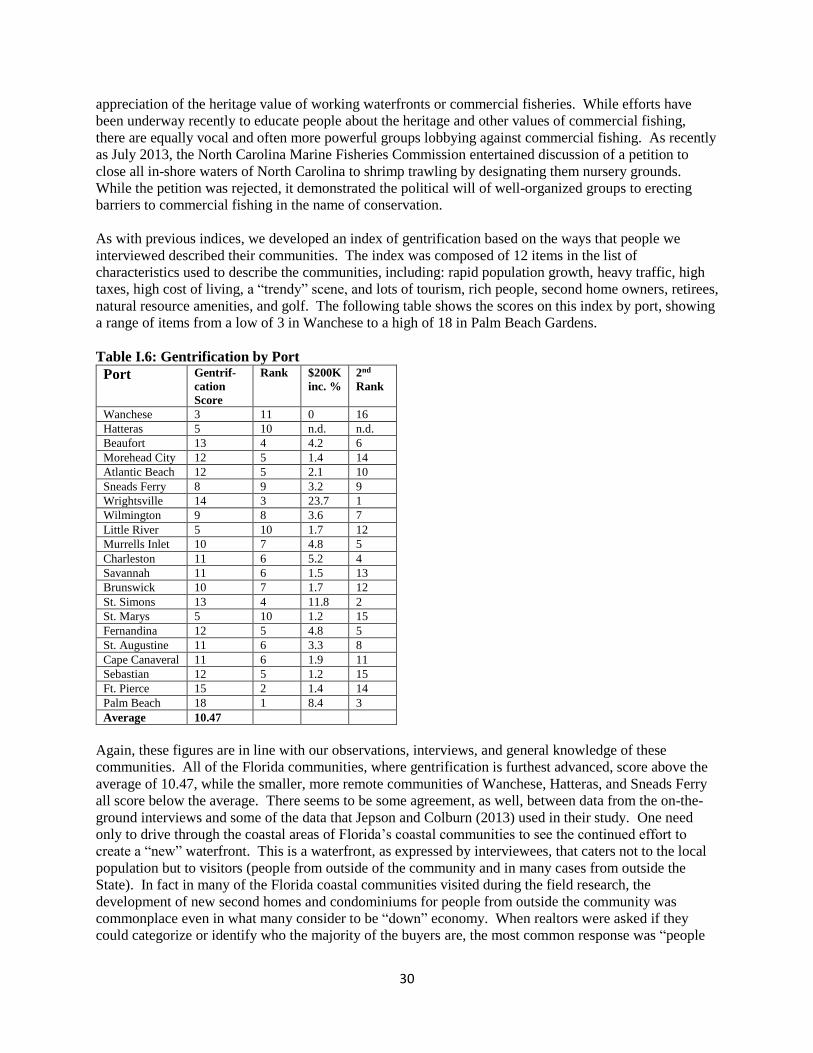
30
appreciation of the heritage value of working waterfronts or commercial fisheries. While efforts have
been underway recently to educate people about the heritage and other values of commercial fishing,
there are equally vocal and often more powerful groups lobbying against commercial fishing. As recently
as July 2013, the North Carolina Marine Fisheries Commission entertained discussion of a petition to
close all in-shore waters of North Carolina to shrimp trawling by designating them nursery grounds.
While the petition was rejected, it demonstrated the political will of well-organized groups to erecting
barriers to commercial fishing in the name of conservation.
As with previous indices, we developed an index of gentrification based on the ways that people we
interviewed described their communities. The index was composed of 12 items in the list of
characteristics used to describe the communities, including: rapid population growth, heavy traffic, high
taxes, high cost of living, a “trendy” scene, and lots of tourism, rich people, second home owners, retirees,
natural resource amenities, and golf. The following table shows the scores on this index by port, showing
a range of items from a low of 3 in Wanchese to a high of 18 in Palm Beach Gardens.
Table I.6: Gentrification by Port
Port Gentrif-
cation
Score
Rank $200K
inc. %
2nd
Rank
Wanchese 3 11 0 16
Hatteras 5 10 n.d. n.d.
Beaufort 13 4 4.2 6
Morehead City 12 5 1.4 14
Atlantic Beach 12 5 2.1 10
Sneads Ferry 8 9 3.2 9
Wrightsville 14 3 23.7 1
Wilmington 9 8 3.6 7
Little River 5 10 1.7 12
Murrells Inlet 10 7 4.8 5
Charleston 11 6 5.2 4
Savannah 11 6 1.5 13
Brunswick 10 7 1.7 12
St. Simons 13 4 11.8 2
St. Marys 5 10 1.2 15
Fernandina 12 5 4.8 5
St. Augustine 11 6 3.3 8
Cape Canaveral 11 6 1.9 11
Sebastian 12 5 1.2 15
Ft. Pierce 15 2 1.4 14
Palm Beach 18 1 8.4 3
Average 10.47
Again, these figures are in line with our observations, interviews, and general knowledge of these
communities. All of the Florida communities, where gentrification is furthest advanced, score above the
average of 10.47, while the smaller, more remote communities of Wanchese, Hatteras, and Sneads Ferry
all score below the average. There seems to be some agreement, as well, between data from the on-the-
ground interviews and some of the data that Jepson and Colburn (2013) used in their study. One need
only to drive through the coastal areas of Florida’s coastal communities to see the continued effort to
create a “new” waterfront. This is a waterfront, as expressed by interviewees, that caters not to the local
population but to visitors (people from outside of the community and in many cases from outside the
State). In fact in many of the Florida coastal communities visited during the field research, the
development of new second homes and condominiums for people from outside the community was
commonplace even in what many consider to be “down” economy. When realtors were asked if they
could categorize or identify who the majority of the buyers are, the most common response was “people

31
coming in from out of town either retiring or looking for a second home.” The other common response
was that people were taking advantage of the low housing costs and buying properties to rent as a part of
a supplemental income, but that even many of these people are from “somewhere else.”
For the sake of comparison, we took one variable from the data provided in the remote data base—
percentage of households with incomes of over $200,000 per year—and ranked the communities from
most to least gentrified based on this one variable. The comparisons show that the rankings from the two
measures are quite similar. The least gentrified in the group is Wanchese, and Palm Beach ranked as one
of the most, with only two places between the two rankings. Wrightsville Beach, number one in the
$200K ranking, is number 3 in the ground-truthing ranking. Murrells Inlet, Little River, St. Augustine,
St. Simons, Charleston, Fernandina, Beaufort, and Wilmington were close as well. With the exception of
Palm Beach, however, the Florida communities do not seem so highly gentrified in the second ranking as
they emerge in the first. Of course, this is only one variable and not an index. It may also not be the best
variable to use in a place like Florida, where many people may not report their income because their
homes there are second homes, or where many of the retired have low annual incomes but are actually
quite wealthy.
Conclusions
Based on the comparative analysis above, it appears that the relationship between the ground-truthed data
and the indices developed from remote data bases correspond to one another—roughly in some cases,
more precisely in others—with the former more appropriate to representing the fisheries embedded in
large metropolitan centers and the latter most suited to fisheries based in smaller communities. This
variation derives from both the ways that social indicators were developed and the nature of South
Atlantic fishing communities. Using U.S. census and other data bases not explicitly developed to track
fisheries runs the risk of including data in the indices that have nothing to do with commercial or
recreational fishing. In the occupational data, for example, fishing is counted together with agriculture
and forestry, seafood processing workers with light manufacturing workers, and marine suppliers with
service workers. Such groupings make it difficult to gauge the true proportion of a working population
that fisheries employ, particularly in regions like large, sprawling metropolitan centers, where economies
are highly diversified.
A further complicating factor is that many South Atlantic fishing communities are dispersed rather than
concentrated, with fishing families’ households tucked into neighborhoods with others engaged in other
occupational unrelated to fishing. This makes it difficult to rely on census data at the zip code level to
estimate fishing dependence and engagement (e.g. Jacob, et al. 2002). Finding themselves isolated from
occupational communities has been the fate of working people around the world. With mill towns largely
artifacts, occupational communities have been restricted primarily to occupations dependent on specific
local natural resources: fishing, farming, forestry, mining, gathering (e.g. mushrooms, palmetto seeds, and
medicinal plants), etc. For this reason many of the studies of community dependence have been done in
regions where reliance on natural resources has a long history (e.g. Donahue and Haynes 2002).
Fishery dependent communities are somewhat different than, say, forestry-dependent or farming-
dependent communities, however, in that fishery resources may be less renewable than either forests or
agricultural resources. This is due to several of the intrinsic characteristics of fisheries, including their
status as common property resources, their susceptibility to developments beyond the control of those
who rely on them (e.g. destruction of wetlands or weather-related events), their entanglement in multiple
policy issues—from environmental concerns about sea turtles to user conflicts to regulations governing
catch shares and marine protected areas—and the vulnerability of some slow-maturing species to
overfishing (e.g. members of the snapper-grouper complex). Historically, natural resources associated
32
with such risk profiles have spawned a wide variety of social relationships oriented toward taking
advantage of the resource. During the 17th century North America trade in furs, for example, beaver furs
were considered a diminishing natural resource, discouraging direct investment in their trapping and
processing and allowing fur trappers and processors relative independence in their pursuit and handling of
beavers (Wolf 1982). This led to a diversity of beaver trapper-processors, with mostly Native American
groups exploiting the resource to trade for European goods, operating according to diverse political
economic principles unique to their tribal histories.
Similarly, the history of South Atlantic fisheries, considered too risky for many, has produced a diversity
of people, firms, families, and communities involved in utilizing fisheries and marine resource. Thus they
are utilized by recreational fishermen as a kind of leisure activity, by fishermen who rely on them as a
stable source of food, by aquariums for aesthetically pleasing exhibits, and by the highly diverse
commercial fishing families and fishing fleets up and down the South Atlantic coast: fleets with hired
captains and crews fishing for fish houses who are paid wages; fleets with captains and crews who fish for
shares; individual family fishers who fish alone or with one or two other family members, sharing the
catch; small-scale, community-based fishing families; professional, for-hire charter boat fleets and party
boats; etc. These different types of fishing operations are also differentiated by whether they are part-
time, seasonal, full-time, or year-round; by whether or not they handle their own seafood marketing; by
their relationships to fishery management; and so forth.
This diversity of social relations makes it difficult to disentangle fishing from the multiple personal and
institutional networks in which they operate. This may be one of the reasons that remote data sources fall
short of capturing conditions on the ground in some fishing communities; clearly, both the ground-
truthing and the remote analysis have advantages and drawbacks, with the former suffering from small
sample sizes and the latter from a lack of direct observations that might aid with the interpretation of the
data. The above comparative analysis, however, demonstrated that the remote data sources and the
ground-truthing came to similar conclusions in over two-thirds of the ports studied. Hence, the analysis
recommends a hybrid approach, combining both low-cost, rapid assessment using secondary sources with
focused interviewing and rapid ethnographic assessment procedures (REAP).
These techniques, moreover, could take advantage of the connections that span regions among different
segments of the fisheries and different communities can assist in monitoring changes in fishing
communities. We noted earlier that seafood promotion campaigns known as “catch” programs have
brought together fishing families with others interested in preserving community-based fisheries; these, in
turn, have spawned Community Supported Fisheries (CSFs). In CSFs, consumers purchase shares in
fishing operations and receive fresh fish regularly, increasing connections between community-based
fisheries and the wider public while also exposing consumers to a wider range of seafood than they would
normally experience. Here we mention such programs for their potential to serve as windows into fishing
communities.
CFSs and Catch programs are not alone in stimulating interregional connections. Other examples are
seafood alliances and initiatives to promote heritage (e.g. www.saltwaterconnections.org) and protect the
privilege of access to marine resources. In these settings are often individuals who know multiple
fisheries and could easily characterize the problems and challenges that fishing families and communities
face. They could, that is, relate developments that influence dependence, engagement, vulnerability,
resilience, and sustainability. Such individuals could be recruited much in the same way that, now,
NOAA fisheries recruits fishermen to observe fishing practices or to monitor marine resources. Once
recruited, such individuals could be trained in REAP and assist in the monitoring of fishing communities,
creating a cadre of citizen social scientists who could provide information to NOAA fisheries on a regular
basis. Through such an effort, the mandate of National Standard 8 could be met.

33
34
References
Acheson, James. 1987. The Lobster Gangs of Maine. Amherst, MA: University of New England Press.
Ballance, Alton. 1989. Ocracokers. Chapel Hill: University of North Carolina Press.
Beal, Candy and Carmine Prioli. 2002. Life at the Edge of the Sea: Essays on North Carolina’s Coast
and Coastal Culture. Wilmington, NC: Coastal Carolina Press.
Blount, Ben. 2006. Factors Affecting Participation in Marine Fisheries: Case Studies in Georgia and
North Carolina. Final report to NOAA.
Cecelski, David. The Waterman’s Song: Slavery and Freedom in Maritime North Carolina. Chapel Hill:
University of North Carolina Press.
Cutter, Susan, J. Byron, and W. Shirley. 2003. Social Vulnerability to Environmental Hazards. Social
Science Quarterly 84(2):242-261.
Doeringer, Peter, Philip Moss, and David Terkla. 1987. The New England Fishing Economy: Jobs,
Income, and Kinship. Amherst, MA: The University of Massachusetts Press.
Donahue, Ellen and Richard Haynes. 2002. Assessing the viability and adaptability of Oregon
communities. Portland, OR: US Department of Agriculture, Forest Service, Pacific Northwest Research
Station.
Durrenberger, E. Paul and Thomas King. 2000. State and Community in Fisheries Management: Power,
Policy, and Practice. Westport, CN: Bergin & Garvey.
Earll, R. Edward. 1887. The Fisheries of North Carolina. In The Fisheries and Fishery Industries of the
United States. US Commission of Fish and Fisheries. Washington, DC: US Government Printing Office.
Garrity-Blake, Barbara. 1994. The Fish Factory. Knoxville: University of Tennessee Press.
Garrity-Blake, Barbara and Barry Nash. 2012. An Inventory of North Carolina Fish Houses. May
Manuscript to be published by the UNC Sea Grant College Program, Raleigh, NC.
Goode, George Brown. 1887. The Fisheries and Fishing Industries of the United States. Washington,
DC: US Commission of Fish and Fisheries.
Griffith, David. 2006. American Guestworkers. University Park, PA: Penn State University Press.
Griffith, David. 1999. The Estuary’s Gift: A Cultural Biography of the Mid-Atlantic Coast. University
Park, PA: Penn State University Press.
Griffith, David, Manuel Valdes Pizzini, and Carlos Garcia Quijano. 2007. Entangled Communities:
Profiles of the Fisheries of Puerto Rico. NOAA Fisheries.
Holm, Mary Ann. 1999. Faunal Analysis. In Archaeological Excavatoins at Hammocks Beach West. I.
R. Daniel (e.d). Raleigh: North Carolina Division of Parks and Recreation.

35
Jacob, Steven, Michael Jepson, Carlton Pomeroy, David Mulkey, Chuck Adams, and Suzanna Smith.
2002. Indentifying Fising-Dependent Communities: Development and Confirmation of a Protocol.
Gainsville, FL: University of Florida Department of Family, Youth, and Community Services (MARFIN
resport prepared for the NOAA Fisheries Southeast Regional Office).
Jacob, Steven, Patricia Weeks, Ben Blount, and Mike Jepson. 2012. Development and Evaluation of
Social Indicators of Vulnerability and Resiliency for Fishing Communities in the Gulf of Mexico. Marine
Policy 26(10):16-22.
Jepson, Michael and Lisa Colburn. 2013. Development of Social Indicators of Fishing Community
Vulnerability and Resilience in the U.S. Southeast and Northeast Regions. US Department of Commerce:
NOAA Technical Memorandum NMFS-F/SPO-129.
Jepson, Michael, Kathi Kitner, Ana Pitchon, Wendy Wicke Perry, and Brent Stoffle. 2003. Potential
Fishing Communities in the Carolinas, Georgia, and Florida: An effort in baseline profiling and mapping.
Charleston, SC: South Atlantic Fishery Management Council.
Massey, Douglas. 2008. New Faces in New Places. New York: Russell Sage Foundation.
Maiolo, John. 2004. Hard Times and a Nickel a Bucket. Chapel Hill, NC: Chapel Hill Press, Inc.
North Carolina Division of Marine Fisheries (NCDMF). 2013. Summary Statistics of the Licensing
Program, North Carolina. Morehead City: NCDMF.
Menzies, Charles. 2001. Traditional Ecological Knowledge and Natural Resource Management.
Lincoln: University Press of Nebraska.
Pollnac, Richard, S. Abbott-Jamieson, C. Smith, M.L. Miller, PM Clay, and B Oles. 2006. Toward a
Model for Fisheries Social Impact Assessment. Marine Fisheries Review 68:1-18.
Riggs, Stanley, D. Ames, S. Culver, and David Mallison. 2011. The Battle for North Carolina’s Coast.
Chapel Hill: University of North Carolina Press.
Sen, Amartya, Joseph Stiglitz, and Jean-Paul Fitoussi. 2012. Mismeasuring Our Lives: Why GDP
Doesn’t Add Up. New York: The New Press.
Stick, David. 1958. The Outer Banks of North Carolina. Chapel Hill: University of North Carolina
Press.
West, Susan and Barbara Garrity-Blake. 2003. Fish House Opera. Mystic, CT: Mystic Seaport Press.
Zuñiga, Victor and Ruben Hernandez Leon. 2005. New Destinations. New York: Russell Sage
Foundation.