Ground Penetrating Radar: A Useful Tool for Shallow ...
28
3 Ground Penetrating Radar: A Useful Tool for Shallow Subsurface Stratigraphy Characterization Giovanni Leucci Institute for Archaeological and Monumental Heritage, National Council of Research – (CNR-IBAM), Italy 1. Introduction In a region such as the Salento, constituted by a flat surface with greatly expanded coverage of agricultural land, the studies performed on the stratigraphical evolution of different lithological units in the first meters of the soil has been based upon the analysis of cut – faces, quarries, cores and shallow trenches (Bossio et al., 1987; Bossio et al., 1992; Bossio et al., 1994; Bossio et al., 1998; Bossio et al., 1999; Ciaranfi et al., 1992; D’Alessandro, et al., 1994; Margiotta, 1999; Margiotta and Ricchetti, 2002; Palmentola, 1987). Data provided by such techniques are often one- or two-dimensional. They involve surveys that are time consuming and are patchy in terms of spatial coverage. Therefore the possibilities offered by the GPR to investigate the subsoil in a non-invasively way, and to obtain 3D maps of the subsurface itself, becomes of crucial importance for geologists. The successful obtained by GPR investigations on sedimentary rock stratigraphy is well documented in literature (Annan and Davis, 1989; van Overmeeren, 1998; Mills and Speece, 1997; Mokma et al., 1990; Nobes et al., 2001; Lapen et al., 1996; Baker, 1991; Beres, et al., 1995; Leucci et al., 2000; Carrozzo et al., 2000; Carrozzo et al., 2003). Since GPR holds enormous potential for such studies, it is appropriate to assess some key considerations for, i) field data acquisition, ii) raw data processing in order to enhance data display, iii) EM wave velocity measurements in order to characterize sediments response and to perform the time to depth conversion, iv) lithological interpretation of the GPR data set. This chapter attempts to give the steps required to acquired, process and interpret GPR data in a sedimentary rock environment. GPR data were acquired in the Salento peninsula in two areas located near the city of Lecce, Italy (Fig. 1). During last years lagoonal – continental and marine oligo-miocene deposits have been recognized in some areas of Salento leccese. Del Prete & Santagati (1972) described lagoonal – continental sediment underlying the well-known miocenic formation of Pietra leccese cropping out the “ Vito Fazzi” hospital of Lecce. They referred this lagoonal deposit to Tortoniano (Miocene). Later, other important outcrops of these deposits were recognized near S. Maria al Bagno (Nardò, Lecce) by Bossio et al. (1992) and near Galatone (Lecce) by Colella (1994), respectively along the roadside of the Gallipoli – Lecce highway and along a www.intechopen.com
Transcript of Ground Penetrating Radar: A Useful Tool for Shallow ...
3
Ground Penetrating Radar: A Useful Tool for Shallow Subsurface
Stratigraphy Characterization
Giovanni Leucci Institute for Archaeological and Monumental Heritage,
National Council of Research – (CNR-IBAM), Italy
1. Introduction
In a region such as the Salento, constituted by a flat surface with greatly expanded coverage of agricultural land, the studies performed on the stratigraphical evolution of different lithological units in the first meters of the soil has been based upon the analysis of cut – faces, quarries, cores and shallow trenches (Bossio et al., 1987; Bossio et al., 1992; Bossio et al., 1994; Bossio et al., 1998; Bossio et al., 1999; Ciaranfi et al., 1992; D’Alessandro, et al., 1994; Margiotta, 1999; Margiotta and Ricchetti, 2002; Palmentola, 1987). Data provided by such techniques are often one- or two-dimensional. They involve surveys that are time consuming and are patchy in terms of spatial coverage. Therefore the possibilities offered by the GPR to investigate the subsoil in a non-invasively way, and to obtain 3D maps of the subsurface itself, becomes of crucial importance for geologists. The successful obtained by GPR investigations on sedimentary rock stratigraphy is well documented in literature (Annan and Davis, 1989; van Overmeeren, 1998; Mills and Speece, 1997; Mokma et al., 1990; Nobes et al., 2001; Lapen et al., 1996; Baker, 1991; Beres, et al., 1995; Leucci et al., 2000; Carrozzo et al., 2000; Carrozzo et al., 2003). Since GPR holds enormous potential for such studies, it is appropriate to assess some key considerations for, i) field data acquisition, ii) raw data processing in order to enhance data display, iii) EM wave velocity measurements in order to characterize sediments response and to perform the time to depth conversion, iv) lithological interpretation of the GPR data set. This chapter attempts to give the steps required to acquired, process and interpret GPR data in a sedimentary rock environment.
GPR data were acquired in the Salento peninsula in two areas located near the city of Lecce, Italy (Fig. 1).
During last years lagoonal – continental and marine oligo-miocene deposits have been recognized in some areas of Salento leccese. Del Prete & Santagati (1972) described lagoonal – continental sediment underlying the well-known miocenic formation of Pietra leccese cropping out the “ Vito Fazzi” hospital of Lecce. They referred this lagoonal deposit to Tortoniano (Miocene). Later, other important outcrops of these deposits were recognized near S. Maria al Bagno (Nardò, Lecce) by Bossio et al. (1992) and near Galatone (Lecce) by Colella (1994), respectively along the roadside of the Gallipoli – Lecce highway and along a
www.intechopen.com

Stratigraphic Analysis of Layered Deposits
62
Fig. 1. Location of Lecce in south Italy (red point) and the surveyed areas (yellows points)
cut of Sud Est railway. Moreover Barbera et al. (1993) referred to late Oligocene a shallow marine calcarenite, rich in Scutelle, cropping out in a quarry near Galatone. Recently Bossio et al. (1999) recognized, not very far away from Lecce, two different informal units referred to the Oligo – Miocene transition, the Galatone Formation (lagoonal – continental deposits) and Lecce Formation (shallow marine deposits). Bossio et al. (2000) proposed to formalize the Galatone Formation.
Notwithstanding these researches, at the moment, the stratigraphical relationships between Galatone Formation and Lecce Formation in consequence of extended soil cover have not been defined.
GPR measurements has been carried out to define the geometrical relationship between these two units.
GPR measurements have been carrying out along a cut-face in order to assess the potential for imaging and characterising different lithological facies of this method and to choose the better antenna and set up. In this first phase some methodological aspects related to the data processing were considered. Particularly first one, although used in potential field and in seismic data processing, Discrete Wavelet Transform (DWT) based filtering procedures was used to GPR images for the particular problem of removing coherent noise (linearly and, mainly, horizontally correlated); second one some interesting approaches to increase resolution of radar signal were performed. Test indicate a 200 MHZ antenna to be a good compromise between resolution and depth penetration. For each litostratigraphic unit, in each of the two investigated areas, velocity analises using Common Depth Point (CDP) and Wide Angle Reflection and Refraction (WARR) techniques were also performed in order to characterize the lithological faces and to convert time in depth.
www.intechopen.com

Ground Penetrating Radar: A Useful Tool for Shallow Subsurface Stratigraphy Characterization
63
2. GPR background theory
GPR is an EM geophysical method for high-resolution detection, imaging and mapping of subsurface soils. In principle, and just to introduce the subject, the GPR can be viewed as composed by a central unity, a transmitting and a receiving antenna, and a computer. The central unity generates electromagnetic pulses that are radiated into the soil by the transmitting antenna. Rigorously, the pulses are radiated in all the directions, but most energy is radiated within a conic volume under the antenna, as shown in Fig. 2. When the electromagnetic waves meet any buried discontinuity (a buried object, or also the interface between two geological layers, a cavity, a zone with different humidity etc.), they are scattered in all the directions (the intensity of the scattered power is not spatially uniform, but depends on the scattering target) and so partly also toward the receiving antenna.
Fig. 2. A block diagram of a GPR system. The interface module enable the user to enter the system parameters, and displays and records the data. The control unit generates the timing signals so that all of the components operate in unison. This unit also does some preliminary data processing. The pulse travel paths in order of arrival are direct air wave, direct ground wave, and reflections.
www.intechopen.com

Stratigraphic Analysis of Layered Deposits
64
Usually the transmitting and the receiving antenna are incorporated in a rigid structure and move together. In modern systems, the gathered signal is represented in real time on the screen of the computer, and is stored in the hard disk memory of the computer. It is implicit that the equipment of a GPR also includes suitable cables to connect the central unit, the antennas and the computer, and also a device to provide energy in the field (Fig. 3), usually, the antennas are also equipped with an odometer that allows to measure the covered distance. The energy is usually supplied by rechargeable batteries in the form of a zero frequency electrical voltage, and the central unit transforms this energy into a signal in the microwave frequency range.
Fig. 3. A 200 MHz antenna with the Sir 2 system GPR unit and resulting radargrams: a) line scan visualization; b) wiggle trace visualization.
Most of the returned signals in radar profile are reflections from subsurface discontinuities, although other types of waves may also be present. Wave types such as a direct airwave, a critically refracted airwave and a direct ground wave generally appear as well, as predicted by the Ray Theory and simple geometrical relations. In a reflection profile, the principal reflections are generally more or less immediately identifiable, as can be seen, for example, in Fig. 3a and 3b. Note that most of the signals in the profiles are reflections except the two topmost, which are two direct waves from the transmitter to the receiver, one in the air and the other in the ground.
www.intechopen.com
Ground Penetrating Radar: A Useful Tool for Shallow Subsurface Stratigraphy Characterization
65
In certain common conditions during GPR investigations, in addition to reflections, the EM waves undergo diffractions from small inhomogeneities and objects. Diffractions that can be identified as hyperbolas in the time section occur in two cases: when the dominant wavelength, , in the radar pulse is larger than the dimensions of the diffractions source, and when waves are diffracted from sharp edges. The physical relation between the velocity, v, wavelength, , and frequency, f, of an EM wave is given by the equation (Conyers and Goodman, 1997):
v = f (1)
According to eq. 1, if, for example, a GPR signal were transmitted at a center frequency of 100 MHz into geological environment with an average propagation velocity of 0.1 m/ns, the local dominant wavelength of the propagating signal would be approximately 1 m. Therefore, diffraction patterns would be obtained from objects or inhomogeneities that are smaller than 1 m.
The resolution of a GPR image is controlled by the sharpness of the focus of the system. The resolution is defined by the Rayleigh criterion (Reynolds, 1998) as the ability to distinguish between two close signals obtained during the GPR mapping, before their separate identity is lost and they appear to be one event. The range resolution, d, can be practically defined as the half-wavelength of the GPR signal in the geological medium (Conyers and Goodman, 1997). Processing methods such as deconvolution can enhance the range resolution below a quarter of the wavelength (Widess, 1973). For example, the calculated average basic vertical resolution for a 100 MHz center frequency mapping of a 0.1 m/ns environment is about 0.5 m (0.125 m). A reflecting horizon may vary laterally in dielectric constant, thus changing the reflection coefficient, or stop laterally, as a result of faulting or absence of deposition (e.g., channel sands). Horizontal (or spatial) resolution refers to the ability to detect the lateral changes in reflectors, such as those caused by faults or facies changes. In this case, the reflected energy that arrives at the receiver antenna does not come from a single point of incidence, but from a circular zone on the reflector. If t is the two-way time of a reflection, fc the frequency of a radar wave and v the velocity, the first Fresnel zone radius Fr from which most energy comes, is (Reynolds, 1998):
Fr ~ 0.5 v (t/fc)1/2 (2)
The derivation of the Fresnel zone radius approximation for GPR is exactly analogous for seismic waves, although in reality, since GPR systems generally use directional dipole antennas, the EM sheaf of waves forms the shape of an elliptical cone (the long axis is perpendicular to the dipole). According to equation 2, if the area of a reflector is greater than an area bordered by circular zone with radius Fr, its shape will be accurately mapped on the time section. However, if the areal extent of the reflector is smaller, diffraction patterns from the edges may dominate its shape. From equation 2, it can be understood that that spatial resolution decreases as a function of depth (e.g., with the increase of the time).
To illustrate if average propagation velocity of 0.1 m/ns, the calculated spatial resolution of a reflector is about 4.5 m (2Fr) at the depth of 10 m (i.e. t = 200 ns) achieved in the 100 MHz GPR profiles. This means that the reflector must be larger than 4.5 m, in order to be best mapped. In practice, the spatial resolution is substantially better. Sheriff and Geldart (1995), discusses an effective Fresnel zone as equal to half the size of the first Fresnel zone.
www.intechopen.com

Stratigraphic Analysis of Layered Deposits
66
Therefore, it can be shown that when such a reflector occupies only 25 percent of the Fresnel zone, its reflected amplitude decreases only by 40 percent. This result emphasizes the fact that even reflectors with lateral dimensions of 1 m (about ¼ Fr) can be clearly detectable at a depth of 10 m, in conditions of fair signal to noise ratio.
For a correct interpretation of the GPR signal, it is important to have some estimation of the electromagnetic characteristics of the background medium (which means, depending of the case, the soil, the masonry, the pillar, the wooden log and so on). A complete characterization would mean a measure of the dielectric permittivity and of the magnetic permeability, both meant as complex quantities to account for losses (in particular, in this way the dielectric permittivity accounts for the electric conductivity too) and variable vs. the frequency to account for the dispersion. These quantities, in general are also functions of the buried point (i.e. the medium is not homogeneous), and possibly are tensor quantities instead of scalar ones (i.e. the medium is anisotropic).
Under the hypothesis of homogeneous, isotropic, non-magnetic and low-loss medium, the propagation velocity of the electromagnetic waves c is related to the relative dielectric
permittivity of the medium s by means of the relationship o
s
cc (Reynolds, 1998),
where oc is the propagation velocity of the electromagnetic waves in free space, about equal
to 3*108 m/s. s is a dimensionless real quantity, whereas the complex (absolute) dielectric
permittivity is meant as eq o s j , where o is the dielectric permittivity of the free
space (equal to 8.854x10⁻¹² Farad/m), is the electric conductivity of the background medium and is the circular frequency.
For many materials, expected values of the relative dielectric permittivity are tabled. Of course, it is usually better to measure the propagation velocity from the data, because the actual current values depends on several environmental variables (the water content, the compactness of the soil, the presence of mineral salts, possibly the temperature). However, the tabled values can be helpful in order to check the likelihood of the retrieved value. In table 1 some values are provided.
3. The site geological setting
The Salento peninsula is the southernmost part of the Apulia region (southern Italy). Apulia is the emerged part of a plate stretching between the Ionian Sea and the Adriatic Sea which constitutes the foreland of both Apenninic and Dinaric orogens. It comprises a Variscan basement covered by a 3-5 Km thick Mesozoic carbonate sequence (the Calcari delle Murge unit), and overlain by thin deposits of Paleocene (Bossio et al., 1992,1998,1999; Margiotta, 1999; Margiotta and Ricchetti, 2002), Neocene (Bossio et al., 1992,1994,1998) and Quaternary age (Bossio et al., 1987; Palmentola, 1987; D’Alessandro et al., 1994). The mid-southern part of Salento peninsula is marked by a wide endorheic area, bordered both toward the East and the West by degradated fault scarps which are the flanks of two narrow ridges lengthened in NNW-SSE direction. Marls, calcareous marls and calcarenites belonging to several Pleistocene sedimentary cycles extensively crop out in the endorheic area. These deposits cover a stratigraphic sequence compound by calcareous units whose age is
www.intechopen.com

Ground Penetrating Radar: A Useful Tool for Shallow Subsurface Stratigraphy Characterization
67
Material Dielectric constant Conductivity (mS/m) Velocity (m/ns) Air 1 0 0.3 Distilled water 80 0.01 0.033 Fresh water 80 0.5 0.033 Sea water 80 30,000 0.01 Dry sand 3-5 0.01 0.15 Saturated sand 20-30 0.1-1.0 0.06 Limestone 4-8 0.5-2 0.12 Shale 5-15 1-100 0.09 Silt 5-30 1-100 0.07 Clay 4-40 2-1,000 0.06 Granite 4-6 0.01-1 0.13 Salt (dry) 5-6 0.01-1 0.13 Ice 3-4 0.01 0.16
Table 1. Some properties of geological materials (Reynolds, 1998)
comprised between the Upper Cretaceous and Upper Pliocene. Two elongated depressions characterized the margin of the endorheic area. They are shaped on Lowest Pleistocene deposits (Bossio et al., 1987), up to 70 m thick, made by calcareous, bioclastic sandstones, locally clinostratified; they shade into bluish clayey marls toward centre of the area. The bottom of depressions is covered by thick sandy colluvial deposits. The most part of endorheic area is constituted by a flat surface, gently sloping northeastward, reaching 120 m of altitude at its SE part. The surface is shaped on white quartz sands that can be most likely referred to the Middle Pleistocene. To the north-west, a low relict cliff joins this surface to a wide marine terrace placed between 40-80 m of altitude whose deposits, made by coarse calcareous sandstones, lie transgressively on Lower Pleistocene sandy and clayey deposits (Fig.4) (D’Alessandro et al., 1994). The Salento peninsula is marked by a wide, deep aquifer hosted into the Mesozoic limestones which rests on sea-water intruded from the nearby coastal area (Ghyben-Herzberg principle). However, a number of shallow water tables occur in the most recent deposits. In particular, in the endorheic area several water tables can be found within the Lower Pleistocene calcareous sandstone and in the Middle Pleistocene sands even if their characteristics are not well known. However, a significative drainage from shallow water tables to the deep acquifer is most likely to occur along sub-vertical planes of greater hydraulic conductivity (Leucci et al., 2004).
Particularly in the surveyed area the first report on the existence of Cenozoic deposits “oligoalini” was done by Del Prete and Santagati (1972). These authors described in detail below the sedimentary succession known Miocene formation of Lecce stone, which recognized the character oligoalino for the presence of carbon levels and the association with ostracods, on the basis of these data was attributed to the Tortonian succession. The authors believed the Stone of Lecce in continuity of sedimentation over the deposits of fresh water.
With regard to the geology of the studied area the Galatone Formation emerges on a narrow strip (Fig. 5) roughly oriented NW - SE in the southern part of Lecce.
www.intechopen.com

Stratigraphic Analysis of Layered Deposits
68
Fig. 4. The geological map of the Salento peninsula
Here is possible to observe an irregular alternation of layers composed of marl and calcareous marl and gray havana with obvious texture tending laminar micritic limestones and limestone thinly layered compact places also foundered.
Fig. 5. Nord - West Lecce Provincia Geological Map (Bossio et al., 1999)
www.intechopen.com

Ground Penetrating Radar: A Useful Tool for Shallow Subsurface Stratigraphy Characterization
69
3. Field procedures
The field procedures, applied in the acquired data in the two selected areas located near Lecce (Fig. 5), have considerate some essential factors. These factors has summarized as follow.
3.1 The data acquisition mode
As affirmed by Davis and Annan (1989) and confirmed by Conyers and Goodman (1997), GPR data can be acquired either continuous or step mode. During acquisition of field data, the radar-transmission process is repeated many times per second as the antennas are pulled along the ground surface or moved in steps.
In continuous mode the antennae are dragged over the soil surface. In step mode the antennae are held a constant distance apart and moved progressively along the profile.
In rough terrain (where is present more vegetation) the continuous mode degrades data quality due to the changes in ground coupling as the height of the antennae above the ground will change through the survey (Woodward et al., 2003).
In the step mode the exact position of every traces taken on the profile is known. If the distance between the survey point is too great, steeply dipping and small features cannot be imaged (Woodward et al., 2003). The step size is a crucial choice because related to the traces number that would be collected. A low traces number making many structure unresolvable. Furthermore this process increase the acquisition time.
For the study presented in this paper GPR data were acquired in continuous mode.
3.2 Choice of frequency
Antenna frequency is a major factor in depth penetration. The higher the frequency of the antenna, the shallower into the ground it will penetrate (Davis and Annan, 1989). A higher frequency antenna will also see smaller targets. Antenna choice is one of the most important factors in survey design. The following table shows antenna frequency, approximate depth penetration and appropriate application.
Approximiate Depth Range
Primary Antenna Choice
Secondary Antenna Choice
Appropriate Application
0 - 0.5 m 1600 MHz 900 MHz Structural Concrete, Roadways, Bridge Decks,
0 - 1 m 900 MHz 400 MHz Concrete, Shallow Soils, Archaeology
0 - 9 m 400 MHz 200 MHz Shallow Geology, Utilities, UST’s, Archaeology
0 - 9 m 200 MHz 100 MHz Geology, Environmental, Utility, Archaeology
0-30 m 100 MHz Sub-Echo 40 Geologic Profiling Greater than 30 m
MLF (80, 40, 32, 20, 16 MHz)
Geologic Profiling
Table 2. The approximate depth range with the antennae frequency choice (Leucci, 2008)
www.intechopen.com

Stratigraphic Analysis of Layered Deposits
70
In order to choice the frequency antenna useful to the survey a GPR calibration profiles were performed using the 100, 200 and 500MHz center frequencies antennae. Calibration was carried out on the cut-face and GPR data were verified by direct comparison.
In Fig. 6 the photo (a) and the geological section of the cut – face is shown. The cut- face is located along the road Lecce – Gallipoli, southwest of Lecce (area B in Fig. 5). The cut has a variable depth (between about 4 and 1 m) compared to ground level. Lithological succession is characterized by an irregular alternation of compact micritic limestones, thinly laminated limestones. In particular in the stratigraphically lower portion of the section outcropping in the northern part of the embankment, marly layers are prevalent with thicknesses ranging from ten to forty centimeters thick limestone layers intercalated with the order of decimeters. In the southern part of the cut - face, the layers consist of limestones stratigraphically higher prevailing in places thinly laminated, with rare intercalations of marly levels. In the central part of the cut - face, which is the summit portion of the sequence, the layers are affected by many distortions that their identification is difficult when the limestone outcrop and nearly impossible at the marl. Still south along the cut - face, the layers reappear in their appearance than those with mostly typical of those calcareous marl.
Fig. 6. The cut – face: a) photo; b) interpreted geological section
As mentioned previously, the layers are loosely bent: in particular it is recognizable the presence of an anticline with a large radius of curvature in the southern part of the cut - face, also at the bottom of the sequence, the layers plunge to the south - west.
From a preliminary analysis of GPR raw data seem that EM signal does not propagate beyond 100ns for the 100MHz and 200MHz antennas, and beyond 60ns for 500MHz antenna. To make more meaningful comparisons between the data for the three antennas on the two-way time window was set at 70ns (Fig. 7).
A comparison with the stratigraphical trends and therefore with the geological section (Fig. 6b) shown a good correlation between the raw radar sections and the stratification of the geological formations. GPR raw data show a good signal to noise ratio in areas where a thinly laminated limestones and micritic compact limestones are present. The signal to noise ratio is less good, as expected, in areas of intense deformation of the layers and in those areas where there are calcareous marl and marl.
www.intechopen.com

Ground Penetrating Radar: A Useful Tool for Shallow Subsurface Stratigraphy Characterization
71
Fig. 7. The raw radar sections acquired on the cut – face: a) 100MHz; b) 200MHz; c) 500MHz antennae
The conclusion to make for this calibration survey is that for medium depth targets with relatively large sizes the choice of the antenna was not critical and either one between 200 and 500MHz would have done the job equally well. This means that for large targets buried 1 to 3 meters from the surface the 200MHz center frequency and the 500MHz center frequency are both adequate devices.
4. Processing methodology
One of the great advantages of the GPR method is the fact that the raw data is acquired in a manner that allows it to be easily viewed in real time using a computer screen. Often very little processing is required for an initial interpretation of the data, with most of the effort directed towards data visualization. On the other hand, depending on the application and target of interest, it may be necessary to perform sophisticated data processing, and many practitioners find that techniques common to seismic reflection such as migration can be applied. The outcome of processing is a cross-section of the subsurface EM properties, displayed in terms of the two-way travel time, i.e. the time taken for a wave to move from the transmitter to a reflector and return to the receiver. The amount of processing undertaken can range from basic, which allows rapid data output, to the more time consuming application of algorithms designed for use on seismic dataset (Ylmaz, 1987), which produce high quality output (Daniels et al. 1988; Conyers and Goodman, 1997). The processing sequence usually developed for GPR raw data is following done.
zero-time adjust (static shift) – During a GPR survey, the first waveform to arrive at the receiver is the air wave. There is a delay in the time of arrival of the first break of the air wave on the radar section due to the length of the cable connecting the antennae and the control unit. Therefore need to associate zero-time with zero-depth, so any time offset due to instrument recording must be removed before interpretation of the radar image.
Background removal filter (subtract average trace to remove banding) - Background noise is a repetitive signal created by slight ringing in the antennae, which produces a coherent banding effect, parallel to the surface wave, across the section (Conyers and Goodman, 1997). The filter is a simple arithmetic process that sums all the amplitudes of reflections that
www.intechopen.com

Stratigraphic Analysis of Layered Deposits
72
were recorded at the same time along a profile and divides by the number of traces summed the resulting composite digital wave, which is an average of all background noise, is then subtracted from the data set. Care must be taken in this process not to remove real linear events in the profile. The time window where the filter operates must be specified so that the filter is not applied until after the surface wave.
Horizontal (distance) stretch to get constant trace separation (horizontal normalization) – This correction need to remove the effects of non-constant motion along the profile. Data are collected continuously, and will not be represented correctly in the image if steps are not taken to correct for the variable horizontal data coverage.
Gain – Gain is used to compensate for amplitude variations in the GPR image; early signal arrival times have greater amplitude than later times because these early signals have not traveled as far. The loss of signal amplitude is related to geometric spreading as well as intrinsic attenuation. Various time-variable gain functions may be applied in an effort to equalize amplitudes of the recorded signals. The most commonly applied is an automatic gain control (AGC) that is a time – varying gain that runs a window of chosen length along each trace, point by point, finding the average amplitude over the length of the window about each point. A gain function is then applied such that the average at each point is made constant along the trace.
Topographic corrections – Surveyed elevation data are used to apply topography to the GPR survey profiles. Firstly trace windowing is applied to the data to remove all artefacts in the survey that arrived before the time zero arrivals. The actual elevation recorded along the GPR line are then entered into the data processing package and the time zero arrivals are hung from the topographic profile by applying a time shift to each individual trace.
Frequency filtering - Although GPR data are collected with source and receiver antennae of specified dominant frequency, the recorded signals include a band of frequencies around the dominant frequency component. Frequency filtering is a way of removing unwanted high and/or low frequencies in order to produce a more interpretable GPR image. High-pass filtering maintains the high frequencies in the signal but removes the low frequency components. Low-pass filtering does just the opposite, removing high frequencies and retaining the low frequency components. A combination of these two effects can be achieved with a band-pass filter, where the filter retains all frequencies in the pass band, but removes the high and low frequencies outside of the pass band.
Deconvolution - When the time-domain GPR pulse propagates in the subsurface, convolution is the physical process that describes how the propagating wavelet interacts with the earth filter (the reflection and transmission response of the subsurface). Deconvolution is an inverse filtering operation that attempts to remove the effects of the source wavelet in order to better interpret GPR profiles as images of the earth structure. Deconvolution operators can degrade GPR images when the source signature is not known. Deconvolution operators are designed under the assumption that the propagating source wavelet is minimum phase (i.e., most of its energy is associated with early times in the wavelet). This assumption is not necessarily valid for GPR signals. With GPR, the ground becomes part of the antennae, and the source pulse can vary from trace-to-trace and is not necessarily minimum phase. All filtering operations borrowed from seismic data processing must be applied with care as
www.intechopen.com
Ground Penetrating Radar: A Useful Tool for Shallow Subsurface Stratigraphy Characterization
73
some of the underlying assumptions for elastic waves generated at the surface of the earth are not valid or are different for electromagnetic waves. For more see Ylmaz (1987)
Migration - Migration is a processing technique which attempts to correct for the fact that energy in the GPR profile image is not necessarily correctly associated with depths below the 2-D survey line.
As with deconvolution, migration can be seen as an inverse processing step which attempts to correct the geometry of the subsurface in the GPR image with respect to the survey geometry. For example, a subsurface scattering point would show up in a GPR image as a hyperbolic-shaped feature. Migration would associate all the energy in the wavelets making up the hyperbolic feature with the point of diffraction, and imaging of the actual earth structure (the heterogeneity represented by the point diffractor) would be imaged more clearly. Migration operators require a good estimate of subsurface EM wave velocity in order to apply the correct adjustments to the GPR image. For more see Ylmaz (1987).
F-K filter - Fourier transform techniques, or f-k filtering, i.e. by means of filters designed and applied in the frequency-wavenumber (or f-k) domain (Yilmaz, 1987). It is well known that a dipping line in the x-t domain maps to a line passing through the origin and with an orientation normal to the original line in the f-k amplitude spectrum. In other words, a line of constant apparent velocity corresponds to a line of constant slope in the f-k domain. In particular, horizontal lines map to the vertical direction, along the f-axis. Dipping events that overlap in the x-t domain can be separated in the f-k domain by their dips. This allows the elimination of certain types of unwanted energy from the data, representing linear coherent noise. Regardless of their location, lines with the same dip (parallel lines), map to the same radial line in the f-k amplitude spectrum, so that f-k filters could be effective for removing at the same time all undesired lines with the same slope, but impractical if one wants to remove only some of them instead of the whole family. Fan filters are generally used for dip filtering. In these cases the amplitude spectrum of the input is multiplied by a suitable function, the amplitude response of the filter consisting of ones in a fan-shaped zone and zeros elsewhere, to obtain the amplitude spectrum of the output, whereas the phase spectrum is left unchanged. Finally, the filtered signal is obtained by a two-dimensional inverse Fourier transform.
The Wavelet Transform – It is possible to decompose the radar signal into different scales where signal and certain noises may be effectively separated/isolated (multiresolution analysis) . Subsequent muting of the noise is easily achieved in the Wavelet Transform (WT) domain operating only on the scales where the offending noise appears.
5. Processing step on the GPR data acquired on cut-face
Data acquired on the cut- face were processed in order to enhance the signal to noise ratio. To optimize the selection of frequency filter a spectral analysis was performed on the radar sections and the average spectrum was calculated. Based on the results of this analysis was applied a bandpass filter. The coherent noise (horizontal band), present on the sections, probably due to the ringing of the antennae or reflections from obstacles visible on the surface located at a constant distance from the antenna itself, has been removed by a background removal filter.
www.intechopen.com

Stratigraphic Analysis of Layered Deposits
74
Figure 8 shows the processed radar sections related to 100MHz (a), 200MHz (b) and 500MHz (c) center frequency antennae.
Fig. 8. The processed radar sections related to the profiles acquired on the cut – face: a) 100MHz; b) 200MHz; c) 500MHz antennae; d) sum of radar signals obtained with the 100, 200 and 500MHz antennae
The comparison between Fig. 6 and 8 shows:
a. a general improvement of the signal to noise ratio over the entire section related to the 100MHz antenna. The horizontal noise was attenuated and, in the first 20ns, the EM reflections are more clear. These can be associated with the almost horizontal reflector visible between 15 and 35ns between 25-32m and 45-55m on the profile direction;
b. in the 200MHz antenna section, the improvement of the signal to noise ratio is sensitive only in the outer zones, where the signal is still evident and corresponds to changes in stratigraphy. In the middle part of the processed radar section (between 45 and 55m) a very weak EM reflection is present at about 10ns;
c. in the 500MHz antenna section, the signal to noise ratio is much improved in the area between 55 and 80m, where the layers trend is more evidenced; in the central part of the profile (30-45m), the signal present in the raw data between 30 and 40ns loses of evidence; the effect of the processing is positive in the two-way time window 6-20ns where is emphasize the superficial layers trend.
As known, increasing the frequency content of the spectrum is obtained by a narrowing of the package in the time domain with a consequent increase in temporal resolution. One technique to increase the length of the band in the case of radar signals was proposed by Malagodi et al. (1996). It consists of adding radar signals obtained with different antennae.
In order to reduce high frequency noise, resulting in continuous acquisition, the processed signals for the three antennas was added. The result is shown in Fig. 8d. Is possible to see:
a) a general improvement of the signal to noise ratio over the entire radar section; b) a sharper differentiation of the signal in areas with different EM, and therefore lithological, characteristics; c) a better correlation of the EM reflection events with the stratification.
www.intechopen.com
Ground Penetrating Radar: A Useful Tool for Shallow Subsurface Stratigraphy Characterization
75
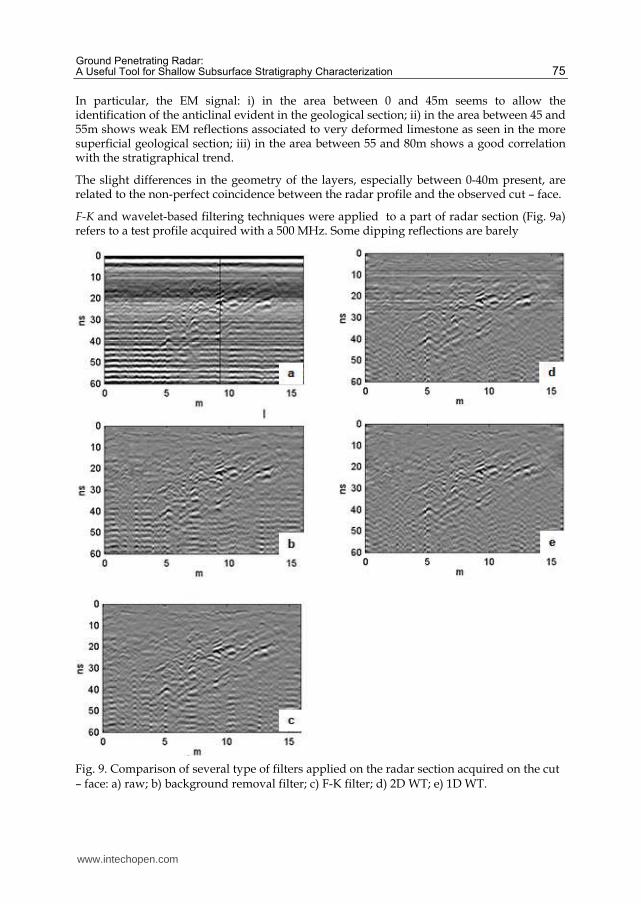
In particular, the EM signal: i) in the area between 0 and 45m seems to allow the identification of the anticlinal evident in the geological section; ii) in the area between 45 and 55m shows weak EM reflections associated to very deformed limestone as seen in the more superficial geological section; iii) in the area between 55 and 80m shows a good correlation with the stratigraphical trend.
The slight differences in the geometry of the layers, especially between 0-40m present, are related to the non-perfect coincidence between the radar profile and the observed cut – face.
F-K and wavelet-based filtering techniques were applied to a part of radar section (Fig. 9a) refers to a test profile acquired with a 500 MHz. Some dipping reflections are barely
Fig. 9. Comparison of several type of filters applied on the radar section acquired on the cut – face: a) raw; b) background removal filter; c) F-K filter; d) 2D WT; e) 1D WT.
www.intechopen.com

Stratigraphic Analysis of Layered Deposits
76
distinguishable through the variable-intensity system-ringing noise and the low-frequency background heavily contaminating the section.
It is clear that a background removal filter (Fig. 9b) is insufficient for removing completely the horizontal banding, due to its horizontal amplitude variation, whereas it could be too strong in the upper part, reducing the horizontal reflection continuity. Slightly better results, but quite similar to the background removal, gives the application of a F-K filter designed to remove the very steep dips and the horizontal noise (Fig. 9c). For comparison the results of two different filtering techniques using the 1D and 2D WT are shown in Figures 9d and 9e. Also in this case slightly better results gives the application of a 1D WT.
6. Velocity analysis
A detailed knowledge of the subsurface velocity field for the propagation of EM energy is critical to any through GPR processing. A number of method exist to estimate the EM wave velocity propagation in the subsoil (Fruhwirth et al., 1996; Conyers and Goodman 1997; Huisman et al. 2003). The common midpoint (CMP) and the wide angle reflection refraction (WARR) are the two method used in the field to estimate the EM wave velocity in the subsoil.
Fig. 10. The EM wave velocity measurements: a) CMP acquisition scheme; b) CMP radargram; c) WARR acquisition scheme
www.intechopen.com
Ground Penetrating Radar: A Useful Tool for Shallow Subsurface Stratigraphy Characterization
77
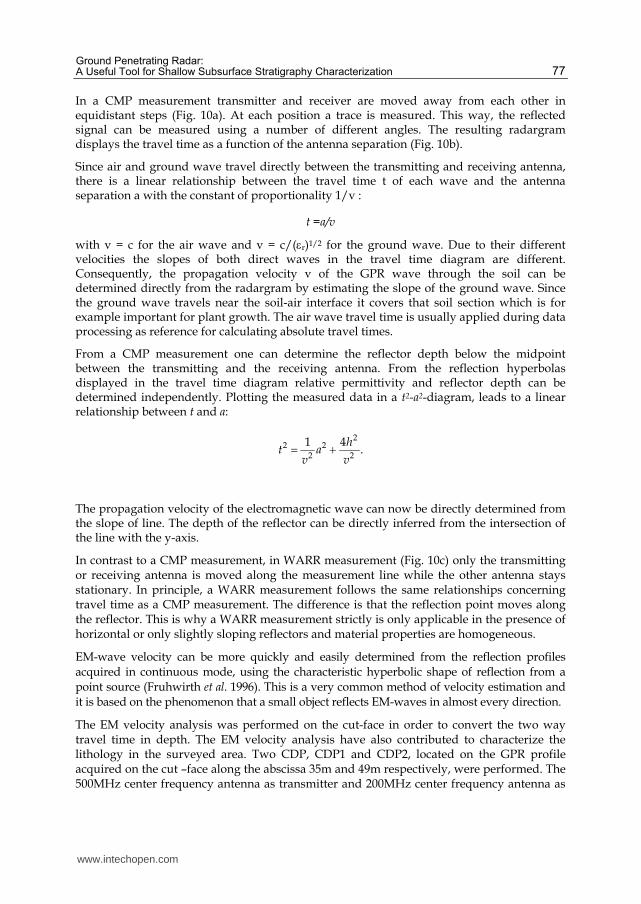
In a CMP measurement transmitter and receiver are moved away from each other in equidistant steps (Fig. 10a). At each position a trace is measured. This way, the reflected signal can be measured using a number of different angles. The resulting radargram displays the travel time as a function of the antenna separation (Fig. 10b).
Since air and ground wave travel directly between the transmitting and receiving antenna, there is a linear relationship between the travel time t of each wave and the antenna separation a with the constant of proportionality 1/v :
t =a/v
with v = c for the air wave and v = c/(r)1/2 for the ground wave. Due to their different velocities the slopes of both direct waves in the travel time diagram are different. Consequently, the propagation velocity v of the GPR wave through the soil can be determined directly from the radargram by estimating the slope of the ground wave. Since the ground wave travels near the soil-air interface it covers that soil section which is for example important for plant growth. The air wave travel time is usually applied during data processing as reference for calculating absolute travel times.
From a CMP measurement one can determine the reflector depth below the midpoint between the transmitting and the receiving antenna. From the reflection hyperbolas displayed in the travel time diagram relative permittivity and reflector depth can be determined independently. Plotting the measured data in a t2-a2-diagram, leads to a linear relationship between t and a:
22 2
2 2
1 4.
ht a
v v
The propagation velocity of the electromagnetic wave can now be directly determined from the slope of line. The depth of the reflector can be directly inferred from the intersection of the line with the y-axis.
In contrast to a CMP measurement, in WARR measurement (Fig. 10c) only the transmitting or receiving antenna is moved along the measurement line while the other antenna stays stationary. In principle, a WARR measurement follows the same relationships concerning travel time as a CMP measurement. The difference is that the reflection point moves along the reflector. This is why a WARR measurement strictly is only applicable in the presence of horizontal or only slightly sloping reflectors and material properties are homogeneous.
EM-wave velocity can be more quickly and easily determined from the reflection profiles acquired in continuous mode, using the characteristic hyperbolic shape of reflection from a point source (Fruhwirth et al. 1996). This is a very common method of velocity estimation and it is based on the phenomenon that a small object reflects EM-waves in almost every direction.
The EM velocity analysis was performed on the cut-face in order to convert the two way travel time in depth. The EM velocity analysis have also contributed to characterize the lithology in the surveyed area. Two CDP, CDP1 and CDP2, located on the GPR profile acquired on the cut –face along the abscissa 35m and 49m respectively, were performed. The 500MHz center frequency antenna as transmitter and 200MHz center frequency antenna as
www.intechopen.com
Stratigraphic Analysis of Layered Deposits
78
receiver were used. This is possible because the frequencies bands of the two used antennae are partially overlapped (Conyers and Goodman, 1997).
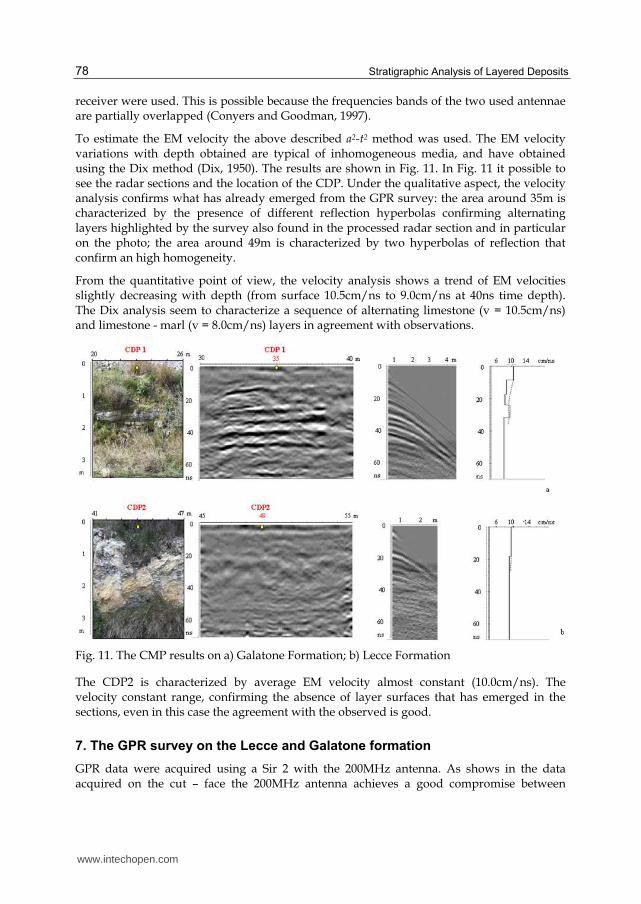
To estimate the EM velocity the above described a2-t2 method was used. The EM velocity variations with depth obtained are typical of inhomogeneous media, and have obtained using the Dix method (Dix, 1950). The results are shown in Fig. 11. In Fig. 11 it possible to see the radar sections and the location of the CDP. Under the qualitative aspect, the velocity analysis confirms what has already emerged from the GPR survey: the area around 35m is characterized by the presence of different reflection hyperbolas confirming alternating layers highlighted by the survey also found in the processed radar section and in particular on the photo; the area around 49m is characterized by two hyperbolas of reflection that confirm an high homogeneity.
From the quantitative point of view, the velocity analysis shows a trend of EM velocities slightly decreasing with depth (from surface 10.5cm/ns to 9.0cm/ns at 40ns time depth). The Dix analysis seem to characterize a sequence of alternating limestone (v = 10.5cm/ns) and limestone - marl (v = 8.0cm/ns) layers in agreement with observations.
Fig. 11. The CMP results on a) Galatone Formation; b) Lecce Formation
The CDP2 is characterized by average EM velocity almost constant (10.0cm/ns). The velocity constant range, confirming the absence of layer surfaces that has emerged in the sections, even in this case the agreement with the observed is good.
7. The GPR survey on the Lecce and Galatone formation
GPR data were acquired using a Sir 2 with the 200MHz antenna. As shows in the data acquired on the cut – face the 200MHz antenna achieves a good compromise between
www.intechopen.com

Ground Penetrating Radar: A Useful Tool for Shallow Subsurface Stratigraphy Characterization
79
resolution and penetration depth.GPR data were acquired in continuous mode. This technique allows large areas to obtain a good compromise between data quality and acquisition time. A critical parameter in this case may be the speed of drag the antenna: in fact the incremental sampling, of the tool, it provides data averaged over time, so in case of wavy structures, characterized by small wavelengths, a high-speed drive the antenna does not follow the undulations of the same detail (Conyers and Goodman, 1997).
The survey consists in 61 acquired radar profiles, most of them with a direction transverse to the line contact between the two geological formations (Fig. 12).
In the area A, measurements were made on profiles arranged in a grid of 11.2m x 25m (Fig. 12a).
The quality of raw data was good but it was not enough for an immediate interpretation due to the presence of an inevitable component of noise. The particular type of problem and the high resolution required, made data processing necessary.
Fig. 12. Location of the GPR profiles: a) A area; b) B area
Data processing was done using Reflex 6.0 software (Sandmeier, 2010).
A series of tests were carried out in frequency filtering on a sample of 15 radar sections, which was considered to better represent the entire set of data. The tests showed that the high-cut filters are effective in removing most of the noise, while low-cut filters also eliminate much of the useful signal. The low frequency noise, normally referred to the background related to the horizontal band on the radar sections that can cover the reflected events. It is due to the ringing of the antennae or reflections from obstacles visible on the surface located at a constant distance from the antenna (walls parallel to the profile or the operator pulls the antenna). To remove the background noise, the background removal filter was applied. The application of the migration has not been particularly incisive because on the field data were almost absent diffraction hyperbolas. Consequently, the migration was omitted from the processing of data. A block diagram of the processing performed to the GPR raw data sections and an example before and after processing is show in Figs 13 and 14.
www.intechopen.com

Stratigraphic Analysis of Layered Deposits
80
Fig. 13. Processing sequence for GPR data acquired in the areas A and B
Fig. 14. Radar section related to the B3 profile acquired in area A: a) raw; b) processed
www.intechopen.com
Ground Penetrating Radar: A Useful Tool for Shallow Subsurface Stratigraphy Characterization
81
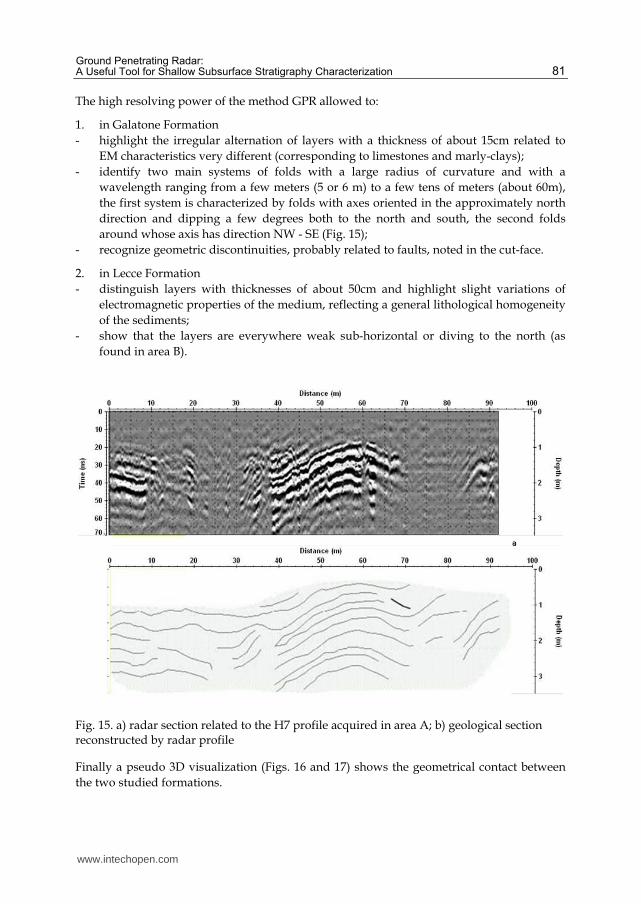
The high resolving power of the method GPR allowed to:
1. in Galatone Formation - highlight the irregular alternation of layers with a thickness of about 15cm related to
EM characteristics very different (corresponding to limestones and marly-clays); - identify two main systems of folds with a large radius of curvature and with a
wavelength ranging from a few meters (5 or 6 m) to a few tens of meters (about 60m), the first system is characterized by folds with axes oriented in the approximately north direction and dipping a few degrees both to the north and south, the second folds around whose axis has direction NW - SE (Fig. 15);
- recognize geometric discontinuities, probably related to faults, noted in the cut-face.
2. in Lecce Formation - distinguish layers with thicknesses of about 50cm and highlight slight variations of
electromagnetic properties of the medium, reflecting a general lithological homogeneity of the sediments;
- show that the layers are everywhere weak sub-horizontal or diving to the north (as found in area B).
Fig. 15. a) radar section related to the H7 profile acquired in area A; b) geological section reconstructed by radar profile
Finally a pseudo 3D visualization (Figs. 16 and 17) shows the geometrical contact between the two studied formations.
www.intechopen.com

Stratigraphic Analysis of Layered Deposits
82
Fig. 16. Area A: pseudo 3D visualization
Fig. 17. Area B: pseudo 3D visualization
8. Conclusions
The quality of GPR results obtained in sedimentary rock environments reflect both the lithological nature of sediments its and geometrical relationship together with the care applied to the methodology for data acquisition, processing and interpretation.
www.intechopen.com

Ground Penetrating Radar: A Useful Tool for Shallow Subsurface Stratigraphy Characterization
83
In this chapter was described the key steps required to acquired, processing and interpret GPR data in a sedimentary rocks with different lithological characteristic. Data acquired in south Salento were used. Particular importance was placed on ground – truth control obtained from a cut – face. It provide the necessary verification for the interpretation of GPR reflections. In fact the results show that is possible to obtain an improving of the signal to noise ratio using only a traditional filters. The sum of both signals in the time domain, better highlight, at least in some areas, the trend of the stratigraphy and helped to distinguish areas with different electromagnetic characteristics, related to the different lithology. A general good correlation between the radar and the geological section was obtained. The EM wave velocity measurements were very useful for interpretation and characterization of the different lithologies, especially in the areas with low signal to noise ratio. It was able to recognize areas of a succession of limestone and marl and limestone layers, and made up of areas with no obvious surface layer.
This overview outlines an approach suitable for application to future GPR surveys in sedimentary rock environments and should lead to an improvement in the quality of GPR studies, which will aid interpretation of, and comparison between, data sets.
In the successive GPR measurements in the two chosen areas the results obtained on the cut-face were useful to set the field methodology, the antenna frequency, the processing step, and data interpretation. Results shows the characteristics of the sediments of the two studied formations: Galatone Formation is always mildly folded affected by fractures, while the layers of Lecce Formation are horizontal and show geometrical mismatch with the Galatone formation.
With regard to the GPR method it can be concluded that it gives results clearly interpretable when the lithological units is well stratified and presents sharp contrasts of the electromagnetic properties. It allows, through the EM velocity analysis, to solve the evolution of stratification in the first 3m - 4m in depth; to estimate the thickness of the layers; to give the lithological nature of the two formations. Obviously, where the geological formation investigated is characterized by lithological homogeneity with indistinct stratification surfaces, and thus contrasts with weak electromagnetic fields, the results of the GPR method is not easily evaluated in the absence of outcrops that allow calibration of the method.
9. References
Baker, P.L., 1991. Response of ground-penetrating radar to bounding surfaces and lithofacies variations in sand barrier sequences. Explor. Geophys. 22, 19–22.
Barbera C., Bossio A., Mazzei R., Monteforti B., Salvatorini G., 1993. Un flash sul ciclo miocenico del Salento. Soc. Paleont. It. XII convegno Guida alle escursioni, 79-84
Beres, M., Green, A., Huggenberger, P., Horstmeyer, H., 1995. Mapping the architecture of glaciofluvial sediments with three-dimensional georadar. Geology 23, 1087–1090.
Bossio A., Mazzei R., Monteforti B., Salvatorini G., 1992. Notizie preliminari sul Miocene di S.Maria al Bagno-S.Caterina, presso Nardò (Lecce). Paleopelagos, 2, 99-107.
Bossio A., Esu D., Foresi L.M., Girotti O., Iannone A., Luperto Sinni E., Margiotta S., Mazzei R., Monteforti B., Ricchetti G., Salvatorini G., 2000 - Formazione di Galatone, nuovo
www.intechopen.com

Stratigraphic Analysis of Layered Deposits
84
nome per un’unità litostratigrafica del Salento (Puglia, Italiameridionale). Atti Soc. Toscana Sc. Nat., Mem., Serie A, 105, 151-156.
Bossio, A., Guelfi, F., Mazzei, R., Monteforti, B., Salvatorini, G., Varola, A., 1987. Precisazioni sull’età dei sedimenti pleistocenici di due cave del leccese (San Pietro in Lama e Cutrofiano), Proceedings del Convegno sulle conoscenze geologiche del territorio salentino. Lecce 12 December 1987. Quaderni di Ricerche del Centro Studi Geotecnica e Ingegneria, 11, pp 147-174.
Bossio A., Mazzei R., Monteforti B. & Salvatorini G., 1994. La successione miocenica nell'area tipo delle Calcareniti di Andrano (Puglia, Italia meridionale)”, Boll. Soc. Paleont. Italiana, 33, (2), 249-255, Modena.
Bossio A., Esu D., Foresi L.M., Girotti O., Iannone A., Luperto E., Margiotta S., Mazzei R., Monteforti B., Ricchetti G., Salvatorini G., (1998), “Formazione di Galatone, nuovo nome per un’unità litostratigrafia del Salento (Puglia, Italia meridionale)”, Atti Soc. Tosc. di Scienze Naturali, Mem., Serie A, 105, 151-156, Pisa.
Bossio A., Foresi L., Margiotta S., Mazzei R., Monteforti B. & Salvatorini G., 1999. Carta geologica del settore nord orientale della Provincia di Lecce; scala 1:25000; settore 7,8,10 scala 1:10000, Università degli Studi di Siena.
Carrozzo M. T., Leucci G., Margiotta S., Negri S., Nuzzo L., 2000 APPLICAZIONE DELLA METODOLOGIA GPR PER LA SOLUZIONE DI PROBLEMI STRATIGRAFICI.Bollettino Geofisico Anno XXIII, Vol 1-2 Gen-Giu 2000, pp 5-16;
Carrozzo M.T., Leucci G., Negri S., Nuzzo L., 2003. GPR SURVEY TO UNDERSTAND THE STRATIGRAPHY AT THE ROMAN SHIPS ARCHAEOLOGICAL SITE (PISA, ITALY). Archaeological Prospection, vol. 10, n. 1, 57-72;
Ciaranfi, N., Pieri, P., Ricchetti, G., 1992. Note alla carta geologica delle Murge del Salento (Puglia centro-meridionale), Mem. Società Geologica Italiana, 106, pp 449-460, Roma.
Colella R., 1994. Rilevamento geologico e analisi litostratigrafia di lembi oligocenici affioranti tra Galatone e S. Maria al Bagno (LE). Tesi di laurea inedita in geologia, Univ. degli Studi di Bari - Facoltà di SMFN - Dip. Di Geol. e Geofisica.
Conyers L. B. and Goodman D., (1997). Ground-penetrating radar – An introduction for archaeologists, AltaMira Press, A Division of Sage Publications, Inc.
D’Alessandro, A., Mastronuzzi, G., Palmentola, G., Sansò, P., 1994. Pleistocene deposits of Salento leccese (Southern Italy): Problematic relationships, Bollettino della Società Paleontologica Italiana, 33 (2), pp 257-263;
Daniels D., Gunton D. J., Scott H.F., 1988, Introduction to subsurface radar. Institution of Electrical Engineers, Proceedings, 135 (F4), 278-320
Davis J. L and Annan A. P., 1989. Ground Penetrating Radar For high resolution mapping of soil and rock stratigraphy. Geophysical Prospecting 37, 531-551.
Del Prete M. and Santagati G., 1972. Depositi oligoalini interposti tra calcari cretacici e Pietra leccese nei dintorni di Lecce.Geol. Appl. e ldrogeol., vol.7
Dix C. M., 1955. Seismic velocities from surface measurement. Geophysics 20, 68-86. Fruhwirth R.K., Schmoller R. and Oberaigner E.R. 1996. Some aspects of the estimation of
electromagnetic wave velocities. Proceedings of the 6th International Conference on Ground Penetrating Radar, Tohoku University, Sendai, Japan, pp. 135–138.
Huisman J.A., Hubbard S.S., Redman J.D. and Annan A.P. 2003. Measuring soil water content with ground penetrating radar: A review. Vadose Zone Journal 2, 476–491.
www.intechopen.com

Ground Penetrating Radar: A Useful Tool for Shallow Subsurface Stratigraphy Characterization
85
Lapen, D.R., B.J. Moorman, and J.S. Price. 1996. Using ground-penetrating radar to delineate subsurface features along a wetland catena. Soil Sci. Soc. Am. J. 60:923-931.
Leucci G., Margiotta S., Negri S., 2000. UN CONTRIBUTO PER LA DEFINIZIONE DEI RAPPORTI GEOMETRICI TRA DUE UNITÀ OLIGO-MIOCENICHE DEL SALENTO LECCESE (PUGLIA, ITALIA) MEDIANTE INDAGINI GEOFISICHE CON GEORADAR. Bollettino della Società Geologica Italiana, III fascicolo 2000, pp 703-714;
Leucci G., Margiotta S., Negri S., 2004. GEOLOGICAL AND GEOPHYSICAL INVESTIGATIONS IN KARSTIC ENVIRONMENT (SALICE SALENTINO, LECCE, ITALY). Journal of Environmental and Engineering Geophysics (JEEG), n. 9, 25-34;
Leucci G., 2008. GROUND PENETRATING RADAR:THE ELECTROMAGNETIC SIGNAL ATTENUATION AND MAXIMUM PENETRATION DEPTH, Scholarly Research Exchange: Volume 2008 � Article ID 926091 � doi:10.3814/2008/926091;
Malagodi S.,Orlando L., Piro S. (1996). Approaches to increase resolution of radar signal. 6th International Conference on Ground Penatrating Radar(GPR’96), September 30-October 3, 1996. Sendan, Japan. 283-288.
Margiotta S., 1999. Il contatto Formazione di Galatone – Formazione di Lecce: evidenze stratigrafico – sedimentologiche, Atti Soc. Tosc. di Scienze Naturali, Mem., Serie A, 106, 73-77, Pisa.
Margiotta S. and Ricchetti G., 2002. Stratigrafia dei depositi oligomiocenici del Salento (Puglia), Boll.Soc.Geol.It., 121
Mills, H.H., and M.A. Speece. 1997. Ground-penetrating radar exploration of alluvial fans in the southern Blue Ridge Province, North Carolina. Environ. Eng. Geosci. 3(4):487-499.
Mokma, D.L., R.J. Schaetzl, J.A. Doolittle, and E.P. Johnson. 1990. Ground-penetrating radar study of ortstein continuity in some Michigan haplaquods. Soil Sci. Soc. Am. J. 54:936-938.
Nobes, D.C., Ferguson R.J., and Brierley G.J.. 2001. Ground-penetrating radar and sedimentological analysis of Holocene floodplains: insight from the Tuross valley, New South Wales. Aust. J. Earth Sci. 48:347-355.
van Overmeeren R.A., 1998. Radar facies of unconsolidated sediments in The Netherlands: A radar stratigraphy interpretation method for Hydrogeology. Journal of Applied Geophysics, 40, 1-18.
Palmentola, G., 1987. Geological and geomorphological outlines of the Salento leccese region (Southern Italy), Proceedings del Convegno sulle conoscenze geologiche del territorio salentino. Lecce 12 December 1987. Quaderni di Ricerche del Centro Studi Geotecnica e Ingegneria Lecce, 11, pp 7-23.
Reynolds, J. M., 1998, An Introduction to Applied and Environmental Geophysics: John Wiley & Sons Ltd.
Sandmeier, K. J., 2010, Reflex 6.0 Manual. Sandmeier Software. Zipser Strabe 1, D-76227 (Karlsruhe, Germany).
Sheriff, R. E., and L. P. Geldart (1995), Exploration Seismology, 2nd ed., 592 pp., Cambridge Univ. Press, New York.
Widess, M. B., 1973. How thin is this bed? Geophysics, Vpl. 38, p. 176-1180. Woodward J., Ashworth P.H., Best J.L., Sambrook Smith G.H., Simpson C.J., 2003. The use
and application of GPR in sandy fluvial environments: methodological
www.intechopen.com

Stratigraphic Analysis of Layered Deposits
86
considerations. In Ground Penetrating Radar in Sediments, Edited by C.S. Bristow and H. M. Jol, Geological Society Special Pubblication, London, 211, 127-142.
Yilmaz O 1987 Seismic Data Processing ed E B Neitzel (Tulsa, OK: Society of Exploration Geophysicists)
www.intechopen.com

Stratigraphic Analysis of Layered DepositsEdited by Dr. Ömer Elitok
ISBN 978-953-51-0578-7Hard cover, 298 pagesPublisher InTechPublished online 27, April, 2012Published in print edition April, 2012
InTech EuropeUniversity Campus STeP Ri Slavka Krautzeka 83/A 51000 Rijeka, Croatia Phone: +385 (51) 770 447 Fax: +385 (51) 686 166www.intechopen.com
InTech ChinaUnit 405, Office Block, Hotel Equatorial Shanghai No.65, Yan An Road (West), Shanghai, 200040, China Phone: +86-21-62489820 Fax: +86-21-62489821
Stratigraphy, a branch of geology, is the science of describing the vertical and lateral relationships of differentrock formations formed through time to understand the earth history. These relationships may be based onlithologic properties (named lithostratigraphy), fossil content (labeled biostratigraphy), magnetic properties(called magnetostratigraphy), chemical features (named chemostratigraphy), reflection seismology (namedseismic stratigraphy), age relations (called chronostratigraphy). Also, it refers to archaeological deposits calledarchaeological stratigraphy. Stratigraphy is built on the concept "the present is the key to the past" which wasfirst outlined by James Hutton in the late 1700s and developed by Charles Lyell in the early 1800s. This bookfocuses particularly on application of geophysical methods in stratigraphic investigations and stratigraphicanalysis of layered basin deposits from different geologic settings and present continental areas extendingfrom Mexico region (north America) through Alpine belt including Italy, Greece, Iraq to Russia (northern Asia).
How to referenceIn order to correctly reference this scholarly work, feel free to copy and paste the following:
Giovanni Leucci (2012). Ground Penetrating Radar: A Useful Tool for Shallow Subsurface StratigraphyCharacterization, Stratigraphic Analysis of Layered Deposits, Dr. Ömer Elitok (Ed.), ISBN: 978-953-51-0578-7,InTech, Available from: http://www.intechopen.com/books/stratigraphic-analysis-of-layered-deposits/ground-penetrating-radar-a-useful-tool-for-shallow-subsurface-stratigraphy-characterization

© 2012 The Author(s). Licensee IntechOpen. This is an open access articledistributed under the terms of the Creative Commons Attribution 3.0License, which permits unrestricted use, distribution, and reproduction inany medium, provided the original work is properly cited.