Gross-to-Net 101 Branded Pharma Track November … Roadmap & Calculations 101 Branded Pharma Track...
22
Gross-to-Net Roadmap & Calculations 101 Branded Pharma Track November 16, 2016 Murray Kay website: murraythekay.com email:[email protected] 1 Unauthorized use and/or duplication of this material without express and written permission from the author is strictly prohibited
Transcript of Gross-to-Net 101 Branded Pharma Track November … Roadmap & Calculations 101 Branded Pharma Track...
Gross-to-Net Roadmap & Calculations 101Branded Pharma Track
November 16, 2016
Murray Kay website: murraythekay.com
email:[email protected]
1
Unauthorized use and/or duplication of this material without express and written permission from the author is strictly prohibited

GTN Judgment & Estimation Acronyms
2

Murray Kay - Professional Experience
Solvay Pharmaceuticals
• Vice President, Finance & CFO (U.S. Pharmaceuticals)
Abbott & AbbVie
• Commercial Controller – Specialty Care
Developing Customized Seminars:
• Pharmaceutical Gross to Net Sales
• Accounting for Non-Accountants
• Forecasting for the Pharmaceutical Industry
• Enhancing Profitability
Pursuing Board of Directors & Teaching Opportunities
Website: murraythekay.com
email:[email protected]
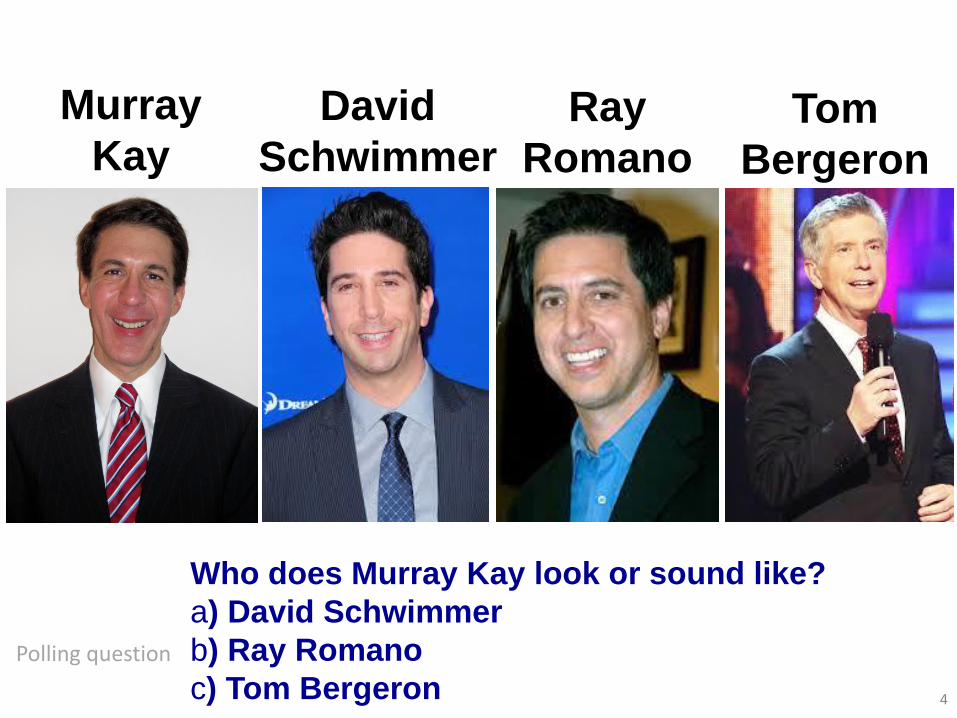
Murray
Kay
4
David
Schwimmer
Ray
RomanoTom
Bergeron
Polling question
Who does Murray Kay look or sound like?
a) David Schwimmer
b) Ray Romano
c) Tom Bergeron

Gross to Net Sales Funnel
5
Gross Sales (volume X AMP)
Chargebacks
Rebates
Vouchers
Co-pay Cards
ReturnsCash
Discounts
Wholesaler Fees
Polling question
PharmaCompany
Wholesaler
Record the following:
•Gross Sales
•GTN adjustments based
on estimated accrual rates
Identify adjustment
with the highest
gross-to-net
reduction.
a) Chargebacks
b) Rebates
c) Vouchers
d) Co-pay cards
e) Returns

U.S. Branded Sales
Rebates as a % of Gross Sales
6
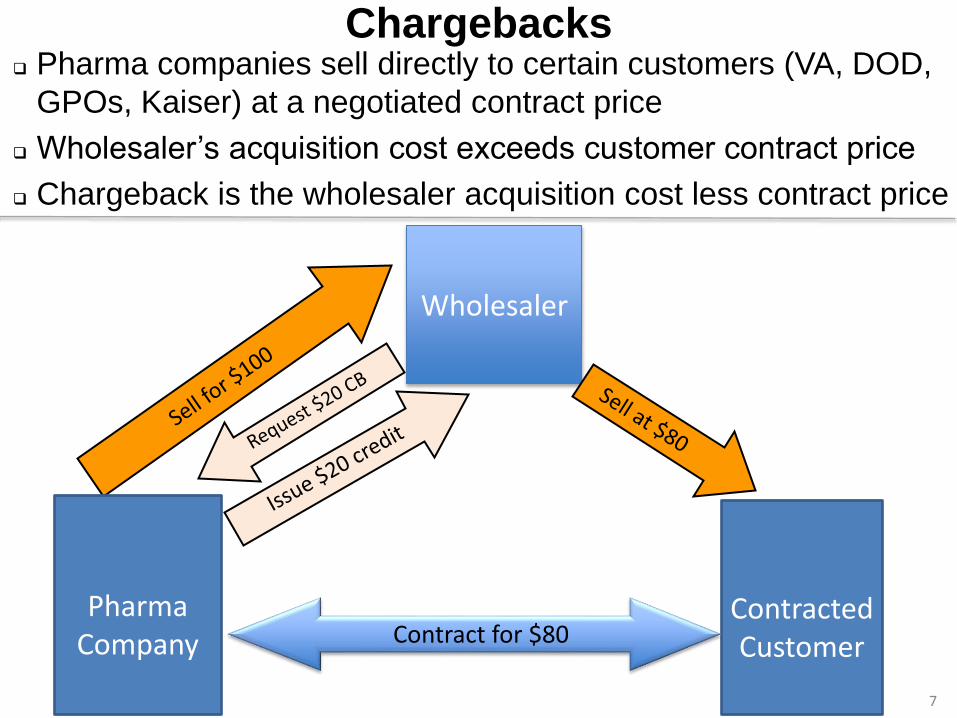
Chargebacks
7
ContractedCustomer
PharmaCompany
Wholesaler
Contract for $80
Pharma companies sell directly to certain customers (VA, DOD,
GPOs, Kaiser) at a negotiated contract price
Wholesaler’s acquisition cost exceeds customer contract price
Chargeback is the wholesaler acquisition cost less contract price

Managed Care/Medicare Part D Rebates
8
Insurers
Payer
PharmaCompany
Wholesaler
Retail or Specialty Pharmacy
Patient
Rebates to payers in exchange for formulary position
50% government rebate required for Medicare participants
in the Part D Coverage Gap known as the Donut Hole

Medicaid Rebates
9
Medicaid provides health coverage to families with low-income,
the indigent, the elderly, & blind and/or disabled
Medicaid Rebate = Basic Rebate + CPI Penalty
+ Supplemental Rebates to States to Get Formulary Access
Basic Rebate is the greater of:
Average Manufacturer’s Price (“AMP”) * 23.1%
or
AMP - Best Price (lowest price offered to eligible customer)
Basic Rebate Simple Definition:
• Greater of 23.1% or highest commercial rebate %
CPI Penalty - additional rebate for price increases greater
than inflation (i.e., current AMP – baseline AMP adjusted for inflation)

Medicaid Rebate Scenarios
Scenario 1 Scenario 2
AMP – January 2010 $1,000 $1,000
CPI-U Dec 2015/CPI-U Dec 2009 1.095 1.095
Baseline AMP With Inflation $1,095 1,095
AMP – March 2016 $1,500 $1,090
CPI Penalty Rebate $405 $0
Lowest Eligible Customer Price $1,050 (30%
rebate or $450)
$900 (17%
rebate or $190)
AMP * 23.1% $347 $252
Basic Rebate $450 $252
Total Rebate $855 $252
% of AMP 57%* 23.1%
Net Price $645 $83810* Before supplemental rebates to states
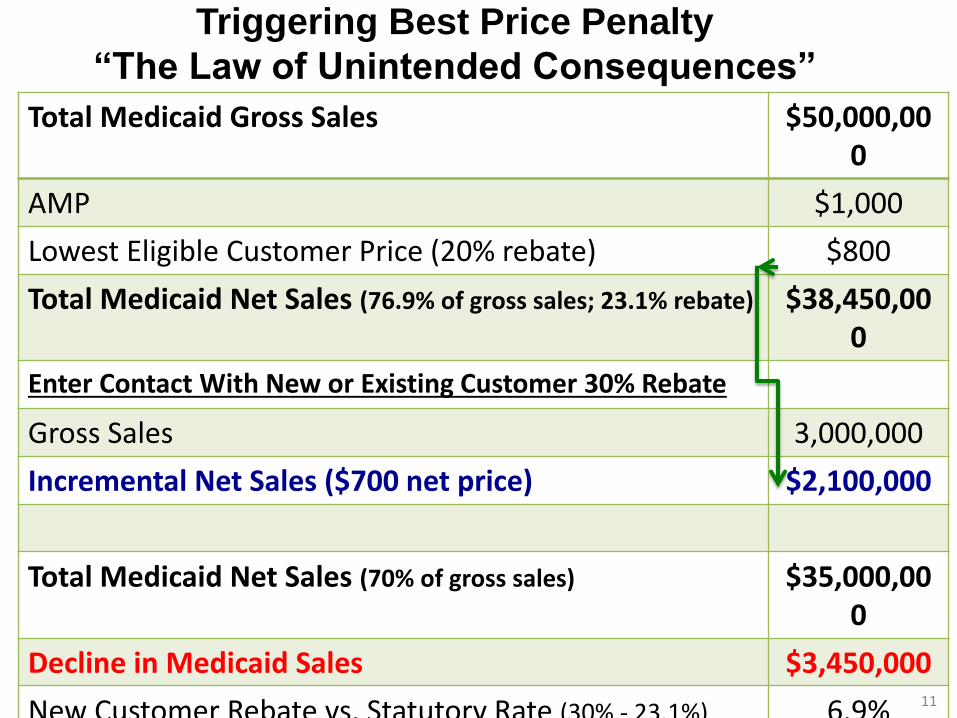
Triggering Best Price Penalty
“The Law of Unintended Consequences”
Total Medicaid Gross Sales $50,000,000
AMP $1,000
Lowest Eligible Customer Price (20% rebate) $800
Total Medicaid Net Sales (76.9% of gross sales; 23.1% rebate) $38,450,000
Enter Contact With New or Existing Customer 30% Rebate
Gross Sales 3,000,000
Incremental Net Sales ($700 net price) $2,100,000
Total Medicaid Net Sales (70% of gross sales) $35,000,000
Decline in Medicaid Sales $3,450,000
New Customer Rebate vs. Statutory Rate (30% - 23.1%) 6.9% 11

Vouchers
Distributed by reps to HCPs
HCPs provide to patients in lieu of samples
Vouchers are redeemed by patient at
pharmacy for free trial product
Gross sales are offset by GTN adjustment
when product is sold to wholesalers based
on estimated redemption rate of vouchers
Accounting treatment for vouchers differs
from samples and patient assistance
12

Co-Pay Cards (excludes government programs)
Distributed to consumers via doctors and
pharmacists & can also be obtained online
Co-pay cards are redeemed by patient at
pharmacy to reduce out-of-pocket costs
• Amount of patient co-pay/deductible reduction is usually capped
Gross sales are reduced based on estimated redemption
rate and average patient cost reduction
Co-pay/deductible reductions are higher in the first quarter
• Higher out-of-pocket costs incurred by patient until deductible is
reached
13
Patient Deductible
Patient Cost After Deductible
Maximum Patient Cost Reduction
$1,000 $100 $500
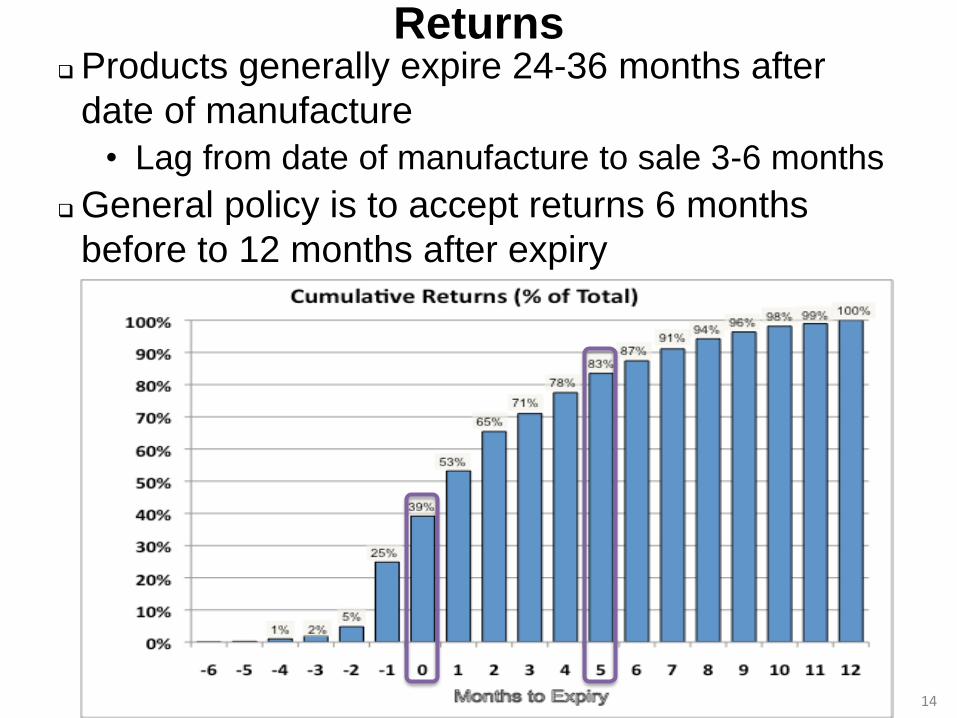
Returns Products generally expire 24-36 months after
date of manufacture
• Lag from date of manufacture to sale 3-6 months
General policy is to accept returns 6 months
before to 12 months after expiry
14

Accounting for Returns
Estimate liability based on anticipated returns of
product sold
Liability for returns is difficult to estimate due to:
• Significant time lag
• Limited data on age of retail inventory
• Marketplace dynamics/lifecycle events
• Lack of historical data for launch products
15

Liability for Rebates
Payer Claims Pipelinea
16
Average Weekly Forecasted Rebates * ~ 2 weeks)
Invoice Received Not Paid
Prescription Dispensed Invoice Not Received (lag)
True-up for difference between invoices
received & previously forecasted rebates
Adjust pipeline for changes in:- Inventory levels - Forecasted demand- Formulary position - Rebate %- Channel mix
a Excludes inventory anticipated to be returned
j
k
No rebate accruals required
on portion of gross sales
determined to be returned
l
m
Average Weekly Forecasted
Rebates * ~ 1-5 weeks
Insurers
Payer
PharmaCompany
Wholesaler
Retail or Specialty Pharmacy
Patient
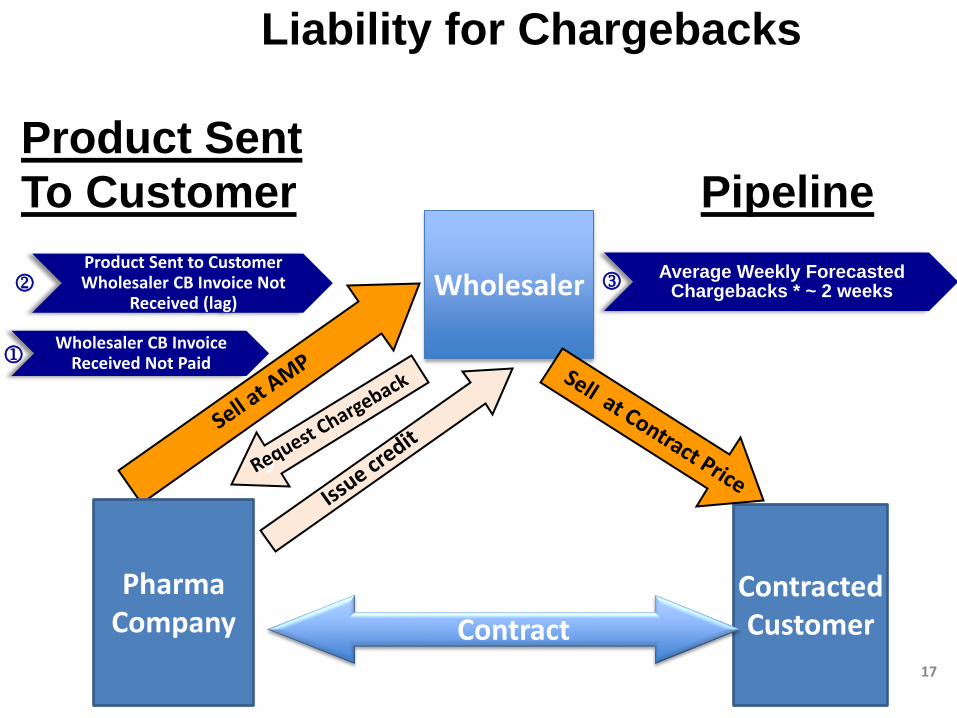
Liability for Chargebacks
Product Sent
To Customer Pipeline
Average Weekly Forecasted Chargebacks * ~ 2 weeks
Wholesaler CB Invoice Received Not Paid
Product Sent to Customer Wholesaler CB Invoice Not
Received (lag)
17
ContractedCustomer
PharmaCompany
Wholesaler
Contract
l
j
k
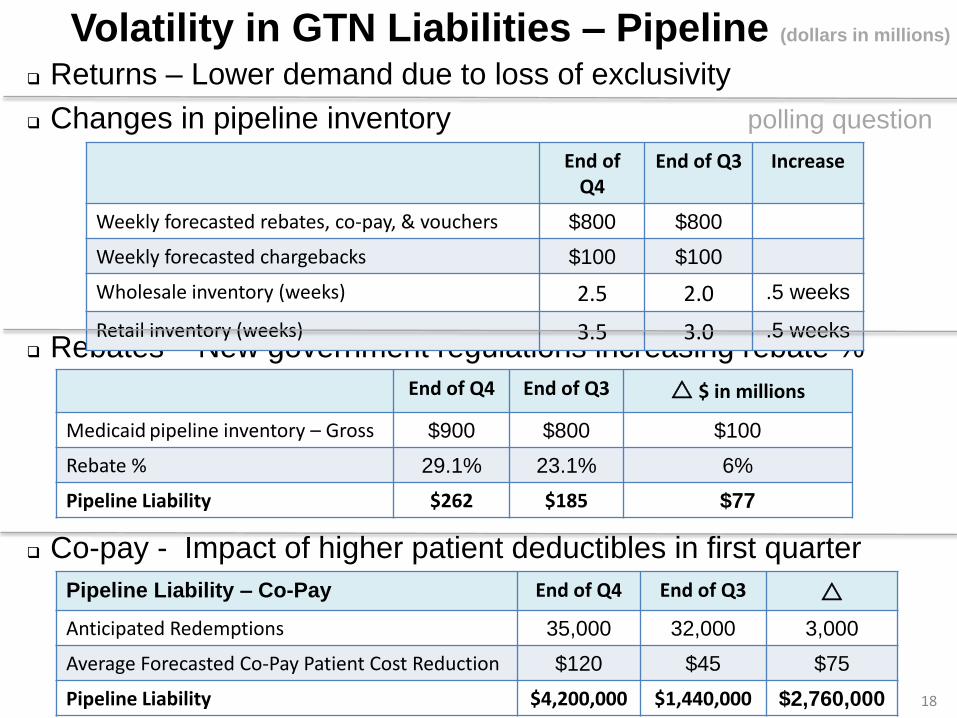
Volatility in GTN Liabilities – Pipeline (dollars in millions)
Returns – Lower demand due to loss of exclusivity
Changes in pipeline inventory polling question
Rebates – New government regulations increasing rebate %
Co-pay - Impact of higher patient deductibles in first quarter
18
End of Q4
End of Q3 Increase
Weekly forecasted rebates, co-pay, & vouchers $800 $800
Weekly forecasted chargebacks $100 $100
Wholesale inventory (weeks) 2.5 2.0 .5 weeks
Retail inventory (weeks) 3.5 3.0 .5 weeks
End of Q4 End of Q3 r $ in millions
Medicaid pipeline inventory – Gross $900 $800 $100
Rebate % 29.1% 23.1% 6%
Pipeline Liability $262 $185 $77
Pipeline Liability – Co-Pay End of Q4 End of Q3 r
Anticipated Redemptions 35,000 32,000 3,000
Average Forecasted Co-Pay Patient Cost Reduction $120 $45 $75
Pipeline Liability $4,200,000 $1,440,000 $2,760,000

Gross-to-Net Estimation Challenges
New product launches
Changes in government regulations
Formulary changes & contract amendments
Outcomes-based contracts & pricing
True-ups for differences between actual & forecasted:
• Channel mix
• Utilization among payers & shifts in lives
• Rebate rates within a channel
Availability of retail & specialty pharmacy pipeline
channel inventory data
Product loss of exclusivity
19

Gross-to-Net Estimation Collaboration
20
Accounting
Forecasting & Demand Planning
Finance
Sales & Marketing
Managed Care
Pricing
Legal
Contract Management

Channel Summary (dollars in millions)
21
Progesterone Product Hepatitis C Product
% of
Business
Gross
Sales
Rebate/Di
scount
% of Gross
Net
Sales
% of
Business
Gross
Sales
Rebate/D
iscount
% of Gross
Net
Sales
Managed
Care 77% 95 -18 -19% 77 59% 462 -168 -36% 294
Medicaid 3% 4 -3 -75% 1 23% 180 -135 -75% 45
VA/DOD/PHS
/Kaiser 5% 6 -4 -67% 2 12% 90 -66 -73% 24
Non-
Contracted 15% 18 0 18 6% 48 0 48
Returns -3 -3 -12 -12
Co-pay Cards 0 0 -3 -3
Cash
Discount -2 -2 -16 -16
Total 100% 123 -30 -25% 93 100% 780 -400 -51% 380
Polling question
Gross-to-Net Roadmap & Calculations - Summary
GTN is complex & volatile
• True-up adjustments can be significant
Accrue GTN adjustments when product is sold based
on channel mix & rebate rates
Commercial rebates can adversely impact Medicaid
Patient cost reductions are higher during the first
quarter until patient deductibles are satisfied
• Q4 pipeline liability is higher
Product returns spike after LOE
Pipeline liability is adjusted based on revised:
• Forecasted demand, rebates, mix & inventory levels
Cross-functional collaboration is paramount 22