Gross plastic deformation of axisymmetric pressure vessel ...
41
1 Gross plastic deformation of axisymmetric pressure vessel heads Duncan Camilleri • , Robert Hamilton and Donald Mackenzie Department of Mechanical Engineering, University of Strathclyde, 75 Montrose Street, Glasgow, Scotland, UK Abstract: The gross plastic deformation and associated plastic loads of four axisymmetric torispherical pressure vessels is determined by two criteria of plastic collapse: the ASME Twice Elastic Slope TES criterion and the recently proposed Plastic Work Curvature PWC criterion. Finite element analysis was performed assuming small and large deformation theory and elastic-perfectly plastic and bilinear kinematic hardening material models. Two plastic collapse modes are identified: bending dominated plastic collapse of the knuckle region, in small deformation models and membrane dominated plastic collapse of the cylinder or domed end, in large deformation models. In both circumstances, the PWC criterion indicates that a plastic hinge bending mechanism leads to gross plastic deformation and is used as a parameter to identify the respective plastic loads. The results of the analyses also show that the PWC criterion leads to higher design loads for strain hardening structures than the TES criterion, as the criterion takes account of the effect of strain hardening on the evolution of the gross plastic deformation mechanism. • Corresponding author: Department of Mechanical Engineering, University of Strathclyde, James Weir Building, 75 Montrose Street, Glasgow G1 1XJ; Email: [email protected], Fax: +44 (0) 141 552 5105 brought to you by CORE View metadata, citation and similar papers at core.ac.uk provided by OAR@UM
Transcript of Gross plastic deformation of axisymmetric pressure vessel ...
1
Gross plastic deformation of axisymmetric pressure
vessel heads
Duncan Camilleri•, Robert Hamilton and Donald Mackenzie
Department of Mechanical Engineering, University of Strathclyde, 75 Montrose
Street, Glasgow, Scotland, UK
Abstract: The gross plastic deformation and associated plastic loads of four
axisymmetric torispherical pressure vessels is determined by two criteria of plastic
collapse: the ASME Twice Elastic Slope TES criterion and the recently proposed
Plastic Work Curvature PWC criterion. Finite element analysis was performed
assuming small and large deformation theory and elastic-perfectly plastic and bilinear
kinematic hardening material models. Two plastic collapse modes are identified:
bending dominated plastic collapse of the knuckle region, in small deformation
models and membrane dominated plastic collapse of the cylinder or domed end, in
large deformation models. In both circumstances, the PWC criterion indicates that a
plastic hinge bending mechanism leads to gross plastic deformation and is used as a
parameter to identify the respective plastic loads. The results of the analyses also
show that the PWC criterion leads to higher design loads for strain hardening
structures than the TES criterion, as the criterion takes account of the effect of strain
hardening on the evolution of the gross plastic deformation mechanism.
• Corresponding author: Department of Mechanical Engineering, University of Strathclyde, James Weir
Building, 75 Montrose Street, Glasgow G1 1XJ; Email: [email protected], Fax: +44 (0) 141
552 5105
brought to you by COREView metadata, citation and similar papers at core.ac.uk
provided by OAR@UM
2
Keywords: Gross plastic deformation, plastic load, criterion of plastic collapse,
axisymmetric torispherical pressure vessel heads, inelastic finite element analysis.
Notation:
D Cylindrical outer diameter (m)
L Modelled length of cylinder (m)
Lc Conical transition length (m)
Pφ Plastic load – TES criterion
R Circumradius of a triangle (m)
Rs Sphere radius (m)
r Knuckle radius (m)
S Semiperimeter of a triangle (m)
Sm Design stress (MN/m2)
t Sphere thickness (m)
tc Cylinder thickness (m)
φ Semi-angle of spherical portion (°)
λ Load parameter
λp Plastic load – PW criterion
σy Yield strength (MN/m2)
1. INTRODUCTION
Gross Plastic Deformation, GPD, is the basic static failure mechanism considered in
Design by Analysis, DBA, of ductile pressure vessels. The wall thickness of the vessel
must be great enough to ensure that GPD does not occur under the specified
3
mechanical design loads. This is most commonly achieved through linear elastic
stress analysis of the design configuration followed by application of a stress
classification procedure defined in Codes and Standards such as PD5500 Unfired
fusion welded pressure vessels [1], ASME Boiler & Pressure Vessel Code Sections III
and VIII [2] and EN 13445-3:2002 Unfired pressure vessels [3]. In design, GPD is
prevented by limiting the allowable primary stress calculated in the elastic analysis.
The definition of primary stress and specified allowable loads are determined through
elastic analysis according to the principles of limit analysis [4]. Alternatively, the
allowable load may be calculated by performing an actual (inelastic) limit analysis of
the vessel and restricting the design load to a fraction of the limit load, following
procedures given in references [1, 2, 3]. Both of these approaches assume that the
vessel material is ductile and is represented by a rigid-perfectly plastic or elastic-
perfectly plastic material model. The effect of strain hardening on the load carrying
capacity of the vessel is not included in either elastic or limit analysis, although it is
considered in the specification of design stress in [1] and [2], and through a partial
safety factor in reference [3], as discussed in reference [5]. The ASME Code provides
a design route based on elastic-plastic analysis which may include a strain hardening
material model, through which the design load is restricted to a fraction of the
specified “plastic” load. The plastic load is found by applying a criterion of plastic
collapse to a characteristic load-deformation curve for the vessel obtained from
elastic-plastic analysis.
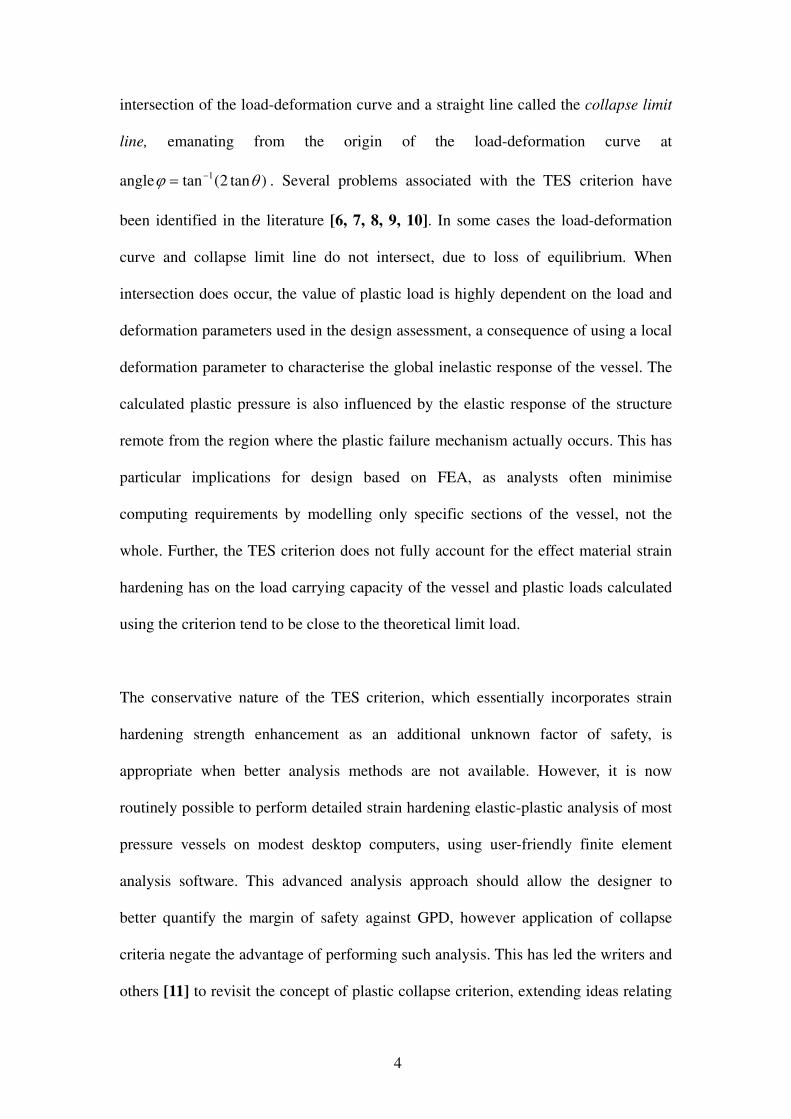
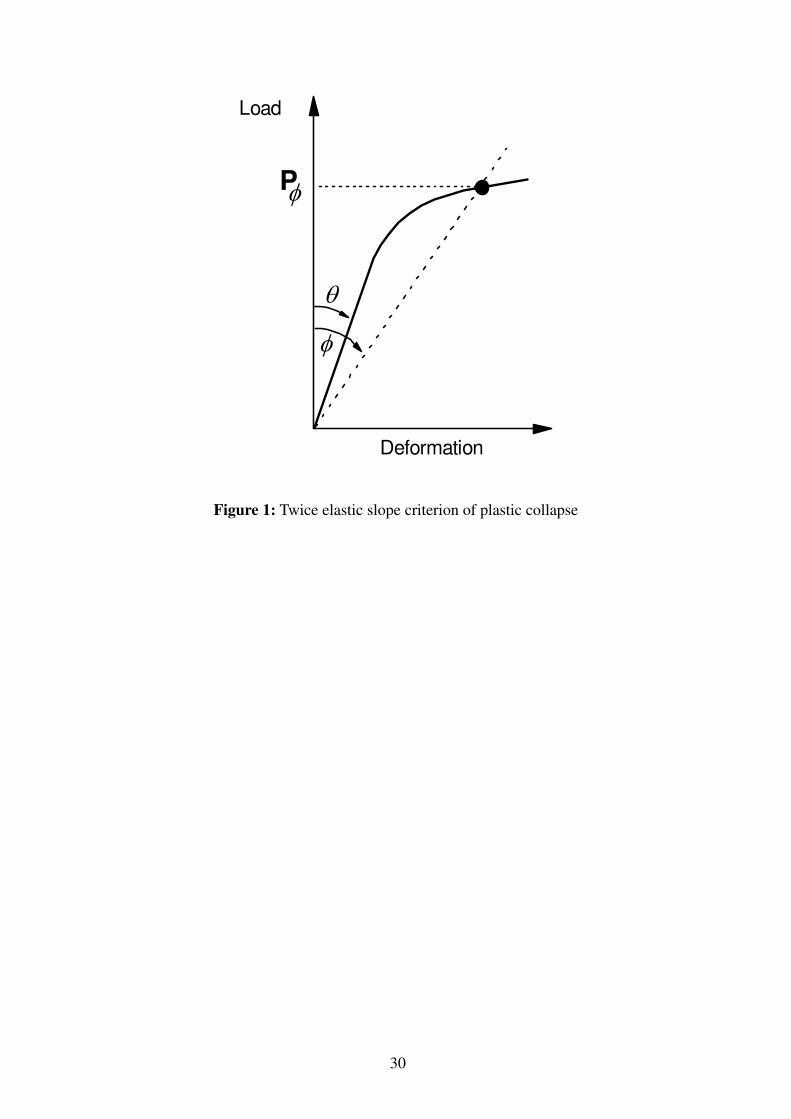
The ASME Twice Elastic Slope (TES), criterion is based on an empirical procedure
for calculating collapse loads in experimental stress analysis of pressure vessels and is
illustrated in Figure 1. The plastic load, Pφ, is the load corresponding to the
4
intersection of the load-deformation curve and a straight line called the collapse limit
line, emanating from the origin of the load-deformation curve at
angle )tan2(tan 1 θϕ −= . Several problems associated with the TES criterion have
been identified in the literature [6, 7, 8, 9, 10]. In some cases the load-deformation
curve and collapse limit line do not intersect, due to loss of equilibrium. When
intersection does occur, the value of plastic load is highly dependent on the load and
deformation parameters used in the design assessment, a consequence of using a local
deformation parameter to characterise the global inelastic response of the vessel. The
calculated plastic pressure is also influenced by the elastic response of the structure
remote from the region where the plastic failure mechanism actually occurs. This has
particular implications for design based on FEA, as analysts often minimise
computing requirements by modelling only specific sections of the vessel, not the
whole. Further, the TES criterion does not fully account for the effect material strain
hardening has on the load carrying capacity of the vessel and plastic loads calculated
using the criterion tend to be close to the theoretical limit load.
The conservative nature of the TES criterion, which essentially incorporates strain
hardening strength enhancement as an additional unknown factor of safety, is
appropriate when better analysis methods are not available. However, it is now
routinely possible to perform detailed strain hardening elastic-plastic analysis of most
pressure vessels on modest desktop computers, using user-friendly finite element
analysis software. This advanced analysis approach should allow the designer to
better quantify the margin of safety against GPD, however application of collapse
criteria negate the advantage of performing such analysis. This has led the writers and
others [11] to revisit the concept of plastic collapse criterion, extending ideas relating
5
plastic collapse to plastic dissipation in the vessel proposed by Gerdeen in [6].
Gerdeen proposed that the relationship between the formation of the plastic failure
mechanisms and the plastic work dissipated in the vessel could provide a rational
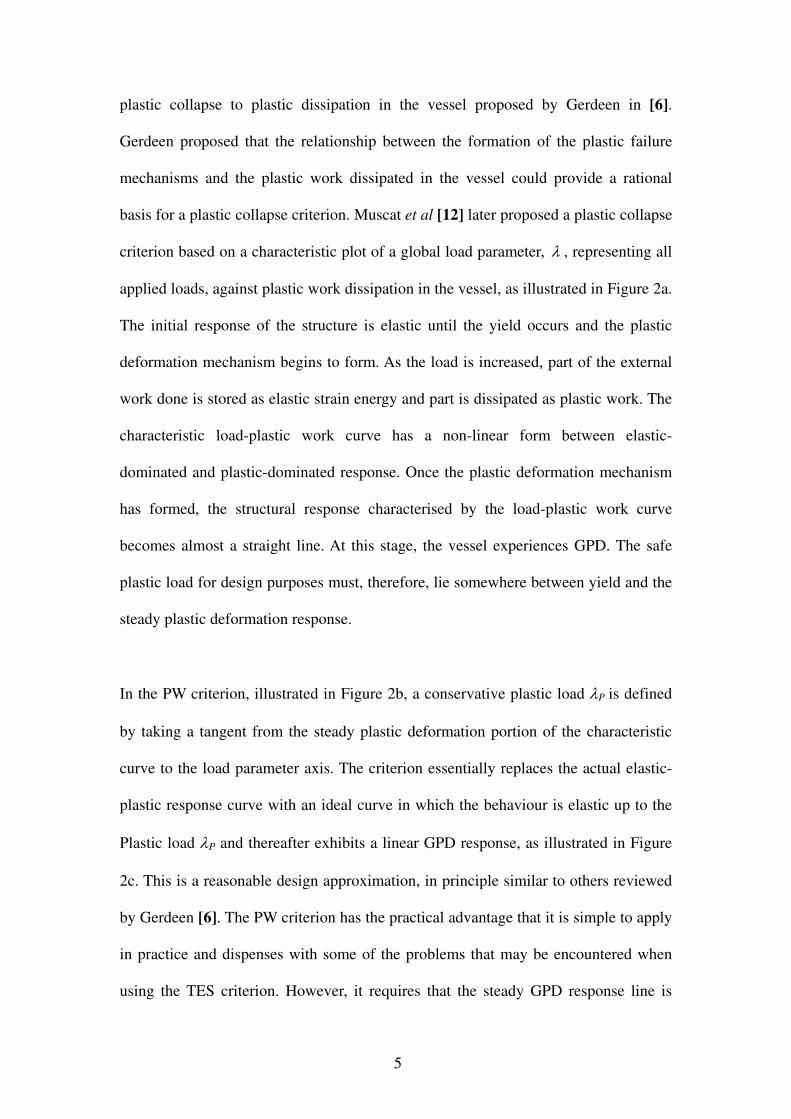
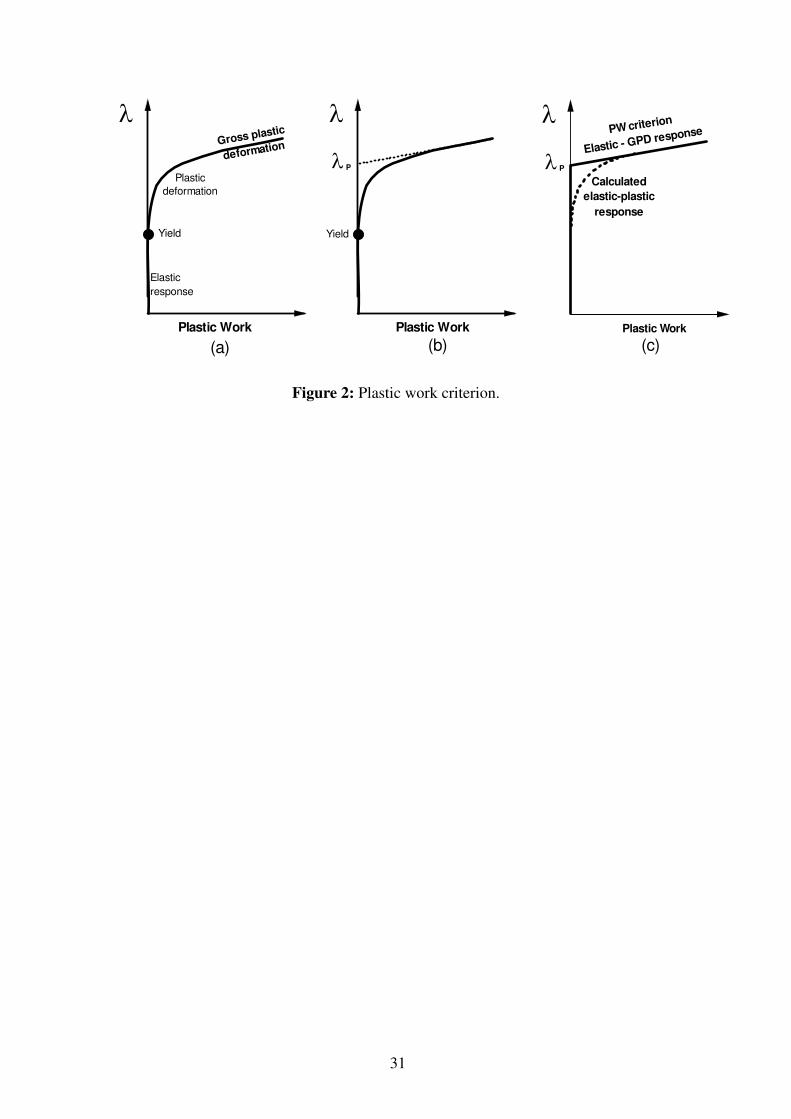
basis for a plastic collapse criterion. Muscat et al [12] later proposed a plastic collapse
criterion based on a characteristic plot of a global load parameter, λ , representing all
applied loads, against plastic work dissipation in the vessel, as illustrated in Figure 2a.
The initial response of the structure is elastic until the yield occurs and the plastic
deformation mechanism begins to form. As the load is increased, part of the external
work done is stored as elastic strain energy and part is dissipated as plastic work. The
characteristic load-plastic work curve has a non-linear form between elastic-
dominated and plastic-dominated response. Once the plastic deformation mechanism
has formed, the structural response characterised by the load-plastic work curve
becomes almost a straight line. At this stage, the vessel experiences GPD. The safe
plastic load for design purposes must, therefore, lie somewhere between yield and the
steady plastic deformation response.
In the PW criterion, illustrated in Figure 2b, a conservative plastic load λP is defined
by taking a tangent from the steady plastic deformation portion of the characteristic
curve to the load parameter axis. The criterion essentially replaces the actual elastic-
plastic response curve with an ideal curve in which the behaviour is elastic up to the
Plastic load λP and thereafter exhibits a linear GPD response, as illustrated in Figure
2c. This is a reasonable design approximation, in principle similar to others reviewed
by Gerdeen [6]. The PW criterion has the practical advantage that it is simple to apply
in practice and dispenses with some of the problems that may be encountered when
using the TES criterion. However, it requires that the steady GPD response line is
6
applied at the appropriate point on the characteristic curve, and the rational for this
choice is perhaps subjective.
The plastic work criterion approach as proposed offers practical advantages in design.
The method also incorporates a model of elastic plastic response, purely elastic
changing to GPD at the plastic load, that provides some justification for the specified
plastic load. However, this justification is crude and does not account for the physical
processes that actually occur as the behaviour changes from elastic to grossly plastic.
A more detailed investigation of the transition from elastic to gross plastic response
has recently been presented by Li & Mackenzie [13, 14]. They proposed an
interpretation of the load-plastic work characteristic curve that directly relates the
formation of the gross plastic deformation mechanism to the curvature of the
characteristic load-plastic work curve.
When a strain hardening structure is loaded beyond yield, the stress distribution
changes from elastic to elastic-plastic. As the load increases, further stress
redistribution occurs as the plastic strain spreads through the thickness of the vessel.
Stress redistribution continues with increasing load until a stable or constant elastic-
plastic stress distribution is achieved and no further stress redistribution occurs with
increasing load. This is analogous to the limit state when the material is elastic-
perfectly plastic. The work done on the structure after the plastic mechanism forms
must be either stored as strain energy in the elastic regions of the vessel or be
dissipated through gross plastic straining of the established plastic regions (unless a
new plastic deformation mechanism forms in the previously elastic region). In effect,
any increase in load causes the magnitude, but not the distribution, of plastic strain to
7
change. The vessel therefore experiences gross plastic deformation and the
corresponding pressure is the gross plastic deformation pressure, PGPD, of the vessel.
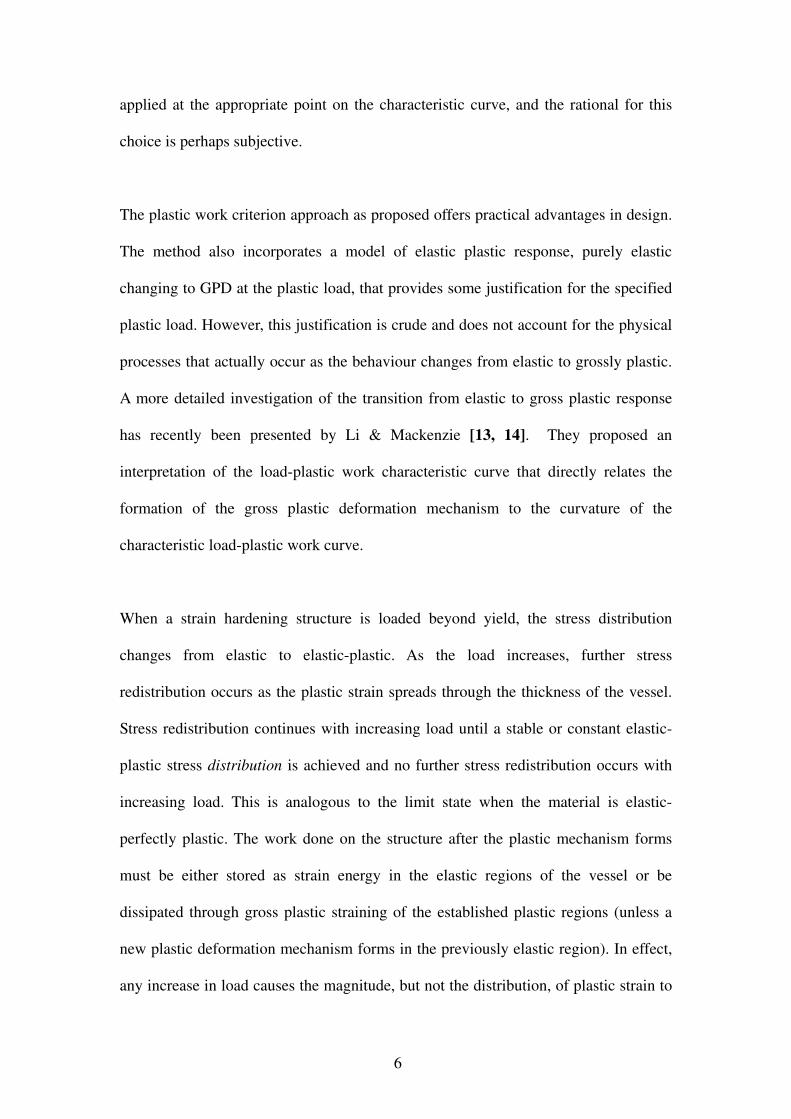
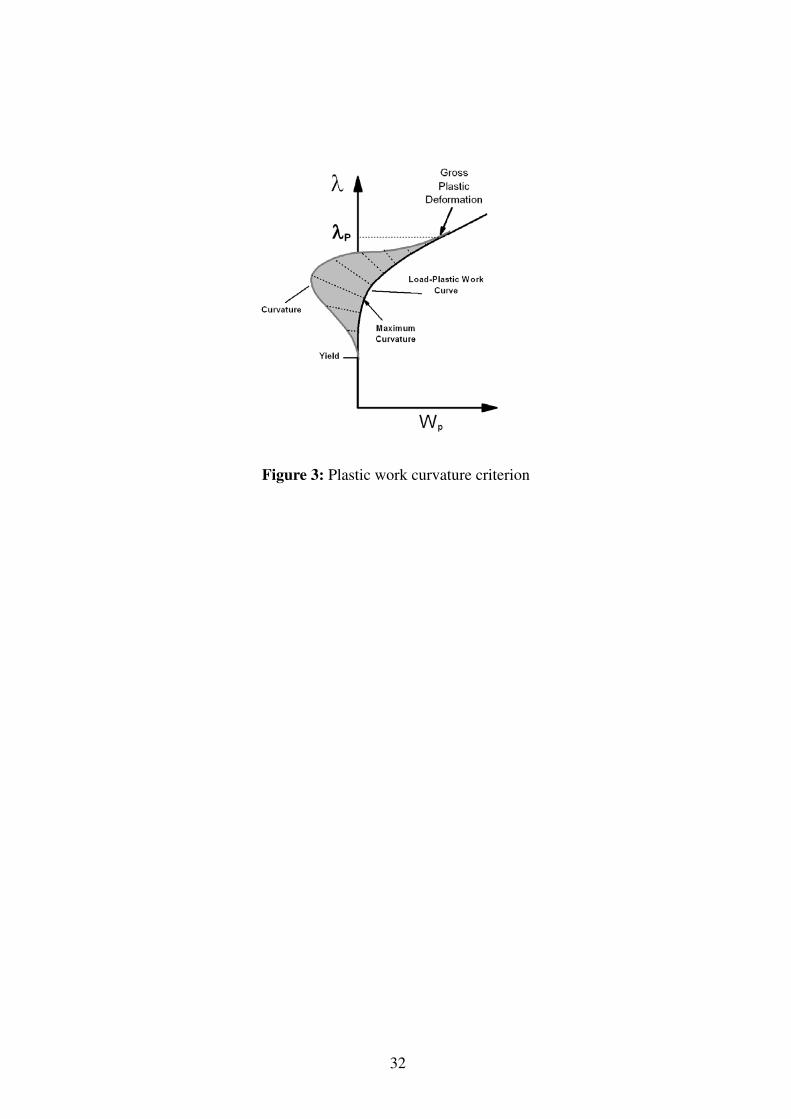
This response can be identified by considering the curvature of the characteristic load-
plastic work curve, as illustrated in Figure 3. The curvature of the plot characterizes
how plastic stress redistribution occurs as the load is increased. In the elastic region,
the curvature is zero. Post yield, plastic stress redistribution occurs and the Plastic
Work Curvature, PWC, increases to a maximum as the plastic deformation
mechanism develops. The maximum stress redistribution occurs at the load
corresponding to the maximum PWC, where after it begins to decrease as the plastic
deformation mechanism is established. When the PWC reaches a minimum constant
or zero value, relatively little or no further plastic stress redistribution occurs in the
vessel unless a second plastic deformation mechanism is initiated in a formerly elastic
region. At this stage the structure exhibits constant or gross plastic deformation and,
in the PWC criterion, the corresponding load is designated the plastic load for DBA.
In this paper, the PWC criterion is used to investigate the elastic-plastic behaviour of
four torispherical pressure vessel heads. Torispherical ends are known to experience
complex plastic deformation prior to failure, with the formation of plastic-hinge
bending mechanisms in the knuckle and membrane plastic deformation in the crown
and cylinder. The aim of the investigation is to establish if the PWC criterion
adequately represents these complex deformations and is an appropriate method for
calculating plastic pressures.
2. ANSLYSIS OF TORISPHERICAL VESSELS
In this paper, the PWC criterion is applied to four thick or intermediate thickness
8
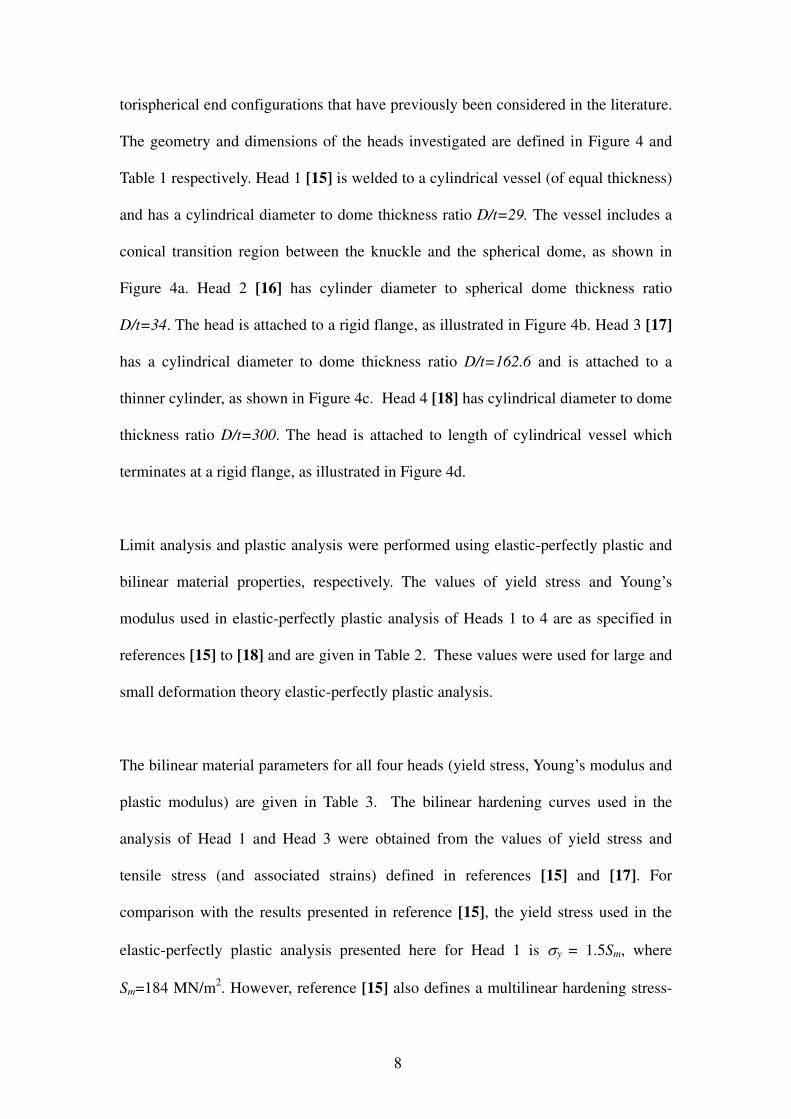
torispherical end configurations that have previously been considered in the literature.
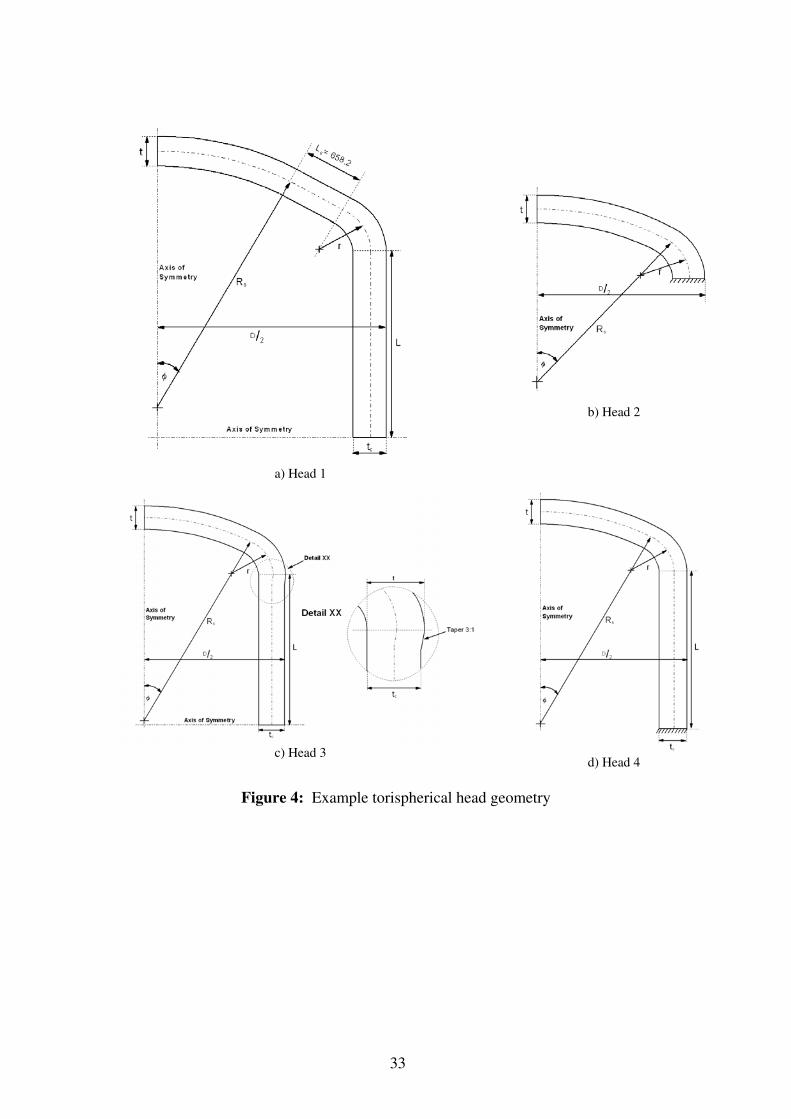
The geometry and dimensions of the heads investigated are defined in Figure 4 and
Table 1 respectively. Head 1 [15] is welded to a cylindrical vessel (of equal thickness)
and has a cylindrical diameter to dome thickness ratio D/t=29. The vessel includes a
conical transition region between the knuckle and the spherical dome, as shown in
Figure 4a. Head 2 [16] has cylinder diameter to spherical dome thickness ratio
D/t=34. The head is attached to a rigid flange, as illustrated in Figure 4b. Head 3 [17]
has a cylindrical diameter to dome thickness ratio D/t=162.6 and is attached to a
thinner cylinder, as shown in Figure 4c. Head 4 [18] has cylindrical diameter to dome
thickness ratio D/t=300. The head is attached to length of cylindrical vessel which
terminates at a rigid flange, as illustrated in Figure 4d.
Limit analysis and plastic analysis were performed using elastic-perfectly plastic and
bilinear material properties, respectively. The values of yield stress and Young’s
modulus used in elastic-perfectly plastic analysis of Heads 1 to 4 are as specified in
references [15] to [18] and are given in Table 2. These values were used for large and
small deformation theory elastic-perfectly plastic analysis.
The bilinear material parameters for all four heads (yield stress, Young’s modulus and
plastic modulus) are given in Table 3. The bilinear hardening curves used in the
analysis of Head 1 and Head 3 were obtained from the values of yield stress and
tensile stress (and associated strains) defined in references [15] and [17]. For
comparison with the results presented in reference [15], the yield stress used in the
elastic-perfectly plastic analysis presented here for Head 1 is σy = 1.5Sm, where
Sm=184 MN/m2. However, reference [15] also defines a multilinear hardening stress-
9
strain model based on stress-strain data for use in plastic analysis. This data indicates
a value of yield stress considerably greater than 1.5Sm (276 MN/m2), specifically 370
MN/m2. To allow direct comparison with the plastic analysis results presented in [15],
this higher value of yield was used in the plastic analysis bilinear hardening model for
Head 1. Insufficient data was given in References [16] and [18] to determine a plastic
modulus for Heads 2 and 4. In this study, the elasto-plastic material data of austenitic
steel, X2CrNiN810, given in reference [17] was used to establish a plastic modulus of
1GN/m2, for Heads 2, 3 and 4.
3 Finite Element Modelling
Finite element analysis was performed using the ANSYS program [19]. Small and
large deformation theory analyses were performed for elastic-perfectly plastic and
bilinear hardening material models, such that four different types of analysis were
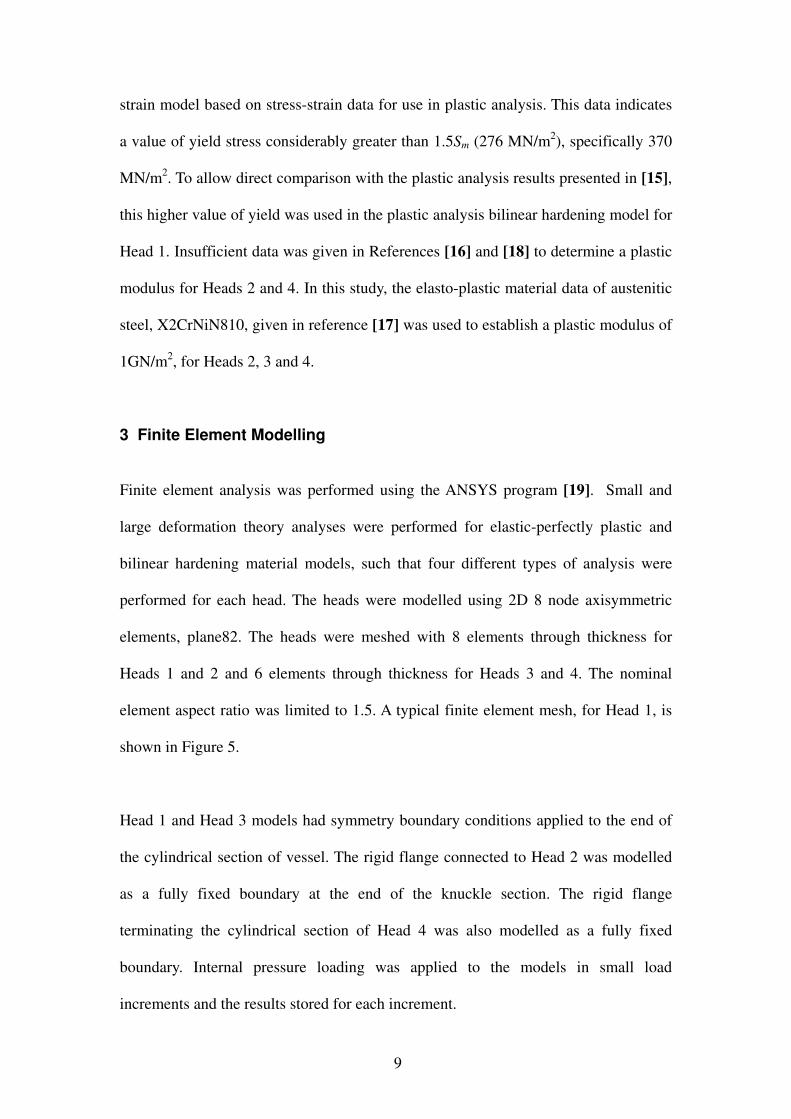
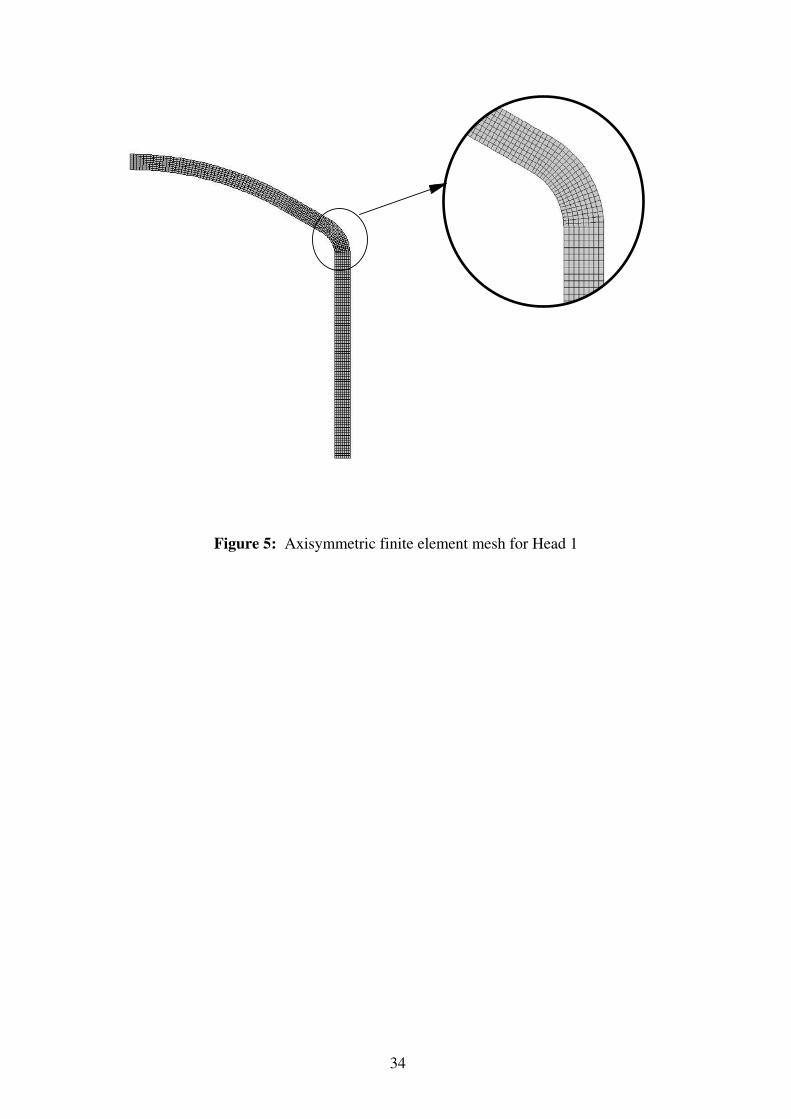
performed for each head. The heads were modelled using 2D 8 node axisymmetric
elements, plane82. The heads were meshed with 8 elements through thickness for
Heads 1 and 2 and 6 elements through thickness for Heads 3 and 4. The nominal
element aspect ratio was limited to 1.5. A typical finite element mesh, for Head 1, is
shown in Figure 5.
Head 1 and Head 3 models had symmetry boundary conditions applied to the end of
the cylindrical section of vessel. The rigid flange connected to Head 2 was modelled
as a fully fixed boundary at the end of the knuckle section. The rigid flange
terminating the cylindrical section of Head 4 was also modelled as a fully fixed
boundary. Internal pressure loading was applied to the models in small load
increments and the results stored for each increment.
10
4 Results
The structural response of the vessel was investigated in three ways: graphical
representation of the evolution of the gross plastic deformation in terms of equivalent
plastic strain contour plots, TES criterion load-deformation plots and PWC criterion
load-PWC plots. Two deformation parameters were used in the TES criterion for all
the Heads: the radial displacement at the middle of the knuckle and the vertical
displacement at the crown. In addition, the radial displacement of the Head 3 cylinder
(at the symmetry end) was investigated for comparison with published results.
The PWC criterion requires a plot of load against normalised load-plastic work
curvature. The load-PWC plot may be created from the numerical results of the FE
analysis using any suitable external plotting and graphing program. In references [13]
and [14], spline fitting was applied to the FE data using the commercial program ProE
to generate normalised PWC plots superimposed on the load-plastic work curve, as
shown in Figure 3. Here, the normalised PWC is plotted against applied pressure
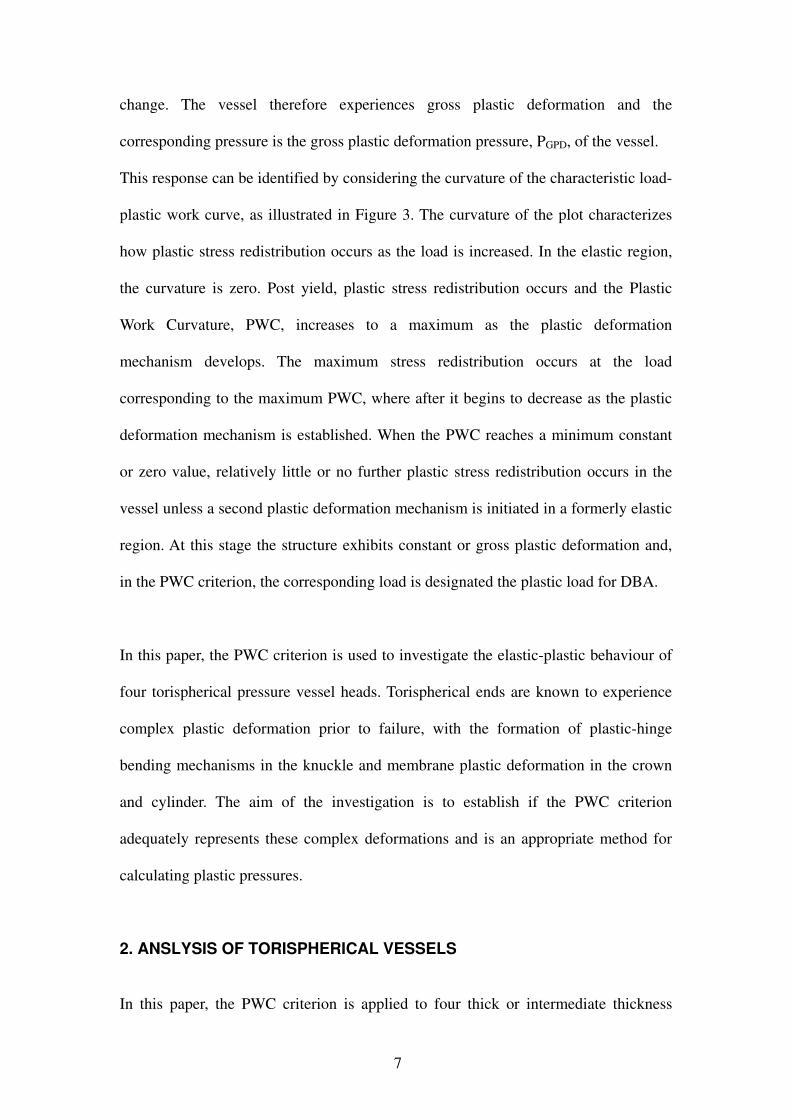
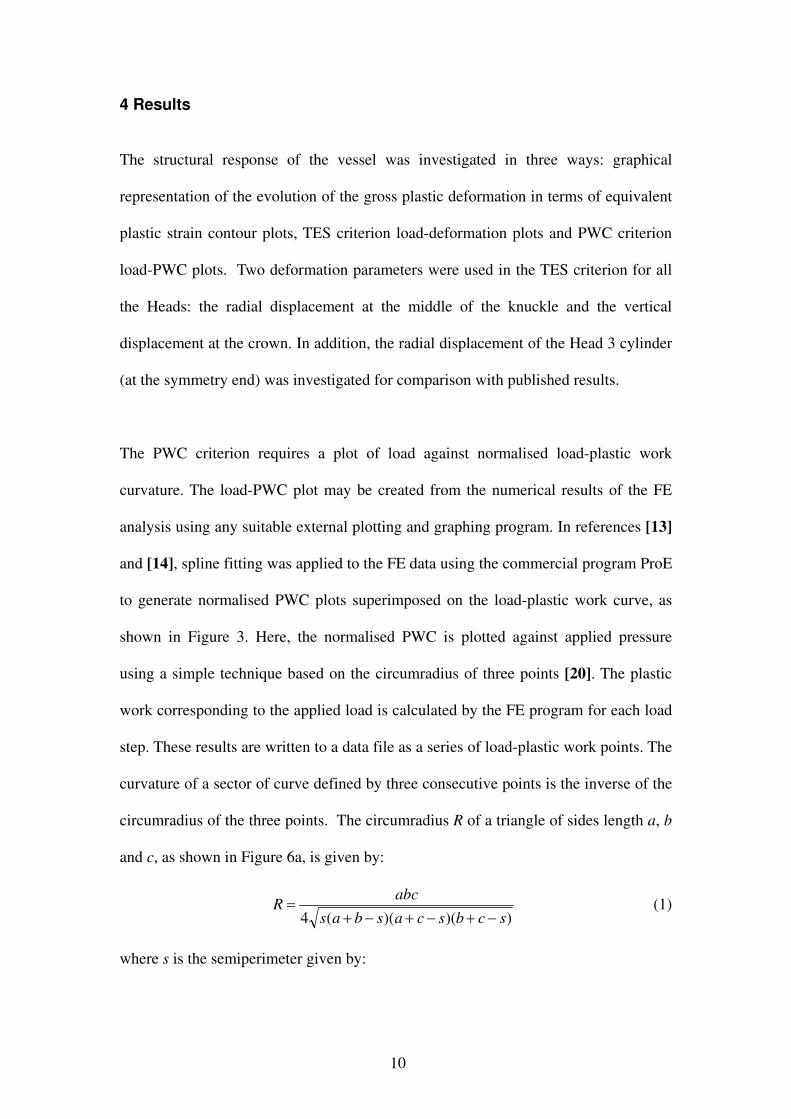
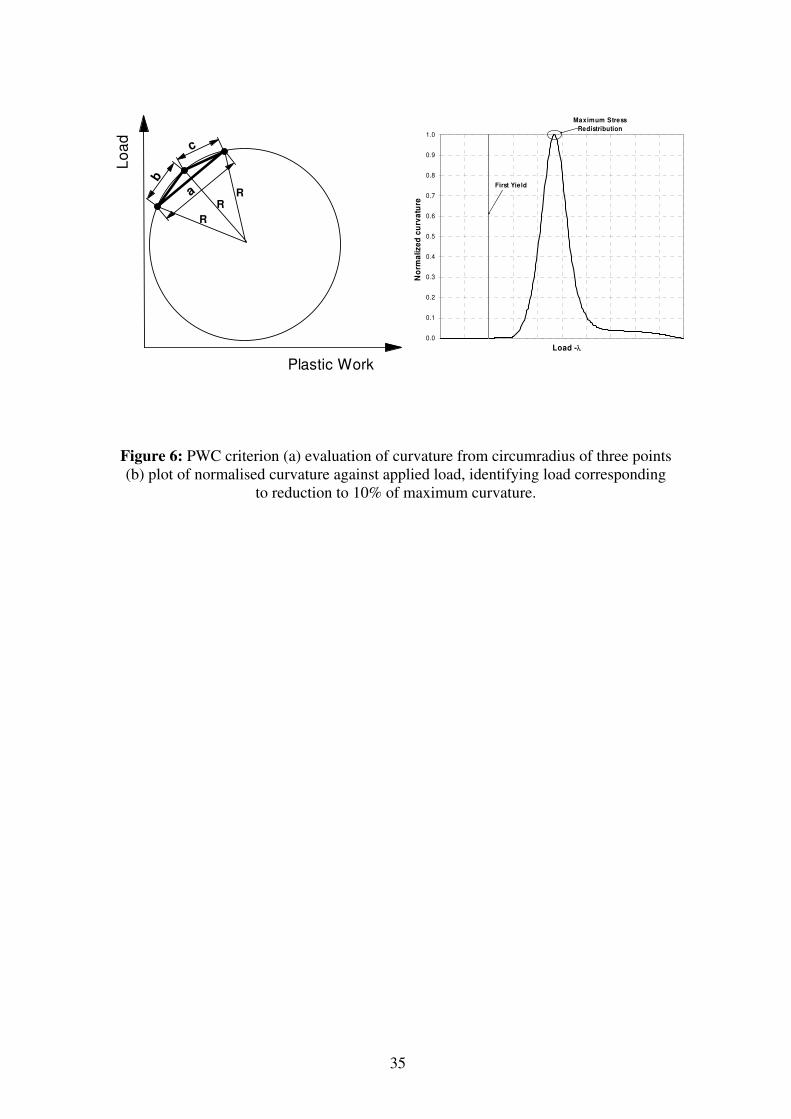
using a simple technique based on the circumradius of three points [20]. The plastic
work corresponding to the applied load is calculated by the FE program for each load
step. These results are written to a data file as a series of load-plastic work points. The
curvature of a sector of curve defined by three consecutive points is the inverse of the
circumradius of the three points. The circumradius R of a triangle of sides length a, b
and c, as shown in Figure 6a, is given by:
))()((4 scbscasbas
abcR
−+−+−+= (1)
where s is the semiperimeter given by:
11
2
cbas
++= (2)
The accuracy of the results depends on the number of load steps used and results
saved in the analysis. Excessively large load steps between adjacent points could lead
to inaccurate interpretation of the curvature. Figure 6b shows a plot of PWC against
load created using the circumradius method. In the plot, the PWC is normalised with
respect to the maximum value of PWC calculated in the analysis.
4.1 Head 1
Plastic deformation of Head 1 initiates at the inside surface of the knuckle. In the
small deformation elastic-perfectly plastic analyses, first yield occurs at 7.2 MN/m2. A
second plastic zone initiates at the outside surface of the cone-sphere intersection at
18 MN/m2. Both plastic zones continue to develop through the thickness of the
pressure vessel with increasing load. A third highly localised, plastic zone also occurs
at the outside surface of the cylindrical region at 21.3 MN/m2, just prior to limit
collapse. The third zone does not significantly affect the collapse mechanism, which
is essentially a 2 plastic hinge bending mechanism at the limit load of 21.6 MN/m2.
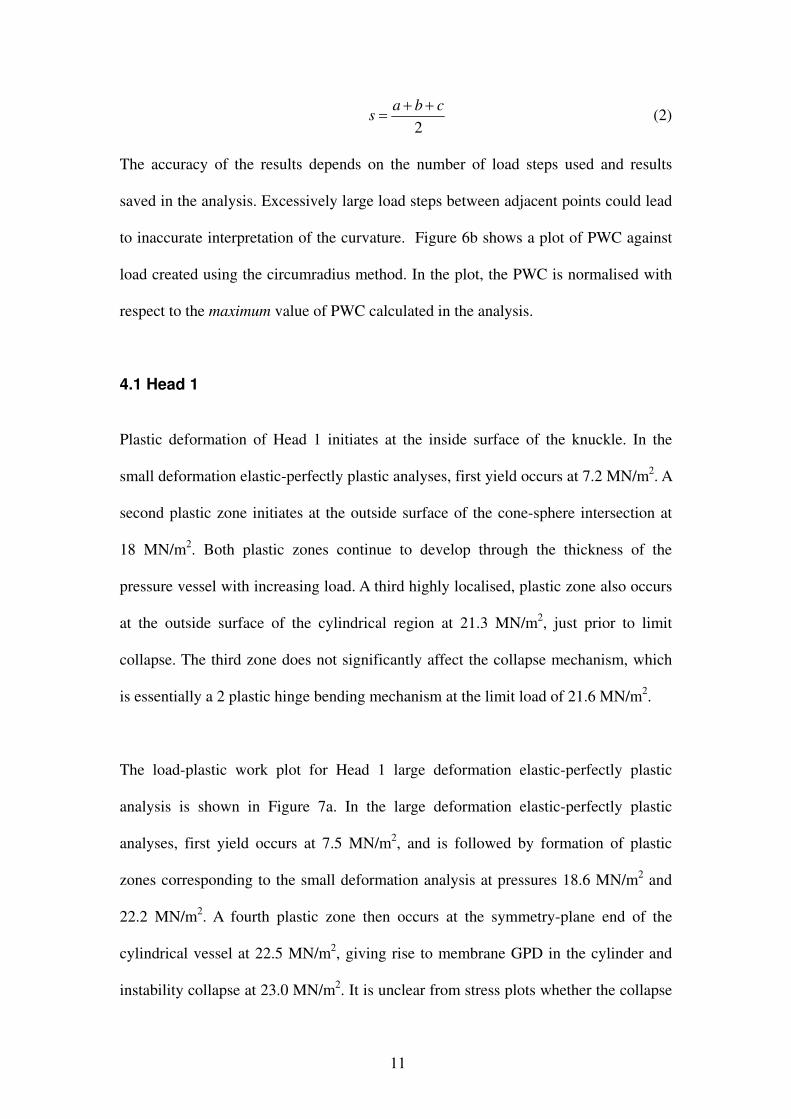
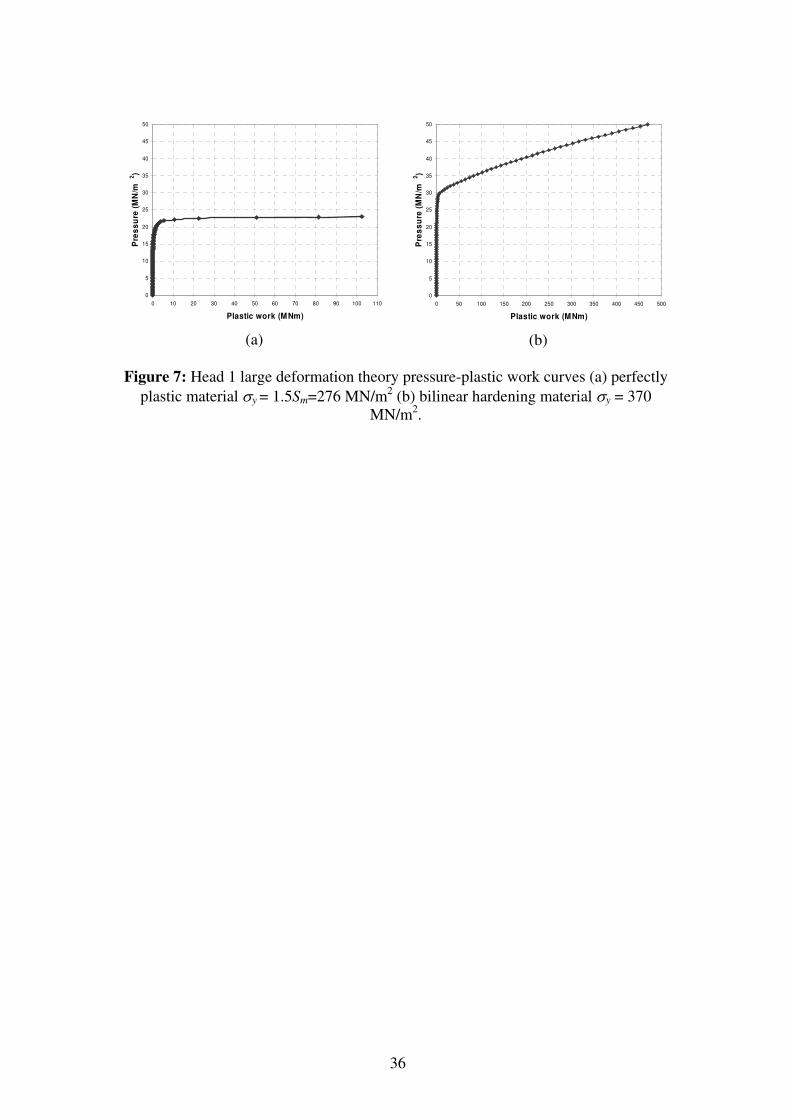
The load-plastic work plot for Head 1 large deformation elastic-perfectly plastic
analysis is shown in Figure 7a. In the large deformation elastic-perfectly plastic
analyses, first yield occurs at 7.5 MN/m2, and is followed by formation of plastic
zones corresponding to the small deformation analysis at pressures 18.6 MN/m2 and
22.2 MN/m2. A fourth plastic zone then occurs at the symmetry-plane end of the
cylindrical vessel at 22.5 MN/m2, giving rise to membrane GPD in the cylinder and
instability collapse at 23.0 MN/m2. It is unclear from stress plots whether the collapse
12
mechanism is a bending mechanism similar to that in the small deformation analysis
or membrane GPD of the cylindrical shell.
The value of yield stress used in the Head 1 bilinear strain hardening analysis was the
test value specified in Reference [15], which is higher than the 1.5Sm value used in the
perfectly plastic analysis. First yield therefore occurs at the same location as in the
perfectly plastic analyses but at higher pressure. In the small deformation bilinear
hardening analysis, first yield occurs at 9.5 MN/m2. In large deformation analysis,
yield occurs at 10.0 MN/m2. The load-plastic work plot for Head 1 large deformation
bilinear hardening analysis is shown in Figure 7b. The formation of post-yield plastic
zones is similar to that found in the corresponding elastic-perfectly analyses but at
higher load levels. The strain hardening analyses continue to converge until almost the
entire vessel experiences plastic deformation, although membrane-type plastic
deformation is less evident for small deformation analysis. The plastic load is defined
by applying the TES and PWC criteria of plastic collapse.
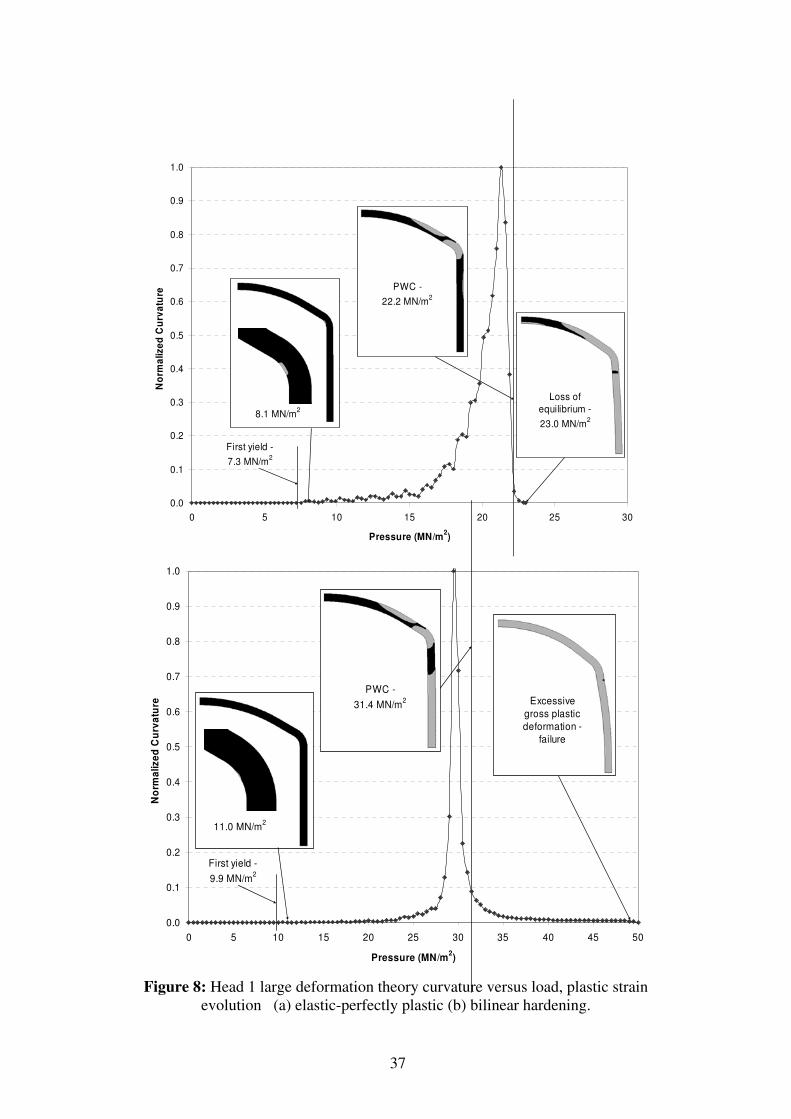
Figures 8a and 8b show load-PWC plots for Head 1 large deformation analysis with
elastic-perfectly plastic and bilinear hardening material models respectively. The
figures include contour plots showing the plastic zones in the vessel at salient loading
points: the black areas represent elastic regions and the grey areas the plastic zones. In
the elastic-perfectly plastic analysis, Figure 8a, the PWC reduces rapidly from the
maximum value to zero at the instability load of the vessel. In the strain hardening
model, the PWC reduces rapidly from the maximum to relatively small value but the
decrease to zero is over a large load range. It is therefore necessary to specify a finite
magnitude of normalised PWC that indicates gross plastic deformation. Examination
13
of plastic strain contour plots at different load levels as the curvature decreases from
its maximum to zero indicated that when the PWC reduces to 10% of its maximum
value the vessel is essentially exhibiting gross plastic deformation. The maximum
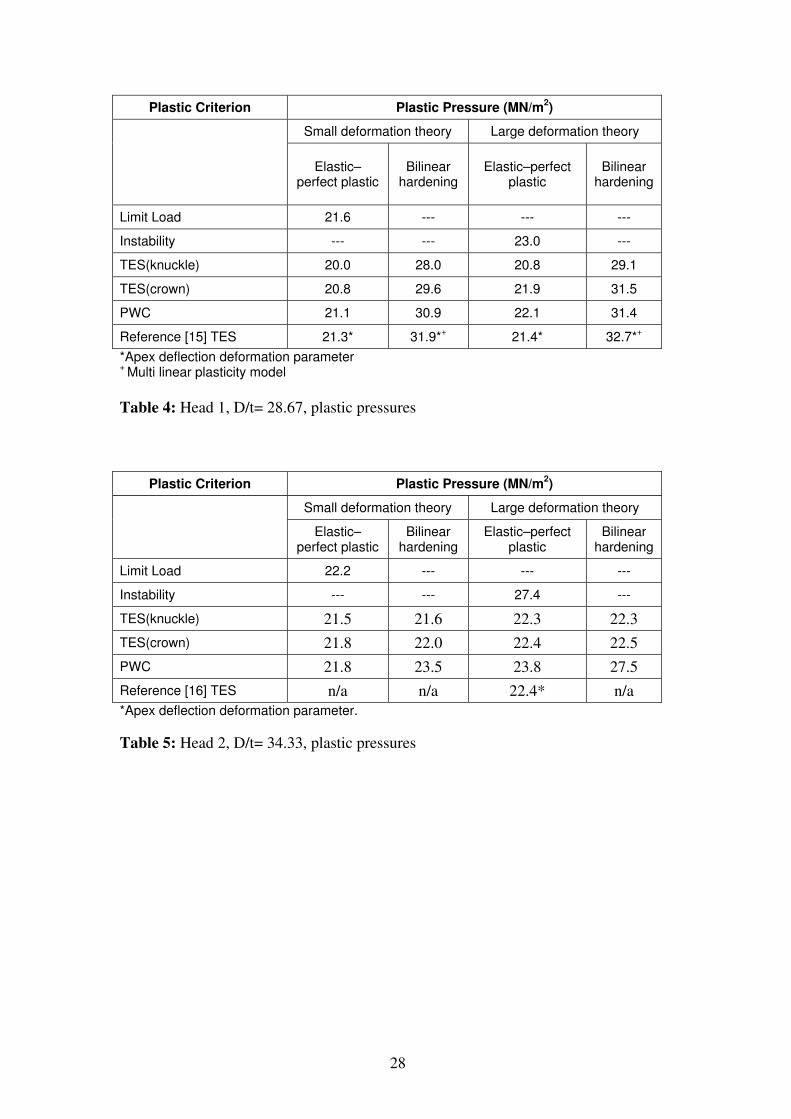
principal strain at the corresponding load is 3.2%. Applying this procedure to the four
analyses of Head 1, the plastic pressures given in Table 4 were obtained. Table 4 also
includes a value of plastic pressure taken from reference [15], in which several
commercial finite element programs were used in a “round-robin” estimate of plastic
load using the TES criteria. The value given in Table 4 is an average for each type of
analysis considered.
4.2 Head 2
In Head 2, the edge of the head is fixed and initial yielding occurs at the outside
surface of the fixed end of the knuckle at 11.1 MN/m2 and 11.2 MN/m
2 for small and
large deformation analysis respectively. In all the analyses, plastic zones form at the
location of initial yield, the inside surface at mid-section of the knuckle and the outer
surface of the sphere-knuckle intersection, resulting in a three plastic hinge bending
mechanism. A fourth plastic zone also initiates at the crown of the sphere in all of the
analyses. The relative degree of stress redistribution in the four plastic zones with
further increase in pressure, measured in terms of plastic work dissipation, is
dependant on the deformation theory used in the analysis. In small deformation
elastic perfectly plastic analysis, the maximum plastic deformation is observed at the
fixed end until the analysis fails to converge at 22.2 MN/m2. However, in the
corresponding large deformation analysis, membrane plastic deformation at the fourth
(crown) plastic zone becomes dominant until loss of equilibrium is observed at 27.4
MN/m2. Similar stress redistributions are observed when using strain hardening
14
models, but as the analysis continues to converge above the perfectly plastic
limit/instability loads the influence of the membrane deformation of the crown
becomes more significant.
The form of the PWC plot for Head 2 to is similar to that for Head 1. The plastic loads
calculated by the TES and PWC criteria, assuming the plastic load corresponds to a
reduction in PWC to 10% of the maximum value, are given in Table 5. The plastic
loads for perfectly plastic material and small deformation bilinear hardening are
similar. However, the PWC criterion indicates a relatively high value of plastic load
for large deformation strain hardening analysis. In this case the dominant GPD
mechanism was the three hinge bending mechanism, with a maximum principal strain
of 4.8% at the specified plastic load.
4.3 Head 3
In Head 3, first yield occurs at the knuckle region and continues to develop through
the thickness. Smaller less evident, plastic zones subsequently form at the outside
surface of the sphere-knuckle intersection and at the cylinder-knuckle intersection,
giving rise to a plastic hinge bending mechanism. In all but the limit analysis, a fourth
plastic zone forms in the cylindrical shell adjacent to the symmetry plane and two
distinct slopes are observed in the load-plastic work plot.
In the small deformation analyses, the PWC plots are dominated by a peak associated
with plastic deformation of the knuckle. In the bilinear hardening, a second smaller
peak is observed when plastic deformation of the cylinder occurs. The PWC plastic
load for these analyse was assumed to be the load at 10% of the maximum stress
15
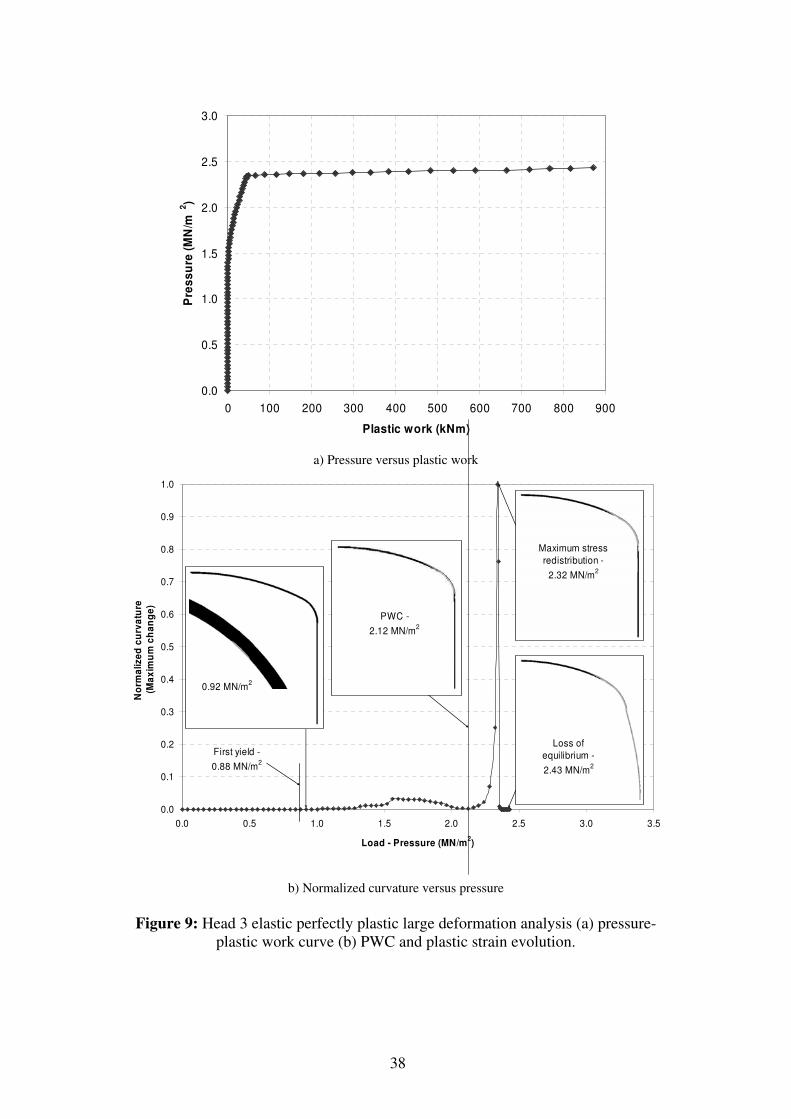
redistribution. The PWC plots for the large deformation analyses are dominated by a
peak associated with plastic deformation of the cylinder after the knuckle mechanism
has formed. Figure 9a shows the load-plastic work plot for the large deformation
elastic-perfectly plastic analysis. The first slope describes stress redistribution in the
knuckle region and the second in the cylindrical region. The corresponding PWC plot,
Figure 9b, has two regions indicating changes in curvature, or stress redistribution.
The first, relatively small, flat plateau in the plot indicates stress redistribution in the
knuckle, the second, dominant, peak indicates rapid stress redistribution in the
cylinder. The PWC plot for the large deformation, strain hardening analysis has a
similar form. This response clearly indicates that two plastic deformation mechanisms
occur sequentially. The problem is to determine which mechanism constitutes gross
plastic collapse of the structure.
From the definition of gross plastic collapse proposed in the PWC criterion, the
plastic load corresponds to the reduction from a local maximum PWC in the first,
knuckle, mechanism to a near-zero value. In practice, the knuckle exhibits large
deformations but the geometric strengthening effect causes the actual plastic collapse
mechanism to occur in the cylinder, as indicated by the second peak. However, this
second mechanism would not generally be considered as the basis for design in
practice and the gross plastic deformation load would usually be determined in
relation to the first, knuckle, mechanism. The PWC plastic loads are therefore
defined with respect to the first peak (or plateau). Both the perfectly plastic and
bilinear hardening model plots fall to a minimum after the plateau before a rapid
increase in PWC as the cylinder plastic deformation initiates. Here, the plastic load is
taken to be that corresponding to this minimum value of PWC.
16
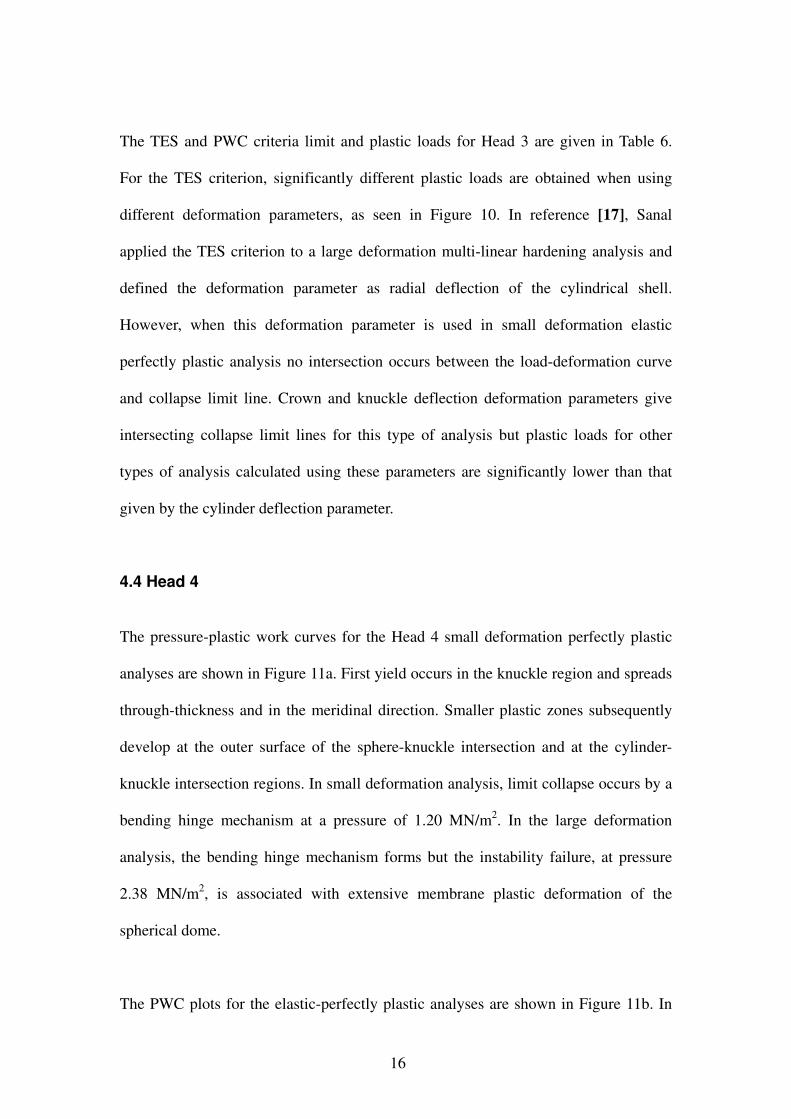
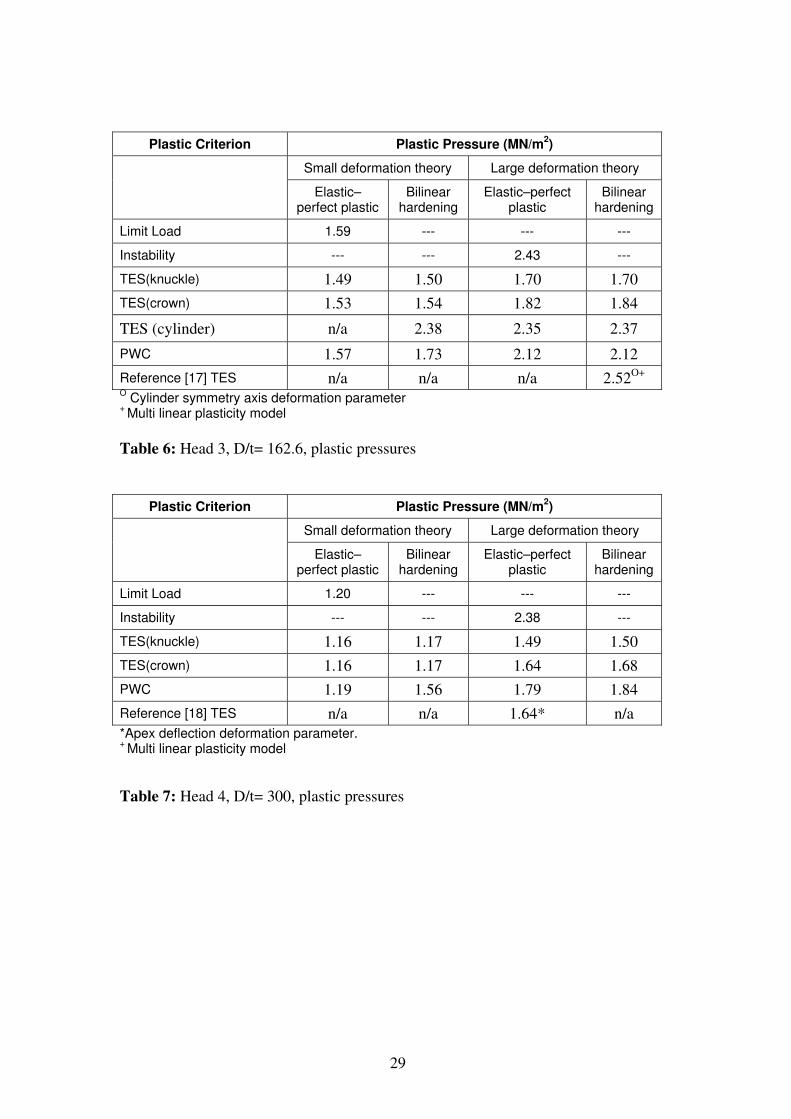
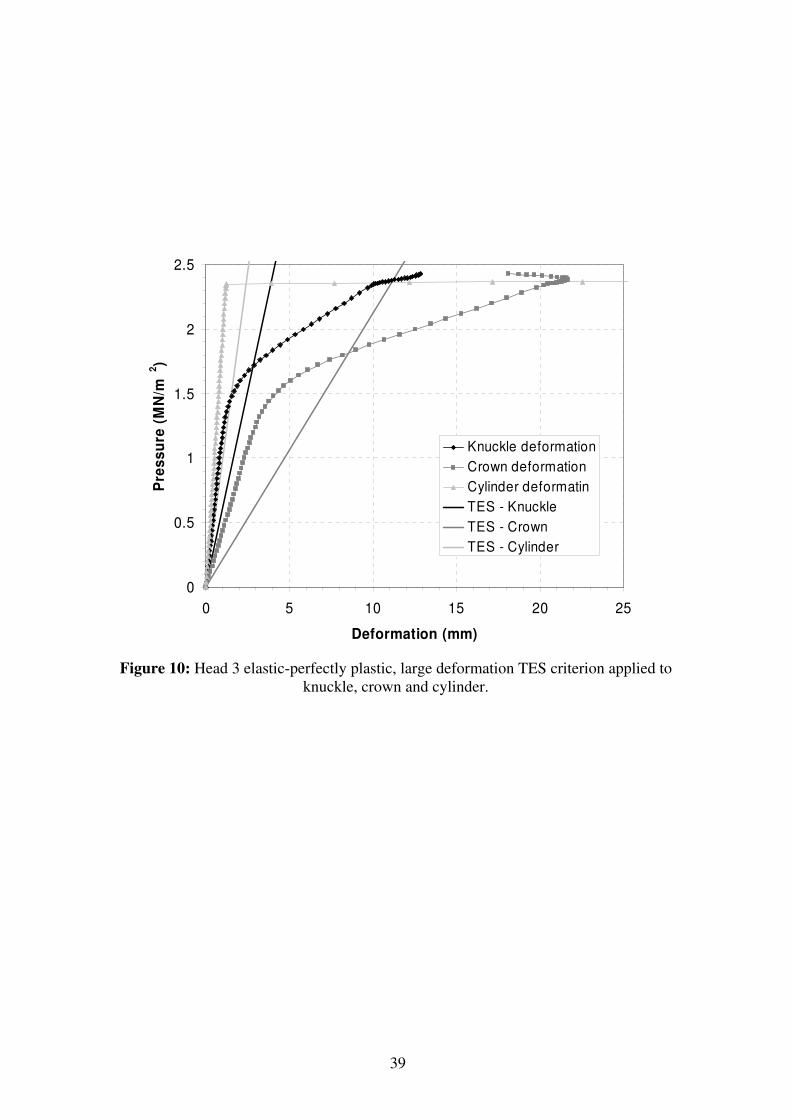
The TES and PWC criteria limit and plastic loads for Head 3 are given in Table 6.
For the TES criterion, significantly different plastic loads are obtained when using
different deformation parameters, as seen in Figure 10. In reference [17], Sanal
applied the TES criterion to a large deformation multi-linear hardening analysis and
defined the deformation parameter as radial deflection of the cylindrical shell.
However, when this deformation parameter is used in small deformation elastic
perfectly plastic analysis no intersection occurs between the load-deformation curve
and collapse limit line. Crown and knuckle deflection deformation parameters give
intersecting collapse limit lines for this type of analysis but plastic loads for other
types of analysis calculated using these parameters are significantly lower than that
given by the cylinder deflection parameter.
4.4 Head 4
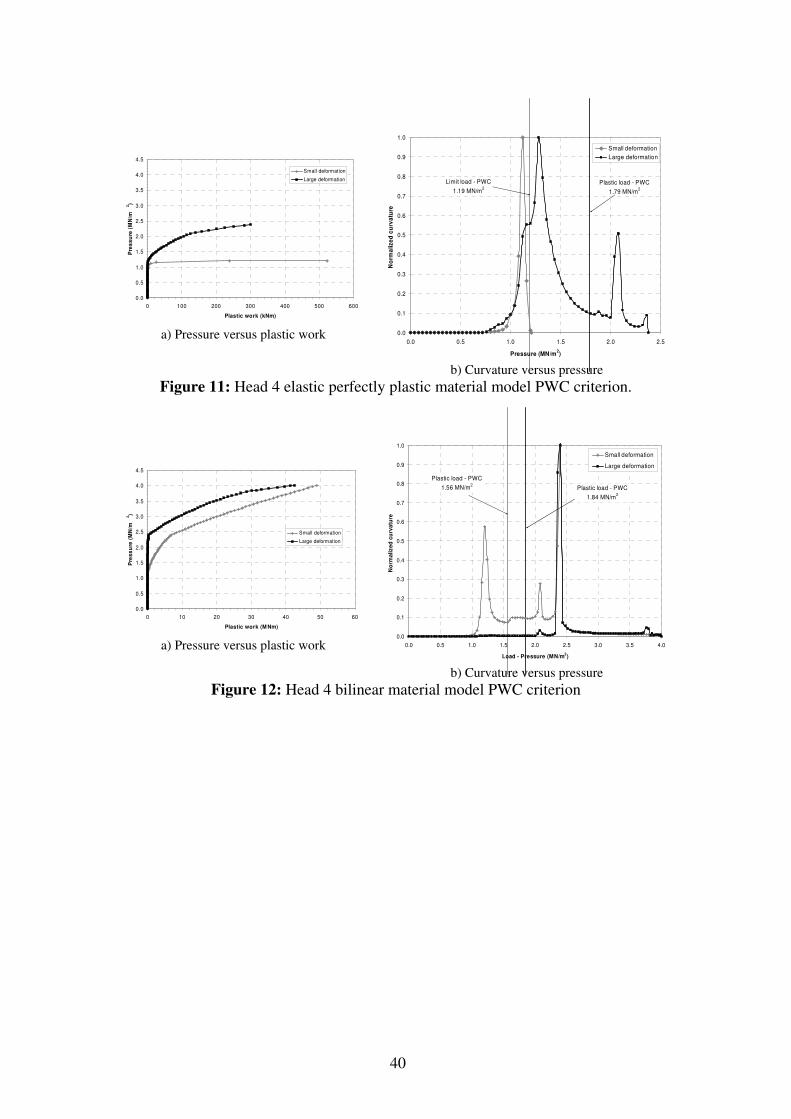
The pressure-plastic work curves for the Head 4 small deformation perfectly plastic
analyses are shown in Figure 11a. First yield occurs in the knuckle region and spreads
through-thickness and in the meridinal direction. Smaller plastic zones subsequently
develop at the outer surface of the sphere-knuckle intersection and at the cylinder-
knuckle intersection regions. In small deformation analysis, limit collapse occurs by a
bending hinge mechanism at a pressure of 1.20 MN/m2. In the large deformation
analysis, the bending hinge mechanism forms but the instability failure, at pressure
2.38 MN/m2, is associated with extensive membrane plastic deformation of the
spherical dome.
The PWC plots for the elastic-perfectly plastic analyses are shown in Figure 11b. In
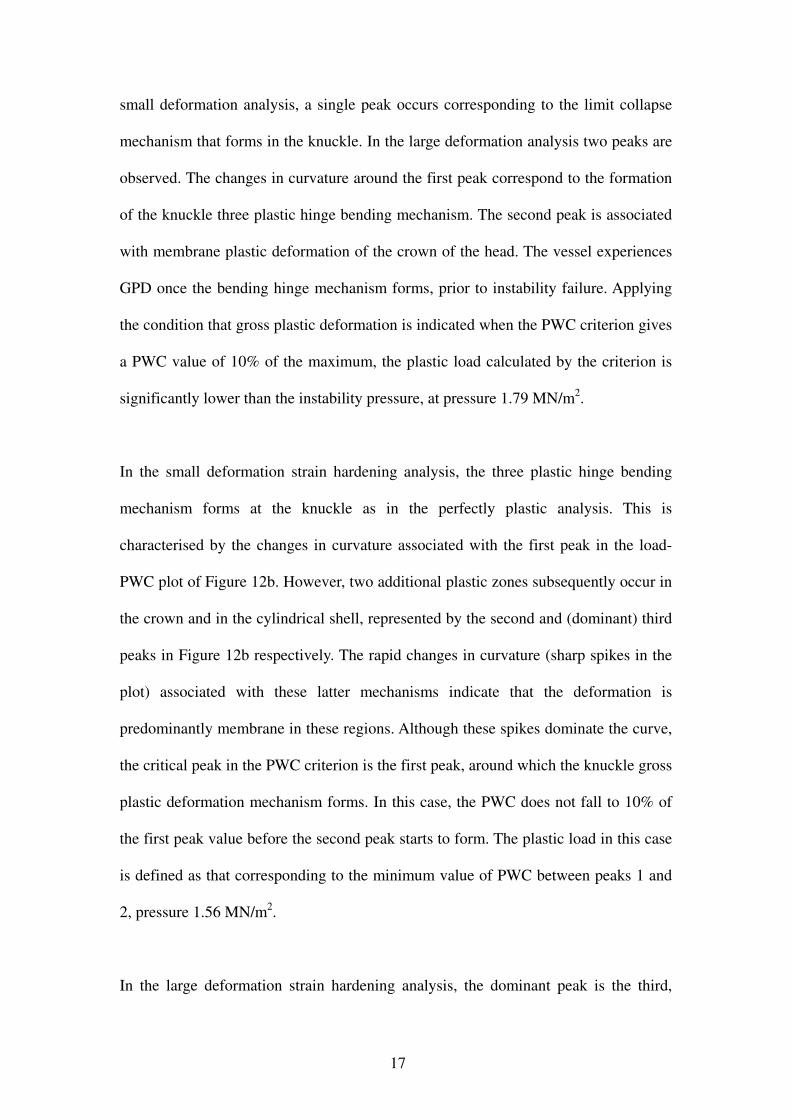
17
small deformation analysis, a single peak occurs corresponding to the limit collapse
mechanism that forms in the knuckle. In the large deformation analysis two peaks are
observed. The changes in curvature around the first peak correspond to the formation
of the knuckle three plastic hinge bending mechanism. The second peak is associated
with membrane plastic deformation of the crown of the head. The vessel experiences
GPD once the bending hinge mechanism forms, prior to instability failure. Applying
the condition that gross plastic deformation is indicated when the PWC criterion gives
a PWC value of 10% of the maximum, the plastic load calculated by the criterion is
significantly lower than the instability pressure, at pressure 1.79 MN/m2.
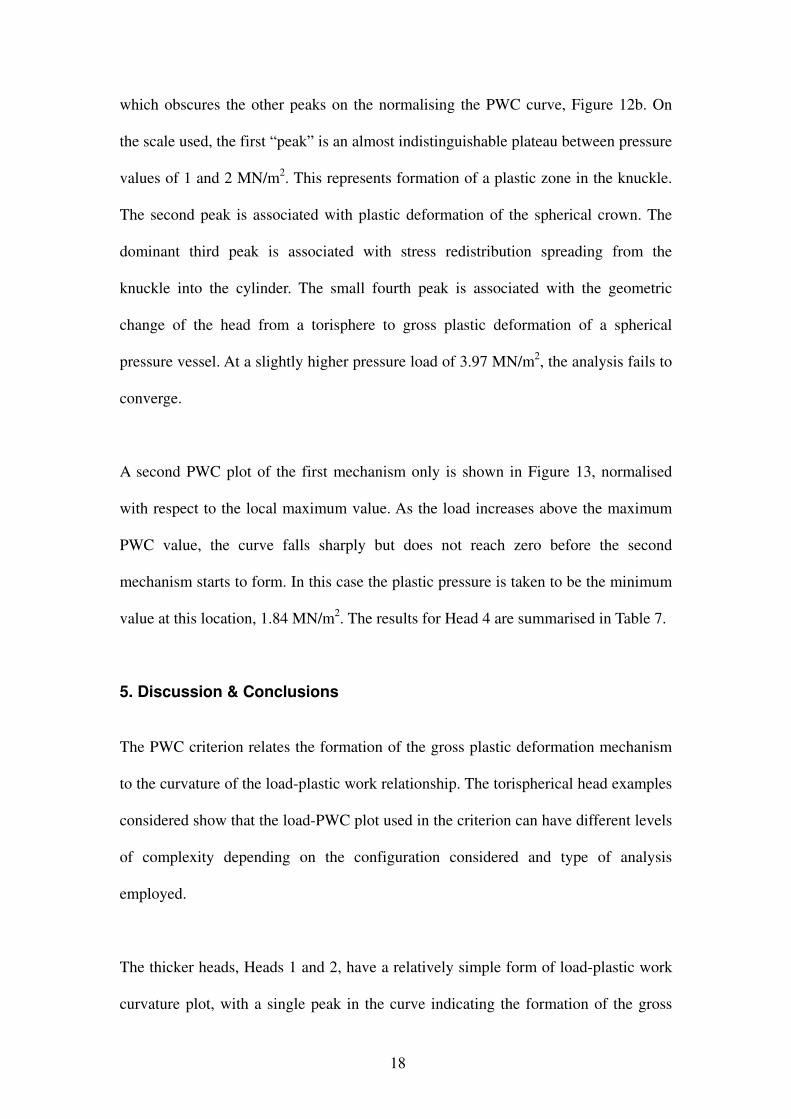
In the small deformation strain hardening analysis, the three plastic hinge bending
mechanism forms at the knuckle as in the perfectly plastic analysis. This is
characterised by the changes in curvature associated with the first peak in the load-
PWC plot of Figure 12b. However, two additional plastic zones subsequently occur in
the crown and in the cylindrical shell, represented by the second and (dominant) third
peaks in Figure 12b respectively. The rapid changes in curvature (sharp spikes in the
plot) associated with these latter mechanisms indicate that the deformation is
predominantly membrane in these regions. Although these spikes dominate the curve,
the critical peak in the PWC criterion is the first peak, around which the knuckle gross
plastic deformation mechanism forms. In this case, the PWC does not fall to 10% of
the first peak value before the second peak starts to form. The plastic load in this case
is defined as that corresponding to the minimum value of PWC between peaks 1 and
2, pressure 1.56 MN/m2.
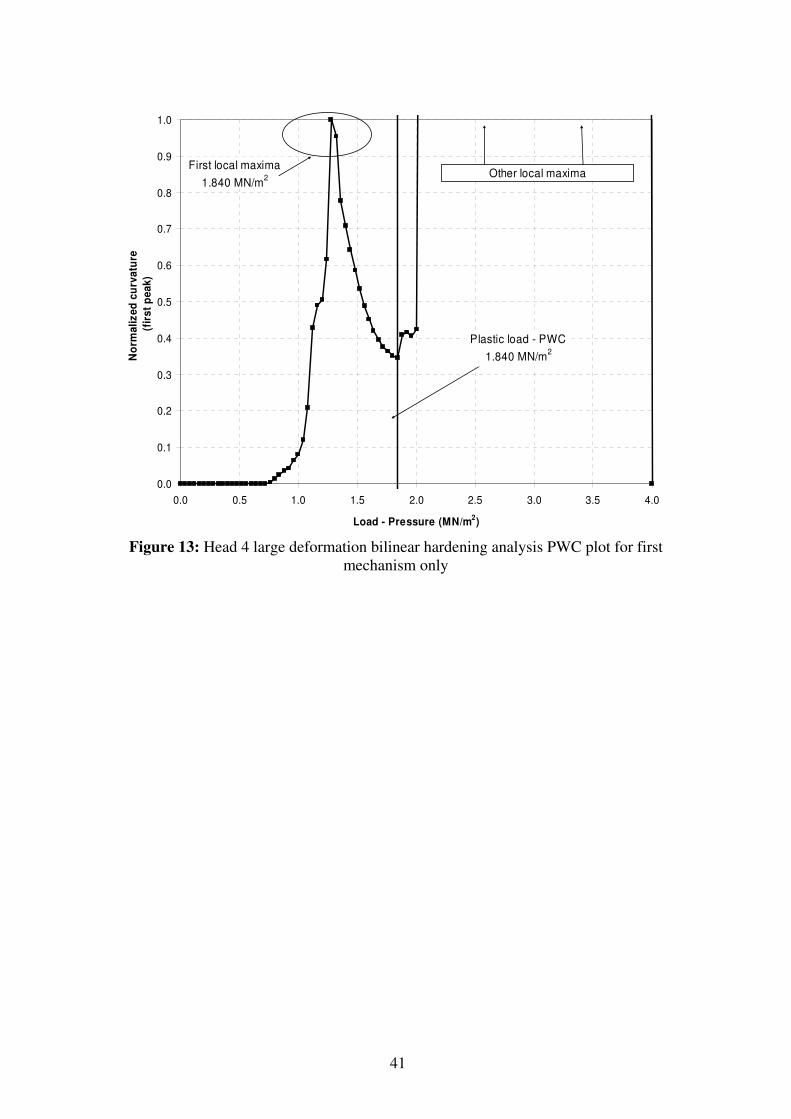
In the large deformation strain hardening analysis, the dominant peak is the third,
18
which obscures the other peaks on the normalising the PWC curve, Figure 12b. On
the scale used, the first “peak” is an almost indistinguishable plateau between pressure
values of 1 and 2 MN/m2. This represents formation of a plastic zone in the knuckle.
The second peak is associated with plastic deformation of the spherical crown. The
dominant third peak is associated with stress redistribution spreading from the
knuckle into the cylinder. The small fourth peak is associated with the geometric
change of the head from a torisphere to gross plastic deformation of a spherical
pressure vessel. At a slightly higher pressure load of 3.97 MN/m2, the analysis fails to
converge.
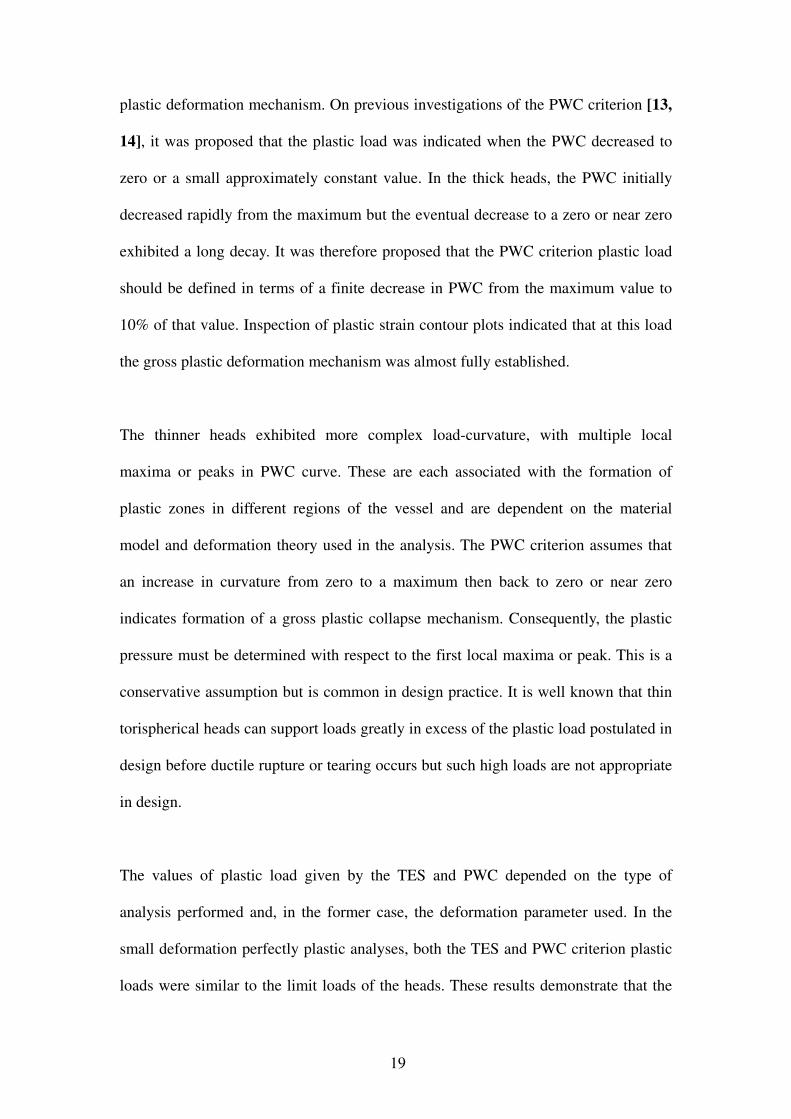
A second PWC plot of the first mechanism only is shown in Figure 13, normalised
with respect to the local maximum value. As the load increases above the maximum
PWC value, the curve falls sharply but does not reach zero before the second
mechanism starts to form. In this case the plastic pressure is taken to be the minimum
value at this location, 1.84 MN/m2. The results for Head 4 are summarised in Table 7.
5. Discussion & Conclusions
The PWC criterion relates the formation of the gross plastic deformation mechanism
to the curvature of the load-plastic work relationship. The torispherical head examples
considered show that the load-PWC plot used in the criterion can have different levels
of complexity depending on the configuration considered and type of analysis
employed.
The thicker heads, Heads 1 and 2, have a relatively simple form of load-plastic work
curvature plot, with a single peak in the curve indicating the formation of the gross
19
plastic deformation mechanism. On previous investigations of the PWC criterion [13,
14], it was proposed that the plastic load was indicated when the PWC decreased to
zero or a small approximately constant value. In the thick heads, the PWC initially
decreased rapidly from the maximum but the eventual decrease to a zero or near zero
exhibited a long decay. It was therefore proposed that the PWC criterion plastic load
should be defined in terms of a finite decrease in PWC from the maximum value to
10% of that value. Inspection of plastic strain contour plots indicated that at this load
the gross plastic deformation mechanism was almost fully established.
The thinner heads exhibited more complex load-curvature, with multiple local
maxima or peaks in PWC curve. These are each associated with the formation of
plastic zones in different regions of the vessel and are dependent on the material
model and deformation theory used in the analysis. The PWC criterion assumes that
an increase in curvature from zero to a maximum then back to zero or near zero
indicates formation of a gross plastic collapse mechanism. Consequently, the plastic
pressure must be determined with respect to the first local maxima or peak. This is a
conservative assumption but is common in design practice. It is well known that thin
torispherical heads can support loads greatly in excess of the plastic load postulated in
design before ductile rupture or tearing occurs but such high loads are not appropriate
in design.
The values of plastic load given by the TES and PWC depended on the type of
analysis performed and, in the former case, the deformation parameter used. In the
small deformation perfectly plastic analyses, both the TES and PWC criterion plastic
loads were similar to the limit loads of the heads. These results demonstrate that the
20
PWC definition of gross plastic deformation is consistent with the limit analysis
definition. In the large deformation perfectly plastic analyses, the PWC criterion
plastic loads are higher than TES criterion loads, except for Head 3 with deformation
parameter located on the main cylinder. The cylinder deformation parameter was
considered for Head 3 for comparison with the result given in Reference [17].
However, the cylinder parameter would be expected to characterise plastic
deformation of the cylinder and not necessarily the head. The PWC criterion
specifically identifies gross plastic deformation of the knuckle before plastic
deformation of the main cylinder occurs, characterised by the second peak in Figure
9. In all Heads, the PWC criterion indicates gross plastic deformation at loads
considerably lower than the numerical instability load.
In the small deformation strain hardening analyses, the TES criterion gave plastic
loads similar to the limit load, indicating that the criterion does not significantly
represent the effect of the material model on the spread of plastic deformation. The
plastic loads evaluated using the PWC criterion, were consistently greater than the
limit load. In large deformation strain hardening analysis, the PWC criterion gave
plastic loads greater than the corresponding perfectly plastic analysis but less than or
equal to the perfectly plastic instability load. The TES criterion plastic pressures were
found to be dependant on the deformation parameter used. When a knuckle
deformation parameter was used, the PWC criterion gave higher values of plastic
load. When deformation parameters at the crown of the head or in the cylinder were
used, the TES criterion gave similar or greater plastic pressures for Head 1 and Head
3.
21
In conclusion, the investigation of the torispherical heads has shown that the PWC
criterion suitably characterises the complex elastic-plastic response of the components
and is an appropriate method for calculating plastic pressures.
• The local maxima in the PWC plot are associated with specific plastic
deformation mechanisms. In small deformation analyses, plastic collapse is
clearly due to bending in the knuckle. In the large deformation analyses, knuckle
bending is followed by extensive plastic membrane deformation in the spherical
crown or in the cylindrical shell and the peaks in PWC corresponding to these
events dominate the normalised PWC curve. These dominant peaks do not signify
the onset of gross plastic deformation: this occurs in the knuckle prior to their
formation (indeed, the membrane response is only possible after the knuckle
changes shape).
• The sample analyses indicate that the PWC criterion leads to higher calculated
plastic pressures and consequently design loads for strain hardening structures
than the TES criterion but in comparison with limit and instability loads the PWC
criterion is conservative. Enhanced design loads are given as the PWC criterion
identifies the effect of a strain hardening material model on the evolution of the
gross plastic deformation mechanism. The TES criterion evaluates similar plastic
loads for perfectly plastic and strain hardening analysis.
• The PWC criterion may result in complex load-PWC curves with several local
maxima when several plastic mechanisms form. However, the underlying
criterion identifies the first peak as the significant event in the formation of a
22
gross plastic deformation mechanism. The plastic load is defined by considering
the decrease in PWC from this local maxima to near zero (it is proposed that 10%
of the maximum is a conservative definition of formation of the mechanism) or
the minimum point between the first and second peak. This method gives a
consistent definition of plastic pressure and is not dependant on choice of suitable
deformation parameters which may or may not adequately describe the plastic
response.
References
[1] BSI, PD5500 Unfired fusion welded pressure vessels. British Standards
Institution, London, 1999.
[2] ASME, ASME Boiler and Pressure Vessel Code Sections III and VIII. The
American Society of Mechanical Engineers, New York, NY, 2003.
[3] CES, EN 13445-3:2002 Unfired pressure vessels. European Committee for
Standardisation, Brussels, April 2002.
[4] ASME, Criteria of the ASME Boiler and Pressure Vessel Code for Design by
Analysis in Sections III and VIII, Division 2. The American Society of Mechanical
Engineers, New York, 1969. Reprinted in Pressure Vessel Design and Analysis - A
Decade of Progress. The American Society of Mechanical Engineers, New York,
1972.
23
[5] Staat, M., Heitzer, M., Lang, H. and Wirtz, K., Direct finite element route for
design-by-analysis of pressure components. Int. J. of Presure Vesels and Piping,
2005, 82, 61-67.
[6] Gerdeen, J.C., A critical evaluation of plastic behaviour data and a united
definition of plastic loads for pressure vessel components. WRC Bulletin, 1979, 254.
[7] Kirkwood, M.G. and Moffat, D.G., Plastic loads for piping branch junctions
subjected to combined pressure and in-plane moment loads. Proc. Instn Mech Engrs
ImechE, Part E, Journal of Process Mechanical Engineering, 1994, 208, 31-43.
[8] Mackenzie, D., Boyle, J.T., Hamilton, R., Application of inelastic finite element
analysis to pressure vessel design. 8th ICPVT, Montreal, 1996, 2, 109-115.
[9] Moffat, D.G., Hsieh, M.F. and Lynch, M., An assessment of ASME III and CEN
TC54 methods of determining plastic and limit loads for pressure system components.
J. Strain Analysis, 2001, 36 (3), 301-312.
[10] Robertson, A., Li, H. and Mackenzie, D., Plastic collapse of pipe bends under
combined internal pressure and in-plane bending, Int. J. Pres. Ves. & Piping, 2005,
80, 407-416.
[11] Lee K.S., Moreton D.N. and Moffat D.G., The plastic work required to induce
the limit pressure of a plain cylinder, Int. J. Pres. Ves. & Piping, 2005, 82, 115-121.
24
[12] Muscat, M., Mackenzie, D. and Hamilton, R. A work Criterion for Plastic
Collapse, Int. J. of Pressure Vessel and Piping, 2003, 80, 49-58.
[13] Li, H. and Mackenzie, D., Characterising Gross Plastic Deformation in Design
by Analysis. In Press, Int. J. Pres. Ves. & Piping,2005, 82, 777-786.
[14] Mackenzie, D. and Li, H., A Plastic Load Criterion for Inelastic Design by
Analysis. Proc. ASME Pressure Vessel & Piping Conf., Denver, 2005, PVP2005-
71556.
[15] Yamamoto, Y., Asada, S. and Okamoto, A., Round robin calculations of
collapse loads – a torispherical pressure vessel head with a conical transition, J Pres
Ves Tech, 1997, 119, 503-509.
[16] Blachut, J., Plastic loads for internally pressurised torispheres, Int. J. of Pressure
Vessel and Piping, 1994, 64, 91-100.
[17] Sanal, Z., Nonlinear analysis of pressure vessels: some examples, Int. J. of
Pressure Vessel and Piping, 2000, 77, 705-709.
[18] Galletly, G.D. and Blachut, J., Torispherical shells under internal pressure –
failure due to asymmetric plastic buckling or axisymmetric yielding, Proc Instn Mech
Engrs, No C3, 1985, 199, 225 – 238.
[19] ANSYS version 9.0, 2005
25
[20] Weisstein, E.W. Circumradius. From MathWorld--A Wolfram Web Resource.
http://mathworld.wolfram.com/Circumradius.html
List of tables:
Table 1: Geometric dimensions of pressure vessel heads
Table 2: Material properties for limit load analysis
Table 3: Bilinear material models
Table 4: Head 1, D/t = 28.67, plastic pressures
Table 5: Head 2, D/t = 34.33, plastic pressures
Table 6: Head 3, D/t = 162.6, plastic pressures
Table 7: Head 4, D/t = 300, plastic pressures
List of figures:
Figure 1: Twice elastic slope criterion of plastic collapse
Figure 2: Plastic work criterion
Figure 3: Plastic work curvature criterion
Figure 4: Example torispherical head geometry
Figure 5: Axisymmetric finite element mesh for Head 1
Figure 6: PWC criterion (a) evaluation of curvature from circumradius of three points
(b) plot of normalised curvature against applied load, identifying load corresponding
to reduction to 10% of maximum curvature.
Figure 7: Head 1 large deformation theory pressure-plastic work curves (a) perfectly
plastic material σy = 1.5Sm=276 MN/m2 (b) bilinear hardening material σy = 370
MN/m2.
26
Figure 8: Head 1 large deformation theory curvature versus load, plastic strain
evolution (a) elastic-perfectly plastic (b) bilinear hardening.
Figure 9: Head 3 elastic perfectly plastic large deformation analysis (a) pressure-
plastic work curve (b) PWC and plastic strain evolution.
Figure 10: Head 3 elastic-perfectly plastic, large deformation TES criterion applied to
knuckle, crown and cylinder.
Figure 11: Head 4 elastic perfectly plastic material model PWC criterion.
Figure 12: Head 4 bilinear material model PWC criterion
Figure 13: Head 4 large deformation bilinear hardening analysis PWC plot for first
mechanism only
27
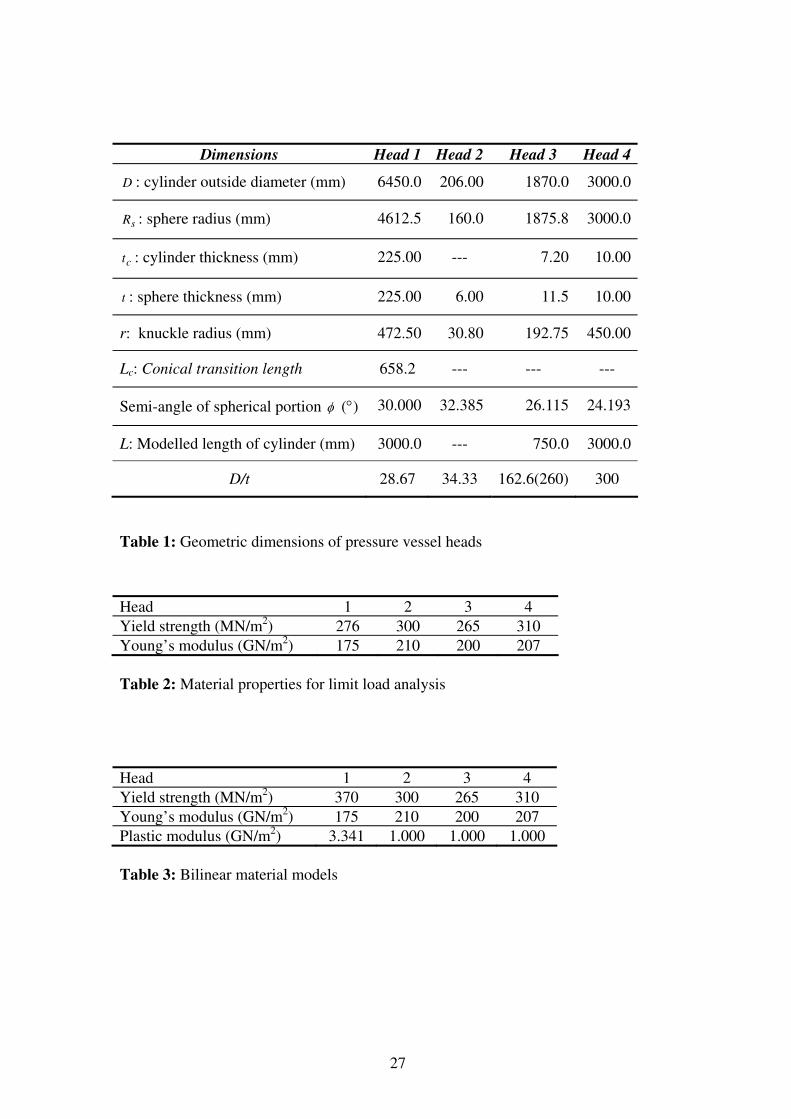
Table 1: Geometric dimensions of pressure vessel heads
Head 1 2 3 4
Yield strength (MN/m2) 276 300 265 310
Young’s modulus (GN/m2) 175 210 200 207
Table 2: Material properties for limit load analysis
Head 1 2 3 4
Yield strength (MN/m2) 370 300 265 310
Young’s modulus (GN/m2) 175 210 200 207
Plastic modulus (GN/m2) 3.341
1.000
1.000
1.000
Table 3: Bilinear material models
Dimensions Head 1 Head 2 Head 3 Head 4
D : cylinder outside diameter (mm) 6450.0 206.00 1870.0 3000.0
sR : sphere radius (mm) 4612.5 160.0 1875.8 3000.0
ct : cylinder thickness (mm) 225.00 --- 7.20 10.00
t : sphere thickness (mm) 225.00 6.00 11.5 10.00
r: knuckle radius (mm) 472.50 30.80 192.75 450.00
Lc: Conical transition length 658.2 --- --- ---
Semi-angle of spherical portion φ (°) 30.000 32.385 26.115 24.193
L: Modelled length of cylinder (mm) 3000.0 --- 750.0 3000.0
D/t 28.67 34.33 162.6(260) 300
28
Plastic Criterion Plastic Pressure (MN/m2)
Small deformation theory Large deformation theory
Elastic–
perfect plastic
Bilinear
hardening
Elastic–perfect
plastic
Bilinear
hardening
Limit Load 21.6 --- --- ---
Instability --- --- 23.0 ---
TES(knuckle) 20.0 28.0 20.8 29.1
TES(crown) 20.8 29.6 21.9 31.5
PWC 21.1 30.9 22.1 31.4
Reference [15] TES 21.3* 31.9*+
21.4* 32.7*+
*Apex deflection deformation parameter
+ Multi linear plasticity model
Table 4: Head 1, D/t= 28.67, plastic pressures
Plastic Criterion Plastic Pressure (MN/m2)
Small deformation theory Large deformation theory
Elastic–perfect plastic
Bilinear hardening
Elastic–perfect plastic
Bilinear hardening
Limit Load 22.2 --- --- ---
Instability --- --- 27.4 ---
TES(knuckle) 21.5 21.6 22.3 22.3
TES(crown) 21.8 22.0 22.4 22.5
PWC 21.8 23.5 23.8 27.5
Reference [16] TES n/a n/a 22.4* n/a
*Apex deflection deformation parameter.
Table 5: Head 2, D/t= 34.33, plastic pressures
29
Plastic Criterion Plastic Pressure (MN/m2)
Small deformation theory Large deformation theory
Elastic–perfect plastic
Bilinear hardening
Elastic–perfect plastic
Bilinear hardening
Limit Load 1.59 --- --- ---
Instability --- --- 2.43 ---
TES(knuckle) 1.49 1.50 1.70 1.70
TES(crown) 1.53 1.54 1.82 1.84
TES (cylinder) n/a 2.38 2.35 2.37
PWC 1.57 1.73 2.12 2.12
Reference [17] TES n/a n/a n/a 2.52O+
O Cylinder symmetry axis deformation parameter
+ Multi linear plasticity model
Table 6: Head 3, D/t= 162.6, plastic pressures
Plastic Criterion Plastic Pressure (MN/m2)
Small deformation theory Large deformation theory
Elastic–perfect plastic
Bilinear hardening
Elastic–perfect plastic
Bilinear hardening
Limit Load 1.20 --- --- ---
Instability --- --- 2.38 ---
TES(knuckle) 1.16 1.17 1.49 1.50
TES(crown) 1.16 1.17 1.64 1.68
PWC 1.19 1.56 1.79 1.84
Reference [18] TES n/a n/a 1.64* n/a
*Apex deflection deformation parameter. +
Multi linear plasticity model
Table 7: Head 4, D/t= 300, plastic pressures
30
Load
Deformation
P
θ
φ
φ
Figure 1: Twice elastic slope criterion of plastic collapse
31
Plastic Work
λ
PλCalculated
elastic-plastic
response
PW criterion
Elastic - GPD response
Plastic Work
λGross plastic
deformation
Elastic
response
Yield
Plastic
deformation
Plastic Work
λ
Yield
(a) (b)
Pλ
(c)
Figure 2: Plastic work criterion.
32
Figure 3: Plastic work curvature criterion
33
a) Head 1
b) Head 2
c) Head 3
d) Head 4
Figure 4: Example torispherical head geometry
34
Figure 5: Axisymmetric finite element mesh for Head 1
35
0.0
0.1
0.2
0.3
0.4
0.5
0.6
0.7
0.8
0.9
1.0
No
rma
lize
d c
urv
atu
re
First Yield
Maximum Stress
Redistribution
Load -λ
Figure 6: PWC criterion (a) evaluation of curvature from circumradius of three points
(b) plot of normalised curvature against applied load, identifying load corresponding
to reduction to 10% of maximum curvature.
cb
aR
R
R
Lo
ad
Plastic Work
36
0
5
10
15
20
25
30
35
40
45
50
0 10 20 30 40 50 60 70 80 90 100 110
Plastic work (MNm)
Pre
ss
ure
(M
N/m
2)
(a)
0
5
10
15
20
25
30
35
40
45
50
0 50 100 150 200 250 300 350 400 450 500
Plastic work (MNm)
Pre
ss
ure
(M
N/m
2)
(b)
Figure 7: Head 1 large deformation theory pressure-plastic work curves (a) perfectly
plastic material σy = 1.5Sm=276 MN/m2 (b) bilinear hardening material σy = 370
MN/m2.
37
0.0
0.1
0.2
0.3
0.4
0.5
0.6
0.7
0.8
0.9
1.0
0 5 10 15 20 25 30
Pressure (MN/m2)
No
rma
lize
d C
urv
atu
re
PWC -
22.2 MN/m2
Loss of
equilibrium -
23.0 MN/m2
First yield -
7.3 MN/m2
8.1 MN/m2
0.0
0.1
0.2
0.3
0.4
0.5
0.6
0.7
0.8
0.9
1.0
0 5 10 15 20 25 30 35 40 45 50
Pressure (MN/m2)
No
rma
lize
d C
urv
atu
re
11.0 MN/m2
PWC -
31.4 MN/m2 Excessive
gross plastic
deformation -
failure
First yield -
9.9 MN/m2
Figure 8: Head 1 large deformation theory curvature versus load, plastic strain
evolution (a) elastic-perfectly plastic (b) bilinear hardening.
38
0.0
0.5
1.0
1.5
2.0
2.5
3.0
0 100 200 300 400 500 600 700 800 900
Plastic work (kNm)
Pre
ss
ure
(M
N/m
2)
a) Pressure versus plastic work
0.0
0.1
0.2
0.3
0.4
0.5
0.6
0.7
0.8
0.9
1.0
0.0 0.5 1.0 1.5 2.0 2.5 3.0 3.5
Load - Pressure (MN/m2)
No
rma
lize
d c
urv
atu
re
(Ma
xim
um
ch
an
ge
)
First yield -
0.88 MN/m2
Maximum stress
redistribution -
2.32 MN/m2
Loss of
equilibrium -
2.43 MN/m2
0.92 MN/m2
PWC -
2.12 MN/m2
b) Normalized curvature versus pressure
Figure 9: Head 3 elastic perfectly plastic large deformation analysis (a) pressure-
plastic work curve (b) PWC and plastic strain evolution.
39
0
0.5
1
1.5
2
2.5
0 5 10 15 20 25
Deformation (mm)
Pre
ss
ure
(M
N/m
2)
Knuckle deformation
Crown deformation
Cylinder deformatin
TES - Knuckle
TES - Crown
TES - Cylinder
Figure 10: Head 3 elastic-perfectly plastic, large deformation TES criterion applied to
knuckle, crown and cylinder.
40
0.0
0.5
1.0
1.5
2.0
2.5
3.0
3.5
4.0
4.5
0 100 200 300 400 500 600
Plastic work (kNm)
Pre
ss
ure
(M
N/m
2)
Small deformation
Large deformation
a) Pressure versus plastic work 0.0
0.1
0.2
0.3
0.4
0.5
0.6
0.7
0.8
0.9
1.0
0.0 0.5 1.0 1.5 2.0 2.5
Pressure (MN/m2)
No
rma
lize
d c
urv
atu
re
Small deformation
Large deformation
Limit load - PWC
1.19 MN/m2
Plastic load - PWC
1.79 MN/m2
b) Curvature versus pressure
Figure 11: Head 4 elastic perfectly plastic material model PWC criterion.
0.0
0.5
1.0
1.5
2.0
2.5
3.0
3.5
4.0
4.5
0 10 20 30 40 50 60
Plastic work (M Nm)
Pre
ss
ure
(M
N/m
2)
Small deformation
Large deformation
a) Pressure versus plastic work
0.0
0.1
0.2
0.3
0.4
0.5
0.6
0.7
0.8
0.9
1.0
0.0 0.5 1.0 1.5 2.0 2.5 3.0 3.5 4.0
Load - Pressure (MN/m2)
No
rma
liz
ed
cu
rva
ture
Small deformation
Large deformation
Plastic load - PWC
1.56 MN/m2
Plastic load - PWC
1.84 MN/m2
b) Curvature versus pressure
Figure 12: Head 4 bilinear material model PWC criterion
41
0.0
0.1
0.2
0.3
0.4
0.5
0.6
0.7
0.8
0.9
1.0
0.0 0.5 1.0 1.5 2.0 2.5 3.0 3.5 4.0
Load - Pressure (MN/m2)
No
rma
liz
ed
cu
rva
ture
(fir
st
pe
ak
)
Plastic load - PWC
1.840 MN/m2
First local maxima
1.840 MN/m2 Other local maxima
Figure 13: Head 4 large deformation bilinear hardening analysis PWC plot for first
mechanism only