GRO C ERY 2 017 - britvic.com Scantrack, ... Britvic plc Annual Report and Accounts 2017 01 ......
29
GROCERY 2017 Soft Drinks Review
-
Upload
nguyendieu -
Category
Documents
-
view
219 -
download
0
Transcript of GRO C ERY 2 017 - britvic.com Scantrack, ... Britvic plc Annual Report and Accounts 2017 01 ......

G R O C E R Y 2 0 1 7Soft Drinks Review

CONTENTS
P01Total soft drinks
P04Channel performance
P05The year in numbers
P08Review
P09Influences and considerations
P12Future outlook
P20Conclusion
P21Appendix
W elcome to the 2018 Britvic Soft Drinks Review. There is no doubt that it has been another interesting year for our category
as manufacturers really got to grips with the impending soft drinks industry levy and how best to navigate it.
It feels to me like the industry has got ahead of the game and last year we saw a huge amount of innovation and reformulation across the board, probably more so than was expected. Health remains front of mind for consumers when choosing a soft drink and I am proud that our industry is playing its part in removing millions of calories from people’s diets and offering them great tasting, healthier soft drinks solutions. But, health and sugar are not the only stories playing out in soft drinks. Last year saw a continuation of key trends such as premiumisation and convenience, as well as the emergence of some newer talking points affecting the category like zero proof alcohol and the growing focus on sustainability.
At Britvic, we are committed to making a positive difference to the world around us and have recently launched our sustainability platform ‘A Healthier Everyday’ where, amongst many other things, we have committed to reducing the amount of materials we use across all packaging formats and ensuring that 15% of our PET comes from recycled or renewable materials.
Finally, we are also very excited to be introducing you to our new soft drinks category vision ‘Drink Differently’, which plots the roadmap to unlocking category growth. As always, we hope you find this document useful and look forward to hearing any feedback on how we can continue to improve and evolve it.
Kind Regards,
Paul GrahamGB Managing Director
W E L C O M E

Britvic has removed
20bn calories4
annualised since 2013
Full Sugar Value
£4,772m3 -1.0%
Low Calorie Value
£2,997m3 +7.6%
£6.9bn2 Carbonates remain the largest segment worth
+£88m2
Mixers contributed the most value growth
+30%2
Smoothies were the fastest growing segment
2.6bn litres2
Water & Water Plus combined are the most consumed2
£15.2bn2
The estimated total value of UK soft drink sales
+1.4%2 Total market growth for the year
I n 2017, the soft drinks industry demonstrated its ability to evolve in an ever-changing world, continuing to remain
relevant in everyone’s daily lives.
The upcoming 2018 soft drinks industry levy was on everyone’s agenda and numerous high-profile product reformulations, innovations and health-led activations, reflected the categories ability to adapt to changing market circumstances.
The increasing demand for health and wellness, convenience and experience, provided great opportunities for differentiation, which the industry is evolving quickly to capture across all channels.
T O T A L S O F T D R I N K S
Health hits the headlinesHealth continued to be one of the defining trends for soft drinks in 2017. Low and no sugar variants grew in carbonates categories, while water and water plus, continued to experienced strong growth as consumers searched for healthier hydration solutions.
As the industry geared up for the introduction of the soft drinks industry levy, significant innovation in the form of product reformulation took place. The extent of this was widely viewed as well above expectation and cemented soft drinks as the leading category amongst its peers.
The result of these reformulations meant the industry’s predicted exposure to the levy fell by over £200m1.
Source: 1. Nielsen Scantrack, Sugar Levy Market Segmentation,
March 2016 v March 20182. Nielsen & CGA Combined Market Read, Value Sales,
52 Wk to Dec 2017
3. Nielsen Scantrack, Value Sales, 52 Wk to Dec 20174. Britvic plc Annual Report and Accounts 2017
01
Britvic Soft Drinks Review Grocery
TOTAL SOFT DRINKS CHANNEL PERFORMANCE THE YEAR IN NUMBERS REVIEW INFLUENCES AND CONSIDERATIONS FUTURE OUTLOOK CONCLUSION APPENDIX CONTENTS
T O T A LS O F T D R I N K SC O N T I N U E D
ROBINSONS REFRESH’D
W A S N A M E D T H E No 1
S O F T D R I N K S
N P D L A U N C H
I N 2 0 1 7
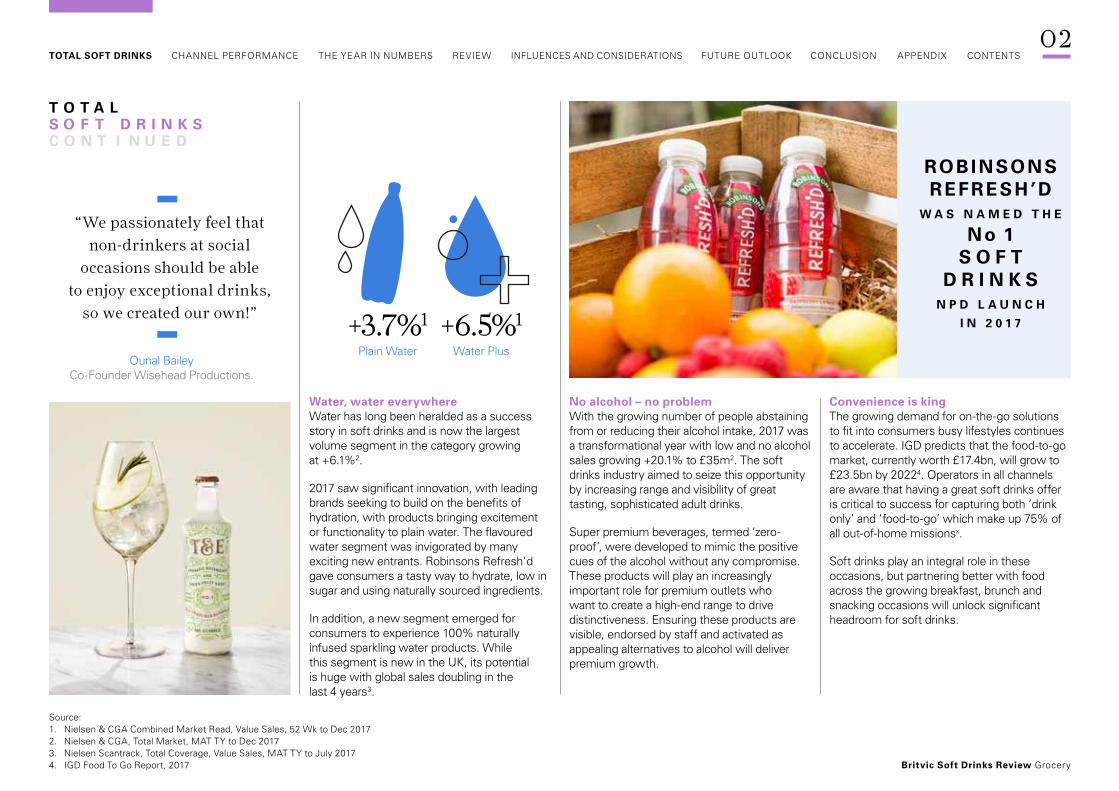
Water, water everywhereWater has long been heralded as a success story in soft drinks and is now the largest volume segment in the category growing at +6.1%2.
2017 saw significant innovation, with leading brands seeking to build on the benefits of hydration, with products bringing excitement or functionality to plain water. The flavoured water segment was invigorated by many exciting new entrants. Robinsons Refresh’d gave consumers a tasty way to hydrate, low in sugar and using naturally sourced ingredients.
In addition, a new segment emerged for consumers to experience 100% naturally infused sparkling water products. While this segment is new in the UK, its potential is huge with global sales doubling in the last 4 years3.
No alcohol – no problemWith the growing number of people abstaining from or reducing their alcohol intake, 2017 was a transformational year with low and no alcohol sales growing +20.1% to £35m2. The soft drinks industry aimed to seize this opportunity by increasing range and visibility of great tasting, sophisticated adult drinks.
Super premium beverages, termed ‘zero-proof’, were developed to mimic the positive cues of the alcohol without any compromise. These products will play an increasingly important role for premium outlets who want to create a high-end range to drive distinctiveness. Ensuring these products are visible, endorsed by staff and activated as appealing alternatives to alcohol will deliver premium growth.
Convenience is kingThe growing demand for on-the-go solutions to fit into consumers busy lifestyles continues to accelerate. IGD predicts that the food-to-go market, currently worth £17.4bn, will grow to £23.5bn by 20224. Operators in all channels are aware that having a great soft drinks offer is critical to success for capturing both ‘drink only’ and ‘food-to-go’ which make up 75% of all out-of-home missionsx.
Soft drinks play an integral role in these occasions, but partnering better with food across the growing breakfast, brunch and snacking occasions will unlock significant headroom for soft drinks.
+6.5%1
Water Plus
+3.7%1
Plain Water
Source: 1. Nielsen & CGA Combined Market Read, Value Sales, 52 Wk to Dec 20172. Nielsen & CGA, Total Market, MAT TY to Dec 20173. Nielsen Scantrack, Total Coverage, Value Sales, MAT TY to July 20174. IGD Food To Go Report, 2017
Ounal Bailey Co-Founder Wisehead Productions.
“We passionately feel that non-drinkers at social
occasions should be able to enjoy exceptional drinks,
so we created our own!”
02
Britvic Soft Drinks Review Grocery
TOTAL SOFT DRINKS CHANNEL PERFORMANCE THE YEAR IN NUMBERS REVIEW INFLUENCES AND CONSIDERATIONS FUTURE OUTLOOK CONCLUSION APPENDIX CONTENTS

Created for kids
Especially for adults
Inspired lifestyle choices
Elevated food moments
Sensational social experiences
T O T A LS O F T D R I N K SC O N T I N U E D
Paying a premiumConsumers expectations for healthier, more convenient and more experiential solutions have presented an opportunity for operators to differentiate and add value.
At a total market level, value and volume sales of soft drinks grew at similar rates, but this trend masked the fact that the soft drinks category took steps to deliver the premium opportunity, developing ranges through premium NPD accounting for 43% of all launches, up from 30% in 20161.
In the licensed sector, premium soft drinks were a key growth driver up +32%. But more opportunity still exists, as premium share is still low at 7% versus spirits 30% & beer 43%2.
Sustainable soft drinksThe wider environmental impact of the packaged food and drink industry was increasingly in the spotlight. With global recycling rates currently low and litter a growing concern, the increasing consumption of single use plastic and its end of life impact on the environment has rightly been called in to question.
The soft drinks industry has a role to play in minimising the impact of its activities on the environment. It must work hard to understand the causes of plastic waste, educate the consumers to recycle wherever possible and drive innovative packaging solutions which reduce the use of less sustainable materials.
Britvic have recently launched their sustainability platform ‘A Healthier Everyday’ to help achieve such goals.
Future soft drinks opportunitiesIn 2017, the soft drinks industry has demonstrated its ability to evolve within a dynamic environment and deliver strong performance. While the category has performed well, Britvic believe there is even greater potential for the future to inspire the entire industry to think differently.
Britvic have developed ‘Drink Differently’, fresh thinking for soft drinks growth. This is the Britvic vision for the future of the soft drinks category, with the potential to deliver £2.6bn of incremental soft drinks growth over 5 years.
5 category growth drivers have been identified capable of delivering sensational soft drinks, for every consumer, on every mission, in every occasion.
Source: 1. Nielsen Scantrack, Total Coverage, Value Sales, MAT TY to Nov 20172. CGA On Premise Measurement Service, MAT TY to 30.12.17
www.britvic.com/sustainable-business/healthier-people
03
Britvic Soft Drinks Review Grocery
TOTAL SOFT DRINKS CHANNEL PERFORMANCE THE YEAR IN NUMBERS REVIEW INFLUENCES AND CONSIDERATIONS FUTURE OUTLOOK CONCLUSION APPENDIX CONTENTS

£38bn2
£40bn (2017)Value of convenience market
£9.7bn2
£10.4b (2017)Value of online market
C H A N N E L P E R F O R M A N C E
Online continues to shine
A s consumers led increasingly busy lives, online and convenience channels continued to grow at pace in 2017. Tesco, Asda, Morrisons and Sainsbury’s all developed a strong online
presence but Ocado1 continued to be the frontrunner with its solid recruitment strategy. However, competition in the market was shaken up with the arrival of a new, high profile entrant on the playing field in the form of Amazon, which started offering fresh grocery deliveries to its customers.
Continued convenience growth with multiple convenience leading the wayManufacturers were increasingly challenged to work with the major retailers to deliver the right offering for their convenience format stores. Providing the right range, in a relevant pack format, at the right price or promotional offer was key to optimising growth in this channel and it clearly worked as multiples led the growth within the convenience channel at 7.9%2.
Bricks and mortarWhile online and convenience continued to lead growth in the market, there was also a focus on improving performance within the traditional bricks and mortar business. Ensuring optimal performance from the core estate is critical to sustaining a growth trajectory. However, store growth slowed as the market became more saturated and opportunities for further expansion of store numbers for some retailers reduced.
Step changing market consolidation hit the headlinesSeveral mergers and acquisitions were announced in 2017 which are set to change the shape of the grocery channel for years to come. Tesco’s takeover of Booker will create a retail powerhouse, while further announcements from McColls on its deal with Morrisons to supply its entire estate, as well as plans to revive the Safeway brand as part of a roll out across its stores, signalled further shifts within the channel. There was still more to come as Morrisons announced its partnerships with Rontec and Co-op bought Nisa as part of its takeover, subject to approval from the Competitions & Markets Authority (CMA). With many of the changes yet to be implemented, it is impossible to say what this will mean for the channel moving forwards, though the landscape of grocery is likely to evolve as a result.
Sources: 1. IGD Retail Analysis, Ocado Retail Revenue Up +12.4%, 20172. IGD The UK Convenience Market 2017
04
Britvic Soft Drinks Review Grocery
TOTAL SOFT DRINKS CHANNEL PERFORMANCE THE YEAR IN NUMBERS REVIEW INFLUENCES AND CONSIDERATIONS FUTURE OUTLOOK CONCLUSION APPENDIX CONTENTS

T H E Y E A R I N N U M B E R S
O V E R A L L G R O C E R Y S A L E S
Q 4 S A L E S D E C E M B E R G R O W T H VA L U E G R O W T H
L I D L
T O TA L VA L U E O F S O F T D R I N K S I N G R O C E R Y
+1.8% 1YoY sales growth
All retailers saw growth as a result of derived inflation with value ahead of volume growth. But the dynamics amongst the retailers continue to change as Aldi & Lidl saw the greatest gains alongside high street discounters, as they gain shoppers from the Top grocers, with ASDA and Co-op seeing the greatest losses.
+1.8% 1 YoY sales growth
+2.3% 1 YoY sales growth
+3.81% 3 Morrisons
+3.44% 3 Waitrose
+22%2YoY % change
£5.7bn3 +3.01%
“Total soft drinks value grew by 3.01% ahead of 2016 projections of 1.5 – 2% (Soft Drinks Review 2017, Nielsen Scantrack). Categories to add the greatest absolute growth were smoothies, cola & mixers ahead of
plain water the biggest contributor to growth last year”.
M O V E M E N T I N T H E S U P E R M A R K E T S
Source: 1. Nielsen Scantrack, TSR Grocery Multiples (Including General Merchandise), YOY Sales Growth, 52 Wk to WE 30.12.17.2. Kantar Worldpanel, Data Explorer Spend £000, Difference vs. YA, 52 Wk to WE 30.12.173. Nielsen Scantrack, Grocery Multiples, 52 Wk to WE 30.12.17
05
Britvic Soft Drinks Review Grocery
TOTAL SOFT DRINKS CHANNEL PERFORMANCE THE YEAR IN NUMBERS REVIEW INFLUENCES AND CONSIDERATIONS FUTURE OUTLOOK CONCLUSION APPENDIX CONTENTS
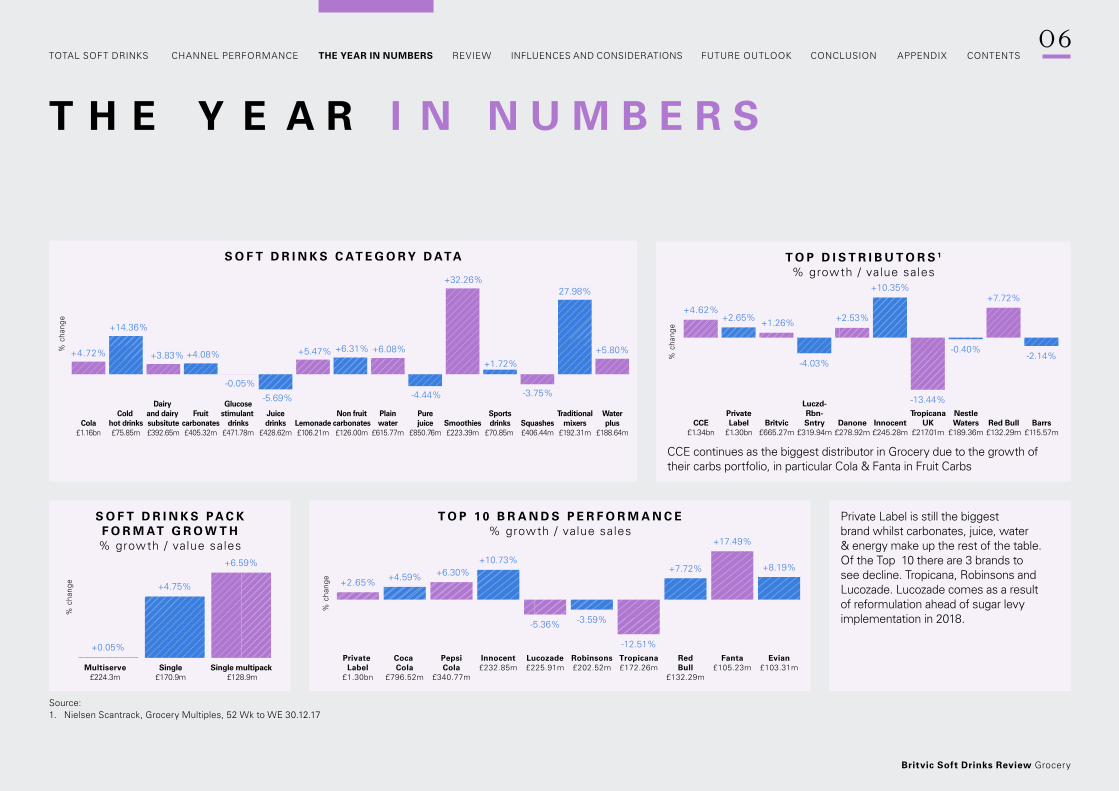
+2.65% +4.59% +6.30%+10.73%
-5.36% -3.59%
-12.51%
+7.72%
+17.49%
+8.19%
% c
hang
e
Private Label
£1.30bn
PepsiCola
£340.77m
Lucozade£225.91m
Tropicana£172.26m
Fanta£105.23m
Coca Cola
£796.52m
Innocent£232.85m
Robinsons£202.52m
RedBull
£132.29m
Evian£103.31m
+4.72%
+14.36%
+3.83% +4.08%
-0.05%
-5.69%
+5.47% +6.31% +6.08%
-4.44%
+32.26%
+1.72%
-3.75%
Cola£1.16bn
% c
hang
e
Cold hot drinks£75.85m
Dairy and dairy subsitute£392.65m
Fruitcarbonates£405.32m
Glucosestimulant
drinks£471.78m
Juicedrinks
£428.62mLemonade£106.21m
Non fruitcarbonates£126.00m
Plainwater
£615.77m
Purejuice
£850.76mSmoothies£223.39m
Sportsdrinks
£70.85m Squashes£406.44m
Traditionalmixers
£192.31m
Waterplus
£188.64m
27.98%
+5.80%
+4.62%+2.65% +1.26%
-4.03%
+2.53%
+10.35%
-13.44%
-0.40%
+7.72%
-2.14%
CCE£1.34bn
% c
hang
e
PrivateLabel
£1.30bnBritvic
£665.27m
Luczd-Rbn-Sntry
£319.94mDanone
£278.92mInnocent£245.28m
TropicanaUK
£217.01m
NestleWaters
£189.36mRed Bull£132.29m
Barrs£115.57m
+0.05%
+4.75%
+6.59%
% c
hang
e
Multiserve£224.3m
Single£170.9m
Single multipack £128.9m
T H E Y E A R I N N U M B E R S
T O P D I S T R I B U T O R S 1
% growth / value sales
S O F T D R I N K S PA C K F O R M AT G R O W T H
% growth / value sales
Private Label is still the biggest brand whilst carbonates, juice, water & energy make up the rest of the table. Of the Top 10 there are 3 brands to see decline. Tropicana, Robinsons and Lucozade. Lucozade comes as a result of reformulation ahead of sugar levy implementation in 2018.
CCE continues as the biggest distributor in Grocery due to the growth of their carbs portfolio, in particular Cola & Fanta in Fruit Carbs
T O P 1 0 B R A N D S P E R F O R M A N C E% growth / value sales
S O F T D R I N K S C AT E G O R Y D ATA
Source: 1. Nielsen Scantrack, Grocery Multiples, 52 Wk to WE 30.12.17
06
Britvic Soft Drinks Review Grocery
TOTAL SOFT DRINKS CHANNEL PERFORMANCE THE YEAR IN NUMBERS REVIEW INFLUENCES AND CONSIDERATIONS FUTURE OUTLOOK CONCLUSION APPENDIX CONTENTS

T H E Y E A R I N N U M B E R S
+120.92%
+4.59% +2.65% +6.30% +10.73%
+76.41%
+17.49% +23.08%+7.72% +8.29%
% c
hang
e
Fever-Tree£74.21m
PrivateLabel
£1.30bn
Innocent£232.85m
Fanta£105.23m
Red Bull£132.29m
Coca Cola
£796.52m
PepsiCola
£340.77m
Naked£58.27m
Monster£86.72m
HighlandSpring
£78.21m
T O P B R A N D S I N G R O W T HRanked by highest value ABS dif ference vs YA
T O P B R A N D S I N D E C L I N ERanked by lowest value ABS dif ference vs YA
Adding the greatest growth is Fever Tree – helped by increased distribution and a shopper preference for premium alcohol
Making up the decline are primarily juice brands.
Source: 1. Nielsen Scantrack, Grocery Multiples, 52 Wk to WE 30.12.17
-12.51%-5.36% -5.18%
-18.76%
-3.59%-14.52% -18.83% -16.20%
-9.22%
-73.18%
% c
hang
e
Tropicana£172.28m
Buxton£73.07m
Robinsons£202.52m
Vita Coco£21.55m
J20£35.93m
Lucozade£225.91m
Shloer£25.46m
Copella£36.17m
Frijj£31.64m
Flora ProActiv
£1.33m
07
Britvic Soft Drinks Review Grocery
TOTAL SOFT DRINKS CHANNEL PERFORMANCE THE YEAR IN NUMBERS REVIEW INFLUENCES AND CONSIDERATIONS FUTURE OUTLOOK CONCLUSION APPENDIX CONTENTS

S oft drinks sales in grocery multiples outperformed the market, showing +3%1 value growth, compared to total
coverage at +2.2%2. The category also outperformed total grocery (which grew +1.8%3), indicating resilience. So, while it continued to be a challenging year in terms of volume increases, value sales of soft drinks remained on par with other impulse categories, such as confectionery4.
With value growing ahead of volume, the rise of more premium and adult offerings helped the soft drinks category deliver over £5.7bn1 in value sales. Sub categories like lemonade and mixers contributed to this growth, delivering premium innovation through adventurous flavours and quality packaging materials and finishes, to deliver a more aspirational product to an ever more demanding shopper. It wasn’t just the brands that sought to capitalise on this trend, in 2017 there were also more own label premium brand launches than ever before5.
Sales of soft drinks for the top four discounters continued to outperform the top four grocers, with growth at +15.5%6. In fact, Aldi and Lidl grew their soft drinks value five times ahead of the rest of the market7. With a growing number of shoppers now doing their full weekly shop in a discounter store and a continuous drive for new store openings, this put enormous pressure on the traditional grocers to compete.
When it came to soft drinks formats, multi-serve packs remained the biggest segment in 2017, yet delivered a flat performance YOY. Meanwhile, formats including single serve (+4.7%) and multipack cans (+6.5%) saw significant growth and contributed to 99% of the value growth, adding £165m1 in sales between them. The positive performance for single serve packs was driven by the growing consumer demand for food to go, while multipacks continue to offer value and better portion control for consumers, making them especially popular with families.
Changing consumer trends influenced both the product choices being made and the introduction of new and exciting brands. This, coupled with significant plans for retailer consolidation, meant the soft drinks market continued to evolve at an ever-increasing pace. In order to keep up, many retailers tried to achieve the delicate balance between offering simple ranges and price promotions, whilst also capitalising on evolving product choices.
R E V I E W S U M M A R YW H AT WA S T H E S T O R Y O F S O F T D R I N K S I N G R O C E R Y ?
Source: 1. Nielsen Scantrack, Grocery Multiples, 52 Wk to WE 30.12.172. Nielsen Scantrack, Total Coverage, 52 Wk to WE 30.12.173. Nielsen Scantrack, TSR Grocery Multiples (Including General
Merchandise), YOY Sales Growth, 52 Wk to WE 30.12.17
4. Nielsen Scantrack, TSR Grocery Multiples (Including General Merchandise), YOY Sales Growth, 52 Wk to WE 30.12.17
5. Kantar / AC Nielsen State of the Nation Research, Total Grocery, 2017
6. Kantar Worldpanel, Data Explorer Spend (£000), Difference vs YA, 52 Wk to WE 30.12.17
7. Kantar Worldpanel, 52 Wk to WE 30.12.17
08
Britvic Soft Drinks Review Grocery
TOTAL SOFT DRINKS CHANNEL PERFORMANCE THE YEAR IN NUMBERS REVIEW INFLUENCES AND CONSIDERATIONS FUTURE OUTLOOK CONCLUSION APPENDIX CONTENTS

£1.9m
£2.2m
£4.1m
£6.2m
£1.2bn
Traditional Mixers
Smoothies
Fruit Carbonates
Plain Water
Cola
What were the Key Soft Drinks Influences from 2017?
H E A LT H Y S A L E S O N O F F E R B U T TA S T E I S S T I L L N O .1
T he health agenda continued to be one of the defining trends in soft drinks in 2017, as great tasting low and no sugar brands
outperformed their full sugar rivals in categories like cola, fruit carbonates and lemonade. As expected, traditional healthier segments such as water, water plus and particularly smoothies also continued to experience strong growth2.
Range rationalisation across the category remained an important focus for retailers. However, attention turned to re-balancing space to the categories that showed long term growth potential, such as those with a focus on health and products that were ‘on trend’.
Despite this continued shift towards healthier lifestyles, choice is still important and sub categories such as full sugar cola continue to remain relevant. However, with the forthcoming sugar levy looming, it was no surprise that most manufacturers focused heavily on leading their execution strategy with low and no sugar variants, or reformulating products altogether.
But, did consumers universally like these new, reformulated additions? Taste is the number one factor when choosing a soft drink1 and in reality, 2017 saw varied levels of brand performance following the introduction of some of these new recipes. Fanta enjoyed a good year and performed well with Fanta Zero (+46%) and Fanta Standard growing (+5%), between then adding nearly £16m2. However, there is no doubt that Lucozade Energy was less well received and contributed to its sales declined of £13m2.
1
Source: 1. Britvic Health Research 20172. Nielsen Scantrack, Grocery Multiples, 52 Wk to WE 30.12.17
T O P 5 B I G G E S T G R O W E R S I N S O F T D R I N K S 2
09
Britvic Soft Drinks Review Grocery
TOTAL SOFT DRINKS CHANNEL PERFORMANCE THE YEAR IN NUMBERS REVIEW INFLUENCES AND CONSIDERATIONS FUTURE OUTLOOK CONCLUSION APPENDIX CONTENTS

+28%4Mixers growth
+£42m4Mixers additional
sales value
T H E Y E A R S O F T D R I N K S G R E W U P
2
C ore soft drinks consumption tends to be between the ages of 12 – 35 years old3. Beyond this age consumption usually
dips, often in favour of hot drinks like tea and coffee or alcohol. However, last year the grocery channel started to address this by increasing the range of adult softs such as mixers and zero proof drinks and bringing more excitement to the category by featuring exciting serve ideas in summer festival events in store. This led to strong performances from sub categories such as mixers, which grew by +28%4 and added £42m4 additional sales value. Fever Tree was the standout performer and the fastest growing brand in grocery mults (+120%)4, but other premium mixers also began to emerge, including The London Essence Company.
Despite growing pressures on consumer spending in 2017, many consumers were still willing to trade up for brands worth paying more for. This, combined with the continued rise of in home socialising and increased consumer interest in exploring new tastes and
Source: 1. Mintel Attitudes to Alcohol Consumption 20152. Mintel Food & Drink Report, March 2017
3. Kantar Usage Data, MAT to Dec 174. Nielsen Scantrack, Grocery Multiples,
52 Wk to WE 30.12.17
1 in 51
UK adults are now tee-total
1 in 32
Consumers are limiting or reducing their
alcohol consumption
experiences, resulted in growing demand for more sophisticated, adult-friendly soft drinks portfolio. The category responded with premium adult propositions, like Robinsons Creations and Cordials ranges, to drive relevancy amongst an older target market. Similarly, there was an emergence of more sophisticated flavours in smoothies and juices with vegetable flavours becoming more commonplace in the market. Cold press was also more widely distributed in response to new brands, such as Savse.
There was a blurring of boundaries between the traditional adult category and low and no alcohol brands, which were merchandised alongside beers, wines and spirits. A number of brands have entered this space in recent years, such as the non-alcoholic spirit Seedlip which, following online listings with Ocado, successfully gained listings in Tesco in the latter part of 2017.
10
Britvic Soft Drinks Review Grocery
TOTAL SOFT DRINKS CHANNEL PERFORMANCE THE YEAR IN NUMBERS REVIEW INFLUENCES AND CONSIDERATIONS FUTURE OUTLOOK CONCLUSION APPENDIX CONTENTS

3
VA L U E M A D E S I M P L E
A s inflation returned with a vengeance to the supply chain in 2017, coupled with the continued growth of Discounters with their
basic pricing model, so the established operators sought to deliver clearer value to shoppers through simplifying pricing. The traditional approach of high base prices supported with aggressive short term promotional offers became less popular, despite shoppers themselves responding most favourably to deep cut price mechanics. Instead a number of retailers sought to move more products to the “Every Day Low Price” model (EDLP) where promotional discounts are rolled into base prices. Across the market the number of products within total soft drinks that were offered on EDLP increased by +1.6% to encompass nearly 1/3rd of all products1.
Despite this shift, volume sales in soft drinks were pretty flat YOY (0%), indicating that growth was driven predominately by price inflation, with the average price increasing by +2.6% in total soft drinks2. With the exception of dilutes and sports drinks all other sub categories saw increases in average price in 20172. This was particularly evident in the likes of cola (+9%), but also lemonade (+10%) and mixers (+17%)2 which all experienced trends for a greater level of premiumisation and helped to deliver growth. In addition, volume sold on deal was down YOY in nearly all categories, and this has coincided with depth of deal reducing in several categories as well2.
In an attempt to sustain and drive value in the market, manufacturers focused innovation further up the value chain. Recognising the importance of providing an improved level of quality in their ‘good’ range and reinforcing the increased price point that can be commanded
Source: 1. Nielsen Scantrack, Grocery Multiples, MAT to WE 25.11.172. Nielsen Scantrack, Grocery Multiples, 52 Wk to WE 30.12.17
by a brand vs. own label, many suppliers delivered innovation in the ‘better’ and ‘best’ tiers. In fact, the percentage of premium NPD launched in grocery mults increased from 30% in 2016 to 43% in 20171.
Cola remained the category with the most features and display across grocery mults. However, in keeping with the health trend, this declined in 2017 in support of other strong performing sub categories such as energy, water plus and plain water2, as well as mixers and smoothies which experienced good growth2. As a consequence, some of the other categories that traditionally received large share of features, such as fruit carbonates, pure juice and dilutes, all had reduced feature and display YOY.
+9%2increase in
average price
+10%2increase in
average price
+17%2increase in
average price
C O L A
L E M O N A D E
M I X E R S
1 1
Britvic Soft Drinks Review Grocery
TOTAL SOFT DRINKS CHANNEL PERFORMANCE THE YEAR IN NUMBERS REVIEW INFLUENCES AND CONSIDERATIONS FUTURE OUTLOOK CONCLUSION APPENDIX CONTENTS

Hypermarkets£16.4bn
Supermarkets£86.3bn
Convenience£38.0bn
Discount*
£18.2bnOnline£9.7bn
Online-retailers**
£11.8bn
% c
hang
e be
twee
n 20
17-2
022
+1%
+5.9%
+17.7%
+49.8%+53.8%
+3.6%
T he IGD predicts that whilst Hypermarkets & Supermarkets combined will remain the biggest formats, others will continue
to lead the way in terms of growth. Convenience is predicted to remain the 3rd biggest format in 2022 (+17% value change vs 2017), Discounters next (+50% vs 2017) and Online 5th (+53% vs 2017)1.
Source: 1. IGD Retail Analysis, UK Country Presentation, Aug 17
* ‘Discount’ includes all sales of Aldi, Lidl and grocery only sales of principal variety discounters.** ‘Other retailers’ includes specialist food and drink retailers, CTNs, and food slaes from mainly
non-food retailers and street markets.
F U T U R E O U T L O O KG R O W T H O F D I S C O U N T E R S , O N L I N E & C O N V E N I E N C E W I L L C O N T I N U E T O B E R I S I N G S TA R S .
P R E D I C T E D F U T U R E T R E N D S F O R C H A N N E L P E R F O R M A N C E I N 2 0 2 2
2017 value (£bn) Change in value £bn 2017-2022
1 2
Britvic Soft Drinks Review Grocery
TOTAL SOFT DRINKS CHANNEL PERFORMANCE THE YEAR IN NUMBERS REVIEW INFLUENCES AND CONSIDERATIONS FUTURE OUTLOOK CONCLUSION APPENDIX CONTENTS

S oft Drinks remain a key category for grocery customers. It is the second largest unit sales and the third largest value sales
category1. With high household penetration (97.4%) and frequency (47.6)2, the reality remains that this is category that is relevant and popular to the clear majority of UK shoppers. However, consumers tastes and shopping habits are changing so it is important for retailers to adapt their offering so that they are well placed to benefit into the future. Despite there being 56bn consumption occasions in home just 1 in 3 contain a soft drink3.
Britvic identified key trends through our ‘Drink Differently’ category vision, identifying 5 category growth drivers that will help retailers capitalise on these opportunities and deliver soft drinks sales success for retailers over the next five years.
F U T U R E O U T L O O K C O N T I N U E D
MOTIVATE MORE ADULTS TO CHOOSE SOFT DRINKS, BECOMING THEIR PREFERRED CHOICE ON MORE OCCASIONS
CREATE TASTY, HEALTHY & EXCITING SOFT DRINKS WHICH ARE LOVED BY KIDS AND TRUSTED BY PARENTS
CREATED FOR KIDS
NUDGE THE NATION TOWARDS POSITIVE DRINKS CHOICES EVERY DAY
INSPIRED LIFESTYLE CHOICES
ELEVATE EVERY FOOD MOMENT WITH THE PERFECT SOFT DRINK PARTNERSHIPS
ELEVATED FOOD MOMENTS
CREATE SENSATIONAL SOCIAL EXPERIENCES, RE-DEFINING THE POSSIBILITIES FOR SOFT DRINKS
SENSATIONAL SOCIAL EXPERIENCES
ESPECIALLY FOR ADULTS
COOL FOR KIDS
ENERGY FOR LIFE
BETTER FORME AND MY
FAMILY
TRADE UP THE TAP
TAILOR MY FLAVOUR
KIDS’ DRINK FOR EVERY OCCASION
CRAFTED WITH CARE
HYRDRATION FOR THE NATION
FOOD TO GO 2.0
MAGICAL MIXED DRINKS
GROW UP WITH
EVERY KID
HEALTHY HEROES
TASTE WITHOUT
COMPROMISE
BREAKFASTOTG
PROGRESSIVELY PREMIUM
HELP PARENTS SAY YES
WONDERFUL WARMERS
SUSTAINABLE SOFT DRINKS
SOCIAL FOOD SOLUTIONS
Source: 1. Bigger Picture Report, Grocery Multiples, Full TSR, Value Sales,
MAT to WE 30.12.172. Kantar Purchase Data, MAT to WE 31.12.173. Kantar Usage and OOH Purchase Data, MAT to Mar 17
13
Britvic Soft Drinks Review Grocery
TOTAL SOFT DRINKS CHANNEL PERFORMANCE THE YEAR IN NUMBERS REVIEW INFLUENCES AND CONSIDERATIONS FUTURE OUTLOOK CONCLUSION APPENDIX CONTENTS

12%1
of Soft drinks volume is expected to be liable when the levy kicks in
49%2
were not aware of the Soft Drinks Industry levy
P eople are increasingly conscious of what they are choosing and health was increasingly influential in 2017.
Sales of products that supported a healthier lifestyle increased including diet and fitness books, smart watches and fitness trackers to name a few.
Growth of Low and No sugar and the introduction of the Soft Drinks Industry LevyWith the announcement of the Soft Drinks Industry Levy in 2016, soft drinks manufacturers have accelerated healthier product innovation. Equally a number of retailers have followed suit by reformulating own brand offerings to make them levy exempt. Whereas 25% of Soft drinks volume would have been liable to the sugar levy in 2016, we expect just 12% to be liable when the levy kicks in. This is before we consider consumer reaction to higher prices of the levy liable products and manufacturer / retailer nudging towards low sugar variants.1
Despite considerable awareness and action within the industry, the reality remains that most consumers have a low awareness and understanding of the levy. Britvic partnered with Mumsnet and identified that only 49% of those interviewed had heard of the Levy. This presents retailers with both a challenge and an opportunity. They need to find ways to inform and educate shoppers about the Levy but must been seen to act in the spirit of the initiative whilst continuing to offer choice to those who still want to buy a higher sugar content drink. In the same way retailers provide a neutral and confident tone when communicating Duty levels and %ABV on alcohol to shoppers, so we see an opportunity for them to do the same in soft drinks through this period of change.
F U T U R E O U T L O O K C O N T I N U E D
Inspired lifestyle choices
Source: 1. Britvic Forecast based on Nielsen Scantrack, Total Coverage, 52 Wks2. Britvic Sugar Tax Survey, Conducted by Mumsnet, December 2017
14
Britvic Soft Drinks Review Grocery
TOTAL SOFT DRINKS CHANNEL PERFORMANCE THE YEAR IN NUMBERS REVIEW INFLUENCES AND CONSIDERATIONS FUTURE OUTLOOK CONCLUSION APPENDIX CONTENTS

F U T U R E O U T L O O K C O N T I N U E D
Delivering on Taste without compromiseWhilst the intention of the levy is to encourage consumers to make healthier choices, delivering on taste will remain the key driver of growth. Taste remains the No1 factor when choosing a drink1 but this needs to be balanced with healthier credentials too, meaning retailers need to carefully consider range and space choices to offer an increasing selection of great tasting, healthier offerings. Using brands that are proven successes as beacons, retailers should consider increasing visibility to help more shoppers switch to healthier choices and supplement this with a combination of some simple activation at fixture, visible promotions to drive trial or even educational messages. The incentive to get this right is greater than just “doing the right thing”, the sugar free shopper spends more, visits more often and buys more volume than a full sugar shopper2.
Hydration for the Nation50% of UK households are trying to drink more water3 but the risk of a generation switching from soft drinks to tap water is enough to worry any retailer. Therefore, finding ways to build on the benefits of water presents a great opportunity to continue to grow soft drinks scale.
In 2017 plain water (+6%) and water plus (+5.8%) continued to see strong growth as consumers sought out healthier options4. Finding ways to continue to focus on this trend through offering a range of healthier options that deliver on hydration, taste and natural ingredients is key to harnessing this trend. Retailers should concentrate on using plain water to create health and hydration hot spots for shoppers but seek to capture more value by locating enhanced categories like water plus or dilutes next to water to encourage shoppers to trade up their purchase, therefore capturing more value.
1.7Lts5
The volume of water the average UK person drinks per day
+6%4
Plain water growth in 2017
Source: 1. Britvic Health Research 20172. Kantar Worldpanel, Take Home, Total Carbonates, 52 Wk to WE 25.02.18 3. Britvic Healthfact Database Nov 174. Nielsen Scantrack, Total Grocery, MAT to WE 30.12.175. World Health Organization, 2015
15
Britvic Soft Drinks Review Grocery
TOTAL SOFT DRINKS CHANNEL PERFORMANCE THE YEAR IN NUMBERS REVIEW INFLUENCES AND CONSIDERATIONS FUTURE OUTLOOK CONCLUSION APPENDIX CONTENTS

F U T U R E O U T L O O K C O N T I N U E D
T here are almost 32m adults over 35 in the UK and it’s the fastest growing population group. (ONS population survey 2015).
Soft drinks has traditionally struggled to meet the needs of this age group for health, quality and function. Times are changing, though, with some macro trends now making a noticeable impact on soft drinks. In the last 5 years zero alcohol drinks have grown significantly and over 1 in 5 UK adults is now tee-total1. There is an opportunity to cater better for adult needs and drive more sales from this group.
Crafted with careOver half of all adults find ‘natural’ or ‘real’ attributes most appealing when choosing a drink (Kantar Squash Drivers 2015). A few manufacturers have step changed their presence in 2017 and have created a more sophisticated premium adult category focused on crafted drinks with a more grown up twist. The continued sales growth of brands like Fever Tree and Franklin & Sons alongside more adult flavour innovation from Seedlip and London Essence Company demonstrated how soft drinks can deliver against this opportunity. To continue to exploit the trend, retailers should keep improving the choice of their offer and locate this between alcohol and mainstream adult offerings to make it easy for shoppers to find these offerings in store. At key seasonal times like Summer and Christmas, retailers can use events like Drinks Festivals to showcase their offerings and reinforce the premium cues by using the strong finished drink imagery that most manufacturers provide with their brands.
Source: 1. Mintel Attitudes to Alcohol Consumption 20152. Kantar Usage Panel, MAT to Mar 173. Nielsen Scantrack, Grocery Multiples, Value Sales, MAT to WE 02.09.17
Energy for LifeWhilst energy remains a very important category, the offerings for adults only meet 1 in every 12 occasions2. There remains an opportunity to provide adults with the energy they need to tackle ever day life but to do this in a more sustained way. The natural energy category has continued to grow at double digit in the last year and is now worth £59m RSV (+37% value growth whilst traditional energy has declined over the same period3. Brand like Purdey’s have successfully driven the category and has established itself as the largest and fastest growing natural energy brand3. Retailers can continue to capitalise on the long-term switch from traditional to natural energy by locating leading brands next to established offerings in the chiller and making sure that they also offer multipack choices at the back of store fixture as 25% of emerging energy shoppers buy more than 3 bottles per trip.
Especially for adults
16
Britvic Soft Drinks Review Grocery
TOTAL SOFT DRINKS CHANNEL PERFORMANCE THE YEAR IN NUMBERS REVIEW INFLUENCES AND CONSIDERATIONS FUTURE OUTLOOK CONCLUSION APPENDIX CONTENTS

T here are over 16m kids in the UK who like to consume a wide variety of beverages be it juice, water, cola or carbonates. On
average kids drink more soft drinks than adults averaging 9 drinks per week1. However, we know that just 4% of these drinks come for the kids’ category and parents, as the gatekeeper, are constantly searching for a balance between health and fun.
Helping parents to say yes!Childhood obesity was amongst the leading health concerns in the UK2 putting pressure on parents to make the right choices. Parents remain more likely to say yes to a treat out of home but in home the focus remains on healthier options with additional benefits like added vitamins or no artificials3. Brand leaders like Fruit Shoot responded to these needs by launching new packaging that reinforces its ‘made with added fruit’ and ‘no sugar’ credentials whilst Capri Sun launched a summer TV campaign focussing on its No Added Sugar range. Retailers can help reassure parents and build their trust in the category by offering the right range of products to suit different ages and balance the offer between more treat-based products and those that are healthier and school’s approved.
F U T U R E O U T L O O K C O N T I N U E D
Created for kids
Source: 1. Kantar Usage Data, Kids 0-15 to Dec 162. Mintel Children’s Eating Habits, UK Dec 20173. Project Juicy Truth, Attitudes to Health 2016
17
Britvic Soft Drinks Review Grocery
TOTAL SOFT DRINKS CHANNEL PERFORMANCE THE YEAR IN NUMBERS REVIEW INFLUENCES AND CONSIDERATIONS FUTURE OUTLOOK CONCLUSION APPENDIX CONTENTS

F U T U R E O U T L O O K C O N T I N U E D
Elevated food moments
N othing tastes better than food and drink together and there remains an opportunity for soft drinks to build even better
food partnerships. With most retailers offering meal deal solutions that target the lunchtime and the meal for tonight occasion, the opportunity to enhance the partnership is very real in 2018.
Food to Go 2.070% of all UK adults had food to go in the last 6 months, which means that there were 10.3 billion food to go trips. With so many store locations around the UK visited by almost all of the population on a regular basis, expanding the range of shopper missions is key to driving sales in 2018. Despite the strength of store numbers, the grocers accounted for only 7% of the UK Food to Go market.
There is an opportunity to sell more soft drinks with Food on the Go as they were only bought on 24% of occasions7. The big opportunity is to link more soft drinks with food to go. In fact, food to go is a key mission for soft drinks. In 2017 45% of shoppers were on a Food to go mission when buying a soft drink. However, shoppers aged over 24 are less engaged than the younger 16 – 24yr generation, with 59% likely to be on a food to go trip versus older age groups. So, it’s important to appeal to this shopper, which is more demanding in terms of fast speed of service and availability of products, in order to satisfy their needs.
To capitalise on the opportunity the Grocers need to play to their strengths in Food To Go. The Grocers tend to have good chilled space and shopper friendly adjacencies between drinks & food at the front of store. Tactics such as ensuring unmissable availability and focusing on initiatives like linking meal deals with soft drinks and food via relevant innovation, communication and activation are ways of driving this opportunity harder to deliver future soft drinks category growth.
Is Grocery ready for the soft drinks levy?The implementation of the Soft Drinks Levy will represent one of the most significant disruptions to the soft drinks category in recent years. Whilst some retailers will wait in anticipation to understand consumer reaction and any resulting change in shopper behaviour others may see the introduction of the Levy as an opportunity to re-enforce their corporate position on health.
The industry response to the introduction of the Soft Drinks Levy has seen several reformulations already in brought to market to get brands under the levy and more on the horizon. Retailers have also focused heavily on their Own Label offerings.
Britvic have partnered with Mumsnet, undertaking a survey to help understand consumers’ awareness of the Soft Drinks Levy. Only 20% of Mumsnet users were aware of the forthcoming sugar tax and what it means. However, nearly half (49%) were not aware.1
Source: 1. Britvic Sugar Tax Survey, Conducted by Mumsnet, December 2017
18
Britvic Soft Drinks Review Grocery
TOTAL SOFT DRINKS CHANNEL PERFORMANCE THE YEAR IN NUMBERS REVIEW INFLUENCES AND CONSIDERATIONS FUTURE OUTLOOK CONCLUSION APPENDIX CONTENTS
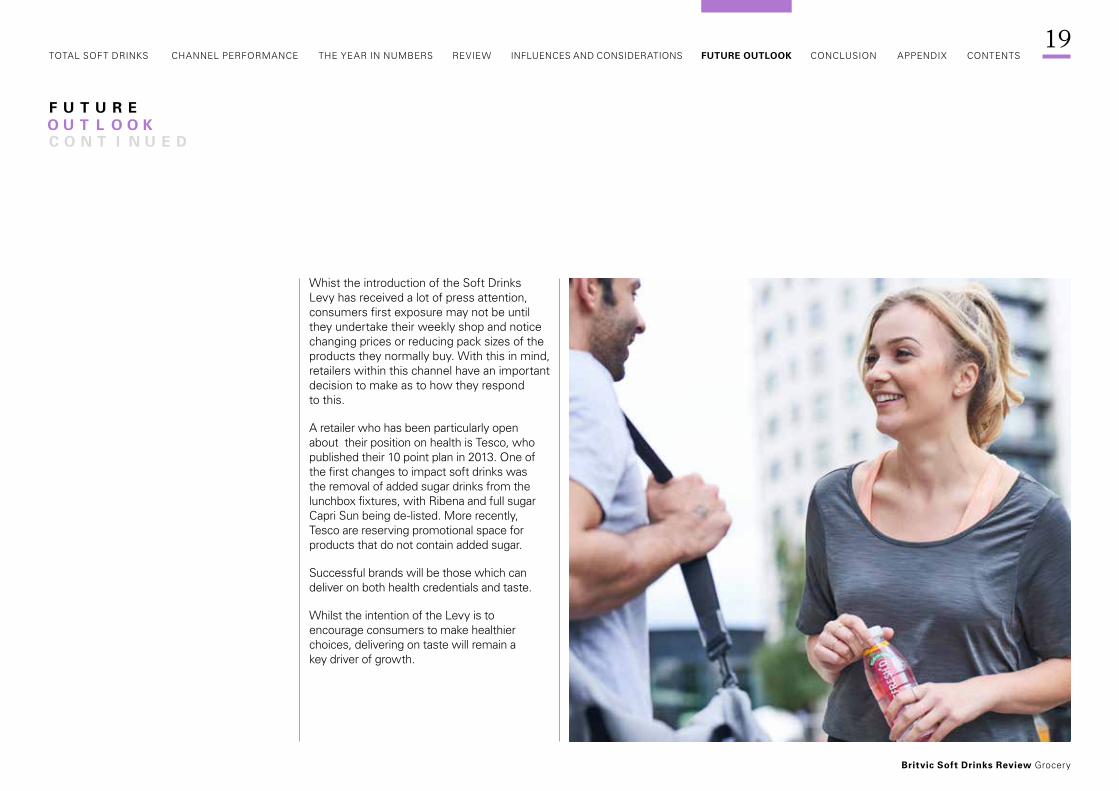
Whist the introduction of the Soft Drinks Levy has received a lot of press attention, consumers first exposure may not be until they undertake their weekly shop and notice changing prices or reducing pack sizes of the products they normally buy. With this in mind, retailers within this channel have an important decision to make as to how they respond to this.
A retailer who has been particularly open about their position on health is Tesco, who published their 10 point plan in 2013. One of the first changes to impact soft drinks was the removal of added sugar drinks from the lunchbox fixtures, with Ribena and full sugar Capri Sun being de-listed. More recently, Tesco are reserving promotional space for products that do not contain added sugar.
Successful brands will be those which can deliver on both health credentials and taste.
Whilst the intention of the Levy is to encourage consumers to make healthier choices, delivering on taste will remain a key driver of growth.
F U T U R E O U T L O O K C O N T I N U E D
19
Britvic Soft Drinks Review Grocery
TOTAL SOFT DRINKS CHANNEL PERFORMANCE THE YEAR IN NUMBERS REVIEW INFLUENCES AND CONSIDERATIONS FUTURE OUTLOOK CONCLUSION APPENDIX CONTENTS

C O N C L U S I O N
There is no doubt that plenty has happened to Soft Drinks in 2017. It remains a scale, exciting and growing category that features in almost every UK household and delivers against the fundamental human need to hydrate. Yet soft drinks only feature in 1 in every 3 consumption occasions in home meaning there is plenty of latent opportunity still to go for.
With the impending SDIL the category is about to experience a period of unprecedented uncertainty but has already demonstrated its ability to adapt with a record number of formulation changes to adapt offerings to fall below the levy. With attention likely to move to other sugar orientated categories, there is a sense that soft drinks have responded to the challenge and are well placed to exploit the growing trend of reducing alcohol or seeking more premium experienced in 2018. The soft drinks category has adapted its offering to satisfy a more sophisticated and demanding UK consumer.
The next major challenge is going to be sustainability and in 2018 we expect shoppers to become more informed and demanding to see progress from all parties. The industry has shown its resilience to meet major challenges head on and we see the opportunity for manufacturers, retailers, pressure groups and government to work together in 2018 to make further changes for good in 2018.
2 0
Britvic Soft Drinks Review Grocery
TOTAL SOFT DRINKS CHANNEL PERFORMANCE THE YEAR IN NUMBERS REVIEW INFLUENCES AND CONSIDERATIONS FUTURE OUTLOOK CONCLUSION APPENDIX CONTENTS

D E F I N I T I O N S / G L OS S ARY
Grocery – Definition of which channels this includes to be clarified by Britvic
Carbonates – a drink made predominantly from carbonated water to which juice or flavourings have been added.
Cola – cola-flavoured carbonated drinks, including cola with flavours such as cherry, twist of lemon, etc. Includes all clear and coloured colas.
Fruit Flavoured Carbonates – flavours are typically orange, cherry, lime, blackcurrant, apple, pineapple and grapefruit, lemon, lemon and lime, tropical and other mixed fruit flavours. Also includes Tizer, Dr Pepper and Vimto, as these brands now contain fruit.
Non-Fruit Carbonates – Non-fruit flavoured carbonates, excluding cola but including Irn Bru. Also includes traditionals such as cream soda, ginger beer and shandy.
Lemonade – All conventional clear and cloudy or traditional, carbonated lemonade; flavoured with lemon juice and additional fruit flavours to produce coloured lemonade.
Energy Drinks – All ‘energy boosting’ drinks such as Red Bull and Monster, normally fizzy.
Sports Drinks – Drinks that are specifically designed to replace minerals, sugars, trace elements and fluids as a result of exercise. Can include dilutables and powders.
Squash – Concentrated beverage, commonly called squash, cordial or syrup. Must be diluted prior to consumption.
Mixers – All drinks intended to dilute an alcoholic beverage, as well as being consumed as a standalone soft drink.
Iced Tea & Coffee – Includes cold soft drinks that are tea and coffee based such as Lipton Ice Tea.
Smoothies – Generally drinks described as smoothie, either in brand name or as a descriptor on the packaging. Drinks described as thickie will also be included.
Dairy Drinks – Ready to drink milk or milk substitute to which flavouring or juice has been added. May consist of any type of milk, regardless of fat content.
Juice Drinks – A non-carbonated drink which generally contains fruit juice (some may not) plus added water or other ingredients. Pure juice – A non-carbonated 100% pure juice or other juice blend with no added water or sweetener, that may be chilled or longlife. Includes all concentrated juices, with the exception of frozen juice.
Water – Still or sparkling water with nothing else added.
Flavoured Water – Sparkling or still flavoured water.
Total Dilutes – dilute-to-taste drinks.
21
Britvic Soft Drinks Review Grocery
TOTAL SOFT DRINKS CHANNEL PERFORMANCE THE YEAR IN NUMBERS REVIEW INFLUENCES AND CONSIDERATIONS FUTURE OUTLOOK CONCLUSION APPENDIX CONTENTS

G R O C E R Y D A T A
S O F T D R I N K S S E G M E N T S P E R F O R M A N C E I N G R O C E R Y
Sdesc Value SalesValue % Chg YA
Value Abs Diff vs YA
Volume Sales
Volume % Chg YA
Volume Abs Diff
vs YAAvg price increase
Total soft drinks £5,717,597,608 3.01 £167,224,208 6,039,152,216 0.37 22,027,944 2.64%
Cola £1,163,536,469 4.72 £52,496,012 1,271,765,034 -3.81 -50,325,952 8.87%
Cold hot drinks £75,849,361 14.36 £9,524,841 20,273,029 8.41 1,572,911 5.49%
Dairy and dairy subsitute £392,654,497 3.83 £14,497,828 171,992,177 1.32 2,236,774 2.48%
Fruit carbonates £405,321,459 4.08 £15,879,257 435,605,416 4.05 16,957,835 0.03%
Glucose stimulant drinks £471,775,162 -0.05 -£248,998 252,329,300 0.14 356,468 -0.19%
Juice drinks £428,262,076 -5.69 -£25,842,195 332,833,472 -8.12 -29,401,376 2.64%
Lemonade £106,210,044 5.47 £5,511,182 257,066,134 -4.29 -11,525,322 10.20%
Non fruit carbonates £126,002,738 6.31 £7,480,787 152,590,120 2.04 3,049,958 4.19%
Plain water £615,768,354 6.08 £35,273,700 1,551,561,928 5.94 87,053,618 0.12%
Pure juice £850,759,761 -4.44 -£39,542,877 616,519,142 -5.74 -37,518,371 1.37%
Smoothies £223,391,746 32.26 £54,493,793 65,374,646 29.06 14,719,415 2.48%
Sports drinks £70,849,606 1.72 £1,200,953 52,022,367 4.50 2,240,260 -2.66%
Squashes £406,443,047 -3.75 -£15,847,995 358,971,934 -1.49 -5,432,902 -2.30%
Traditional mixers £192,130,697 27.98 £42,007,968 200,962,767 8.93 16,480,084 17.49%
Water plus £188,642,627 5.80 £10,339,974 299,284,759 4.02 11,564,582 1.71%
Nielsen Scantrack, Grocery Multiples, 52 Wk to WE 30.12.17
22
Britvic Soft Drinks Review Grocery
TOTAL SOFT DRINKS CHANNEL PERFORMANCE THE YEAR IN NUMBERS REVIEW INFLUENCES AND CONSIDERATIONS FUTURE OUTLOOK CONCLUSION APPENDIX CONTENTS

G R O C E R Y D A T A C O N T I N U E D
T O P 1 0 D I S T R I B U T O R S I N G R O C E R Y I N VA L U E S A L E S
Value SalesValue % Chg YA
Value Abs Diff vs YA
Volume Sales
Volume % Chg YA
Volume Abs Diff
vs YA
Cce £1,342,506,000 4.62 £59,234,038 1,248,827,414 1.26 15,563,846
Private label £1,301,622,404 2.65 £33,657,492 2,178,375,408 1.59 34,198,040
Britvic £665,274,665 1.26 £8,248,275 684,176,088 -5.76 -41,795,675
Luczd-Rbn-Sntry £319,938,300 -4.03 -£13,436,209 210,737,135 -1.42 -3,027,001
Danone £278,918,636 2.53 £6,883,935 327,714,533 4.89 15,269,210
Innocent £245,277,846 10.35 £23,005,330 96,600,356 5.70 5,213,461
Tropicana UK £217,006,717 -13.44 -£33,701,080 113,966,296 -15.09 -20,259,309
Nestle Waters £189,361,101 -0.40 -£768,519 353,215,211 -2.01 -7,252,168
Red Bull £132,288,557 7.72 £9,476,837 34,541,341 9.80 3,082,521
Barrs £115,573,446 2.14 £2,420,428 125,770,752 0.71 892,607
Nielsen Scantrack, Grocery Multiples, 52 Wk to WE 30.12.17
2 3
Britvic Soft Drinks Review Grocery
TOTAL SOFT DRINKS CHANNEL PERFORMANCE THE YEAR IN NUMBERS REVIEW INFLUENCES AND CONSIDERATIONS FUTURE OUTLOOK CONCLUSION APPENDIX CONTENTS

G R O C E R Y D A T A C O N T I N U E D
L E A D I N G B R A N D S I N G R O C E R Y
Value SalesValue % Chg YA
Value Abs Diff vs YA
Volume Sales
Volume % Chg YA
Volume Abs Diff
vs YA
Private label £1,301,622,420 2.65 £33,657,507 2,178,375,415 1.59 34,198,047
Coca cola £796,518,670 4.59 £34,988,625 780,925,059 -1.08 -8,536,730
Pepsi Cola £340,765,304 6.30 £20,205,149 410,908,986 -7.17 -31,750,973
Innocent £232,852,162 10.73 £22,559,587 91,904,030 6.35 5,489,312
Lucozade £225,905,677 -5.36 -£12,783,040 163,156,934 -2.02 -3,357,960
Robinsons £202,523,496 -3.59 -£7,540,265 168,182,360 -0.96 -1,622,165
Tropicana £172,257,917 -12.51 -£24,623,497 85,143,604 -15.24 -15,307,724
Red Bull £132,288,557 7.72 £9,476,837 34,541,341 9.80 3,082,521
Fanta £105,232,522 17.49 £15,662,574 111,816,577 21.57 19,842,728
Evian £102,313,930 8.19 £7,748,851 166,491,783 3.76 6,038,179
Nielsen Scantrack, Grocery Multiples, 52 Wk to WE 30.12.17
2 4
Britvic Soft Drinks Review Grocery
TOTAL SOFT DRINKS CHANNEL PERFORMANCE THE YEAR IN NUMBERS REVIEW INFLUENCES AND CONSIDERATIONS FUTURE OUTLOOK CONCLUSION APPENDIX CONTENTS

G R O C E R Y D A T A C O N T I N U E D
G O I N G F O R G R O W T H I N G R O C E R Y
Value SalesValue % Chg YA
Value Abs Diff vs YA
Volume Sales
Volume % Chg YA
Volume Abs Diff
vs YA
Fever-Tree £74,206,538 120.92 £40,616,309 22,966,366 121.95 12,618,767
Coca Cola £796,518,670 4.59 £34,988,625 780,925,059 -1.08 -8,536,730
Private label £1,301,622,420 2.65 £33,657,507 2,178,375,415 1.59 34,198,047
Pepsi Cola £340,765,304 6.30 £20,205,149 410,908,986 -7.17 -31,750,973
Innocent £232,852,162 10.73 £22,559,587 91,904,030 6.35 5,489,312
Naked £58,268,289 76.41 £25,238,986 13,751,254 65.76 5,455,209
Fanta £105,232,522 17.49 £15,662,574 111,816,577 21.57 19,842,728
Monster £86,719,648 23.08 £16,261,955 42,942,726 28.47 9,516,923
Red Bull £132,288,557 7.72 £9,476,837 34,541,341 9.80 3,082,521
Highand Spring £78,213,352 8.29 £5,986,416 156,064,938 8.32 11,981,016
Nielsen Scantrack, Grocery Multiples, 52 Wk to WE 30.12.17
2 5
Britvic Soft Drinks Review Grocery
TOTAL SOFT DRINKS CHANNEL PERFORMANCE THE YEAR IN NUMBERS REVIEW INFLUENCES AND CONSIDERATIONS FUTURE OUTLOOK CONCLUSION APPENDIX CONTENTS

G R O C E R Y D A T A C O N T I N U E D
B R A N D S S U F F E R I N G G R E AT E S T D E C L I N E
Value SalesValue % Chg YA
Value Abs Diff vs YA
Volume Sales
Volume % Chg YA
Volume Abs Diff
vs YA
Tropicana £172,257,917 -12.51 -£24,623,497 85,143,604 -15.24 -15,307,724
Lucozade £225,905,677 -5.36 -£12,783,040 163,156,934 -2.02 -3,357,960
Buxton £73,072,428 -5.18 -£3,991,489 141,599,052 -6.52 -9,871,782
Shloer £25,459,187 -18.76 -£5,879,285 13,656,481 -26.51 -4,925,753
Robinsons £202,523,496 -3.59 -£7,540,265 168,182,360 -0.96 -1,622,165
Copella £36,173,583 -14.52 -£6,145,107 22,333,883 -14.38 -3,752,151
Vita Coco £21,548,100 -18.83 -£5,000,311 7,166,210 -23.66 -2,221,294
Frijj £31,644,604 -16.20 -£6,118,876 17,987,374 -24.54 -5,851,072
J2O £35,928,331 -9.22 -£3,648,558 16,925,673 -14.54 -2,880,574
Flora Pro Activ £1,332,643 -73.18 -£3,635,323 291,338 -72.68 -774,936
Nielsen Scantrack, Grocery Multiples, 52 Wk to WE 30.12.17
26
Britvic Soft Drinks Review Grocery
TOTAL SOFT DRINKS CHANNEL PERFORMANCE THE YEAR IN NUMBERS REVIEW INFLUENCES AND CONSIDERATIONS FUTURE OUTLOOK CONCLUSION APPENDIX CONTENTS

G R O C E R Y D A T A C O N T I N U E D
S O F T D R I N K S F O R M AT S I N G R O W T H
Value SalesValue % Chg YA
Value Abs Diff vs YA
Volume Sales
Volume % Chg YA
Volume Abs Diff
vs YA
Multiserve £2,644,620,392 0.05 £1,443,088 3,733,832,576 -1.89 -72,057,740
Single £1,470,451,030 4.75 £66,736,271 678,027,229 1.90 12,613,117
Single multipack £1,602,526,216 6.59 £99,044,874 1,627,292,378 5.27 81,472,552
Nielsen Scantrack, Grocery Multiples, 52 Wk to WE 30.12.17
27
Britvic Soft Drinks Review Grocery
TOTAL SOFT DRINKS CHANNEL PERFORMANCE THE YEAR IN NUMBERS REVIEW INFLUENCES AND CONSIDERATIONS FUTURE OUTLOOK CONCLUSION APPENDIX CONTENTS