Greywater Treatment with a Submerged Membrane Sequencing ... · Greywater Treatment with a...
160
Greywater Treatment with a Submerged Membrane Sequencing Batch Reactor vorgelegt von Diplom-Ingenieur René Scheumann Von der Fakultät III – Prozesswissenschaften der Technischen Universität Berlin zur Erlangung des akademischen Grades Doktor der Ingenieurswissenschaften - Dr.-Ing. - genehmigte Dissertation Promotionsausschuss: Vorsitzender: Prof. Dr.-Ing. Sven Geißen Gutachter: Prof. Dr.-Ing. Matthias Kraume Gutachter: Dr. Bruce Jefferson Tag der wissenschaftlichen Aussprache: 13.07.2010 Berlin 2010 D 83
Transcript of Greywater Treatment with a Submerged Membrane Sequencing ... · Greywater Treatment with a...
Greywater Treatment with a
Submerged Membrane Sequencing Batch Reactor
vorgelegt von
Diplom-Ingenieur
René Scheumann
Von der Fakultät III – Prozesswissenschaften
der Technischen Universität Berlin
zur Erlangung des akademischen Grades
Doktor der Ingenieurswissenschaften
- Dr.-Ing. -
genehmigte Dissertation
Promotionsausschuss:
Vorsitzender: Prof. Dr.-Ing. Sven Geißen
Gutachter: Prof. Dr.-Ing. Matthias Kraume
Gutachter: Dr. Bruce Jefferson
Tag der wissenschaftlichen Aussprache: 13.07.2010
Berlin 2010
D 83


Acknowledgement III
Acknowledgement
This work has been developed during my work as a scientific co-worker at the Chair of
Chemical Engineering at the Technische Universität Berlin. This study is partially funded by
the European Commission under the MEDA programme, project “Zer0-M” N°
ME8/AIDCO/2001/0515/59768. The author is responsible for the content of this publication
that does not represent the opinion of the Community.
Without support and advice, guidance and criticism, help and numerous fruitful discussions,
this would have been a task never achievable. Therefore I like to thank:
my doctoral adviser Prof. Matthias Kraume for his patience, his trust, his intensive
professional and personal support, and the positive discussions with him. The
freedom to work in the project autonomously and to form my thesis independently
was exhausting and delightful at the same time.
Bruce Jefferson for his willingness to be the second advisor and to share his great
knowledge of the field of greywater treatment.
Prof. Dr.-Ing. Sven Geißen to head the oral exam.
my colleagues at the Chair of Chemical Engineering, who gave me the warmth and
the fun to make the time unforgettable.
my colleagues from the project Zer0-M, especially Bouchaib ElHamouri, Ahmed
Baban and Fabio Masi, which supported my work in constructive discussions and
underlined the importance of greywater reuse.
my students since their work played a major role to make this thesis become a
success. Especially I like to thank Ewan McAdam, who made his Master thesis
under my supervision and later took his time as a proof-reader to give relevant
inputs on my thesis.
my parents, without them neither I nor this work would exist.
my children. I love them truly.
my wife Andrea for her patience to give me the time needed to finish this big
chapter in my life.
Berlin, February 2010

Outline V
Outline
ACKNOWLEDGEMENT III
OUTLINE V
LIST OF ABBREVIATIONS VII
LIST OF SYMBOLS VIII
LIST OF TABLES XI
LIST OF FIGURES XII
1 INTRODUCTION AND OBJECTIVE 1
2 GREYWATER TREATMENT 4
2.1 Greywater Treatment and its Importance for Sustainable Water Management 4
2.2 Greywater: Composition, Treatment and Reuse 5 2.2.1 Greywater Composition 5 2.2.2 Process Options for Greywater Treatment 10 2.2.3 Greywater Reuse 16
2.3 Legislation for Water Reuse 18
3 TECHNICAL AND BIOCHEMICAL BACKGROUND 21
3.1 Membrane Bioreactor (MBR) 21 3.1.1 Main Operational Parameters 22 3.1.2 Summary 25
3.2 Sequencing Batch Reactor (SBR) 26 3.2.1 Main Operational Parameters 26 3.2.2 Summary 29
3.3 Submerged Membrane Sequencing Batch Reactor (SM-SBR) 29
3.4 Biological Nutrient Removal 31 3.4.1 Important Operational Biological Parameters 31 3.4.2 Characterisation of Wastewater Constituents 34 3.4.3 Kinetics and Removal Mechanisms 37 3.4.4 The Activated Sludge Model (ASM) 47
4 MATERIAL & METHODS 51
4.1 Synthetic Greywater 51

VI Outline
4.2 Experimental Set-up of the Treatment Plants 51 4.2.1 Set-Up A: The 29L Lab scale Reactor 53 4.2.2 Set-Up B: The 1000 L Reactor 54 4.2.3 Set-Up C: The 500 L Pilot Scale Reactor 56
4.3 Membrane Test Cell Applications 58 4.3.1 Critical Flux Determinations within the Lab Scale Reactor 58 4.3.2 Aerated Test Cell 59 4.3.3 The Amafilter Test Cell for Nanofiltration of Greywater 59
4.4 Batch Tests for Determination of Biokinetic Parameters 61
4.5 Analytics 64 4.5.1 Online Parameters 64 4.5.2 Physical Parameters 64 4.5.3 Chemical Parameters 64 4.5.4 Biomass Measurement 64
5 RESULTS AND DISCUSSION 65
5.1 Greywater Characteristics 65
5.2 Experiences from Operation of the SM-SBR 66 5.2.1 Development of Biomass 67 5.2.2 Cycle Analysis 73 5.2.3 Removal Efficiencies 75
5.3 Membrane Performance 78 5.3.1 Investigations with the 29 L Lab Scale Reactor 79 5.3.2 Membrane Module Performance in the SM-SBR 83 5.3.3 Nanofiltration as an Alternative? 88
5.4 Batch Test Experiments for the Determination of Kinetics 95 5.4.1 COD Fractioning of the Synthetic Greywater 98 5.4.2 Respirometry for the Determination of Biokinetic Parameters 100 5.4.3 Rates of Nitrification and Denitrification 103
5.5 Greywater Treatment with Real Greywater 107 5.5.1 3 L Batch MBR 108 5.5.2 600L Pilot MBR 113
6 PROCESS DESCRIPTION WITH A MATHEMATICAL MODEL 116
6.1 Description of the Mathematical Model 117
6.2 Parameter Determination 123
6.3 Model Validation and Simulation of a Series of Cycles 125
7 CONCLUSIONS 128
8 REFERENCES 132
9 APPENDICES 141
List of Abbreviations VII
List of Abbreviations
Abbreviations: ASM activated sludge model
ASP activated sludge process
BNR biological nutrient removal
BW blackwater, i.e. wastewater from the toilet
CAPEX capital expenditure
CASP conventional activated sludge process
CW constructed wetland
E.Coli Escherichia Coli
FC faecal coliforms
FS Faecal Streptococci
GW greywater, i.e. domestic wastewater except from the toilet
HSSF horizontal type subsurface flow
IAWPRC international association on water pollution research and control
INWRDAM inter-islamic network on water resources development and management
IWA international water association
LAS linear alkylbenzene sulfonates
MBR membrane bioreactor
NTU nephelometric turbidity units
OECD organisation for economic co-operation and development
OPEX operational expenditure
PRR phosphate release rate
PUR phosphate uptake rate
RBC rotating biological contactor
S soluble constituents
SBR sequencing batch reactor
SLES sodium laureth sulfate (or sodium lauryl ether sulfate)
SLS sodium lauryl sulfate (or sodium dodecyl sulfate)
SM-SBR submerged membrane sequencing batch reactor
SSHF subsurface horizontal flow constructed wetland
SWM sustainable water management
TC total coliforms
TDC training and demonstration centre
VSSF vertical subsurface flow constructed wetland
WWTP wastewater treatment plant
X insoluble constituents
VIII List of Symbols
List of Symbols
Symbols: BOD5 [gO2 L
-1] biochemical oxygen demand in 5 days
COD [gO2 L-1
] chemical oxygen demand
fd [gVSS(gVSS)-1
] fraction of biomass as cell debris
HRT [d] hydraulic retention time
k [gsubstrate (gbiomassd)-1
] maximum specific substrate utilisation rate
kDO [d-1
] dissolved oxygen rate constant
kd [d-1
] decay coefficient
kd [gVSS(gVSSd)-1
] endogenous decay coefficient
kh [d-1
] maximum specific hydrolysis rate
kLa [s-1
] mass transfer coefficient
km,S [m-3
d-1
] constant maintenance energy coefficient
korgN [d-1
] specific ammonification rate of organic nitrogen
kSTO [d-1
] specific storage rate
KS [mgL-1
] half saturation coefficient or Monod constant for heterotrophic
biomass
KN, KNH [mgL-1
] half-saturation constant for NH4-N
KNO3 [mgL-1
] half-saturation constant for NO3-N
KNO2 [mgL-1
] half-saturation constant for NO2-N
KNOx [mgL-1
] half-saturation constant for NOx-N
KO, KDO [mgL-1
] half-saturation constant for DO
korgN [mgL-1
] half-saturation constant for ammonification of organic nitrogen
KSTO [mgL-1
] half-saturation constant for storage of XS and SS
KX, Kh [mgL-1
] half saturation coefficient for hydrolysis of slowly biodegradable
substrate
MLSS [gL-1
] mixed liquor suspended solids
MLVSS [gL-1
] mixed liquor volatile suspended solids
OUR [mgDO (L h)-1
] oxygen uptake rate
oTS [gL-1
] organic total solids
pH [-] - log (concentration of H+)
Q [m3d
-1] volumetric flow rate
rAUR [mgNH4-N (goTS h)-1
] ammonium utilisation rate
rg [gVSSm-3
d-1
] rate of net biomass production
rNUR [mgNO3-N (goTS h)-1
] nitrate-nitrogen utilisation rate
rsu [gm3d
-1] rate of substrate change due to oxidation
g
sur [gm3d
-1] rate of substrate change related to growth
msur [gm
3d
-1] rate of substrate change related to maintenance

List of Symbols IX
rS,s [gVSSm-3
d-1
] rate of soluble substrate change
rX,s [gm-3
d-1
] rate of biomass production due to rbCOD
rX, VSS [gVSSm-3
d-1
] rate of total VSS production
S [gm-3
] growth limiting substrate concentration
SI [mg L-1
] soluble inert organic matter
SRT [d] solids retention time
SS [mg L-1
] soluble readily biodegradable substrate
SSTO [mg L-1
] stored readily biodegradable substrate
SS [gL-1
] suspended solids
tc [h] total cycle time
TKN [gL-1
] total Kjeldahl nitrogen
TMP, p [bar] transmembrane pressure
TOC [gL-1
] total organic carbon
TS [gL-1
] total solids
V [m3] volume
VSS [gL-1
] volatile suspended solids
XB [gL-1
] biomass concentration
XBH [gL-1
] active heterotrophic biomass
XBA [gL-1
] active autotrophic biomass
XI [gL-1
] particulate inert organic matter
Xo, i [gVSSm-3
d-1
] influent non-biodegradable VSS concentration
XS [gL-1
] particulate slowly biodegradable fraction
Yg
growth viaremoved substrate,
produced VSS,
g
g
true growth yield
YA [gCOD gCOD-1
] yield coefficient for autotrophic biomass
YH [gCOD gCOD-1
] yield coefficient for heterotrophic biomass
Yobs
substrate
produced VSS,
g
g
observed yield
Greek symbols: µ [d
-1] specific growth rate
µmax [d-1
] maximum specific growth rate
µx,AUR [d-1
] specific growth rate of nitrifying bacteria
µx,AURmax [d-1
] maximum specific growth rate of nitrifying bacteria
µx,NUR [d-1
] specific growth rate of denitrifying bacteria
µx,NURmax [d-1
] maximum specific growth rate of denitrifying bacteria
AX [-] anoxic factor
[h] hydraulic retention time
X List of Symbols
Indices: H heterotrophic
A autotrophic
Suffixes: rb ready biodegradable
sb slowly biodegradable
nb non-biodegradable
nbp non-biodegradable particulate
nbs non-biodegradable soluble
List of Figures XI
List of Tables
Table 2-1: Characteristics of greywater originated from different sources 9
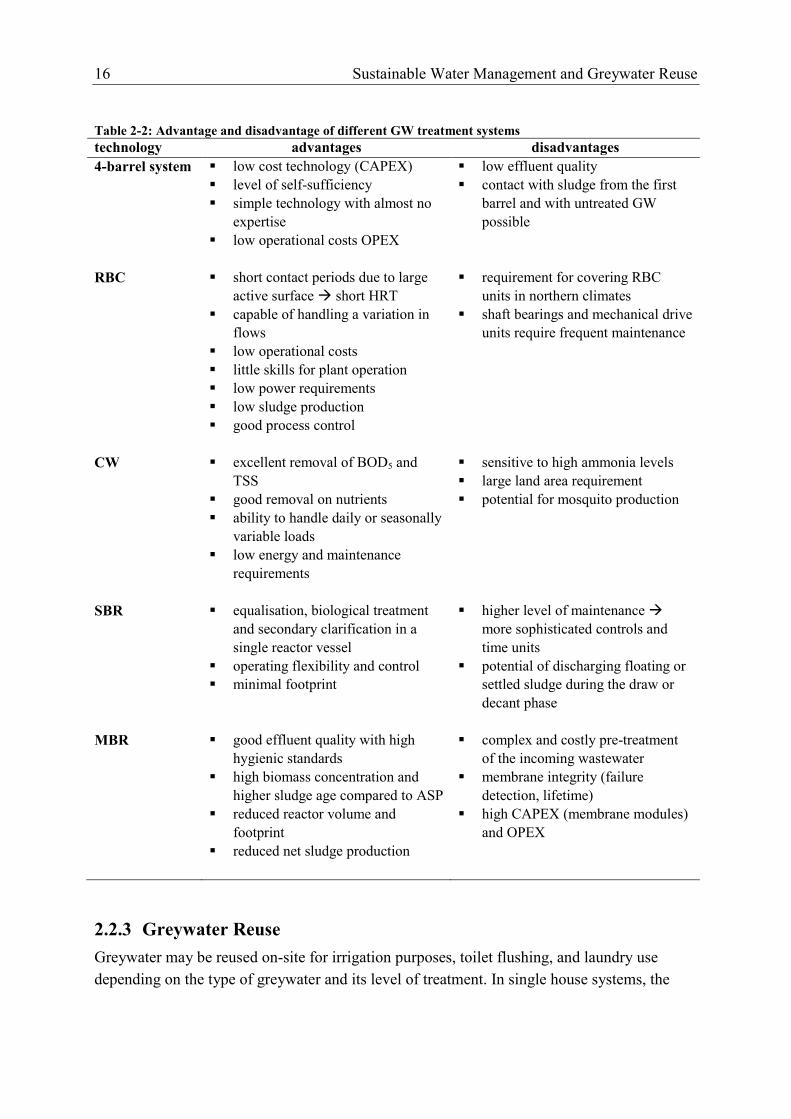
Table 2-2: Advantage and disadvantage of different GW treatment systems 16
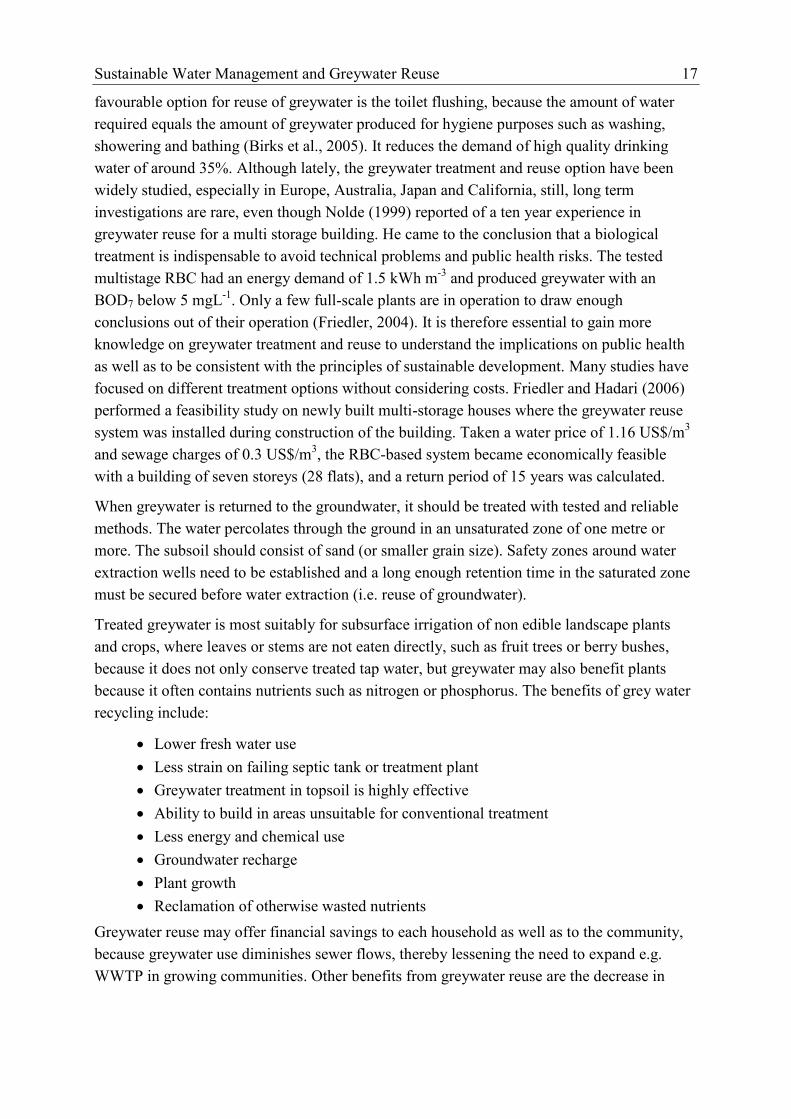
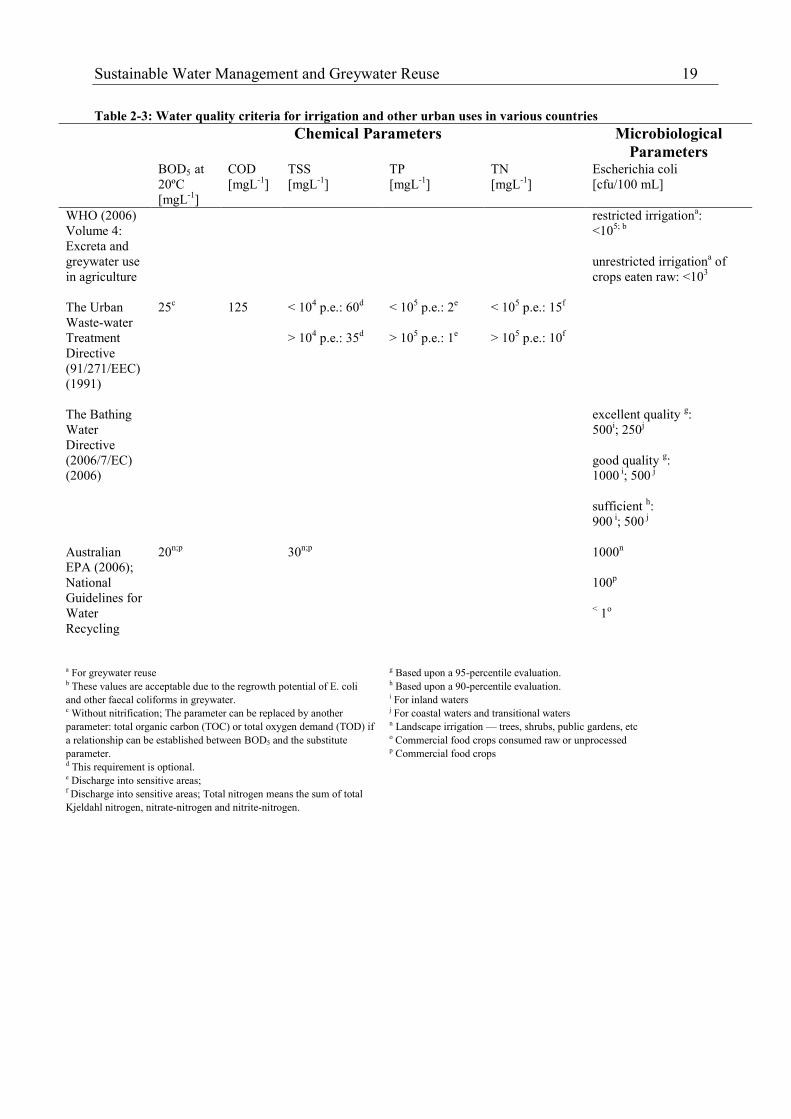
Table 2-3: Water quality criteria for irrigation and other urban uses in various countries 19
Table 3-1: ASM model for heterotrophic growth in aerobic conditions; taken from: (Henze et al., 2000) 47
Table 4-1: Recipe of synthetic greywater and its resulting feed concentration 51
Table 4-2: Operating conditions 52
Table 4-3: Run modes of set-up A: The Lab scale reactor 54
Table 4-4: Run modes of set-up B: The 1000L BUSSE reactor 55
Table 4-5: Run modes of set-up C: The 500L reactor 58
Table 4-6: Used methods for the determination of kinetic parameters 62
Table 5-1: Greywater characteristics 66
Table 5-2: Lorg [d-1
] for different HRT in GW treatment compared to municipal WW 71
Table 5-3: Average concentrations ± standard derivation in feed and permeate and removal efficiencies 75
Table 5-4: Applied protocol for membrane performance analysis 81
Table 5-5: Fouling rate under gravity flow treating synthetic GW ( MF and UF membrane), set-up C 87
Table 5-6: Suitability test of different membrane materials for greywater treatment 89
Table 5-7: COD retention of the Osmonics DK membrane at different temperatures 93
Table 5-8: COD fractions of different wastewaters 99
Table 5-9: Biokinetic parameters of sludge, coming from different wastewaters 100
Table 5-10: Range of NUR & AUR from the SM-SBR in comparison with literature 107
Table 5-11: Operating parameters of the lab-scale MBR 109
Table 5-12: GW characteristics, incl. standard derivation, and removal performance of the 3 L MBR 110
Table 5-13: Water quality standards for domestic wastewater reuse (from Surendran et al. (1998)) 111
Table 6-1: Matrix vji of the used model based on the ASM 3 119
Table 6-2: Kinetic rate expression of the used model 120
Table 6-3: Mass balance equations during the anoxic phase 122
Table 6-4: Mass balance equations during the aerated phase 122
Table 6-5: x- and y-vector for parameter fitting of the half saturation constants and specific rates 123
Table 6-6: Values for the half saturation constants, either from MatLab® fitting, batch tests or literature 123
Table 6-7: Values for the specific rates, either from MatLab® fitting, batch tests or literature 124
Table 6-8: x- and y-vector for parameter fitting of the half saturation constants and specific rates 124
Table 7-1: Removal performance from the SM-SBR treating synthetic greywater 128
Table 7-2: Summary of design criteria for an SM-SBR 129
Table 7-3: Summary of operation and maintenance parameters for an SM-SBR 129
XII List of Figures
List of Figures
Figure 2-1: Principle of SWM 5
Figure 2-2: Structure of the anionic surfactant SLES 7
Figure 2-3: Overview of possible greywater treatment options 11
Figure 2-4: Treatment and reuse scheme for grey- and blackwater at MRC, Turkey (www.zer0-m.org) 12
Figure 2-5: 4-barrel system for greywater treatment in Jordan (Al-Beiruti, 2003) 13
Figure 2-6: Scheme of a small MBR by BUSSE (http://www.busse-gmbh.de) 15
Figure 3-1: Sidestream MBR configuration 21
Figure 3-2: Immersed MBR configuration 21
Figure 3-3: SBR principle of operation 27
Figure 3-4: SM-SBR: principle of operation of the hybrid system 30
Figure 3-5: COD fraction for wastewater characterisation 36
Figure 3-6: Nitrogenous constituents in wastewater 37
Figure 3-7: Batch process biomass growth with changes in substrate and biomass concentration (from
Metcalf&Eddy, 2003) 38
Figure 3-8: Monod based growth 41
Figure 4-1: Scheme of the 29L lab scale reactor 53
Figure 4-2: Scheme of the 1000L reactor 55
Figure 4-3: Scheme of the 500L set-up Cstor 56
Figure 4-4: Scheme of the 500L reactor set-up Cdirect 57
Figure 4-5: Scheme of the aerated test cell 59
Figure 4-6: Scheme of the Amafilter test cell 60
Figure 4-7: OUR batch assembly 63
Figure 5-1: Particle size distribution of greywater sludge as volume fraction 67
Figure 5-2: Total volume of the particle size distribution of greywater sludge 68
Figure 5-3: GW sludge under the microscope (1:10) 68
Figure 5-4: Rotaria in GW sludge (1:40) 68
Figure 5-5: Evolution of biomass for all three set-ups 69
Figure 5-6: Biomass development over operation time, set-up C 70
Figure 5-7: Correlation of sludge concentration and volumetric organic loading rate Lorg 71
Figure 5-8: Correlation of sludge production and volumetric organic loading rate Lorg 72
Figure 5-9: Development of F/M ratio over time of GW sludge with no excess sludge removal 73
Figure 5-10: Cycle of Set-up B; a: Online cycle measurement b: Cycle analysis of nitrogen compounds 74
Figure 5-11: a-d: Online cycle measurement of set-up C; e-h: Cycle analysis of nitrogen compounds of set-up C
76
Figure 5-12: Average removal efficiency and its min/max values for the different configurations 78
Figure 5-13: Critical flux determination at a TS concentration of 3.5 gL-1
80
Figure 5-14: Increase in TMP during 1st withdrawal in continuous and dropping head operating mode 81
Figure 5-15: Long term effect on TMP of the two different operating modes 82
Figure 5-16: TMP evolution with intermittent aeration (4.5min on & 0.5min break) and suction pump 84
Figure 5-17: TMP evolution with intermittent aeration (9min on & 1min break) at gravity flow 84
Figure 5-18: Permeability of two different membranes modules (UF and MF) during operation of set-up C,
treating GW sludge 86
Figure 5-19: Permeability of MF membranes in different WW 86
Figure 5-20: Permeability decline dK/dt over flux 88
Figure 5-21: Membrane screening for GW filtration: permeability related to the permeate quality 90
Figure 5-22: Membrane screening for GW filtration: permeate quality related to the feed COD 91
Figure 5-23: Critical flux determination of the Osmonics DL membrane at feedCOD = 900 mgL-1
92
Figure 5-24: Evolution of flux over TMP for the Osmonic DL membrane for COD concentration of 450 and 900
mgL-1
in correlation to deionised water at 25°C and 35°C 92
Figure 5-25: Temperature influence on flux for the Osmonics DK membrane 94
Figure 5-26: Longterm study on permeability decline for the Osmonics DK membrane 94
Figure 5-27: Yield determination of sludge from set-up C according to Dircks et al. (1999) 97
Figure 5-28: Determination of COD fractions via OUR batch test 98
Figure 5-29: Determination of µmax at different substrate concentrations 101
Figure 5-30: AUR und NUR determination with acetate dosing of sludge from set-up C with an HRT=12h 104

List of Figures XIII
Figure 5-31: AUR & NUR determination without C-dosing 105
Figure 5-32: AUR & NUR determination with C-dosing in form of GW concentrate 105
Figure 5-33: Determination of AUR & NUR from cycle analysis (set-up C) 106
Figure 5-34: Comparison of AUR & NUR for batch experiments and from cycle analysis of all set-ups 106
Figure 5-35: 3L lab-scale MBR, operated in the IAV laboratory in Morocco, for feasibility studies 108
Figure 5-36: Evaluation of COD and nutrient concentrations in the 3L- MBR 110
Figure 5-37: Evolution of total and volatile suspended solids in the MBR 112
Figure 5-38: Permeability and biomass development of the 600L SM-SBR in Turkey 114
Figure 5-39: Removal efficiency of the pilot plants treating real greywater with its standard derivation 115
Figure 6-1: MatLab® plot for the validation of substrate simulation with COD results from 08.03.2004 (set-up
A) 125
Figure 6-2: MatLab® plot for the validation of simulating nitrogen compounds with experimental results from
08.03.2004 (set-up A) 125
Figure 6-3: MatLab® plot for the validation of substrate simulation with COD results from 18.02.2008 (set-up
C) 126
Figure 6-4: MatLab® plot for the validation of simulating nitrogen compounds with experimental results from
18.02.2008 (set-up C) 126
Figure 6-5: Evolution of N-compounds over one day, HRT = 8h, tc = 2h; simulated with MatLab®
126
Figure 6-6:Evolution of substrate and biomass over one day, HRT = 8h, tc = 2h; simulated with MatLab®
127

Introduction and Objective 1
1 Introduction and Objective
The work presented in this thesis has been carried out within the frame of the project
“Zer0-M: Sustainable Concepts Towards a Zero Outflow Municipality”, which intended to
develop concepts for a sustainable water and wastewater management in the four
Mediterranean countries: Morocco, Tunis, Egypt and Turkey. Work on water supply and
sanitation often implies modifications to living habits and a new view on wastewater. It is no
longer considered as something to be disposed of, but as a valuable resource, which should be
treated accordingly. Therefore the project has a strong part of information transmission,
awareness rising aimed at local authorities and water consumers.
The main issue and one of the important components of the development and dissemination
strategy of the Zer0-M project is the erection of Training and Demonstration Centres (TDCs),
including support and research with the assembling of a greywater treatment MBR at the chair
of Chemical Engineering at the Technische Universität Berlin. The TDCs shall allow adapting
existing techniques to local conditions, to test them and to show them to attendants of the
training courses.
Sustainable water management (SWM) in the context of this project means the consideration
of the in-house water-cycle beginning at the water consumption, going on with the separate
collection of different wastewater fractions which allows a cost-efficient treatment according
to their specific characteristics. Treated greywater (household wastewater not coming from
toilet flushing) can be reused for irrigation or for domestic use (car washing or toilet flushing)
without health hazards for farmers and consumers. The environmental and economic damage
can be limited when reducing water abstraction (from surface water or aquifer) and when
improving the quality of receiving bodies through a better water management. In pilot and
real scale applications the project has implemented technologies for sustainable water and
wastewater management in the MEDA partner countries, demonstrating and using water
saving devices, greywater reuse schemes, constructed wetlands and other appropriate
technologies for wastewater treatment and urine separation with the purpose of capacity
building through know how exchange, transfer between the partners and erection of those
SWM installations. Against this background, the work presented here focuses on greywater
treatment for reuse.
Health hazards and social problems are often caused by the lack of water in sufficient quality
and quantity and the reuse of wastewater without sufficient treatment for irrigation purposes.
SWM can therefore be an option not only for peri-urban areas and small communities, so far
without functioning sewer system and wastewater treatment, but also for isolated facilities,
especially tourism facilities with a high demand for independent but high-quality water. The
use of membrane technologies can be suitable exactly under these conditions, because tourism
is of great economic importance in Mediterranean countries with a high return on
investments, and so the Zer0-M project contributes to the economical enforcement of MEDA
2 List of Figures
partner countries.
Furthermore, the decreasing availability and quality of conventional water sources together
with the increasing demand for high quality freshwater forces everybody independent of its
social, cultural, and academic background to think, propose, and implement alternative and
sustainable solutions for the management of the valuable resource water. One of the strategic
assets to close the gap between supply and demand for water as well as to meet economic
considerations is to treat and reuse domestic greywater on-site. Greywater is generally defined
as low polluted wastewater originating from bathtubs, showers, hand washing basins and
washing machines excluding wastewater from the kitchen and the toilet flushing system
(Nolde, 1999). Greywater contains impurities and micro-organisms derived from household
and personal cleaning activities and it shows a wide range of pathogenic and other liquid
waste materials, which people normally want to eliminate from the inside of their homes
(Birks et al., 2004; Friedler, 2004; Ottoson and Stenstrom, 2003; Veneman and Stewart,
2002). Those varieties in greywater quality, partly due to different regional and cultural user
behaviour, should be taken into consideration when setting appropriate risk-based standards
for the reuse.
Lately, the greywater treatment and reuse option have been widely studied, especially in
Europe, Australia, Japan and California. Still, long term investigations are rare. Nolde (1999)
reported a ten year experience in greywater reuse for a multi storage building, however only a
few full-scale plants are currently in operation to draw enough conclusions out of their
operation (Friedler, 2004). Further studies and process optimisation are therefore essential to
understand the implications of this technology on public health as well as to be consistent
with the principles of ecological sustainable development, which does not decrease the
amenity of the local community.
Greywater reuse has been implemented from simple approaches such as bucketing wash
machine greywater for cleaning stone floors, as done in Tunisia in private households, up to
more advanced technologies, like constructed wetlands (CW) or membrane bioreactors
(MBRs) for the treatment of bathing water in the hotel sector. Still, reuse is often practiced
without a clear understanding of public and private health risks that may be caused without
properly designed land application systems for disposal of greywater. This implies the
installation of suitable treatment systems with respect to the reuse option, including properly
addressed cost calculations for installation, operation and maintenance.
Recently more in-depth MBR studies have been conducted on greywater because of their
inherent benefits, namely: compactness and the complete retention of micro-organisms by
either microfiltration (MF) or ultrafiltration (UF) membranes (Lesjean and Gnirss, 2006;
Melin et al., 2006b). The thesis shall therefore compare the different possibilities of greywater
treatment with special emphasis on membrane technology. Experiences and results presented
herein are gained mainly from a Submerged Membrane Sequencing Batch Reactor (SM-
SBR), which were then compared to the project partner plants (CW, MBR) within the Zer0-M

Introduction and Objective 3
framework, and among literature findings with the focus on the differences in influent
characteristics, effluent quality and technology of greywater treatment.
Only a short description on biological, chemical and technical information is given here in
order to give a better understanding of the particularities of the different treatment options.
Nevertheless the experimental set-up, the methods to determine kinetic parameters of aerobic
heterotrophic biomass and the used analytical methods are described in detail. In addition
different membranes are characterised and tested for their suitability in greywater treatment.
An intensive literature review has shown that there is enough data for the design of municipal
wastewater treatment plants (WWTP), but a huge lack of information for biokinetic
parameters for the design of greywater treatment plants, especially if treated with membrane
bioreactors. These biokinetic values are needed as key parameters for the design and process
optimisation. The development and validation of a mathematical model to describe the
biological process of the microorganisms in greywater sludge is conducted against the
background of treatment in a membrane bioreactor and with reference to the existing models
of ASM 3.

4 Sustainable Water Management and Greywater Reuse
2 Greywater Treatment
2.1 Greywater Treatment and its Importance for Sustainable
Water Management
Greywater treatment and reuse is part of sustainable water management (SWM). The dictum
SWM involves two important concepts with respect to water: sustainability and management.
To understand the approach behind SWM, both these concepts must be defined and
understood.
Sustainability stands for a process or a state which can be maintained indefinitely. One of the
first definitions of sustainability is the one created by the Brundtland Commission, led by the
former Norwegian Prime Minister Gro Harlem Brundtland. The Commission defined
sustainable development as that which "meets the needs of the present without compromising
the ability of future generations to meet their own needs." (Brundtland, 1987) This refers to
the potential longevity of vital human ecological support systems, such as the planet's climatic
system, systems of agriculture, industry, forestry, fisheries, human communities in general
and the various systems on which they depend.
A resource should be allocated in such a way that all, including the environment, have an
adequate share without discrimination, both now and in the future. Next to this qualitative
definition as an ethical/ ecological proposition, sustainability can be defined quantitatively in
terms of system life expectancy. Communities have to know whether their efforts to achieve
sustainability goals are successful or not and they need tools and knowledge to measure,
monitor and maintain them. The definition of basic needs, like clean water and sanitation for
everybody, is perhaps the greatest challenge to adopt sustainable practices in our daily lives.
Management can be understood as directing and controlling a group of people or entities to
coordinate and harmonise them towards accomplishing one goal. Management often
comprises the deployment and manipulation of human, financial, technological, and natural
resources. In recent years there has been a shift from the traditional ‘top-down’ approach to a
more open, small hierarchical management system, where all levels give input into the
allocation and use of resources. This ensures that the needs and concerns are addressed by the
group most affected by the use of the resource, without the lose of wider issues concerning
the whole community. Efficient management can be only implemented with a clear
understanding of the needs of the stakeholders and the knowledge of possibilities and
limitations of the resource.
With an understanding of sustainability and management, it is now easier to understand the
purpose of SWM, as displayed in Figure 2-1. Potable water which comes from the local water
supplier is segregated. The faeces can be used to produce biogas during the process of
anaerobic digestion, while the urine can be used as fertiliser. Treated greywater and rainwater
are suitable for irrigation or domestic reuse. Water circulates locally and can be used more

Sustainable Water Management and Greywater Reuse 5
than once with an adequate treatment.
Figure 2-1: Principle of SWM
Greywater reuse involves a whole new look at the usage of precious water resources. Water
problems cannot be solved only by technical solutions, but they require the consideration of
cultural, educational, communicational and scientific aspects.
2.2 Greywater: Composition, Treatment and Reuse
2.2.1 Greywater Composition
To improve the current situation of wastewater treatment in most small communities new
approaches like water segregation, on-site treatment and internal water reuse are desirable,
especially in water scare regions. On a small scale this involves the collection and treatment
of greywater (Lazarova et al., 2003). Greywater is generally defined as low polluted
wastewater originating from bathtubs, showers, hand washing basins and washing machines
excluding wastewater from the kitchen and the toilet flushing system (Nolde, 1999). Erikson
et al. (2002) suggested that greywater characteristics pertaining to the accumulation of
xenobiotic organic compounds were particularly important when considering adequate
treatment and reuse. The variation observed in greywater quality should be used to set
appropriate treatment, health and reuse standards.
The main components of greywater are solved substances in the form of surfactants, fats and
oils from personal care products; the matrix can be further characterised by low amounts of
6 Sustainable Water Management and Greywater Reuse
suspended solids and low turbidity (Al-Jayyousi, 2003). Greywater can further contain low
concentration of hair, skin particles and dandruff, as well as impurities and micro-organisms
derived from household cleaning activities. Greywater may include a wide range of pathogens
(Birks et al., 2004; Eriksson et al., 2002; Friedler, 2004; Ottoson and Stenstrom, 2003;
Veneman and Stewart, 2002).
The reason for the variation can be found in different user behaviour due to cultural and
regional differences. It is important to know the exact source of greywater. The incorporation
of kitchen effluent leads to higher COD concentration and higher amount of oil and fat, which
must be separated before treatment, whereas the usage of shower effluent results in a very low
COD concentration (Merz et al., 2007).
Surfactants
Surfactants (surface active agents, also known as tensides or detergens) are wetting agents
that lower the surface tension at the liquid-liquid interface. They are organic compounds with
a hydrophilic and a hydrophobic fraction and are extensively used in households as well as in
industrial processes. Biodegradation and environmental impact of ionic and non-ionic
surfactants has been the subject of substantial research for many years, e.g. Jönson (1991),
Levine et al. (2001), Liwarska-Bizukojc et al. (2008), and Oschmann et al. (2005) with
different results in terms of membrane and sludge behaviour, as well as COD removal. The
later varied from 47% for TritonX-100 and 74% for Rhamnolipid (both non-ionic surfactants)
after 10d of aerobic operation in an experimental degradation set-up (Mohan et al., 2006) up
to complete carbon degradation in a greywater treatment system with a hydraulic retention
time (HRT) of 2.75h (Konopka et al., 1997). Four primary groups of surfactants exist:
amphoteric (dual charge), anionic, cationic and non-ionic. The hydrophobic, non-polar part of
the surfactants is always an alkyl group. Thermodynamics of the surfactants systems are of
great importance because surfactant systems may be presented in both ordered (micelles) and
disordered (free surfactant molecules and/or ions in the solution) phases.
Surfactants in greywater are from detergents, cleaning products and personal care products,
where they act as emulsifiers and washing substances. About 80% of the usage of anionic and
non-ionic surfactants are in personal care and cleaning products (IKW, 2005). The oil and
water solubility of surfactants depends on the relation between the hydrophobic and the
hydrophilic part.
Anionic surfactants are mostly sodium salts with interfacial active anions (e.g., sodium lauryl
sulfate (SLS) or sodium laureth sulfate (SLES), the two most common anionic foaming
agents). The functional group is composed of salts of carboxylic acids (R-COO--Na
+),
sulphuric acids (R-SO2O--Na
+) and sulphuric acid ester (RO-SO2O
--Na
+). Soaps belong to the
group of carbon acid salts. Non-ionic surfactants are free of ions; in general eudermic (skin
friendly) and therefore, they can be found more in detergents and cosmetics. The functional
group is polyglycol ether (RO(CH2-CH2-O)nH).

Sustainable Water Management and Greywater Reuse 7
Figure 2-2: Structure of the anionic surfactant SLES
The alkyl group of surfactants exist either as a single row (cf. Figure 2-2) or as a more or less
branched form. However, the level of branches does affect the biodegradability of the
substances. The higher the degree of branches the worse they can be eliminated by micro-
organisms. The 2004 adopted European detergents regulation No. 648/2004/EC requires a
high biodegradability of surfactants, thus it can be expected that only single row or minimally
branched hydrocarbon chains are introduced in the molecules.
Within the group of anionic surfactants, the linear alkylbenzene sulfonates (LAS) make up the
majority and are generally regarded to be biodegradable. The aromatic ring of LAS can resist
biological degradation, transfer into the environment and finally turn back into the drinking
water. Therefore, several intensive studies have been carried out. (Kosswig and Stache, 1993).
Swisher (1987) stated that a large number of surfactants have relatively low biodegradability.
Due primarily to economic reasons, it is impractical to replace those low biodegradable
surfactants in all household and industrial applications. Pretreatment methods like ozonation
and other advanced chemical oxidation of surfactants in wastewater needs to be developed
which allow safe uses of low biodegradable surfactants (Lin et al., 1999). Surfactants have
become almost universal in household and industrial products, due to the ability to influence
interfacial tension at low concentrations. Synthetic produced surfactants with improved
quality have replaced soaps made from natural plant extracts. Although surfactants are so
ubiquitous, they are normally present only at low concentrations in domestic wastewater. This
is also true for greywater from shower effluent where LAS concentration in a range between
0.3-1.2 mgL-1
where detected (Konopka et al., 1997; Merz et al., 2007).
Hygienic Risk / Pathogens
Pathogenic microbes, bacteria, and viruses are derived from human sources (typically blood,
urine or excreta). Although, excreta are usually absent in greywater, pathogen are observed in
greywater. The assumption that greywater is relatively unpolluted has strengthen the idea that
greywater recycling may be more acceptable to users than recycling all the domestic sewage.
Nevertheless, Lazarova et al. (2001) found a high level of organic matter and microbiological
pollutions in dark greywater, which is comparable to those in domestic sewage. Sources of
these micro-organisms may be from diaper washing, hand washing after toilet usage,
receiving bacteriological infected urine from shower misuse, or from cleaning uncooked
vegetable and raw meat. Several other authors validated the pathogenically risk of greywater,
8 Sustainable Water Management and Greywater Reuse
with high faecal coliforme (FC) concentration of nine tenfold (Lazarova et al., 2003; Rose et
al., 1991). The whereabouts of possible contamination in a greywater system is of high
importance in order to guarantee public health when it comes to reuse of the treated
greywater. Thus a disinfection step is potentially appropriate prior to subsequent re-use.
Suitability for Biological Treatment
Investigation made by Jefferson et al. (2001) showed that greywater, compared to sewage, has
a low organic load, combined with a high COD:BOD ratio and a nitrogen and phosphorous
deficiency. To overcome these limitations these authors added macronutrients to the
greywater and thereby improving the potential for biological treatment. Merz et al. (2007)
reported a greywater composition with no limitation in nitrogen and phosphorous, as well as a
COD:BOD ratio of around 1.8, favourable for easy biological degradation. The work by
Scheumann and Kraume (2009) was carried out with synthetic greywater, although the
COD:BOD ratio was approximately 4, nutrient limitation was not observed. In fact, the
treatment success was more dependent on SRT and HRT than on greywater composition. A
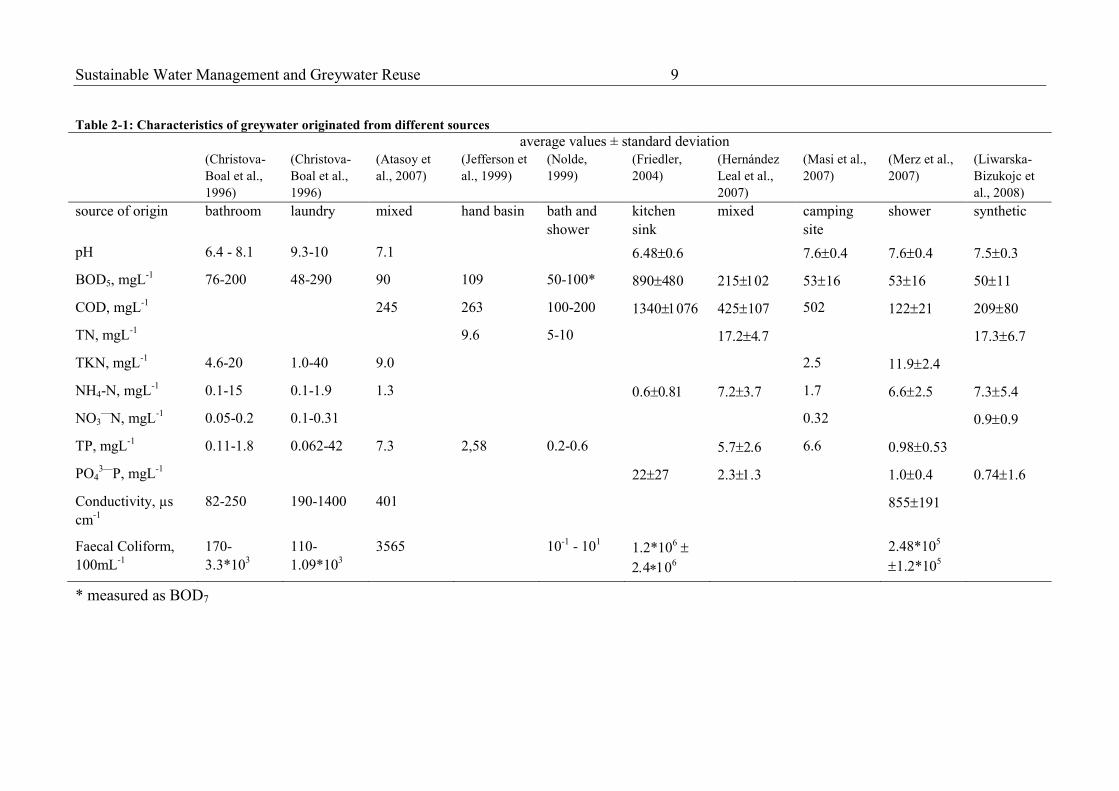
summary of different greywater characteristics is given in Table 2-1 showing the dependency
of the greywater composition on their source. Feedwater composition has to be considered
carefully, when treatment possibilities are evaluated.
Sustainable Water Management and Greywater Reuse 9
Table 2-1: Characteristics of greywater originated from different sources
average values ± standard deviation
(Christova-
Boal et al.,
1996)
(Christova-
Boal et al.,
1996)
(Atasoy et
al., 2007)
(Jefferson et
al., 1999)
(Nolde,
1999)
(Friedler,
2004)
(Hernández
Leal et al.,
2007)
(Masi et al.,
2007)
(Merz et al.,
2007)
(Liwarska-
Bizukojc et
al., 2008)
source of origin bathroom laundry mixed hand basin bath and
shower
kitchen
sink
mixed camping
site
shower synthetic
pH 6.4 - 8.1 9.3-10 7.1 6.48 7.60.4 7.60.4 7.50.3
BOD5, mgL-1
76-200 48-290 90 109 50-100* 890 215 5316 5316 5011
COD, mgL-1
245 263 100-200 1340 425107 502 12221 20980
TN, mgL-1
9.6 5-10 17.2 17.36.7
TKN, mgL-1
4.6-20 1.0-40 9.0 2.5 11.92.4
NH4-N, mgL-1
0.1-15 0.1-1.9 1.3 0.6 7.2 1.7 6.62.5 7.35.4
NO3—
N, mgL-1
0.05-0.2 0.1-0.31 0.32 0.90.9
TP, mgL-1
0.11-1.8 0.062-42 7.3 2,58 0.2-0.6 5.7 6.6 0.980.53
PO43—
P, mgL-1
22 2.3 1.00.4 0.741.6
Conductivity, µs
cm-1
82-250 190-1400 401 855191
Faecal Coliform,
100mL-1
170-
3.3*103
110-
1.09*103
3565 10-1
- 101 1.2*10
6
2.48*105
1.2*105
* measured as BOD7
10 Sustainable Water Management and Greywater Reuse
2.2.2 Process Options for Greywater Treatment
Compared to the conventional water and wastewater distribution system (drinking water
supply single use for cooking, personal care and toilet flushing in the household
wastewater disposal to a central WWTP) the onsite treatment technologies and water reuse
dissemination schemes (drinking water supply use for cooking and personal care onsite
treatment reuse for toilet flushing wastewater disposal to a decentralised WWTP) are
more complex, but may become a viable alternative. They incorporate pumps, recirculation
piping, aeration, and other features that require ongoing or periodic monitoring and
maintenance in order to guarantee stable operation.
Nowadays many different greywater treatment plants are in operation, but a comparative
review of experiences and results is still lacking. The strong regional and seasonal
fluctuations in the quality of the produced greywater at its source make it difficult to create
binding universal treatment pattern as best available technique. Inclusive of this variation is
the specific reuse objective, which needs to be considered if an assessment is carried out.
Together with more stringent discharge requirements (cf. chapter 2.3), the design of treatment
technologies has improved in order to achieve high performances in interaction with size, soil,
ground water, and landscape limitations. Greywater recycling systems do not have a
uniformly regulated specification in the international context. Nevertheless, all systems
should accomplish four basic criteria (Al-Jayyousi, 2003):
hygienic safety
aesthetics,
environmental sustainability
technical and economic feasibility
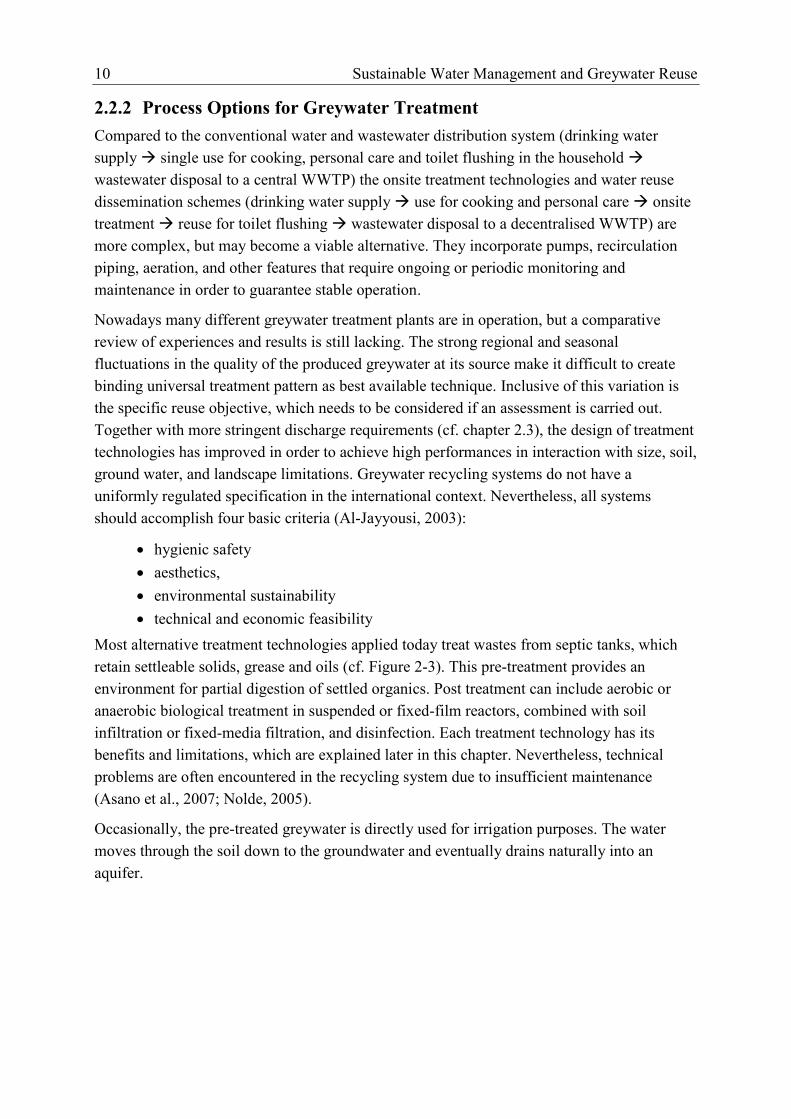
Most alternative treatment technologies applied today treat wastes from septic tanks, which
retain settleable solids, grease and oils (cf. Figure 2-3). This pre-treatment provides an
environment for partial digestion of settled organics. Post treatment can include aerobic or
anaerobic biological treatment in suspended or fixed-film reactors, combined with soil
infiltration or fixed-media filtration, and disinfection. Each treatment technology has its
benefits and limitations, which are explained later in this chapter. Nevertheless, technical
problems are often encountered in the recycling system due to insufficient maintenance
(Asano et al., 2007; Nolde, 2005).
Occasionally, the pre-treated greywater is directly used for irrigation purposes. The water
moves through the soil down to the groundwater and eventually drains naturally into an
aquifer.
Sustainable Water Management and Greywater Reuse 11
Figure 2-3: Overview of possible greywater treatment options
Established biological processes typically applied to domestic sewage treatment may be
insufficient for greywater due to the lack of bacterial retention. Thus additional measures are
required (e.g., post UV or chemical disinfection) to disinfect the treated water before reuse
(Birks et al., 2004). Advanced physical methods, such as nano-filtration (NF) or the
combination of ultra-filtration (UF) and reverse osmosis (RO), may be an appropriate
solution, where space is a limiting factor. However, such processes incur a cost penalty due to
the higher energy demand. Simple filtration with micro-filtration (MF) membranes may
consume less energy and eliminate bacteriological contamination, but usually not the BOD5.
This will lead to the formation of slime, bacterial re-growth and odour issues because of
anaerobic conditions in the service water distribution system.
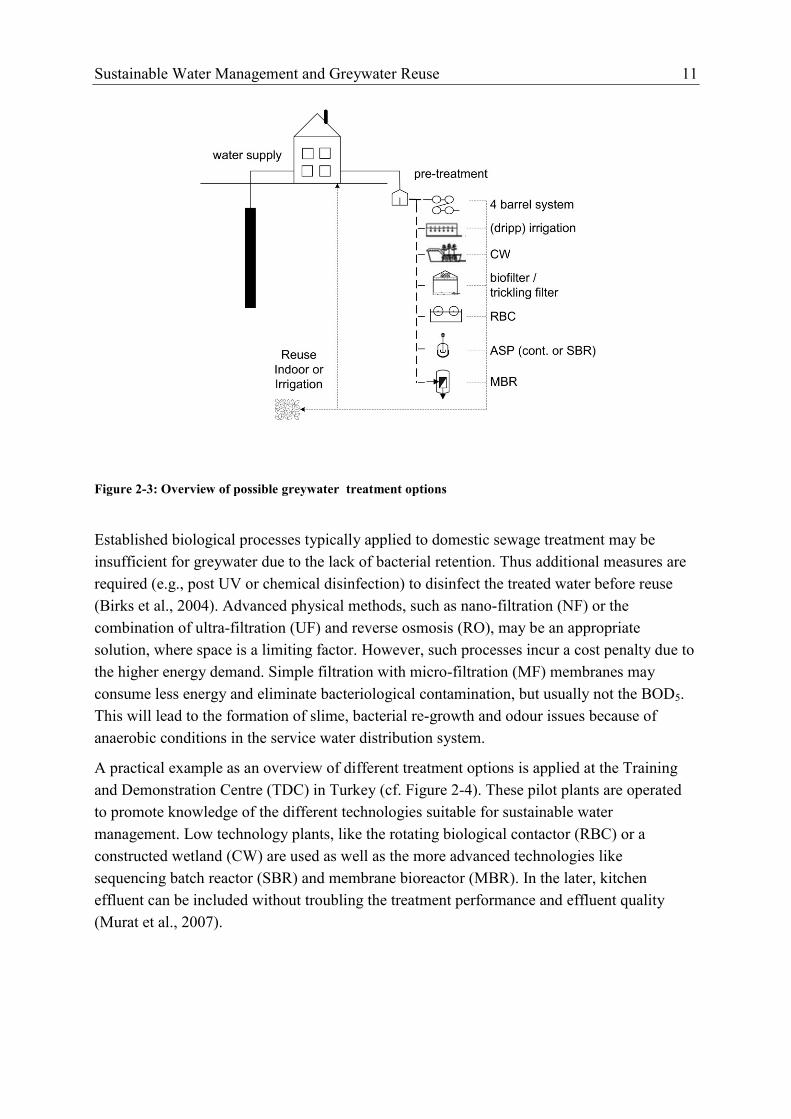
A practical example as an overview of different treatment options is applied at the Training
and Demonstration Centre (TDC) in Turkey (cf. Figure 2-4). These pilot plants are operated
to promote knowledge of the different technologies suitable for sustainable water
management. Low technology plants, like the rotating biological contactor (RBC) or a
constructed wetland (CW) are used as well as the more advanced technologies like
sequencing batch reactor (SBR) and membrane bioreactor (MBR). In the later, kitchen
effluent can be included without troubling the treatment performance and effluent quality
(Murat et al., 2007).
12 Sustainable Water Management and Greywater Reuse
Figure 2-4: Treatment and reuse scheme for grey- and blackwater at MRC, Turkey (www.zer0-m.org)
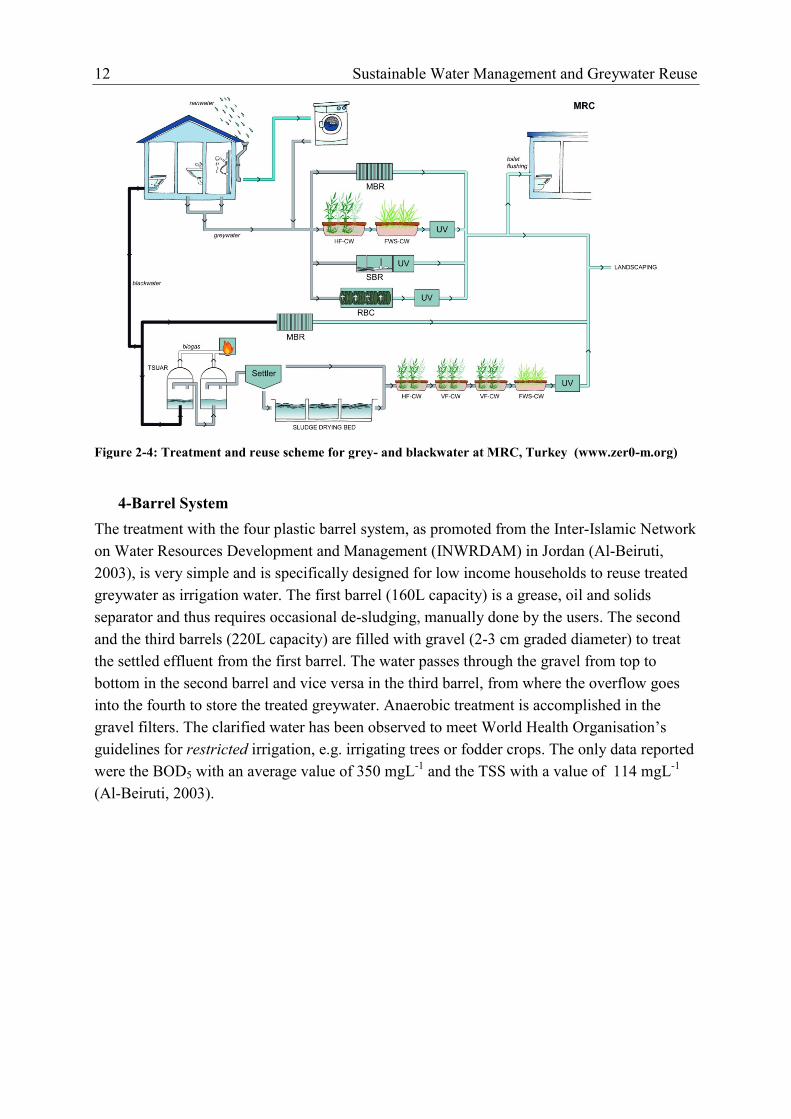
4-Barrel System
The treatment with the four plastic barrel system, as promoted from the Inter-Islamic Network
on Water Resources Development and Management (INWRDAM) in Jordan (Al-Beiruti,
2003), is very simple and is specifically designed for low income households to reuse treated
greywater as irrigation water. The first barrel (160L capacity) is a grease, oil and solids
separator and thus requires occasional de-sludging, manually done by the users. The second
and the third barrels (220L capacity) are filled with gravel (2-3 cm graded diameter) to treat
the settled effluent from the first barrel. The water passes through the gravel from top to
bottom in the second barrel and vice versa in the third barrel, from where the overflow goes
into the fourth to store the treated greywater. Anaerobic treatment is accomplished in the
gravel filters. The clarified water has been observed to meet World Health Organisation’s
guidelines for restricted irrigation, e.g. irrigating trees or fodder crops. The only data reported
were the BOD5 with an average value of 350 mgL-1
and the TSS with a value of 114 mgL-1
(Al-Beiruti, 2003).

Sustainable Water Management and Greywater Reuse 13
Figure 2-5: 4-barrel system for greywater treatment in Jordan (Al-Beiruti, 2003)
Rotating Biological Contactor (RBC)
The RBC is a fixed biological film reactor and consists of a series of plastic circular disks
mounted on a horizontal shaft and is rotated perpendicular to the direction of the waste flow.
In a conventional RBC unit, approximately 35–40% of the total disk surface area is
submerged in the wastewater. Organisms in the wastewater attach on the rotating media until
they form a thin layer of biomass. RBC units are widely used in the treatment of municipal
and industrial wastewater because it is possible to obtain high performance at low energy
consumption. RBCs have also shown to be effective for greywater treatment, reducing the
inlet BOD7 from 250 mgL-1
down to below 5 mgL-1
(Nolde, 1999). A number of similar
processes have been in operation for several years, one of them a 400-bed hotel with a six-
stage RBC process, is in operation since 1996. As with SBR, the water quality is difficult to
guarantee with regard to suspended solids and pathogens and so additional stages must be
implemented including sedimentation and UV disinfection. Friedler (2006) has shown a pilot
RBC to yield good quality effluent with a removal of 98% and 95% of turbidity and BOD5,
respectively. This RBC consisted of two basins a 15 L, each equipped with 13 discs, and a
sedimentation basin of 7.5L. The HRT was 2h in average with manually excess sludge
removal. The velocity at the outer edge of the disc was set to 0.15 ms-1
.
Constructed Wetland (CW)
CW use the natural degradation processes to take up nutrients. They are operated either as
horizontal flow (HF), vertical flow (VF) or as (FWS). The high degree of biodiversity present

14 Sustainable Water Management and Greywater Reuse
in these systems allows multiple usages for several different classes of compounds. The
vegetation (roots, stems and leaves) in a wetland provides the condition upon which
microorganisms can grow as they break down organic materials. Together with chemical
processes in the soil filter, approximately 90 percent of pollutants, measured as BOD5 and
COD, are removed under central European climate conditions.
The process takes place without input of energy as e.g. needed for oxygen supply with
blowers in a conventional activated sludge system (CAS). In addition, there is no production
of excess sludge, because there is a balance of biomass growth and decomposition. To
compensate the low energy demand a higher footprint is needed, but CW have proven to be a
good alternative for small and medium sized wastewater treatment plants (Conte et al., 2001;
Green and Ho, 2005; Hagendorf et al., 2005; Masi et al., 2007).
Greywater treatment with CW has been carried out in Flintenbreite, Germany, where three
vertical constructed wetlands with sizes of 2 m2 per inhabitant have been constructed. The
constructed wetland was equipped with a primary clarifier exhibiting three pits functioning as
a grit chamber as well as for solids and grease control (Li et al., 2003). In Sweden, Günther
(2000) has reported of a combination of a CW with a soil layer infiltration and a pond system,
which has been built and successfully operated at lower cost compared to CAS. Due to long
turnover times, the reduction of bacteria and viruses was almost complete. The investigation
from Masi (2007) at a camping site in Tuscany, Italy, showed a very good treatment
performance of a horizontal flow (HF) wetland system with a hydraulic loading rate of
0.083 md-1
and a surface area of 115 m². This systems works only in summer time with a high
fluctuation in wastewater production (0.3 to 7 m3d
-1). The entire wetland treatment system is
continuously fed by gravity, without energy consumption. Segregation of grey and blackwater
allows a better treatment and a safe reuse of the treated grey water, which is pumped back to
the buildings for toilet flushing.
Sequencing Batch Reactor (SBR)
Sequence Batch Reactors are often used in areas without sewer network for primary or
secondary treatment as small wastewater treatment plants (Teichgräber et al., 2003) and in
industrial applications (Flapper et al., 2001). The SBR has demonstrated good removal
efficiency, but cannot be guaranteed for suspended solids and pathogen removal and so their
implementation into re-use operation is potentially limited unless coupled with subsequent
treatment (Shin et al., 1998). Messalem et al. (2000) reported of a two-stage pilot scale system
comprising an SBR treatment and tertiary micro-filtration, operated at the Beer-Sheva
municipal wastewater treatment plant, by incorporating sidestream microfiltration unit
(Memcor, Australia) to treat the supernatant of the SBR process. The treated effluent resulted
in 6 log bacterial removal and a very low BOD5 <5 mg L-1
; turbidity was also low (0.2 NTU).
Messalem et al. (2000) concluded that the resultant treated effluent was suitable for reuse for
agriculture. Detailed information on SBR will be given in chapter 3.2.
Sustainable Water Management and Greywater Reuse 15
Membrane Bioreactors (MBR)
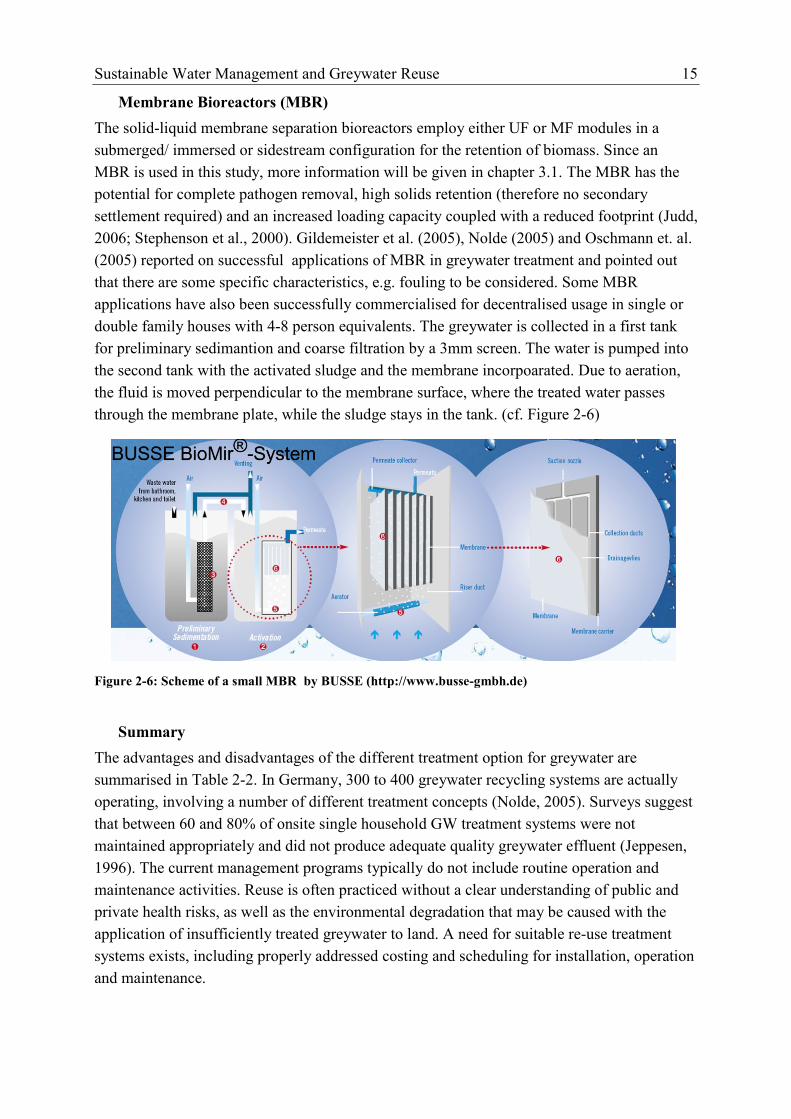
The solid-liquid membrane separation bioreactors employ either UF or MF modules in a
submerged/ immersed or sidestream configuration for the retention of biomass. Since an
MBR is used in this study, more information will be given in chapter 3.1. The MBR has the
potential for complete pathogen removal, high solids retention (therefore no secondary
settlement required) and an increased loading capacity coupled with a reduced footprint (Judd,
2006; Stephenson et al., 2000). Gildemeister et al. (2005), Nolde (2005) and Oschmann et. al.
(2005) reported on successful applications of MBR in greywater treatment and pointed out
that there are some specific characteristics, e.g. fouling to be considered. Some MBR
applications have also been successfully commercialised for decentralised usage in single or
double family houses with 4-8 person equivalents. The greywater is collected in a first tank
for preliminary sedimantion and coarse filtration by a 3mm screen. The water is pumped into
the second tank with the activated sludge and the membrane incorpoarated. Due to aeration,
the fluid is moved perpendicular to the membrane surface, where the treated water passes
through the membrane plate, while the sludge stays in the tank. (cf. Figure 2-6)
Figure 2-6: Scheme of a small MBR by BUSSE (http://www.busse-gmbh.de)
Summary
The advantages and disadvantages of the different treatment option for greywater are
summarised in Table 2-2. In Germany, 300 to 400 greywater recycling systems are actually
operating, involving a number of different treatment concepts (Nolde, 2005). Surveys suggest
that between 60 and 80% of onsite single household GW treatment systems were not
maintained appropriately and did not produce adequate quality greywater effluent (Jeppesen,
1996). The current management programs typically do not include routine operation and
maintenance activities. Reuse is often practiced without a clear understanding of public and
private health risks, as well as the environmental degradation that may be caused with the
application of insufficiently treated greywater to land. A need for suitable re-use treatment
systems exists, including properly addressed costing and scheduling for installation, operation
and maintenance.
16 Sustainable Water Management and Greywater Reuse
Table 2-2: Advantage and disadvantage of different GW treatment systems
technology advantages disadvantages
4-barrel system low cost technology (CAPEX)
level of self-sufficiency
simple technology with almost no
expertise
low operational costs OPEX
low effluent quality
contact with sludge from the first
barrel and with untreated GW
possible
RBC short contact periods due to large
active surface short HRT
capable of handling a variation in
flows
low operational costs
little skills for plant operation
low power requirements
low sludge production
good process control
requirement for covering RBC
units in northern climates
shaft bearings and mechanical drive
units require frequent maintenance
CW excellent removal of BOD5 and
TSS
good removal on nutrients
ability to handle daily or seasonally
variable loads
low energy and maintenance
requirements
sensitive to high ammonia levels
large land area requirement
potential for mosquito production
SBR equalisation, biological treatment
and secondary clarification in a
single reactor vessel
operating flexibility and control
minimal footprint
higher level of maintenance
more sophisticated controls and
time units
potential of discharging floating or
settled sludge during the draw or
decant phase
MBR good effluent quality with high
hygienic standards
high biomass concentration and
higher sludge age compared to ASP
reduced reactor volume and
footprint
reduced net sludge production
complex and costly pre-treatment
of the incoming wastewater
membrane integrity (failure
detection, lifetime)
high CAPEX (membrane modules)
and OPEX
2.2.3 Greywater Reuse
Greywater may be reused on-site for irrigation purposes, toilet flushing, and laundry use
depending on the type of greywater and its level of treatment. In single house systems, the
Sustainable Water Management and Greywater Reuse 17
favourable option for reuse of greywater is the toilet flushing, because the amount of water
required equals the amount of greywater produced for hygiene purposes such as washing,
showering and bathing (Birks et al., 2005). It reduces the demand of high quality drinking
water of around 35%. Although lately, the greywater treatment and reuse option have been
widely studied, especially in Europe, Australia, Japan and California, still, long term
investigations are rare, even though Nolde (1999) reported of a ten year experience in
greywater reuse for a multi storage building. He came to the conclusion that a biological
treatment is indispensable to avoid technical problems and public health risks. The tested
multistage RBC had an energy demand of 1.5 kWh m-3
and produced greywater with an
BOD7 below 5 mgL-1
. Only a few full-scale plants are in operation to draw enough
conclusions out of their operation (Friedler, 2004). It is therefore essential to gain more
knowledge on greywater treatment and reuse to understand the implications on public health
as well as to be consistent with the principles of sustainable development. Many studies have
focused on different treatment options without considering costs. Friedler and Hadari (2006)
performed a feasibility study on newly built multi-storage houses where the greywater reuse
system was installed during construction of the building. Taken a water price of 1.16 US$/m3
and sewage charges of 0.3 US$/m3, the RBC-based system became economically feasible
with a building of seven storeys (28 flats), and a return period of 15 years was calculated.
When greywater is returned to the groundwater, it should be treated with tested and reliable
methods. The water percolates through the ground in an unsaturated zone of one metre or
more. The subsoil should consist of sand (or smaller grain size). Safety zones around water
extraction wells need to be established and a long enough retention time in the saturated zone
must be secured before water extraction (i.e. reuse of groundwater).
Treated greywater is most suitably for subsurface irrigation of non edible landscape plants
and crops, where leaves or stems are not eaten directly, such as fruit trees or berry bushes,
because it does not only conserve treated tap water, but greywater may also benefit plants
because it often contains nutrients such as nitrogen or phosphorus. The benefits of grey water
recycling include:
Lower fresh water use
Less strain on failing septic tank or treatment plant
Greywater treatment in topsoil is highly effective
Ability to build in areas unsuitable for conventional treatment
Less energy and chemical use
Groundwater recharge
Plant growth
Reclamation of otherwise wasted nutrients
Greywater reuse may offer financial savings to each household as well as to the community,
because greywater use diminishes sewer flows, thereby lessening the need to expand e.g.
WWTP in growing communities. Other benefits from greywater reuse are the decrease in

18 Sustainable Water Management and Greywater Reuse
quantities of wastewater drained to the septic tank and the contribution to the development of
home garden agriculture, which means a contribution to household food security and income.
2.3 Legislation for Water Reuse
Integrated water resources policies and regulations have to save and conserve water quantity
and quality, while at the same time protect the environment as well as people from water-
related hazards. So, regulation promotes and encourages the reuse of waste- and greywater in
terms of the above mentioned manners. New scientific achievements and a broad public
discussion have found their way into the legislation, establishing requirements for the
reclamation of grey and other wastewaters, e.g.:
the World Health Organisation (Guidelines for the safe use of wastewater, excreta
and greywater. 3rd
edition (WHO, 2006))
the European Commission (Directive 2000/60/EC of the European Parliament and of
the Council establishing a framework for community action in the field of water
policy. (EuropeanParliament, 2000))
the U.S. Environmental Protection Agency, Municipal Support Division Office of
Wastewater Management Office of Water Washington, DC (EPA/625/R-04/108 -
Guidelines for Water Reuse. (US-EPA, 2004))
the Australian Health Ministers’ Conference, (National Guidelines for Water
Recycling. (Australian-EPA, 2006))
These new regulations set risk based reuse standards on the basis of the socio cultural
background with variations in the selecting of suitable parameters, as can be seen in
Table 2-3.
Several investigations show an increasing interest from the authorities to think anew on the
reuse of treated greywater not only in remote areas but also in urbanised regions (Anderson,
1996; Bingley, 1996; Friedler, 2004; Nolde, 2005) due to increasing shortage of drinking
water. The above mentioned guidelines shall be taken as help for setting effluent standards for
greywater reuse. Australia has already included the greywater reuse in their national
guidelines.
Sustainable Water Management and Greywater Reuse 19
Table 2-3: Water quality criteria for irrigation and other urban uses in various countries
Chemical Parameters Microbiological
Parameters BOD5 at
20ºC
[mgL-1
]
COD
[mgL-1
]
TSS
[mgL-1
]
TP
[mgL-1
]
TN
[mgL-1
]
Escherichia coli
[cfu/100 mL]
WHO (2006)
Volume 4:
Excreta and
greywater use
in agriculture
restricted irrigationa:
<105; b
unrestricted irrigationa of
crops eaten raw: <103
The Urban
Waste-water
Treatment
Directive
(91/271/EEC)
(1991)
25c 125 < 10
4 p.e.: 60
d
> 104 p.e.: 35
d
< 105 p.e.: 2
e
> 105 p.e.: 1
e
< 105 p.e.: 15
f
> 105 p.e.: 10
f
The Bathing
Water
Directive
(2006/7/EC)
(2006)
excellent quality g:
500i; 250
j
good quality g:
1000 i; 500
j
sufficient h:
900 i; 500
j
Australian
EPA (2006);
National
Guidelines for
Water
Recycling
20n;p
30n;p
1000n
100p
< 1
o
a For greywater reuse b These values are acceptable due to the regrowth potential of E. coli
and other faecal coliforms in greywater. c Without nitrification; The parameter can be replaced by another
parameter: total organic carbon (TOC) or total oxygen demand (TOD) if
a relationship can be established between BOD5 and the substitute
parameter. d This requirement is optional. e Discharge into sensitive areas; f Discharge into sensitive areas; Total nitrogen means the sum of total
Kjeldahl nitrogen, nitrate-nitrogen and nitrite-nitrogen.
g Based upon a 95-percentile evaluation. h Based upon a 90-percentile evaluation. i For inland waters
j For coastal waters and transitional waters n Landscape irrigation — trees, shrubs, public gardens, etc o Commercial food crops consumed raw or unprocessed p Commercial food crops
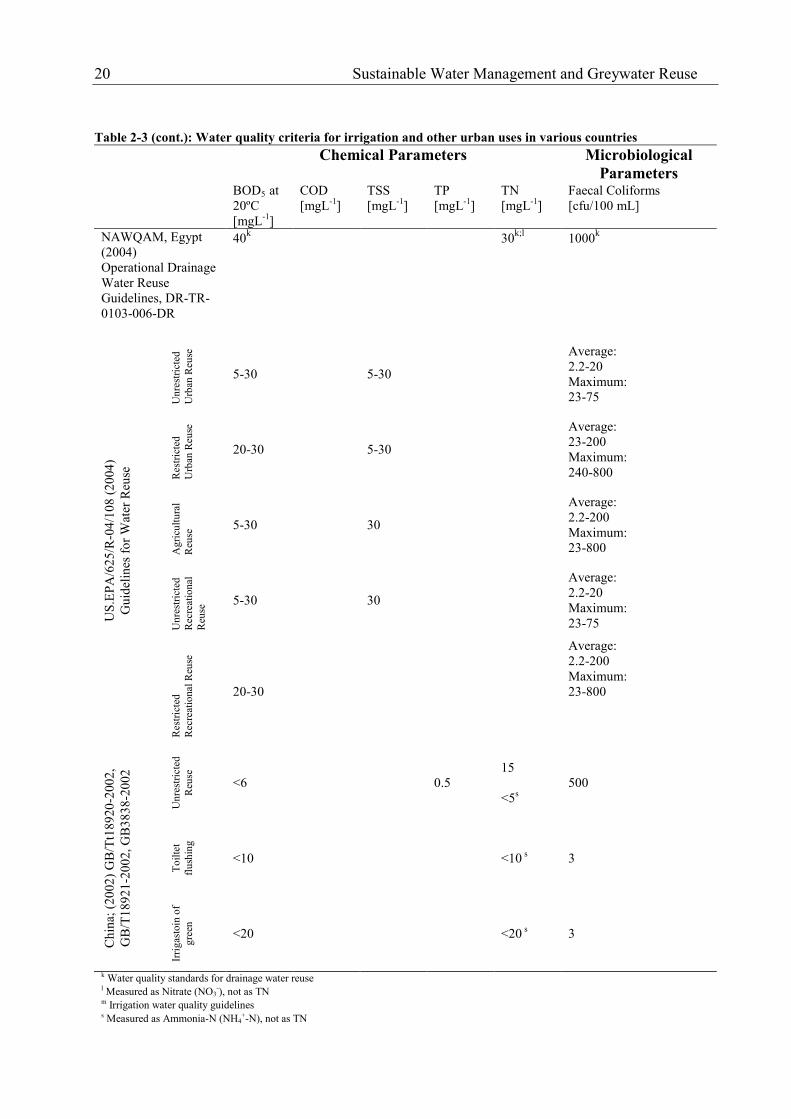
20 Sustainable Water Management and Greywater Reuse
Table 2-3 (cont.): Water quality criteria for irrigation and other urban uses in various countries
Chemical Parameters Microbiological
Parameters BOD5 at
20ºC
[mgL-1
]
COD
[mgL-1
]
TSS
[mgL-1
]
TP
[mgL-1
]
TN
[mgL-1
]
Faecal Coliforms
[cfu/100 mL]
NAWQAM, Egypt
(2004)
Operational Drainage
Water Reuse
Guidelines, DR-TR-
0103-006-DR
40k 30
k;l 1000
k
US
.EP
A/6
25
/R-0
4/1
08
(2
004
)
Gu
idel
ines
fo
r W
ater
Reu
se
Un
rest
rict
ed
Urb
an R
euse
5-30 5-30
Average:
2.2-20
Maximum:
23-75
Res
tric
ted
Urb
an R
euse
20-30 5-30
Average:
23-200
Maximum:
240-800
Ag
ricu
ltu
ral
Reu
se 5-30 30
Average:
2.2-200
Maximum:
23-800
Un
rest
rict
ed
Rec
reat
ional
Reu
se 5-30 30
Average:
2.2-20
Maximum:
23-75
Res
tric
ted
Rec
reat
ional
Reu
se
20-30
Average:
2.2-200
Maximum:
23-800
Ch
ina;
(2
002
) G
B/T
t18
920
-200
2,
GB
/T1
89
21
-20
02,
GB
38
38
-20
02
Un
rest
rict
ed
Reu
se
<6 0.5
15
<5s
500
To
ilte
t
flu
shin
g
<10 <10 s 3
Irri
gas
toin
of
gre
en
<20 <20 s 3
k Water quality standards for drainage water reuse l Measured as Nitrate (NO3
-), not as TN m Irrigation water quality guidelines s Measured as Ammonia-N (NH4
+-N), not as TN
Biochemical and Technical Background 21
3 Technical and Biochemical Background
3.1 Membrane Bioreactor (MBR)
An MBR couples biological wastewater treatment and solid liquid separation by incorporating
membrane technology. The first use of an MBR was in 1969 by Dorr Olivier Inc. (Le-Clech et
al., 2006), where an UF membrane was used to separate activated sludge from the final
effluent of a biological wastewater treatment system and the sludge was recycled back into
the aeration tank. Since then, the MBR system has evolved, and research on MBR technology
has increased significantly, particularly in the last 5 years (Ng and Kim, 2007). In wastewater
treatment MBR is now a commonly applied technology with an increasing number of
installations. Up to the year 2005 about 300 references of industrial applications (> 20 m3d
-1)
and about 100 municipal wastewater treatment plants (WWTPs > 500 p.e.) were identified in
a study undertaken by Lesjean and Huisjes (2007). The capacity for applications in industries
is smaller compared to municipal applications (median flow of 180 m3d
-1 and 2500 m
3d
-1
respectively) (Iversen et al., 2007).
Stringent discharge standards have promoted this development. Early MBR installations were
mostly constructed in external, so called “sidestream configuration” (Figure 3-1), however
nowadays, the “immersed module configuration” is dominant in the commercial environment
(Figure 3-2) (Judd, 2006).
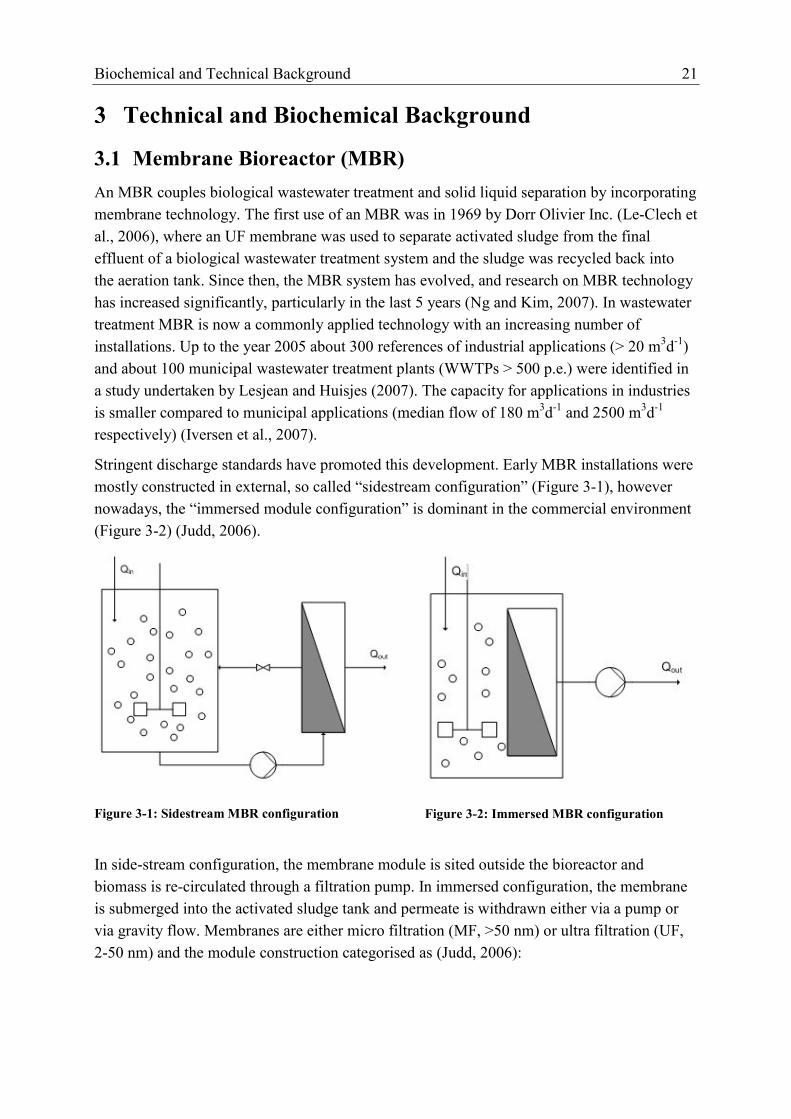
Figure 3-1: Sidestream MBR configuration
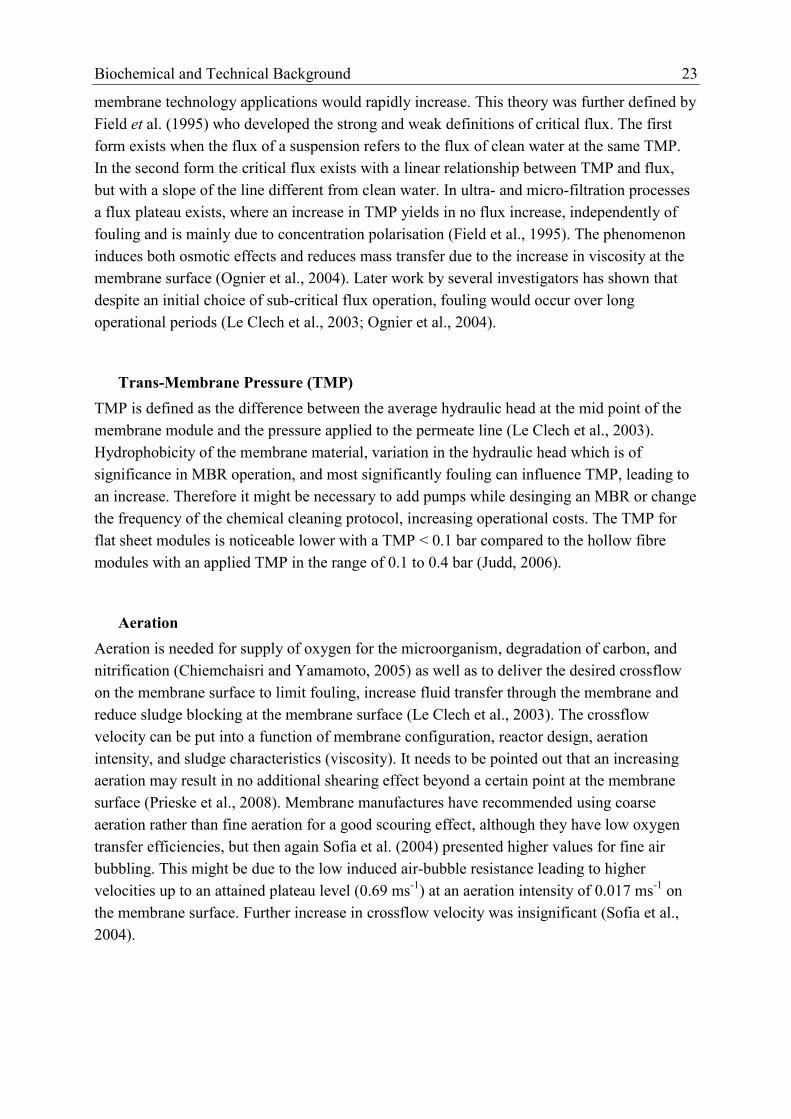
Figure 3-2: Immersed MBR configuration
In side-stream configuration, the membrane module is sited outside the bioreactor and
biomass is re-circulated through a filtration pump. In immersed configuration, the membrane
is submerged into the activated sludge tank and permeate is withdrawn either via a pump or
via gravity flow. Membranes are either micro filtration (MF, >50 nm) or ultra filtration (UF,
2-50 nm) and the module construction categorised as (Judd, 2006):

22 Biochemical and Technical Background
plate and frame (PF)
hollow fibre (HF)
multi tubular (MT)
capillary tube (CT)
In the commercialised membrane technology market, the dominant players are the plate and
frame (PF) modules, e.g. produced by Kubota (0.4 µm) and the hollow fibre (HF) module,
mainly produced by Zenon/ GE Water (0.04 µm).
The immersed vertically oriented HF unit is connected with pump on the permeate side to
create a vacuum to remove the treated water out of the reactor. The typical filtration capacity
is in the range of 40-70 L(m²h)-1
with a TMP of 100 to 500 mbar. The sheer stress is provided
by coarse bubble aeration. Periodic backflushing and occasional chemical cleaning of the
membranes helps to control the fouling tendency of the membrane. MLSS concentrations
between 15-20 kg m-3
are typically (Judd, 2006).
The flat sheet membrane consists of a solid support plate with a space layer in between to
withdrawal permeate from both sides of the bulk fluid by a partial vacuum applied within the
membrane plate matrix. Several plates are assembled to a single module, which can be staked
into racks. The system can be operated either by gravity; with a head of 1 to 1.5 m above the
membranes or by a pump introduced TMP usually below 200 mbar. Compressed air, a
mixture of coarse and fine bubbles, is introduced through a distribution manifold at the base
of the membrane module to avoid sludge blocking and fouling. The MLSS is maintained
within the range of around 12-15 kg m-3
(Judd, 2006).
3.1.1 Main Operational Parameters
Flux
Operational flux depends upon a number of interrelationships among the TMP, the crossflow
velocity on the membrane surface, pore size and material of the selected membrane material
and biomass characteristics. Due to the development of a specific biocenosis in dependency of
the wastewater, each installed MBR will differ from the one before. The flux is responsible
for the membrane area to be installed, the footprint of the MBR, cleaning regime, in case of
the SM-SBR also for the HRT, and not to forget costs. Standard operational fluxes for MBR
in municipal wastewater treatment range from 10 to 40 L(m²h)-1
, typically 20-25 L(m²h)-1
.
Sub-Critical Flux Operation
To design the MBR at its best, the determination of the critical flux is indispensable (Ognier
et al., 2004). Howell et al. (1995) described a theory of a critical flux operation where no
apparent fouling could be observed. Howell et al. (1995) stated further, if a clean non-fouling
operation could be sustained and low energy consuming operation could be promoted,
Biochemical and Technical Background 23
membrane technology applications would rapidly increase. This theory was further defined by
Field et al. (1995) who developed the strong and weak definitions of critical flux. The first
form exists when the flux of a suspension refers to the flux of clean water at the same TMP.
In the second form the critical flux exists with a linear relationship between TMP and flux,
but with a slope of the line different from clean water. In ultra- and micro-filtration processes
a flux plateau exists, where an increase in TMP yields in no flux increase, independently of
fouling and is mainly due to concentration polarisation (Field et al., 1995). The phenomenon
induces both osmotic effects and reduces mass transfer due to the increase in viscosity at the
membrane surface (Ognier et al., 2004). Later work by several investigators has shown that
despite an initial choice of sub-critical flux operation, fouling would occur over long
operational periods (Le Clech et al., 2003; Ognier et al., 2004).
Trans-Membrane Pressure (TMP)
TMP is defined as the difference between the average hydraulic head at the mid point of the
membrane module and the pressure applied to the permeate line (Le Clech et al., 2003).
Hydrophobicity of the membrane material, variation in the hydraulic head which is of
significance in MBR operation, and most significantly fouling can influence TMP, leading to
an increase. Therefore it might be necessary to add pumps while desinging an MBR or change
the frequency of the chemical cleaning protocol, increasing operational costs. The TMP for
flat sheet modules is noticeable lower with a TMP < 0.1 bar compared to the hollow fibre
modules with an applied TMP in the range of 0.1 to 0.4 bar (Judd, 2006).
Aeration
Aeration is needed for supply of oxygen for the microorganism, degradation of carbon, and
nitrification (Chiemchaisri and Yamamoto, 2005) as well as to deliver the desired crossflow
on the membrane surface to limit fouling, increase fluid transfer through the membrane and
reduce sludge blocking at the membrane surface (Le Clech et al., 2003). The crossflow
velocity can be put into a function of membrane configuration, reactor design, aeration
intensity, and sludge characteristics (viscosity). It needs to be pointed out that an increasing
aeration may result in no additional shearing effect beyond a certain point at the membrane
surface (Prieske et al., 2008). Membrane manufactures have recommended using coarse
aeration rather than fine aeration for a good scouring effect, although they have low oxygen
transfer efficiencies, but then again Sofia et al. (2004) presented higher values for fine air
bubbling. This might be due to the low induced air-bubble resistance leading to higher
velocities up to an attained plateau level (0.69 ms-1
) at an aeration intensity of 0.017 ms-1
on
the membrane surface. Further increase in crossflow velocity was insignificant (Sofia et al.,
2004).

24 Biochemical and Technical Background
Fouling
Next to flux, the second most important parameter to take into consideration for the operation
of MBR is fouling. It causes a declining flux (where TMP is constant), or an increasing TMP
(where flux is constant) and is one of the increasing operational costs factor, by premature
pumping intervention and increasing chemical cleaning frequency. At today’s stage of
research the membrane community says that both the higher sludge and the lower sludge
concentration in submerged operated MBR are responsible for fouling.
Two very recent published detailed reviews show the complexity of fouling in activated
sludge processes. Operating parameters such as SRT, HRT, dissolved oxygen (DO) or the
food to microorganism ratio (F/M) are responsible for the sludge characteristics and therefore
have an indirect effect on membrane fouling; aeration and cleaning my control fouling,
whereas the sludge determines fouling (Meng et al., 2009). The interaction between proteins,
polysaccharides, and the suspended colloids within the cake layer and the mixed species
environment in the ASP make it difficult to understand and to determine the mechanism
behind fouling and its grade of responsibility (Le-Clech et al., 2006).
The soluble microbial products (SMP), extracellular polymeric substances (EPS), and the
amount of proteins and polysaccharides may be considered as the main fouling agents (Cho et
al., 2004; Drews et al., 2008a; Drews et al., 2008b; Iversen et al., 2007; Jefferson et al., 2004;
Lee et al., 2004; Nghiem and Schafer, 2006; Ognier et al., 2004; Oschmann et al., 2005).
However, Ishiguro et al. (1994) showed no significant effect on the flux by either dissolved
organic carbon (DOC), sugar, and protein.
In operating a special type of MBR, the so called Submerged Membrane Sequencing Batch
Reactor (SM-SBR) , Kang et al. (2003) found that mixing intensity and oxygen concentration
proved to have a major influence on the membrane performance regardless of the SBR phase.
A higher oxygen concentration resulted in a slower rise in TMP, corresponding to less
membrane fouling. The higher oxygen concentration influenced a lower specific resistance of
cake layer due greater particle size and a higher porosity. In addition Shin and Kang (2002)
found that fouling affected the biological performance in an SM-SBR due to declining flux:
HRT increased and consequently caused endogenous respiration of microorganisms.
Cleaning
Various chemical and mechanical methods have been reported in literature and from
membrane manufactures. A simple mechanical cleaning can be achieved by introducing a
relaxation period during operation. Cleaning with compressed air, cohesive with membrane
backfluching is typically used for HF modules and is considered as mechanical cleaning. If
diluted NaOH, citric acid, or NaHOCl is added to the backwashing solution then chemical
cleaning is applied. A circulation of that chemical solution through the membrane and pipe
system is needed for cleaning, which can be undertaken in place or outside in a separate tank.
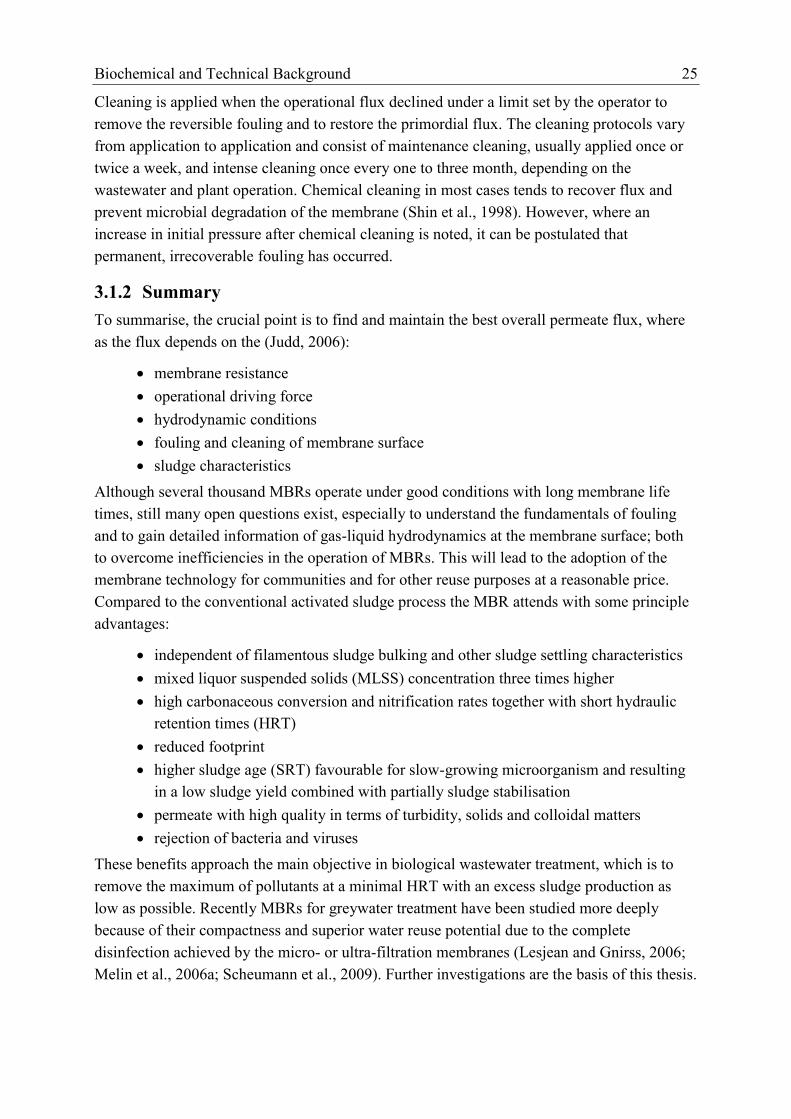
Biochemical and Technical Background 25
Cleaning is applied when the operational flux declined under a limit set by the operator to
remove the reversible fouling and to restore the primordial flux. The cleaning protocols vary
from application to application and consist of maintenance cleaning, usually applied once or
twice a week, and intense cleaning once every one to three month, depending on the
wastewater and plant operation. Chemical cleaning in most cases tends to recover flux and
prevent microbial degradation of the membrane (Shin et al., 1998). However, where an
increase in initial pressure after chemical cleaning is noted, it can be postulated that
permanent, irrecoverable fouling has occurred.
3.1.2 Summary
To summarise, the crucial point is to find and maintain the best overall permeate flux, where
as the flux depends on the (Judd, 2006):
membrane resistance
operational driving force
hydrodynamic conditions
fouling and cleaning of membrane surface
sludge characteristics
Although several thousand MBRs operate under good conditions with long membrane life
times, still many open questions exist, especially to understand the fundamentals of fouling
and to gain detailed information of gas-liquid hydrodynamics at the membrane surface; both
to overcome inefficiencies in the operation of MBRs. This will lead to the adoption of the
membrane technology for communities and for other reuse purposes at a reasonable price.
Compared to the conventional activated sludge process the MBR attends with some principle
advantages:
independent of filamentous sludge bulking and other sludge settling characteristics
mixed liquor suspended solids (MLSS) concentration three times higher
high carbonaceous conversion and nitrification rates together with short hydraulic
retention times (HRT)
reduced footprint
higher sludge age (SRT) favourable for slow-growing microorganism and resulting
in a low sludge yield combined with partially sludge stabilisation
permeate with high quality in terms of turbidity, solids and colloidal matters
rejection of bacteria and viruses
These benefits approach the main objective in biological wastewater treatment, which is to
remove the maximum of pollutants at a minimal HRT with an excess sludge production as
low as possible. Recently MBRs for greywater treatment have been studied more deeply
because of their compactness and superior water reuse potential due to the complete
disinfection achieved by the micro- or ultra-filtration membranes (Lesjean and Gnirss, 2006;
Melin et al., 2006a; Scheumann et al., 2009). Further investigations are the basis of this thesis.

26 Biochemical and Technical Background
3.2 Sequencing Batch Reactor (SBR)
The Sequencing Batch Reactor (SBR) has proven to be a viable alternative to continuous-flow
systems in carbon and nutrient removal from domestic and industrial wastewaters (Artan et
al., 2001). Originally designed as simple treatment technology for COD and phosphorous
removal, the SBR has undergone different modifications to achieve nitrification and
denitrification along with COD and phosphorous removal (Kargi and Uygur, 2003). The
process offers several advantages over other types of activated sludge reactors, particularly
the flexibility of cyclic phasing and operating times. The cycle time can be easily modified at
any time to adopt changes in process conditions, influent characteristics or effluent objectives,
increasing process control and efficiency. SBR application has been proven successful in the
treatment of both domestic and industrial wastewaters. (Brenner, 2000; Dangcong et al., 2005;
Furumai et al., 1999; Peters et al., 2005; Teichgräber et al., 2003)
While aeration and settling are simultaneous but in spatial sequence in the continuous-flow
systems, they are carried out in the same reactor but in temporal sequence in the SBR
systems. The technology provides the ability to modify process conditions dependent upon
influent characteristics or effluent objectives, operating in a single tank and having an
improved process control due to an easy change of HRT, either by changing the volme of
wastewater added to the tank or by changing the process time (Andreottola et al., 2001).
While mechanically simpler and often less expensive than continuous flow systems, the SBR
requires careful monitoring and optimisation when applied to the biological treatment of
wastewater. The operational parameters for each SBR process therefore tend to be very site
specific. All over the cycle time should be as short as possible to achieve optimum
exploitation of the volumetric capacity of the plant and to push down the cost to its minimum.
However, a balance between cycle time and treatment performance has to be identified.
3.2.1 Main Operational Parameters
The SBR process has a cyclic nature, each cycle consisting of several phases (cf. Figure 3-3).
In the fill phase the wastewater is fed into the reactor. After filling, time is given in the react
phase, including (intermittent) aeration, for the biological conversion to further progress. The
microorganisms settle to the reactor bottom in the settle phase, the clear treated wastewater is
discharged in the draw phase, and than the reactor is left idle in the idle phase, until the fill
phase of a new cycle starts. The total cycle time (tc) is the duration corresponding to the sum
of these five phases (Artan et al., 2001). In literature, the cycle time for SBR operation varied
from tc=3h, municipal wastewater, (Shin and Kang, 2002) over tc=4h, municipal wastewater,
(Innocenti et al., 2002) and tc=6h, municipal sewage, (Artan et al., 2002) to tc=12h, synthetic
wastewater, (Kargi and Uygur, 2003).
Biochemical and Technical Background 27
Figure 3-3: SBR principle of operation
Fill Phase
In the fill phase, influent wastewater is filled into the SBR, depending on the influent
wastewater composition and biodegradability, the concentration of toxic organics in the
wastewater, the volumetric exchange ratio (VER, defined as volume added to the overall
hydraulic volume), and the treatment requirements (e.g., enhanced nutrient removal) (Artan
and Orhon, 2005). Teichgräber (2003) found that a VER=0.5 is typically for SBR in
Germany, whereas Krampe and Krauth (2001) reported a VER=0.1 for a nitrogen removal
efficiency of 86.6% compared to 67.1% for a VER=0.3.
The feeding time can range from a very little time of the total cycle time up to the whole
duration of cycle. In the static fill mode the wastewater is fed to the reactor at once at the
beginning of one cycle with no mixing of sludge. Depending on the fill pattern, the SBR can
be compared to either a plug flow or a completely mixed reactor (Morgenroth et al., 1998).
Anaerobic/ anoxic fill mode is generally adopted as it has a number of advantages, including
the simultaneous removal of organic carbon, nitrogen and phosphorous, effective prevention
of filamentous bulking of activated sludge. Nevertheless, a relatively large fraction of influent
TN is converted to N2O during anoxic filling (Park et al., 2001).
The mixed fill mode (the total amount of wastewater to fill the reactor is neither fed static nor
continuous, but divided into several smaller portions) results in a good denitrification, and
when desired, in a subsequent reduction of oxygen demand and energy input, as well as
providing the anoxic or anaerobic conditions required for biological phosphorous removal.
Aerated filling results in the beginning of aerobic reactions, a reduction of cycle time, and
holds substrate concentration low, which may be important if biodegradable constituents exist
which are toxic at high concentrations. (Ketchum, 1997)
28 Biochemical and Technical Background
React Mode
During settle, draw and idle phase, it is assumed that no biological conversion occurs. The
biodegradation of the wastewater pollutants takes place during the process time, which
corresponds to the sum of fill and react phases unless the static fill is applied. The process
time can be further divided into the aerated period, and the mixed period, which is either
anoxic or anaerobic, depending on the presence of nitrate (Artan et al., 2001).
The react period is system specific, because of its dependence upon biological composition of
the wastewater and the required effluent quality. The simple treatment with only an aerated
reaction phase results in carbon removal and bio solid reduction, if aeration is extended
(Ketchum, 1997). If a biological nutrient removal (BNR) process is desired, anaerobic or
anoxic stages are incorporated into the react period. The order, length, number and type of
phases used in the react period can therefore vary broadly.
Kargi and Uygur (2003) carried out investigation with a five-step SBR (total volume of 5L) in
order to determine the most suitable ratio of COD/N/P to maximise nutrient removal. The
SBR process consisted of anaerobic, anoxic, aerated, anoxic, and aerated phases
(2/1/4.5/1.5/1.5 h respectively with 0.5 h allowed for settling) treating synthetic wastewater.
The COD/NH4+-N/PO4
3--P ratio best suitable was determined to be 100/2/0.54 yielding 95, 94
and 99% removal respectively.
Similar experiments carried out by Chang et al. (2000) in a 30L laboratory scale SBR with
synthetic wastewater illustrated the importance of varied HRT and process times on the best
nutrient removal strategy. Unfortunately, no information was given concerning the VER. The
selection of 1-3-2 h of anaerobic-aerobic-anoxic phases yielded in a maximum removal
efficiencies for TN and TP with final effluent concentrations of less than 2 mgL-1
.
Andreottola et al. (2001) achieved a 91% COD and 95.2% total Kjeldahl nitrogen (TKN)
removal from industrial wastewater (plywood factory) when implementing a process as
follows: immediate filling of 0.25L, 1h 50min anoxic reaction, 1h 50min aerobic reaction,
immediate filling of 0.25L, 1h 50min anoxic reaction, 1h 50min aerobic reaction, immediate
filling of 0.25L, 1h 50min anoxic reaction, 1h 50min aerobic reaction, 1h settling, and
discharge. The total cycle time in the 3.5L reactor added to 12h with a VER of 0.25.
An alternative strategy for complete denitrification in the treatment of greywater was carried
out by Shin et al. (1998) with a 1000L SBR system. The total cycle time of 12h was arranged
in a constant change of 60min aeration and 60min anoxic conditions. The cyclic SBR
operation resulted in a more effective nitrification and denitrification compared to
conventional SBR operation methods under low organic concentration, to be observed in
greywater.
Further work of treating greywater with SBR is not reported in literature, although some
producers like PONTOS use this technology successfully.

Biochemical and Technical Background 29
Settle/ Decant/ Idle
During Settle the activated sludge is separated from the supernatant. The importance and
difficulty of this stage is to withdraw a turbidity free effluent without disturbing the settled
sludge. This is the key element in operation of SBR since this process operates with no return
sludge (Shin et al., 1998). The time needed for settlement depends strongly on the method of
decantation, the height of supernatant, and sludge rheology. Typical durations range from 0.5
to 2 hours. At last, the idle phase, with no function for the operation of the SBR cycle is
simply due to uncertainty in the design data, and is used as a reserve time that can be added to
any phase or period, as need arises. Therefore, the effective cycle time may be 1 to 4 hours
less than the total cycle time (Ketchum, 1997).
3.2.2 Summary
As mentioned in the introduction of this chapter the SBR process has a broad application in
wastewater treatment and can be considered as a viable alternative to continuous-flow
systems in nutrient removal as well as in carbon and suspended solids removal. The
development of a unified design will help to understand the process better and hence, will
remove obstacles in hindering the wider application of the SBR. In nutrient removal, the SBR
can offer a great deal of operational flexibility, because it allows adjustment of aerobic,
anoxic and anaerobic periods through temporal control of aeration and filling and its cyclic
nature.
3.3 Submerged Membrane Sequencing Batch Reactor (SM-SBR)
The possibility to treat wastewater with a Submerged Membrane Sequencing Batch Reactor
(SM-SBR), as described in Figure 3-4, goes one step further. It overcomes the restriction of
the simple SBR process and its dependency on sludge behaviour for the process of
decantation. Compared to the conventional SBR process no sedimentation phase is needed.
The biological degradation proceeds during the withdrawal phase and therefore shortens the
cycle time compared to the conventional SBR process. Substantially higher solid
concentration in the biological reactor reduces the reaction volume. In accordance to lower
SRT it is also possible to minimise the excess sludge production. All these points are further
investigated in this work and compared to the few existing articles, dealing with this
technology. The combination of the MBR process with the SBR operation leads to a
procedural advantage.
In general, membranes require higher aeration rates than needed for the biological activity
resulting in an increased dissolved oxygen (DO) concentration in the filtration chamber. In the
conventional MBR, the return sludge transports oxygen into the denitrification chamber,
inhibiting the process there. To overcome this problem, usually a degassing chamber is
needed. This is not the case in an SM-SBR, because the inflow during the filling phase
guarantees a fast reduction of DO. In addition, the membrane facilitates a complete retention
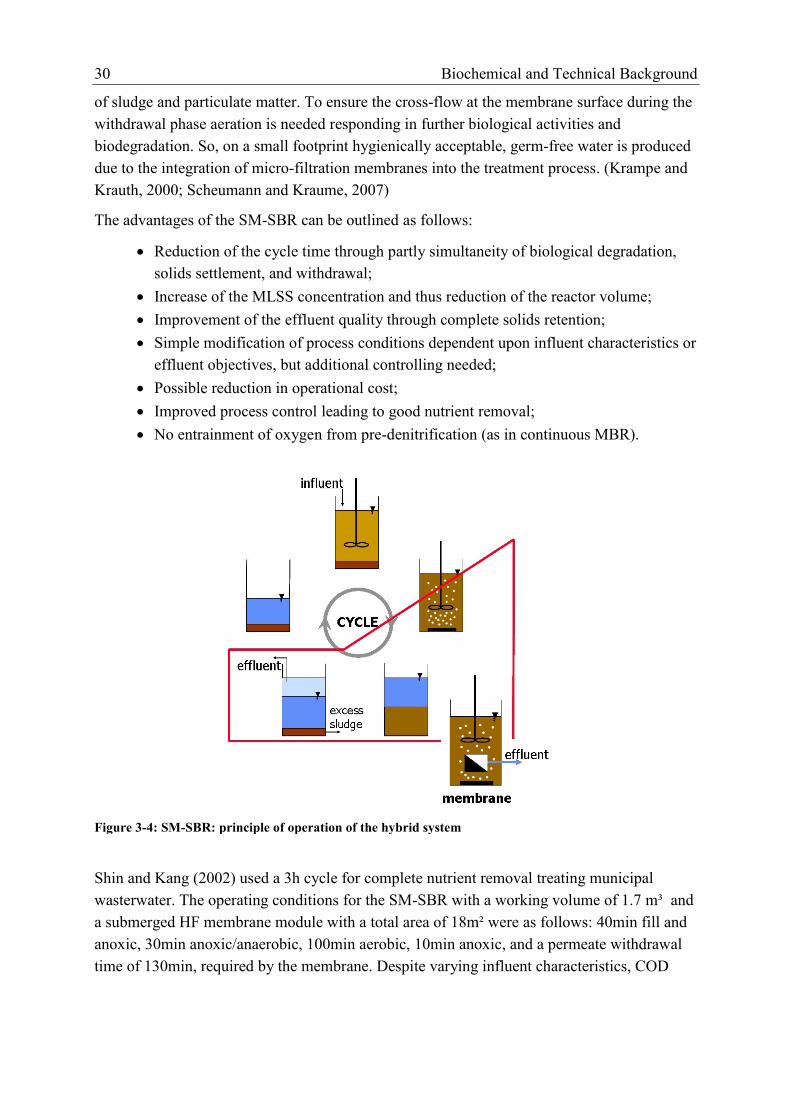
30 Biochemical and Technical Background
of sludge and particulate matter. To ensure the cross-flow at the membrane surface during the
withdrawal phase aeration is needed responding in further biological activities and
biodegradation. So, on a small footprint hygienically acceptable, germ-free water is produced
due to the integration of micro-filtration membranes into the treatment process. (Krampe and
Krauth, 2000; Scheumann and Kraume, 2007)
The advantages of the SM-SBR can be outlined as follows:
Reduction of the cycle time through partly simultaneity of biological degradation,
solids settlement, and withdrawal;
Increase of the MLSS concentration and thus reduction of the reactor volume;
Improvement of the effluent quality through complete solids retention;
Simple modification of process conditions dependent upon influent characteristics or
effluent objectives, but additional controlling needed;
Possible reduction in operational cost;
Improved process control leading to good nutrient removal;
No entrainment of oxygen from pre-denitrification (as in continuous MBR).
Figure 3-4: SM-SBR: principle of operation of the hybrid system
Shin and Kang (2002) used a 3h cycle for complete nutrient removal treating municipal
wasterwater. The operating conditions for the SM-SBR with a working volume of 1.7 m³ and
a submerged HF membrane module with a total area of 18m² were as follows: 40min fill and
anoxic, 30min anoxic/anaerobic, 100min aerobic, 10min anoxic, and a permeate withdrawal
time of 130min, required by the membrane. Despite varying influent characteristics, COD
Biochemical and Technical Background 31
removal was always higher than 95% and TN removal reached a maximum of 85% after a
few weeks. Even though the SM-SBR system is theoretically a high rate processes (due to the
complete retention of biomass), the cycle times, phase times (except for settle, decant and
idle) and HRT are similar to the one observed in normal SBR operation possible of good
nutrient removal. The flux was between 0.3 and 0.35 md-1
at stable operation, leading to an
HRT of 12 h.
Compared to a conventional MBR, the SM-SBR shows a better stability in nitrogen and
phosphorous removal when the wastewater shows a high variation in the COD/TN ratio.
Furthermore the sequencing batch operation can reduce the fouling of the membrane,
although higher EPS existed (Zhang et al., 2006). However, due to the implementation of a
membrane, the treated effluent is suitable for reuse, irrigation, and direct infiltration
(Messalem et al., 2000). The SM-SBR application can be seen in hotels of water scare tourism
areas to save valuable drinking water due to the reuse of greywater from showers, and
everywhere else where high effluent quality standards are needed. The SM-SBR therefore can
be technically viable for application to greywater reuse. (Andreottola et al., 2001; Scheumann
et al., 2009)
3.4 Biological Nutrient Removal
Biological carbon, nitrogen, and phosphorus removal from wastewater is an established
process in wastewater treatment. Despite the broad knowledge and practical experience that
has been accumulated over the decades, there are still certain aspects of biological nutrient
removal, which require further research. Especially new adopted technologies like the
SM-SBR or the MBR draw the attention of the scientific community.
Biological nutrient removal copies in a concentrated form the self-cleaning process of
microorganism in natural water bodies. The wastewater pollutants serve as food for the
microbes and they are then metabolised for energy and growth. Each wastewater creates an
adopted biocenosis in the treatment plant, which can be manipulated by operational
parameters for the most effective treatment performance.
3.4.1 Important Operational Biological Parameters
The most significant adjustment for the optimisation of the biological performance is the
appropriate selection of aerobic, anoxic and anaerobic stages. Other parameters like HRT,
SRT, MLSS, and F:M are also used to optimise the biological operation within the wastewater
treatment plant, like in an SM-SBR.
32 Biochemical and Technical Background
Hydraulic Residence Time
The hydraulic retention time (HRT or ) is defined as follows:
Q
V
(3-1)
where = hydraulic detention time, s
V = volume of the reactor, m3
Q = volumetric flow rate, m3s
-1
Operational cycle time has been reported to vary from very low = 1.5h in greywater
treatment for carbon removal (Hu, 2002), over = 2.5h for an SM-SBR (Shin and Kang,
2002) and = 12h for an SBR plus additional micro-filtration (Shin et al., 1998) up to
= 24h, when flow rates are highly variable and enhanced biological nutrient removal is
required (Ketchum, 1997). The HRT is then related to the VER. A maximum VER of 50%
has been recommended in the literature (Teichgräber et al., 2003).
It is reported that for wastewater treatment in MBR, the performance is relatively insensitive
to HRT of certain length (Stephenson et al., 2000) and can vary widely in a range from
= 7.6h to = 22h (Judd, 2006). However, for the application of an SM-SBR the HRT is
potentially more significant, since all biological processes (aerobic, anoxic, anaerobic) are
incorporated into a single tank. So, in order to optimise the biological performance, HRT
must be primarily taken into consideration.
Mixed Liquor Suspended Solids
Mixed Liquor Suspended Solids (MLSS) concentrations are typically in a range from 3.0 to
5.0 gL-1
in an ASP (Metcalf and Eddy, 2003), depending strongly on the settling ability and
velocity. Nevertheless, they are equivalent to the MLSS concentration in an MBR treating
greywater in Morocco, where a submerged membrane is incorporated into the SBR resulting
in complete retention of biomass in the reactor and a high SRT > 360 d. In municipal
wastewater treatment biomass concentrations can reach up to 40 gL-1
for zero sludge wastage
processes (Stephenson et al., 2000). In greywater treatment the MLSS concentration is low,
starting as little as 1.3 gL-1
(Merz, 2006), over 3.6 gL-1
(Shin et al., 1998) and reaching finally
8 gL-1
after one year operation with complete biomass retention (Scheumann and Kraume,
2009). This is mainly due to the reason that the influent greywater has a low concentration of
COD and nutrients.
Food to Microorganism Ratio
The food to microorganism ratio (F/M) is a commonly used parameter in wastewater
treatment to characterise process design and operating conditions with values in a range from
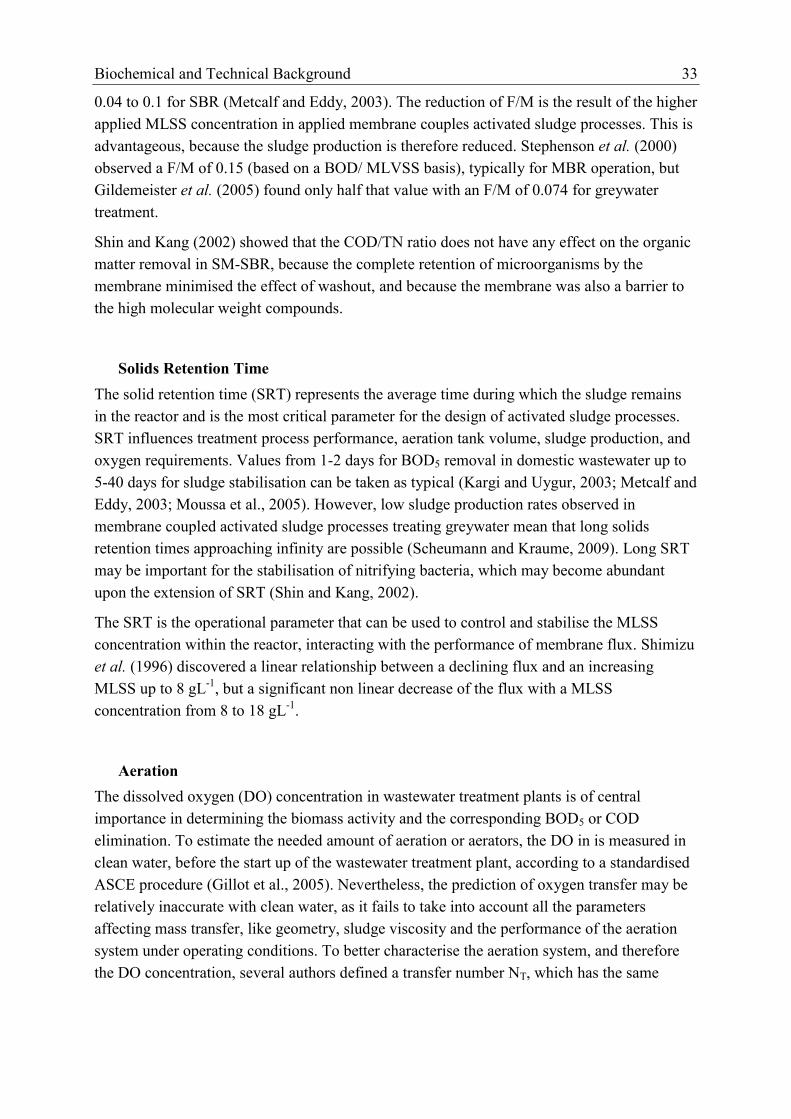
Biochemical and Technical Background 33
0.04 to 0.1 for SBR (Metcalf and Eddy, 2003). The reduction of F/M is the result of the higher
applied MLSS concentration in applied membrane couples activated sludge processes. This is
advantageous, because the sludge production is therefore reduced. Stephenson et al. (2000)
observed a F/M of 0.15 (based on a BOD/ MLVSS basis), typically for MBR operation, but
Gildemeister et al. (2005) found only half that value with an F/M of 0.074 for greywater
treatment.
Shin and Kang (2002) showed that the COD/TN ratio does not have any effect on the organic
matter removal in SM-SBR, because the complete retention of microorganisms by the
membrane minimised the effect of washout, and because the membrane was also a barrier to
the high molecular weight compounds.
Solids Retention Time
The solid retention time (SRT) represents the average time during which the sludge remains
in the reactor and is the most critical parameter for the design of activated sludge processes.
SRT influences treatment process performance, aeration tank volume, sludge production, and
oxygen requirements. Values from 1-2 days for BOD5 removal in domestic wastewater up to
5-40 days for sludge stabilisation can be taken as typical (Kargi and Uygur, 2003; Metcalf and
Eddy, 2003; Moussa et al., 2005). However, low sludge production rates observed in
membrane coupled activated sludge processes treating greywater mean that long solids
retention times approaching infinity are possible (Scheumann and Kraume, 2009). Long SRT
may be important for the stabilisation of nitrifying bacteria, which may become abundant
upon the extension of SRT (Shin and Kang, 2002).
The SRT is the operational parameter that can be used to control and stabilise the MLSS
concentration within the reactor, interacting with the performance of membrane flux. Shimizu
et al. (1996) discovered a linear relationship between a declining flux and an increasing
MLSS up to 8 gL-1
, but a significant non linear decrease of the flux with a MLSS
concentration from 8 to 18 gL-1
.
Aeration
The dissolved oxygen (DO) concentration in wastewater treatment plants is of central
importance in determining the biomass activity and the corresponding BOD5 or COD
elimination. To estimate the needed amount of aeration or aerators, the DO in is measured in
clean water, before the start up of the wastewater treatment plant, according to a standardised
ASCE procedure (Gillot et al., 2005). Nevertheless, the prediction of oxygen transfer may be
relatively inaccurate with clean water, as it fails to take into account all the parameters
affecting mass transfer, like geometry, sludge viscosity and the performance of the aeration
system under operating conditions. To better characterise the aeration system, and therefore
the DO concentration, several authors defined a transfer number NT, which has the same
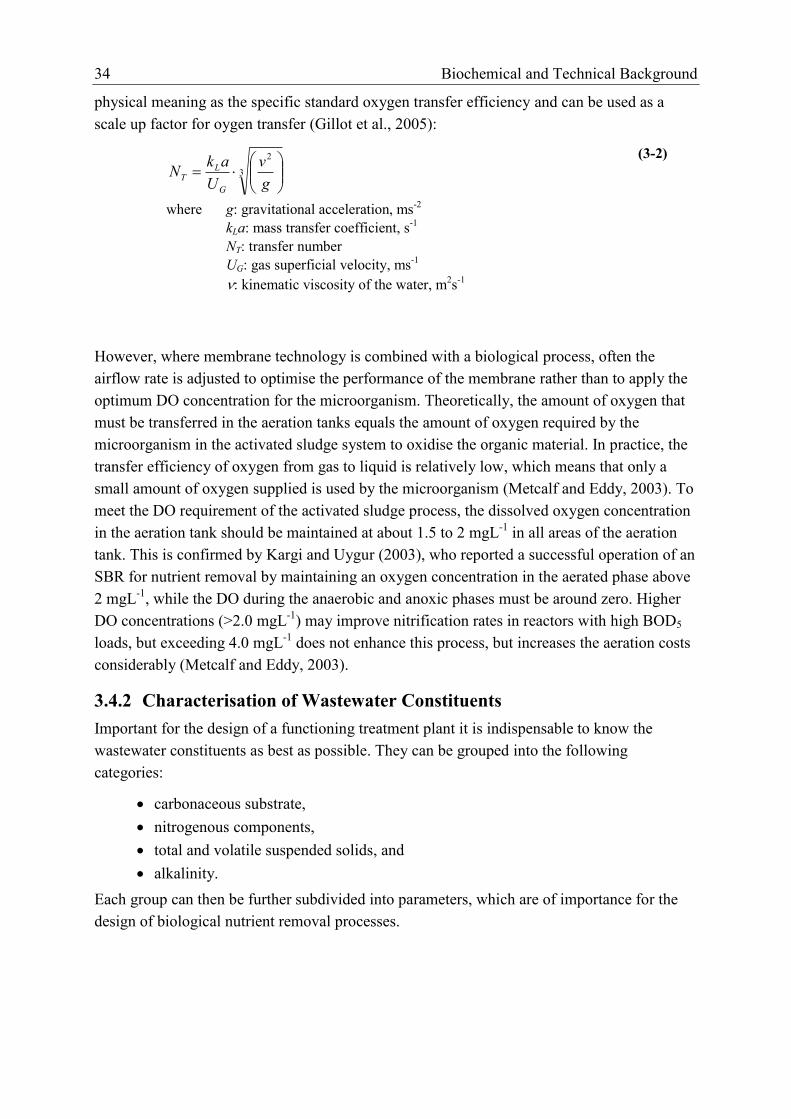
34 Biochemical and Technical Background
physical meaning as the specific standard oxygen transfer efficiency and can be used as a
scale up factor for oygen transfer (Gillot et al., 2005):
3
2
g
v
U
akN
G
LT
(3-2)
where g: gravitational acceleration, ms-2
kLa: mass transfer coefficient, s-1
NT: transfer number
UG: gas superficial velocity, ms-1
: kinematic viscosity of the water, m2s
-1
However, where membrane technology is combined with a biological process, often the
airflow rate is adjusted to optimise the performance of the membrane rather than to apply the
optimum DO concentration for the microorganism. Theoretically, the amount of oxygen that
must be transferred in the aeration tanks equals the amount of oxygen required by the
microorganism in the activated sludge system to oxidise the organic material. In practice, the
transfer efficiency of oxygen from gas to liquid is relatively low, which means that only a
small amount of oxygen supplied is used by the microorganism (Metcalf and Eddy, 2003). To
meet the DO requirement of the activated sludge process, the dissolved oxygen concentration
in the aeration tank should be maintained at about 1.5 to 2 mgL-1
in all areas of the aeration
tank. This is confirmed by Kargi and Uygur (2003), who reported a successful operation of an
SBR for nutrient removal by maintaining an oxygen concentration in the aerated phase above
2 mgL-1
, while the DO during the anaerobic and anoxic phases must be around zero. Higher
DO concentrations (>2.0 mgL-1
) may improve nitrification rates in reactors with high BOD5
loads, but exceeding 4.0 mgL-1
does not enhance this process, but increases the aeration costs
considerably (Metcalf and Eddy, 2003).
3.4.2 Characterisation of Wastewater Constituents
Important for the design of a functioning treatment plant it is indispensable to know the
wastewater constituents as best as possible. They can be grouped into the following
categories:
carbonaceous substrate,
nitrogenous components,
total and volatile suspended solids, and
alkalinity.
Each group can then be further subdivided into parameters, which are of importance for the
design of biological nutrient removal processes.

Biochemical and Technical Background 35
Carbonaceous Components
The carbonaceous components are measured as BOD5 or COD, where the latter gains more
and more popularity for the characterisation of wastewater, especially in the most current
computer simulation models (Henze et al., 2000). A COD mass balance is easier to
understand concerning the balance of the carbonaceous material which is oxidised and
incorporated into cell mass. The rate at which COD can be oxidised in a reactor is i.a. limited
by the rate at which DO is transferred from the air to the liquid phase. Other than BOD5, the
COD constitutes of a non-biodegradable and biodegradable fraction. Together with the
biomass in the feed, the carbonaceous compounds can be divided into biodegradable COD,
non-biodegradable COD (inert material) and biomass, as described in Figure 3-5.
The biodegradable COD is further divided into readily biodegradable substrate (SS or rbCOD)
and slowly biodegradable substrate (XS or sbCOD). The readily biodegradable substrate
consists of simple soluble molecules that can be readily absorbed by the organisms and
metabolised for energy and synthesis, whereas the slowly biodegradable substrate is made up
of particulate, colloidal, and more complex organic molecules that require enzymatic
breakdown prior to absorption and utilisation. The rbCOD fraction has a direct effect on the
activated sludge kinetics (oxygen consumption in the reactor) and on the denitrification rate in
preanoxic zones in biological N-removal, where it will be consumed before the aeration zone
(Metcalf and Eddy, 2003). On the other hand, a study carried out by Vocks et al. (2005)
showed that a post-denitrification without C dosing applied in an MBR is a reliable
technology. There, storage compounds within the cells of an EBPR process possibly act as C-
sources for denitrification, leading to denitrification rates above endogenous rates.
The non-biodegradable COD is divided into soluble (SI or nbsCOD) and particulate (XI or
nbpCOD) material. Both are considered to be unaffected by the biological action in the
system. The inert soluble material leaves the system by the secondary clarifier effluent,
whereas the inert particulate material is enmeshed in the sludge mass and accumulates as inert
volatile suspended solids. The inert particulate material will be removed from the system by
the removal of excess sludge and to some extent be present in the settler effluent as well.
Moreover, the active biomass is divided into two types of organisms: heterotrophic biomass
(XB,H) and autotrophic biomass (XB,A).
Orhon et al. (1994) identified in his undertaken study of a domestic wastewater sample a
soluble fraction of 48.7% (sCOD=19 0mgL-1
) of the total COD (tCOD=390 mgL-1
), which
can be further subdivided into the readily biodegradable COD with 44.9% (SS=175 mgL-1
)
and inert soluble COD with 3.8% (SI=15 mgL-1
). The particulate fraction makes up the
remaining 51.3% (pCOD=200 mgL-1
) of the total COD (tCOD=390 mgL-1
). This fraction, in
analogy, is then divided into the slowly biodegradable, particulate COD with 22.6%
(XS=88 mgL-1
) and non-biodegradable particulate COD with 28.7% (XI=112 mgL-1
).
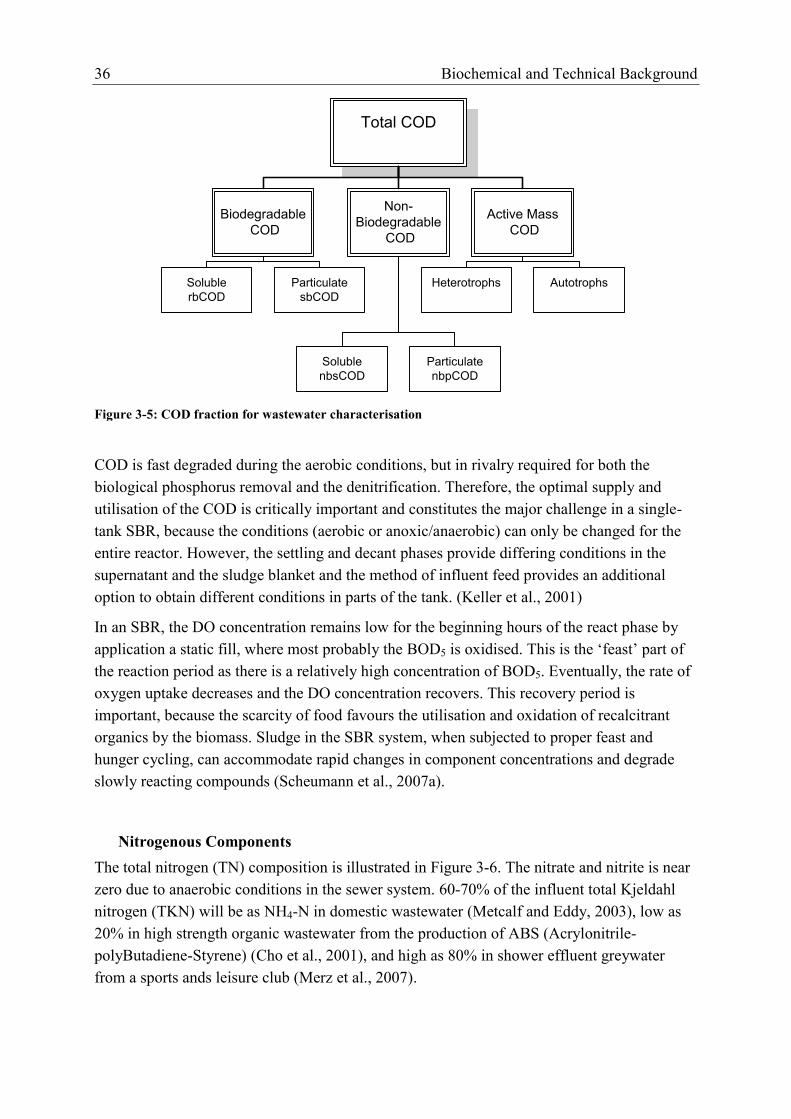
36 Biochemical and Technical Background
Total COD
Non-
Biodegradable
COD
Active Mass
COD
Biodegradable
COD
Particulate
sbCOD
Soluble
rbCOD
Soluble
nbsCOD
Particulate
nbpCOD
Heterotrophs
Autotrophs
Figure 3-5: COD fraction for wastewater characterisation
COD is fast degraded during the aerobic conditions, but in rivalry required for both the
biological phosphorus removal and the denitrification. Therefore, the optimal supply and
utilisation of the COD is critically important and constitutes the major challenge in a single-
tank SBR, because the conditions (aerobic or anoxic/anaerobic) can only be changed for the
entire reactor. However, the settling and decant phases provide differing conditions in the
supernatant and the sludge blanket and the method of influent feed provides an additional
option to obtain different conditions in parts of the tank. (Keller et al., 2001)
In an SBR, the DO concentration remains low for the beginning hours of the react phase by
application a static fill, where most probably the BOD5 is oxidised. This is the ‘feast’ part of
the reaction period as there is a relatively high concentration of BOD5. Eventually, the rate of
oxygen uptake decreases and the DO concentration recovers. This recovery period is
important, because the scarcity of food favours the utilisation and oxidation of recalcitrant
organics by the biomass. Sludge in the SBR system, when subjected to proper feast and
hunger cycling, can accommodate rapid changes in component concentrations and degrade
slowly reacting compounds (Scheumann et al., 2007a).
Nitrogenous Components
The total nitrogen (TN) composition is illustrated in Figure 3-6. The nitrate and nitrite is near
zero due to anaerobic conditions in the sewer system. 60-70% of the influent total Kjeldahl
nitrogen (TKN) will be as NH4-N in domestic wastewater (Metcalf and Eddy, 2003), low as
20% in high strength organic wastewater from the production of ABS (Acrylonitrile-
polyButadiene-Styrene) (Cho et al., 2001), and high as 80% in shower effluent greywater
from a sports ands leisure club (Merz et al., 2007).
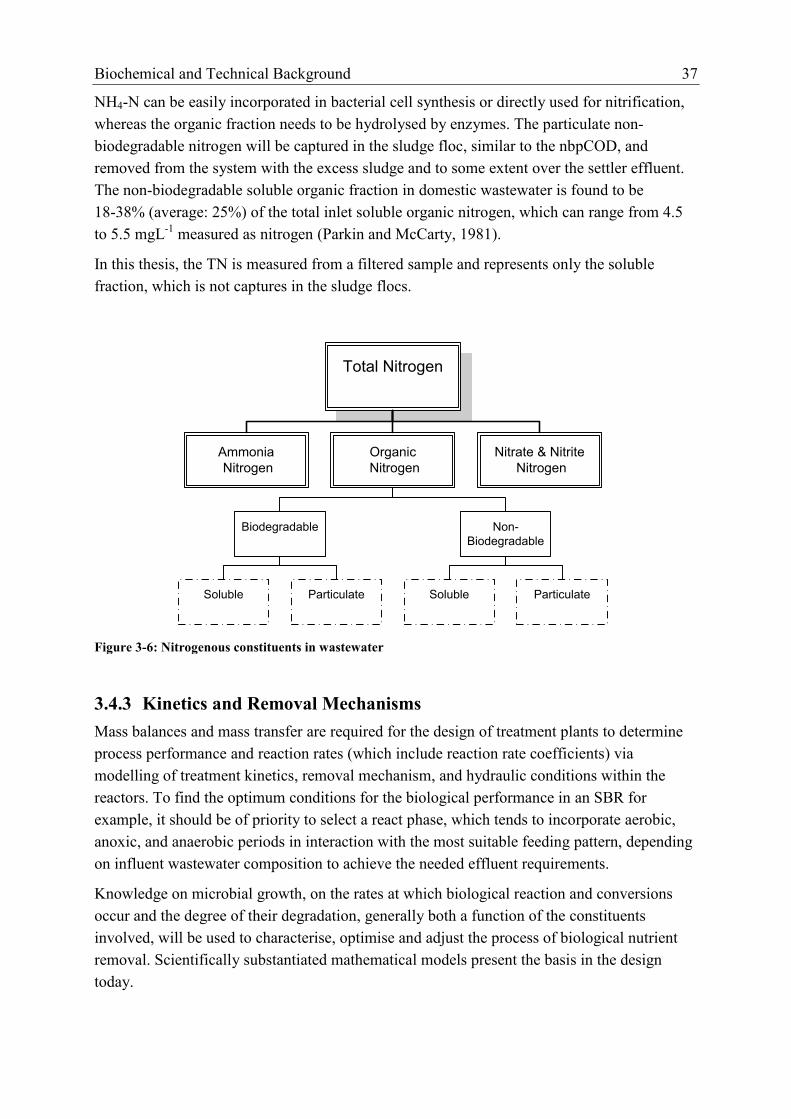
Biochemical and Technical Background 37
NH4-N can be easily incorporated in bacterial cell synthesis or directly used for nitrification,
whereas the organic fraction needs to be hydrolysed by enzymes. The particulate non-
biodegradable nitrogen will be captured in the sludge floc, similar to the nbpCOD, and
removed from the system with the excess sludge and to some extent over the settler effluent.
The non-biodegradable soluble organic fraction in domestic wastewater is found to be
18-38% (average: 25%) of the total inlet soluble organic nitrogen, which can range from 4.5
to 5.5 mgL-1
measured as nitrogen (Parkin and McCarty, 1981).
In this thesis, the TN is measured from a filtered sample and represents only the soluble
fraction, which is not captures in the sludge flocs.
Total Nitrogen
Organic
Nitrogen
Nitrate & Nitrite
Nitrogen
Ammonia
Nitrogen
Biodegradable
Non-
Biodegradable
Soluble
Particulate
Soluble
Particulate
Figure 3-6: Nitrogenous constituents in wastewater
3.4.3 Kinetics and Removal Mechanisms
Mass balances and mass transfer are required for the design of treatment plants to determine
process performance and reaction rates (which include reaction rate coefficients) via
modelling of treatment kinetics, removal mechanism, and hydraulic conditions within the
reactors. To find the optimum conditions for the biological performance in an SBR for
example, it should be of priority to select a react phase, which tends to incorporate aerobic,
anoxic, and anaerobic periods in interaction with the most suitable feeding pattern, depending
on influent wastewater composition to achieve the needed effluent requirements.
Knowledge on microbial growth, on the rates at which biological reaction and conversions
occur and the degree of their degradation, generally both a function of the constituents
involved, will be used to characterise, optimise and adjust the process of biological nutrient
removal. Scientifically substantiated mathematical models present the basis in the design
today.
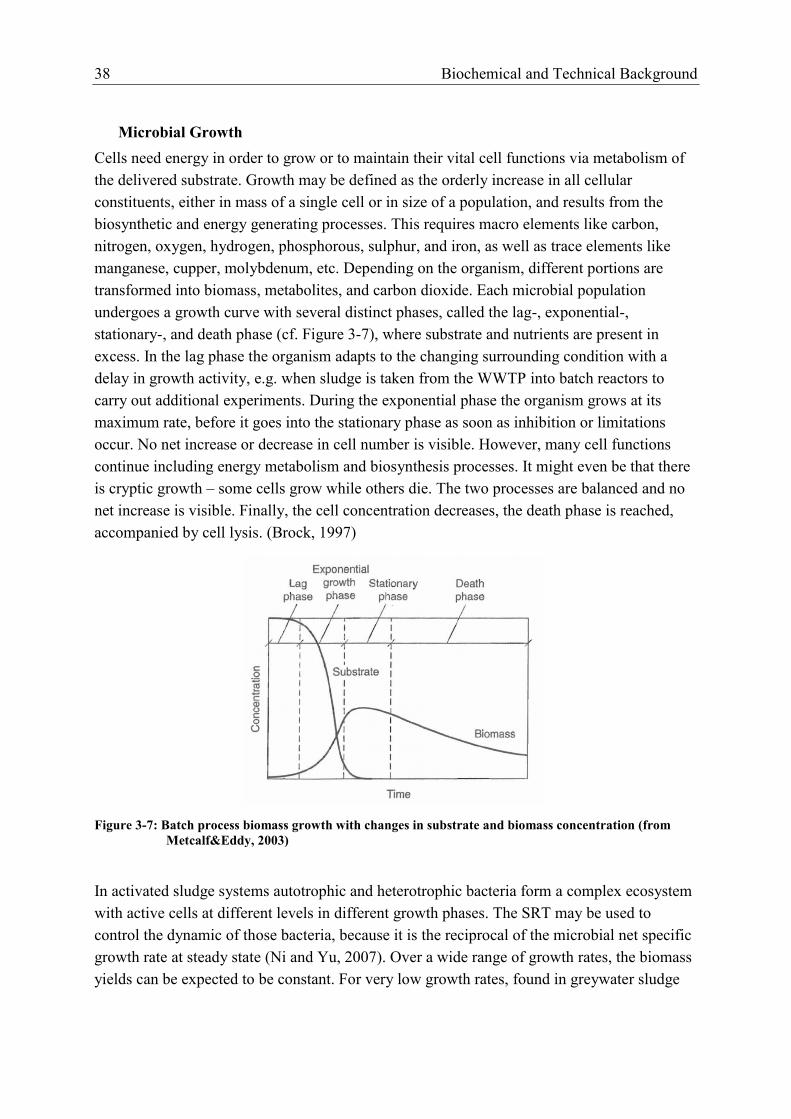
38 Biochemical and Technical Background
Microbial Growth
Cells need energy in order to grow or to maintain their vital cell functions via metabolism of
the delivered substrate. Growth may be defined as the orderly increase in all cellular
constituents, either in mass of a single cell or in size of a population, and results from the
biosynthetic and energy generating processes. This requires macro elements like carbon,
nitrogen, oxygen, hydrogen, phosphorous, sulphur, and iron, as well as trace elements like
manganese, cupper, molybdenum, etc. Depending on the organism, different portions are
transformed into biomass, metabolites, and carbon dioxide. Each microbial population
undergoes a growth curve with several distinct phases, called the lag-, exponential-,
stationary-, and death phase (cf. Figure 3-7), where substrate and nutrients are present in
excess. In the lag phase the organism adapts to the changing surrounding condition with a
delay in growth activity, e.g. when sludge is taken from the WWTP into batch reactors to
carry out additional experiments. During the exponential phase the organism grows at its
maximum rate, before it goes into the stationary phase as soon as inhibition or limitations
occur. No net increase or decrease in cell number is visible. However, many cell functions
continue including energy metabolism and biosynthesis processes. It might even be that there
is cryptic growth – some cells grow while others die. The two processes are balanced and no
net increase is visible. Finally, the cell concentration decreases, the death phase is reached,
accompanied by cell lysis. (Brock, 1997)
Figure 3-7: Batch process biomass growth with changes in substrate and biomass concentration (from
Metcalf&Eddy, 2003)
In activated sludge systems autotrophic and heterotrophic bacteria form a complex ecosystem
with active cells at different levels in different growth phases. The SRT may be used to
control the dynamic of those bacteria, because it is the reciprocal of the microbial net specific
growth rate at steady state (Ni and Yu, 2007). Over a wide range of growth rates, the biomass
yields can be expected to be constant. For very low growth rates, found in greywater sludge
Biochemical and Technical Background 39
(Scheumann and Kraume, 2009), other phenomena must be considered. In those cases, part of
the substrate is used for cell survival and not for reproduction, yielding energy only for
maintenance (Drews and Kraume, 2007).
Microbial Growth Parameters
The kinetic of microbial growth controls the substrate oxidation (i.e., utilisation) and the
production of biomass, yielding in the amount of total suspended solid concentration (TSS) of
the activated sludge processes. The process of transformations can be set equal to the
depletion of the electron donor. For the heterotrophic bacteria the electron donors are the
organic compounds during aerobic oxidation and for the autotrophic, nitrifying bacteria it is
mainly ammonia. The specific substrate utilisation rate rsu, the specific net biomass
production rate rg, and the production rate of volatile suspended solids (VSS) rX, VSS estimate
the amount of sludge produced in the process and is known as the observed yield (cf. equation
3-3 to 3-7).
specific substrate utilisation rate rsu:
SK
SXkr
S
su
(3-3)
specific net biomass production rate rg:
XkSK
SXkYr
XkrYr
d
S
g
dsug
(3-4)
specific biomass growth rate µ:
d
S
g
kSK
SkY
X
r
(3-5)
where kd = endogenous decay coefficient, gVSS(gVSSd)-1
k = max. specific substrate utilisation rate, gsubstrate(gbiomassd)-1
KS = half velocity or Monod constant, gm-3
rsu = rate of substrate change due to oxidation, gm
-3d
-1
rg = rate of net biomass production, gVSSm-3
d-1
S = growth limiting substrate concentration, gm-3
X = biomass concentration, gm
-3
Y = yield, gVSS, produced(gsubstrate, removed)-1
µ = specific biomass growth rate, gVSS(gVSSd)-1

40 Biochemical and Technical Background
production rate of volatile suspended solids rX, VSS:
V
XQXkfXkrYr
io
dddsuVSSX
,
, with
m
su
g
susu rrr (3-6)
observed biomass yield:
su
VSSX
obsr
rY
, (3-7)
where fd = fraction of biomass as cell debris, 0.1-0.15 gVSS(gVSS)-1
Q = influent flow rate, m3d
-1
g
sur = rate of substrate change related to growth, gm-3
d-1
m
sur = rate of substrate change related to maintenance, gm-3
d-1
rX, VSS = rate of total VSS production, gVSSm-3
d-1
V = reactor volume, m3
Xo, i = influent non-biodegradable VSS concentration, gVSSm-3
d-1
Yobs = observed yield, gVSS, produced(gsubstrate, removed)-1
For substrate depletion, the cell must be in contact with the biodegradable COD, which is
infiltrated through sorption and finally because of enzymatic reactions decomposed.
The above mentioned basic equations describe the interaction between microbial growth and
substrate utilisation in activated sludge processes and are based on the Monod kinetic (cf.
equation (3-8)), directly derived from the Michaelis-Menten formalism (Liu, 2006):
productenzymecomplexsubstrateenzymesubstrateenzymekk
k
21
1
SKS
S
max (3-8)
where µmax = maximum specific growth rate, d-1
The Monod equation is linked to microbial growth and has been widely used to describe the
process. However, it has no mechanistic basis since it is purely empirical, developed from a
curve fitting exercise. It shows a functional relationship between the specific growth rate and
the essential substrate concentration; furthermore it is accepted by the IAWPRC (now IWA)
task group as the fundamental basis for the development of the activated sludge models and
for the determination of the biokinetic coefficients (Al-Malack, 2006). The Michaelis-Menten
equation was derived from the mechanism of enzyme reactions, where the reactive material is
held constant and although it gives a mechanistic meaning to the constants involved, none can
be applied to a substrate-cell system as described by the Monod equation. Because of this
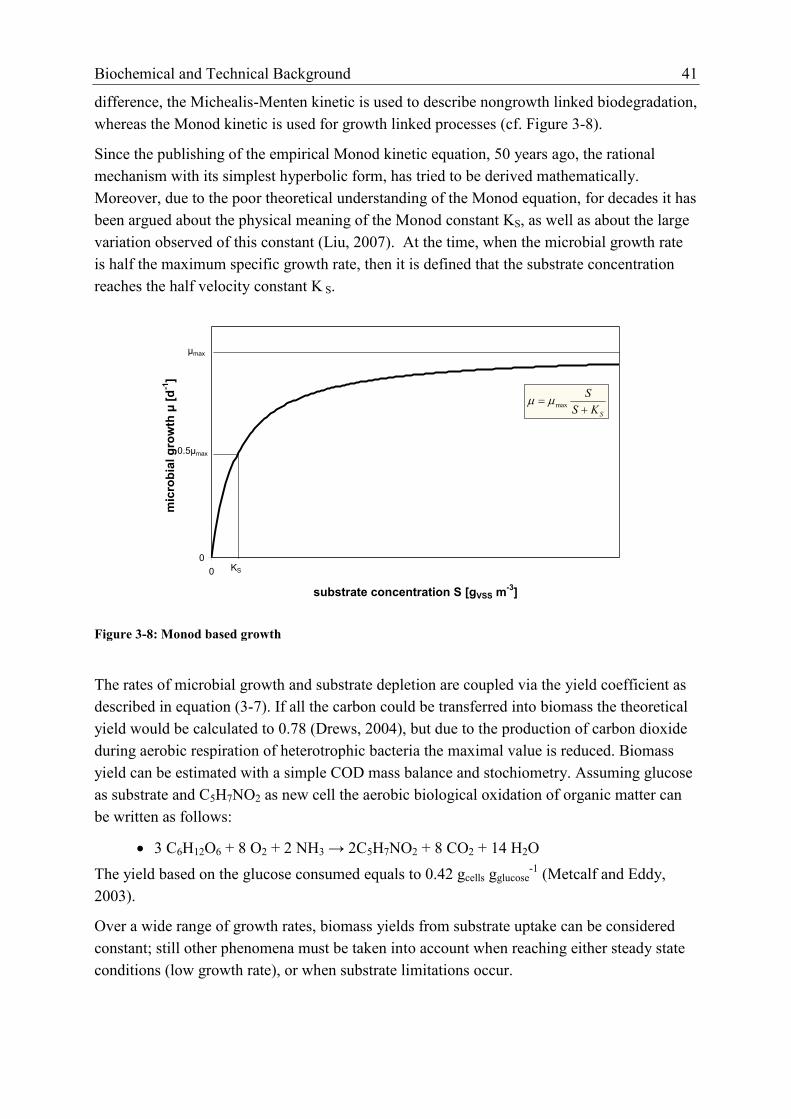
Biochemical and Technical Background 41
difference, the Michealis-Menten kinetic is used to describe nongrowth linked biodegradation,
whereas the Monod kinetic is used for growth linked processes (cf. Figure 3-8).
Since the publishing of the empirical Monod kinetic equation, 50 years ago, the rational
mechanism with its simplest hyperbolic form, has tried to be derived mathematically.
Moreover, due to the poor theoretical understanding of the Monod equation, for decades it has
been argued about the physical meaning of the Monod constant KS, as well as about the large
variation observed of this constant (Liu, 2007). At the time, when the microbial growth rate
is half the maximum specific growth rate, then it is defined that the substrate concentration
reaches the half velocity constant K S.
0
0
substrate concentration S [gVSS m-3
]
mic
rob
ial
gro
wth
µ [
d-1
]
KS
0.5µmax
µmax
SKS
S
max
Figure 3-8: Monod based growth
The rates of microbial growth and substrate depletion are coupled via the yield coefficient as
described in equation (3-7). If all the carbon could be transferred into biomass the theoretical
yield would be calculated to 0.78 (Drews, 2004), but due to the production of carbon dioxide
during aerobic respiration of heterotrophic bacteria the maximal value is reduced. Biomass
yield can be estimated with a simple COD mass balance and stochiometry. Assuming glucose
as substrate and C5H7NO2 as new cell the aerobic biological oxidation of organic matter can
be written as follows:
3 C6H12O6 + 8 O2 + 2 NH3 → 2C5H7NO2 + 8 CO2 + 14 H2O
The yield based on the glucose consumed equals to 0.42 gcells gglucose-1
(Metcalf and Eddy,
2003).
Over a wide range of growth rates, biomass yields from substrate uptake can be considered
constant; still other phenomena must be taken into account when reaching either steady state
conditions (low growth rate), or when substrate limitations occur.
42 Biochemical and Technical Background
Phenomena under Substrate Limitations
The maintenance concept, introduced by Pirt (1965), can be used to describe the phenomena
under substrate limitation, like the reduced sludge production noticed in ASP with growing
sludge age or substrate limited wastewater, e.g. greywater (Jefferson et al., 2001). Substrate is
partially used for cell survival and not for reproduction, therefore the corresponding substrate
uptake rate only yields the energy needed for maintenance (e.g., renewal of the cell
membrane) and depends on the type of the limiting substrate and on temperature (Drews and
Kraume, 2007). Now, if the maintenance energy would be assumed to be zero, than equation
(3-7) reduces to the true growth yield Yg:
g
su
VSSXg
r
rY
, (3-9)
where Yg = true growth yield, gVSS, produced(gsubstrate, removed via growth)
-1
But, if the maintenance energy is not zero, then the part of energy used for maintenance will
increase with decreasing growth rates, which means the observed yield is a function of µ. On
the assumption that the maintenance energy is constant and independent of the growth rate,
the substrate uptake rate can be expressed as follow:
XkY
rr Smg
VSSX
su ,
, (3-10)
where km,S = constant maintenance energy coefficient, m-3
d-1
The maintenance coefficient km,S and the true yield Yg permits modelling of the process,
including final biomass concentration at steady state. Limiting nutrient concentrations hinder
nutrient diffusion and subsequent transport into the cell. The availability and the transport of
substrate to the cell surface and then through several cell layers is the central problem under
nutrient-limited conditions. The demands for energy and biosynthesis can only be satisfied by
physiological adaptations, i.e. to maximise the limited nutrient transport by increased
synthesis of membrane-bound permeases or initiating synthesis of high-affinity transport
systems is a common response to nutrient limitation. (Konopka, 2000)
Later studies have shown that km,S is not constant, especially when growth is limited by other
sources than the energy substrate. In a literature review undertaken by Drews and Kraume
(2007) only a few variations of km,S have been observed in the operation of MBR, with no
reported valid correlation for the influence of hydraulic residence time, specific growth rate or
sludge age. Bouillot et al. (1990) and Wisniewski et al. (1999) (both cited in Drews and
Kraume (2007)) suggest for MBR in wastewater treatment a maintenance coefficient

Biochemical and Technical Background 43
km,S = 0.04 mgCOD (mgVSS h)-1
and a true yield of Yg = 0.36 mgVSS (mgCOD)
-1.
Under sufficient energy substrate supply, the formation of energy storage substances (e.g.,
glycogen) is presented by Pirt (1982) via a growth dependent term in his maintenance
concept. Still, this growth dependent term is seldom considered in practise:
max
,
,
,1
'
X
kXk
Y
rr
Sm
Smg
VSSX
su (3-11)
Herbert (1958) postulated in his investigation of continuous flow culture the concept of
endogenous metabolism where at net zero growth (e.g., cryptic growth) the substrate uptake is
explained by lysis of existing cells. Similar to the maintenance concept, the endogenous
metabolism takes place in parallel to anabolism and can be neglected in processes with
sufficient substrate supply. If the cell tissue is not completely used for reuse in new cell
synthesis, then the lysis rate is named as the decay coefficient kd.
Nitrogen Removal Mechanism
Nitrogen is increasingly important in wastewater management because of the many effects of
nitrogen on the environment, e.g. eutrophication. Nitrogen exists in various forms, depending
on the oxidation states, and can readily change from one form to another. The principal forms
of nitrogen are organic nitrogen, ammonia, nitrite, and nitrate. Ammonia is extremely toxic to
fish and many other aquatic organisms and in addition it consumes the DO in water,
increasing the potential of fish die-off. All forms of nitrogen are taken up as a nutrient by
photosynthetic blue-green bacteria and algae, which then excessively grow and resulting in
the so called algal bloom. Although nitrate itself is not toxic, its conversion to nitrite is a
concern to public health, because of its hazardous effects in water consumed by infants. In the
body, nitrite can oxidise the iron (II) and form methemoglobin, which binds oxygen less
effectively than normal haemoglobin. The resulting decrease in oxygen levels in young
children leads to shortness of breath, diarrhoea, vomiting, and in extreme cases even to death.
The biodegradation of nitrogen in a wastewater treatment consists of two processes:
Nitrification under aerobic conditions and denitrification under anoxic conditions. Sequence
batch reactor systems have been successfully applied throughout the world for carbon
removal, nitrification and denitrification (Artan et al., 2001; Bernardes and Klapwijk, 1996;
Kargi and Uygur, 2003; Peters et al., 2005). Where membrane technology is applied,
complete retention of micro-organisms can encourage the growth of specialised
microorganisms, potentially improving the performance further. However, Manser et al.
(2005) has concluded that the membrane separation neither enhances the nitrification
performance nor improves the safety against overloading or wash-out compared to a CAS
system, because both systems exhibited a similar maximum nitrification rate with average
values of 33±5 and 36±5 mgN (gCOD d)-1
at 20°C, respectively.

44 Biochemical and Technical Background
Nitrification
The biological oxidation of ammonia with oxygen into nitrite followed by a further oxidation
into nitrate is called nitrification and a central position within the global nitrogen cycle.
Nitrifying bacteria are the only organisms capable of converting the most reduced form of
nitrogen, ammonia, to the most oxidised form, nitrate and also carry out a range of other
important processes within the nitrogen cycle. The first step is done mainly by Nitrosomonas,
and the second step (oxidation of nitrite into nitrate) is done mainly by Nitrobacter. Nitrifying
organisms are chemoautotrophic, and use carbon dioxide as their carbon source for growth.
Nitrification proceeds usually through the transformation of ammonia to nitrate:
Nitritation: NH4+ + 1.5 O2 → NO2
− + H2O + 2 H
+
Nitratation: NO2− + 0.5 O2 → NO3
−
Complete nitrification has been demonstrated in MBR at sludge ages of 5-72 days and organic
loading rates of 0.05-0.66 kgBOD m-3
d-1
(Stephenson et al., 2000). Sludge age has been shown
to have an influence on nitrification in MBR. Stephenson et al. (2000) reported an increase of
the ammonia removal efficiencies from 94 to 99% on doubling the sludge age from 5 to 10d,
and Innocenti et al. (2002) showed an increase in the ammonia uptake rate (AUR) from 0.13
to 2.51 mgNH4-N (gVSS h)-1
coupled to a change in SRT from 10d to 190d.
Bacteria, capable of nitrification, show generally a low specific growth rate of about 1/day
(Henze et al., 1987), therefore process operations have to prevent a wash out of biomass,
meaning a minimum sludge age of > 5 days is necessary in order to ensure complete
nitrification (Fan et al., 2000).
Under optimal conditions the oxidation rate of nitrite is higher than the one of ammonium, so
no accumulation of nitrite occurs. By accepting the stoichiometry, the nitrification process
requires 3.43 gO2 gN-1
and 1.14 gO2 gN-1
for the two reaction steps.
In order to characterise the nitrification process, one of the most used parameters is the
nitrification rate also known as ammonium utilisation rate (AUR). The kinetics of nitrification
can be modelled by zero-order and first-order reactions, or as done in most nitrification
studies by a Monod type equation. It expresses the effect of substrate concentration on the
growth of nitrifying bacteria. The effects of ammonia and dissolved oxygen on the growth
rate are described in equation (3-12):
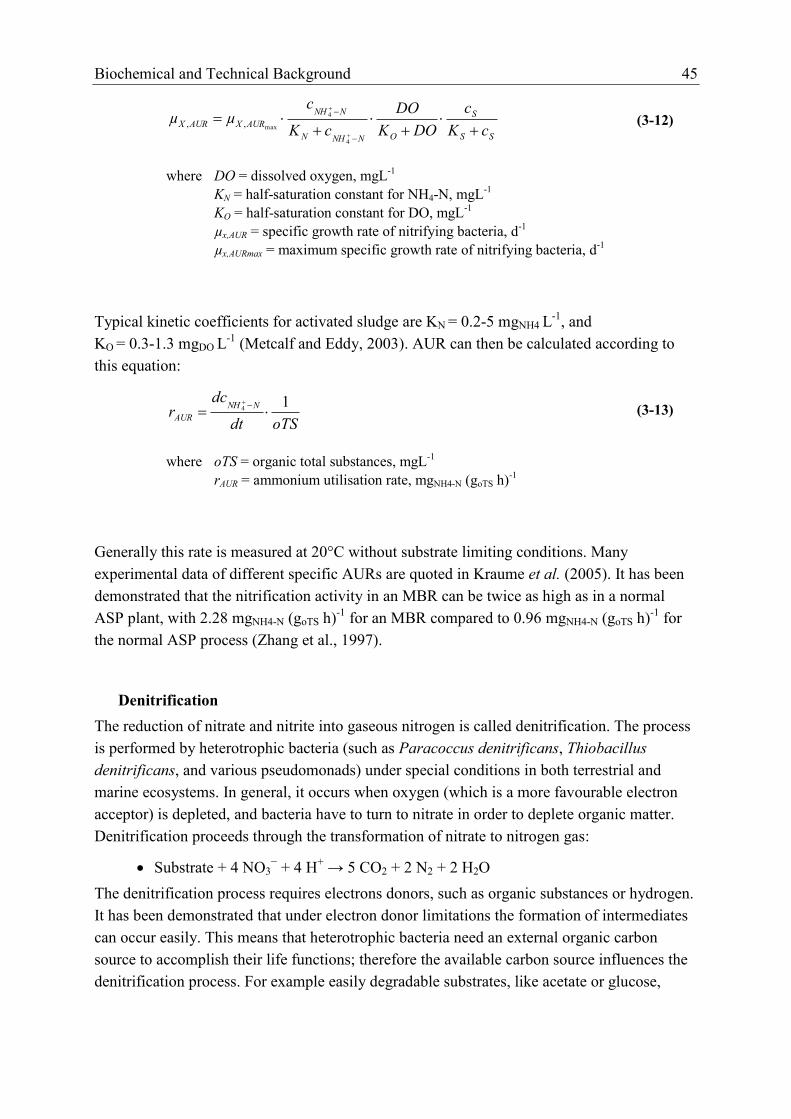
Biochemical and Technical Background 45
SS
S
ONNHN
NNH
AURXAURXcK
c
DOK
DO
cK
cµµ
4
4
max,, (3-12)
where DO = dissolved oxygen, mgL-1
KN = half-saturation constant for NH4-N, mgL-1
KO = half-saturation constant for DO, mgL-1
µx,AUR = specific growth rate of nitrifying bacteria, d-1
µx,AURmax = maximum specific growth rate of nitrifying bacteria, d-1
Typical kinetic coefficients for activated sludge are KN = 0.2-5 mgNH4 L-1
, and
KO = 0.3-1.3 mgDO L-1
(Metcalf and Eddy, 2003). AUR can then be calculated according to
this equation:
oTSdt
dcr
NNH
AUR
14
(3-13)
where oTS = organic total substances, mgL-1
rAUR = ammonium utilisation rate, mgNH4-N (goTS h)-1
Generally this rate is measured at 20°C without substrate limiting conditions. Many
experimental data of different specific AURs are quoted in Kraume et al. (2005). It has been
demonstrated that the nitrification activity in an MBR can be twice as high as in a normal
ASP plant, with 2.28 mgNH4-N (goTS h)-1
for an MBR compared to 0.96 mgNH4-N (goTS h)-1
for
the normal ASP process (Zhang et al., 1997).
Denitrification
The reduction of nitrate and nitrite into gaseous nitrogen is called denitrification. The process
is performed by heterotrophic bacteria (such as Paracoccus denitrificans, Thiobacillus
denitrificans, and various pseudomonads) under special conditions in both terrestrial and
marine ecosystems. In general, it occurs when oxygen (which is a more favourable electron
acceptor) is depleted, and bacteria have to turn to nitrate in order to deplete organic matter.
Denitrification proceeds through the transformation of nitrate to nitrogen gas:
Substrate + 4 NO3− + 4 H
+ → 5 CO2 + 2 N2 + 2 H2O
The denitrification process requires electrons donors, such as organic substances or hydrogen.
It has been demonstrated that under electron donor limitations the formation of intermediates
can occur easily. This means that heterotrophic bacteria need an external organic carbon
source to accomplish their life functions; therefore the available carbon source influences the
denitrification process. For example easily degradable substrates, like acetate or glucose,
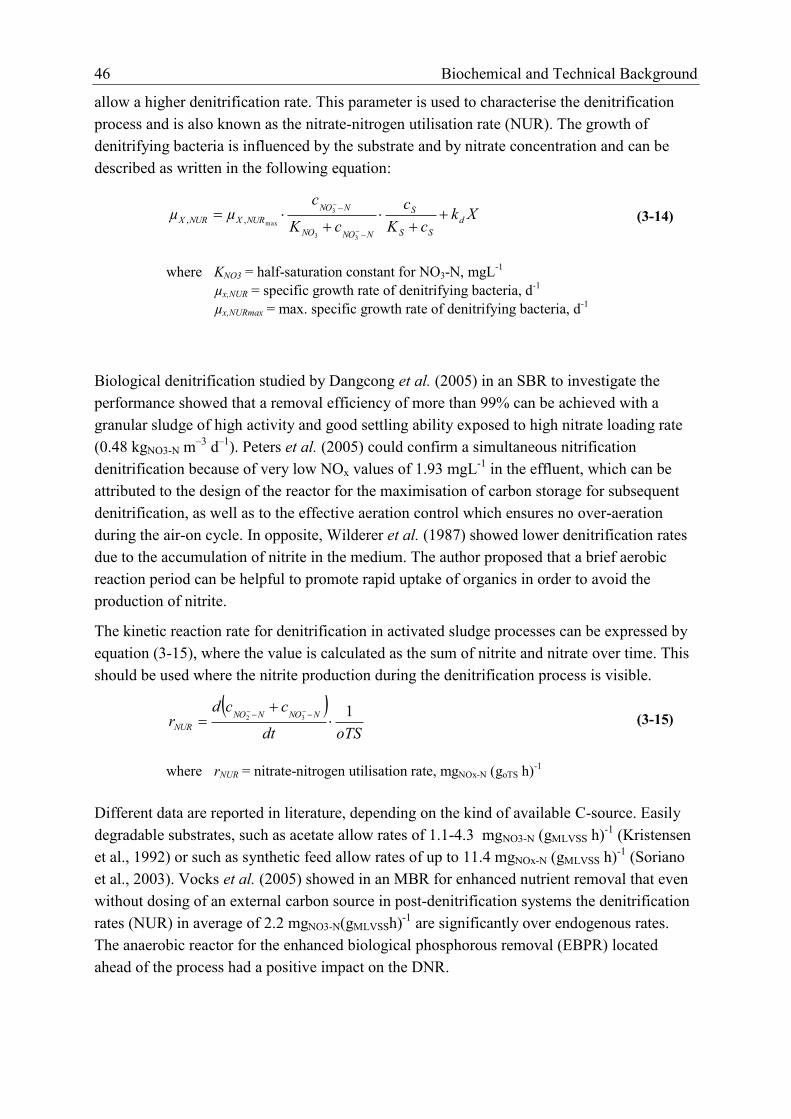
46 Biochemical and Technical Background
allow a higher denitrification rate. This parameter is used to characterise the denitrification
process and is also known as the nitrate-nitrogen utilisation rate (NUR). The growth of
denitrifying bacteria is influenced by the substrate and by nitrate concentration and can be
described as written in the following equation:
XkcK
c
cK
cµµ d
SS
S
NNONO
NNO
NURXNURX
33
3
max,, (3-14)
where KNO3 = half-saturation constant for NO3-N, mgL-1
µx,NUR = specific growth rate of denitrifying bacteria, d
-1
µx,NURmax = max. specific growth rate of denitrifying bacteria, d-1
Biological denitrification studied by Dangcong et al. (2005) in an SBR to investigate the
performance showed that a removal efficiency of more than 99% can be achieved with a
granular sludge of high activity and good settling ability exposed to high nitrate loading rate
(0.48 kgNO3-N m–3
d–1
). Peters et al. (2005) could confirm a simultaneous nitrification
denitrification because of very low NOx values of 1.93 mgL-1
in the effluent, which can be
attributed to the design of the reactor for the maximisation of carbon storage for subsequent
denitrification, as well as to the effective aeration control which ensures no over-aeration
during the air-on cycle. In opposite, Wilderer et al. (1987) showed lower denitrification rates
due to the accumulation of nitrite in the medium. The author proposed that a brief aerobic
reaction period can be helpful to promote rapid uptake of organics in order to avoid the
production of nitrite.
The kinetic reaction rate for denitrification in activated sludge processes can be expressed by
equation (3-15), where the value is calculated as the sum of nitrite and nitrate over time. This
should be used where the nitrite production during the denitrification process is visible.
oTSdt
ccdr
NNONNO
NUR
132
(3-15)
where rNUR = nitrate-nitrogen utilisation rate, mgNOx-N (goTS h)-1
Different data are reported in literature, depending on the kind of available C-source. Easily
degradable substrates, such as acetate allow rates of 1.1-4.3 mgNO3-N (gMLVSS h)-1
(Kristensen
et al., 1992) or such as synthetic feed allow rates of up to 11.4 mgNOx-N (gMLVSS h)-1
(Soriano
et al., 2003). Vocks et al. (2005) showed in an MBR for enhanced nutrient removal that even
without dosing of an external carbon source in post-denitrification systems the denitrification
rates (NUR) in average of 2.2 mgNO3-N(gMLVSSh)-1
are significantly over endogenous rates.
The anaerobic reactor for the enhanced biological phosphorous removal (EBPR) located
ahead of the process had a positive impact on the DNR.
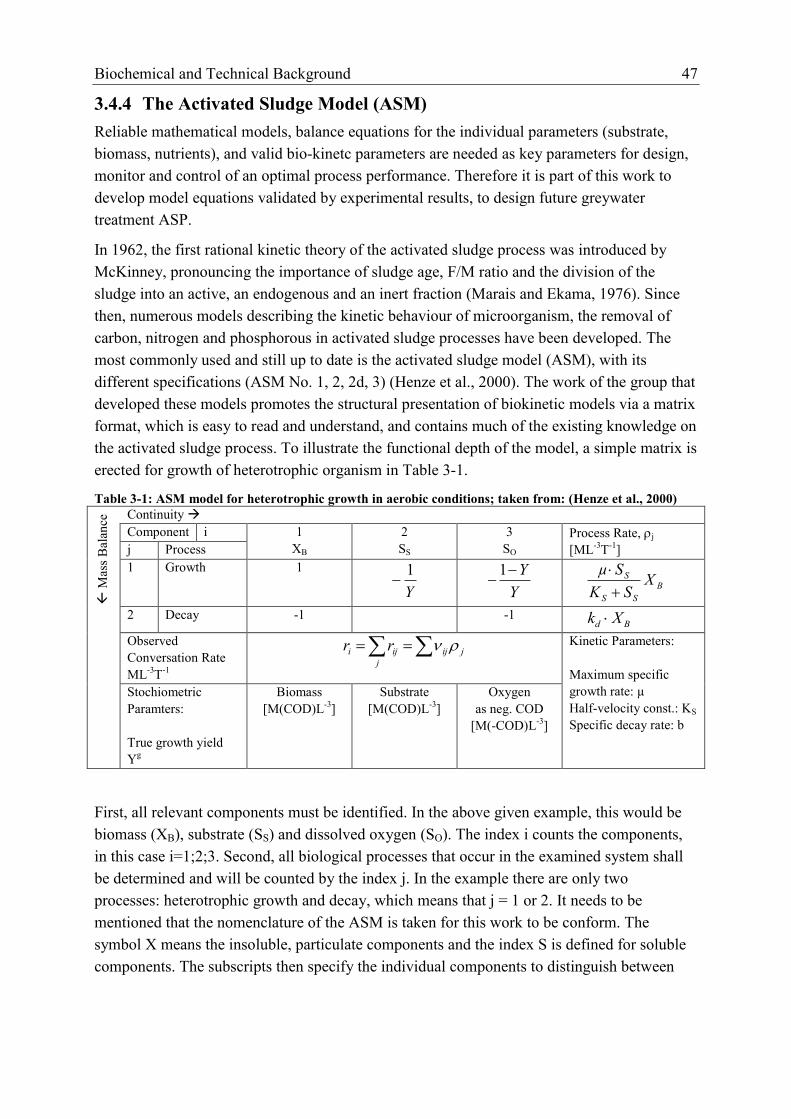
Biochemical and Technical Background 47
3.4.4 The Activated Sludge Model (ASM)
Reliable mathematical models, balance equations for the individual parameters (substrate,
biomass, nutrients), and valid bio-kinetc parameters are needed as key parameters for design,
monitor and control of an optimal process performance. Therefore it is part of this work to
develop model equations validated by experimental results, to design future greywater
treatment ASP.
In 1962, the first rational kinetic theory of the activated sludge process was introduced by
McKinney, pronouncing the importance of sludge age, F/M ratio and the division of the
sludge into an active, an endogenous and an inert fraction (Marais and Ekama, 1976). Since
then, numerous models describing the kinetic behaviour of microorganism, the removal of
carbon, nitrogen and phosphorous in activated sludge processes have been developed. The
most commonly used and still up to date is the activated sludge model (ASM), with its
different specifications (ASM No. 1, 2, 2d, 3) (Henze et al., 2000). The work of the group that
developed these models promotes the structural presentation of biokinetic models via a matrix
format, which is easy to read and understand, and contains much of the existing knowledge on
the activated sludge process. To illustrate the functional depth of the model, a simple matrix is
erected for growth of heterotrophic organism in Table 3-1.
Table 3-1: ASM model for heterotrophic growth in aerobic conditions; taken from: (Henze et al., 2000)
M
ass
Bal
ance
Continuity
Component i 1
XB
2
SS
3
SO
Process Rate, j
[ML-3
T-1
] j Process
1 Growth 1
Y
1
Y
Y
1 B
SS
S XSK
Sµ
2 Decay -1 -1 Bd Xk
Observed
Conversation Rate
ML-3
T-1
jij
j
iji rr Kinetic Parameters:
Maximum specific
growth rate: µ
Half-velocity const.: KS
Specific decay rate: b
Stochiometric
Paramters:
True growth yield
Yg
Biomass
[M(COD)L-3
]
Substrate
[M(COD)L-3
]
Oxygen
as neg. COD
[M(-COD)L-3
]
First, all relevant components must be identified. In the above given example, this would be
biomass (XB), substrate (SS) and dissolved oxygen (SO). The index i counts the components,
in this case i=1;2;3. Second, all biological processes that occur in the examined system shall
be determined and will be counted by the index j. In the example there are only two
processes: heterotrophic growth and decay, which means that j = 1 or 2. It needs to be
mentioned that the nomenclature of the ASM is taken for this work to be conform. The
symbol X means the insoluble, particulate components and the index S is defined for soluble
components. The subscripts then specify the individual components to distinguish between

48 Biochemical and Technical Background
different fractions in the observed system.
The kinetic rate equations are written in the rightmost column and denoted as j, whereas the
stoichometric coefficients are defined in the lower left corner. Now, the matrix can be read in
two directions: for mass balance purposes - downwards in a column presenting a component
and for continuity check - across the matrix with the sum of the stoichometric coefficient
equal to zero. In the given example, the specification for a mass balances would lead to the
following process rates:
XkXSK
Sµr d
SS
SXB
(3-16)
XSK
Sµ
Yr
SS
SSS
1 (3-17)
where kd = endogenous decay coefficient, gVSS(gVSSd)-1
rX,s = rate of biomass production due to rbCOD, gm-3
d-1
rS,s = rate of soluble substrate change, gVSSm-3
d-1
rX, VSS = rate of total VSS production, gVSSm-3
d-1
SS = soluble substrate concentration, gm-3
Y = biomass yield, gVSS, produced(gsubstrate, removed)
-1
Please read the book on the activated sludge models from the IAWQ task group on
mathematical modelling (Henze et al., 2000) for further information.
The growth rate of both heterotrophic and autotrophic organisms in the model is described by
the Monod relationship. COD is selected as the suitable parameter for defining the
carbonaceous material as it provides a link between electron equivalents in the organic
substrate, the biomass and the oxygen utilised, and furthermore, mass balances can be made
in terms of COD. The introduced bisubstrate hypothesis states that the biodegradable COD in
the influent wastewater consists of two fractions: readily and slowly biodegradable COD. The
rbCOD are made of simple molecules able to pass through the cell wall immediately. The
sbCOD, which consists of larger complex molecules, is enmeshed in the sludge. After
extracellular enzymatic breakdown (often referred to as hydrolysis) the substrate is released to
the bulk liquid and transferred through the cell wall and used for metabolism. The death-
regeneration hypothesis is the attempt to single out the different reactions that take place
when organisms die. The decayed cell material is released through lysis: One fraction being
non-biodegradable and adding to the inert residue, while the other, remaining fraction is
slowly biodegradable, able to return to the process and be used by the remaining organisms as
substrate through hydrolysis.
The assumptions made in the ASM concerning the aqueous environment are valid for most
municipal wastewaters, because of their sufficient buffer capacity and low concentration on
Biochemical and Technical Background 49
C, N, and P (Sotemann et al., 2005). The authors stated also that there are exceptions to be
made, when wastewaters outside the average range are investigated (e.g., low COD pollution,
or a weak acid-base-balance), resulting in sludge characteristics with variations in growth rate
and substrate consumption behaviour. However, experimental determinations of qualitatively
different parameters and investigation of identifiability of applied data provide the basis for a
successful application of all models.
Key features and assumptions of the model
Heterotrophic bacteria are the main group for COD depletion under both aerobic and
anoxic conditions, with the only difference in the use of nitrate as electron acceptor
under anoxic conditions (Henze et al., 2000). Furthermore, the kinetic expressions in
the model are based on switching functions (Monod equations), which means they
are either active (=1) or inactive (= 0).
Growth, maintenance and decay processes can be best described as suggested by
(Beeftink et al., 1990). Substrate (NH4, NO2 , SS) is utilised for growth and
maintenance of the ammonia oxidisers, nitrite oxidisers and heterotrophic bacteria.
Nitrification is a two-step process, carried out by two types of nitrifying biomass.
Therefore nitrite accumulation must be taken into account (Brouwer et al., 1998).
The decay rates can be subdivided into the aerobic decay, which occurs when the
bacteria starve in the presence of oxygen, as well as the anoxic decay, which occurs
when the bacteria starve in the absence of oxygen and in the presence of nitrate.
A predation mechanism is considered in the model by introducing predators as
active biomass, as proposed by van Loosdrecht and Henze (1999). The predation
rate is a function of the bacterial concentration and squeezed into one decay process.
This process represents the sum of all decay and loss processes of the predators like
lysis due to phage infection and predation by metazoa. This decay and predation
processes result in the generation of inert biomass that is not further metabolised.
Data Determination with the Help of Respirometry Measurements
The measurement of the biological oxygen consumption, directly associated with biomass
growth and substrate removal, under defined experimental conditions and the interpretation of
the obtained data is know as respirometry (Spanjers et al., 1998). With this method, it is
possible to estimate wastewater characteristics in the context of the ASM. Next to the oxygen
uptake rate (OUR) measurements, titrimetric (cumulative production), or a combination of
both experiments are also common methods to estimate biokinetic parameters for
heterotrophic and autotrophic process for the mathematical models, e.g. (Cokgor et al., 1998;
Corominas et al., 2006; Dircks et al., 1999; Ekama and Marais, 1979; Gapes et al., 2004;
Kappeler and Gujer, 1992; Kristensen et al., 1992; Petersen et al., 2003; Sollfrank and Gujer,
1991; Sozen et al., 1998; Vanrolleghem et al., 1999; Wentzel et al., 1995).

50 Biochemical and Technical Background
The combination of respirometric and titrimetric data obtained from aerobic oxidation of
different carbon sources have been used by Sin and Vanrolleghem (2007) for the
enhancement of ASM No.1, in order to describe the nonlinear carbon dioxide transfer rate
behaviour with a simple calibration procedure of the CO2-model, only using titrimetric data.
Gernaey et al. (2001) used also a combined respirometric–titrimetric set-up to monitor the
degradation processes during batch experiments with activated sludge, where the cumulative
amount of added acid and base serves as a complementary information source on the
degradation processes.
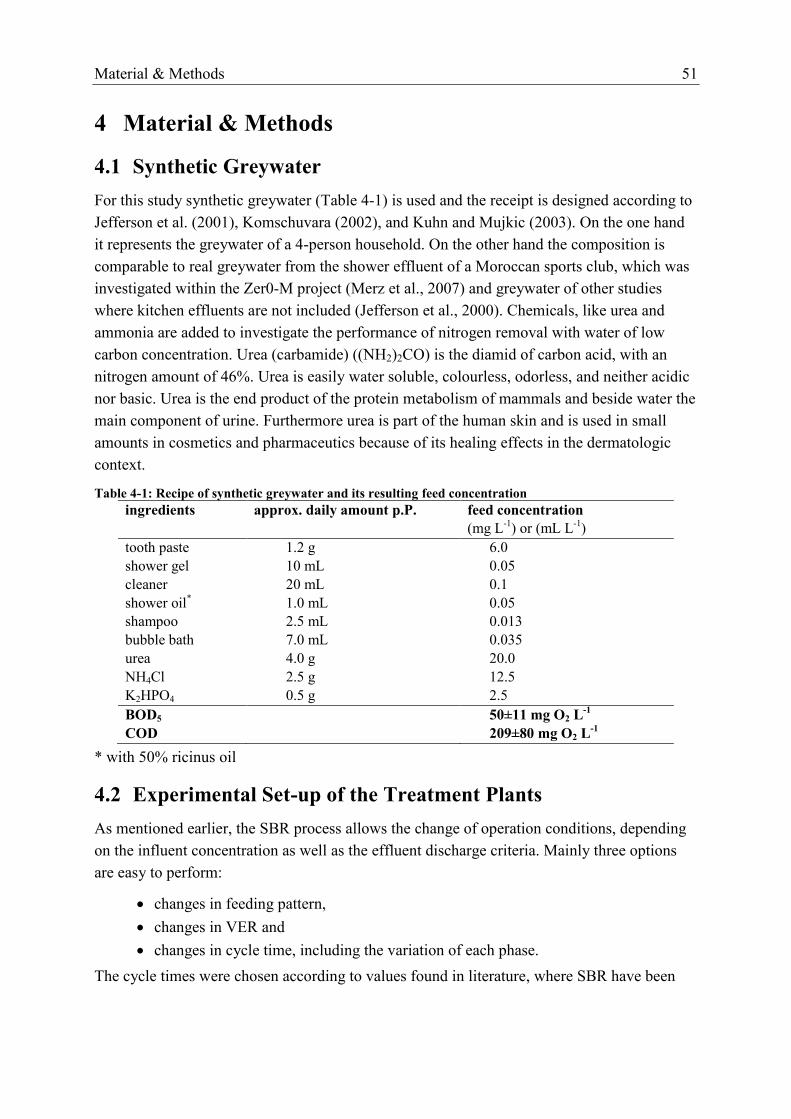
Material & Methods 51
4 Material & Methods
4.1 Synthetic Greywater
For this study synthetic greywater (Table 4-1) is used and the receipt is designed according to
Jefferson et al. (2001), Komschuvara (2002), and Kuhn and Mujkic (2003). On the one hand
it represents the greywater of a 4-person household. On the other hand the composition is
comparable to real greywater from the shower effluent of a Moroccan sports club, which was
investigated within the Zer0-M project (Merz et al., 2007) and greywater of other studies
where kitchen effluents are not included (Jefferson et al., 2000). Chemicals, like urea and
ammonia are added to investigate the performance of nitrogen removal with water of low
carbon concentration. Urea (carbamide) ((NH2)2CO) is the diamid of carbon acid, with an
nitrogen amount of 46%. Urea is easily water soluble, colourless, odorless, and neither acidic
nor basic. Urea is the end product of the protein metabolism of mammals and beside water the
main component of urine. Furthermore urea is part of the human skin and is used in small
amounts in cosmetics and pharmaceutics because of its healing effects in the dermatologic
context.
Table 4-1: Recipe of synthetic greywater and its resulting feed concentration
ingredients approx. daily amount p.P. feed concentration
(mg L-1
) or (mL L-1
)
tooth paste 1.2 g 6.0
shower gel 10 mL 0.05
cleaner 20 mL 0.1
shower oil* 1.0 mL 0.05
shampoo 2.5 mL 0.013
bubble bath 7.0 mL 0.035
urea 4.0 g 20.0
NH4Cl 2.5 g 12.5
K2HPO4 0.5 g 2.5
BOD5 50±11 mg O2 L-1
COD 209±80 mg O2 L-1
* with 50% ricinus oil
4.2 Experimental Set-up of the Treatment Plants
As mentioned earlier, the SBR process allows the change of operation conditions, depending
on the influent concentration as well as the effluent discharge criteria. Mainly three options
are easy to perform:
changes in feeding pattern,
changes in VER and
changes in cycle time, including the variation of each phase.
The cycle times were chosen according to values found in literature, where SBR have been

52 Material & Methods
operated with cycle times varying from tc=3h (Shin and Kang, 2002) over tc=4h (Innocenti et
al., 2002; Kang et al., 2003), and tc=6h (Artan et al., 2002) to tc=12h (Bae et al., 2003; Kargi
and Uygur, 2003).
Three different reactors were operated at the Technische Universität Berlin, Chair of
Chemical Engineering:
Set-up A: 29L lab scale reactor, configured as a membrane loop reactor
Set-up B: 1000L commercially available MBR for the treatment of domestic
wastewater (4-8pe)
Set-up C: 500L pilot scale reactor, first with storage tank (= set-up Cstor) and later
with direct feeding of greywater concentrate and drinking water into the biological
tank (= set-up Cdirect)
The first trials were carried out with a small 29L lab scale reactor in order to verify the
possibility of greywater treatment. In parallel, a commercially available system with a tank
volume of 1000L was operated to scale-up and transfer results from the lab scale into real
technical applications. Unfortunately the low flux of the membrane did not allow sufficient
changes in the set-up B. Therefore, after two years, a third SM-SBR with a tank volume of
500L was built and put into service. New membrane modules and the elimination of the
storage tank have been practised there. The step by step approach resulted in a constant
improvement of performance and decrease of HRT. An overview of the different operational
process conditions is given in Table 4-2.
Table 4-2: Operating conditions
Parameter set-up A set-up B set-up Cstor set-up Cdirect
SRT, d > 250 > 360 >360 >400
HRT, h 13-60 33-100 33 and 24 12 and 8
Cycle time (tc), h 4-6 4-12 3-8 2-3
TSreactor, gL-1
1.5 - 3.5
(start-up)
1.5 - 4.5
0.8 - 1.2
(start-up)
2.0 - 3.1
2.5-4.5 4.5-13.0
oTSreactor, %TS 65-70 60-70 70-80 80-90
F/M, gCOD,in(goTS,reactor d)-1
0.124 0.074 0.06 0.05
aeration rate, Nm³(m²h)-1
not measured not measured 4 4
Lorg, gCOD(Ld)-1
/ 0.049±0.010 0.076±0.034 0.076±0.034
VER 0.1-0.5 0.12 0.25 0.25
flux, L (m²h)-1
7.0-13.0 8.5-12.5 5.0-12.0 35.0-15.0
TMP, bar 0.1-0.4 0.1-0.15 0.1-0.4 0.08-0.12
It needs to be pointed out that all configurations were operated with very long sludge ages to
minimise the excess sludge production for an easier handling in remote areas and with and
low fluxes to obtain long maintenance intervals.
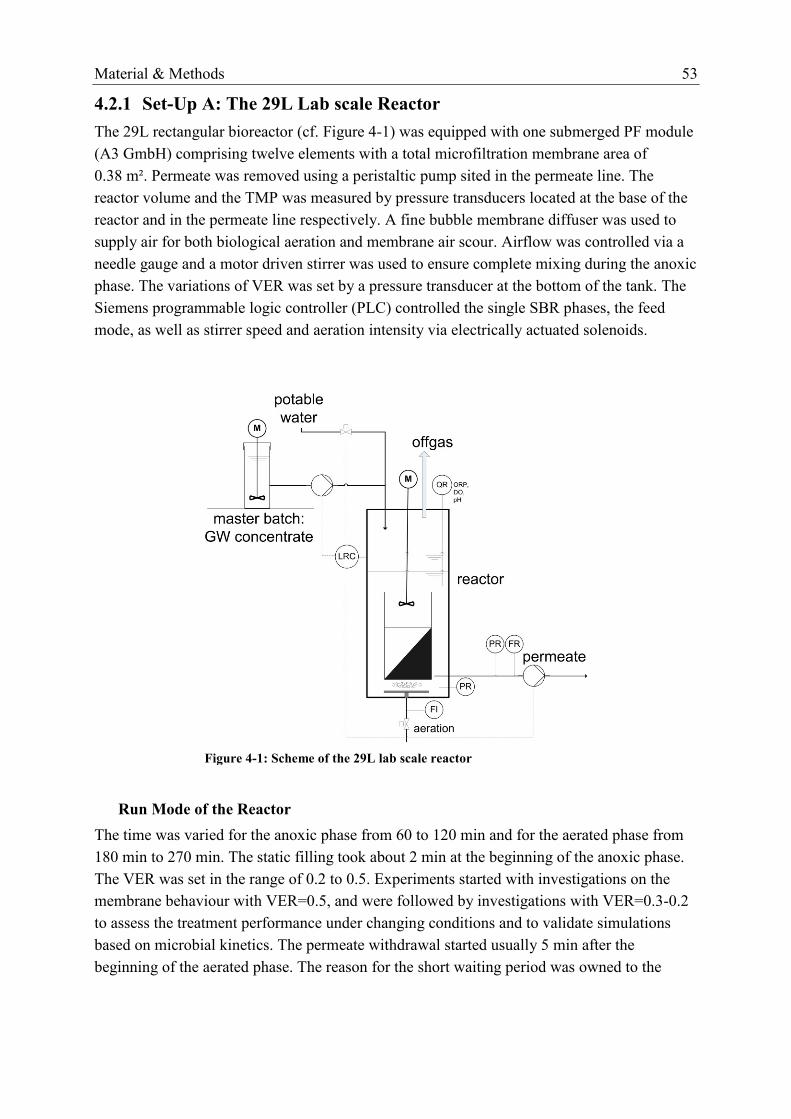
Material & Methods 53
4.2.1 Set-Up A: The 29L Lab scale Reactor
The 29L rectangular bioreactor (cf. Figure 4-1) was equipped with one submerged PF module
(A3 GmbH) comprising twelve elements with a total microfiltration membrane area of
0.38 m². Permeate was removed using a peristaltic pump sited in the permeate line. The
reactor volume and the TMP was measured by pressure transducers located at the base of the
reactor and in the permeate line respectively. A fine bubble membrane diffuser was used to
supply air for both biological aeration and membrane air scour. Airflow was controlled via a
needle gauge and a motor driven stirrer was used to ensure complete mixing during the anoxic
phase. The variations of VER was set by a pressure transducer at the bottom of the tank. The
Siemens programmable logic controller (PLC) controlled the single SBR phases, the feed
mode, as well as stirrer speed and aeration intensity via electrically actuated solenoids.
Figure 4-1: Scheme of the 29L lab scale reactor
Run Mode of the Reactor
The time was varied for the anoxic phase from 60 to 120 min and for the aerated phase from
180 min to 270 min. The static filling took about 2 min at the beginning of the anoxic phase.
The VER was set in the range of 0.2 to 0.5. Experiments started with investigations on the
membrane behaviour with VER=0.5, and were followed by investigations with VER=0.3-0.2
to assess the treatment performance under changing conditions and to validate simulations
based on microbial kinetics. The permeate withdrawal started usually 5 min after the
beginning of the aerated phase. The reason for the short waiting period was owned to the

54 Material & Methods
reachability of short HRT with membrane modules of low permeability.
The following run modes, illustrated in Table 4-3, have been applied to set-up A.
Table 4-3: Run modes of set-up A: The Lab scale reactor
run mode HRT
[h] VER
anoxic phase
[min]
aerated phase
[min]
I 12 0.5 90 270
II 9 0.5 90 180
III 20 0.3 120 240
IV 15 0.3 90 180
V 13 0.3 90 150
VI 13 0.3 60 180
VII 30 0.2 150 210
VIII 22.5 0.2 90 150
IX 40 0.1 90 150
4.2.2 Set-Up B: The 1000 L Reactor
A 1m3 reactor was utilised as a small wastewater treatment application (4-8pe) for research
purposes in the field of greywater treatment. The commercially available BioMir® reactor
system by BUSSE Engineering (cf. Figure 4-2) consisted of two 1 m3 tanks, one for storage
and the second for biological treatment. A fine bubble membrane diffuser was used to supply
air for the biological aeration and a coarse bubble aerator was used to supply air for the
membrane air scour. Airflow was set constant at a rate of 60 Lmin-1
with an air compressor
and a PLC controlled and operated the single SBR phases (feed, reaction and withdrawal).
In the first phase (until day 300) one submerged plate and frame module (A3 GmbH) was
introduced into the biological reactor, comprising 22 elements with a total MF-membrane
area of 3.9 m² and permeate was removed by gravity. In the second phase the membrane area
was doubled by adding a second module of the same specifications. Permeate was removed
by a suction pump. The volumetric exchange ratio was set with the level controller at constant
VER = 0.12. The informations from the probes (DO and OPR), as well as from the pressure
transducer for the fluid level in the biological reactor were directly recorded in the computer.

Material & Methods 55
offgas
MBR
permeate
master batch:
GW concentrate
potable
waterM
air
compressor
LRC
PR FR
QRORP,
DO
LRC
PR
storage
tank
Figure 4-2: Scheme of the 1000L reactor
Run Mode of the Reactor
Set-up B was operated at three different cycle time setting, but with a constant VER. The first
run was set to a cycle time of 12h (240 min for the anoxic phase and 480 min for the aerated
phase). Due to very long HRT, the cycle time was reduced by half to tc=6h (180 min for the
anoxic phase and 180 min for the aerated phase) during run II. After introducing a second
membrane module into the reactor, the cycle time was shortened further more in run III to
tc=4h, reducing the anoxic phase to 90 min and the aerated phase to 150 min. Still, the
permeate withdrawal was started shortly after the beginning of the aerated phase. The reason
was owned to the reachability of short HRT with membrane modules of low permeability.
The VER was held constant at 0.12 for all set-ups. The following run modes, illustrated in
Table 4-4, have been applied to set-up B.
Table 4-4: Run modes of set-up B: The 1000L BUSSE reactor
run mode HRT
[h]
anoxic phase
[min]
aerated phase
[min]
I 100 240 480
II 50 180 180
III 33 90 150
The solids retention time can be assumed to be greater than 360 days, because no biomass
was taken out, except for sampling of around 200 mL per week out of the biological reactor.
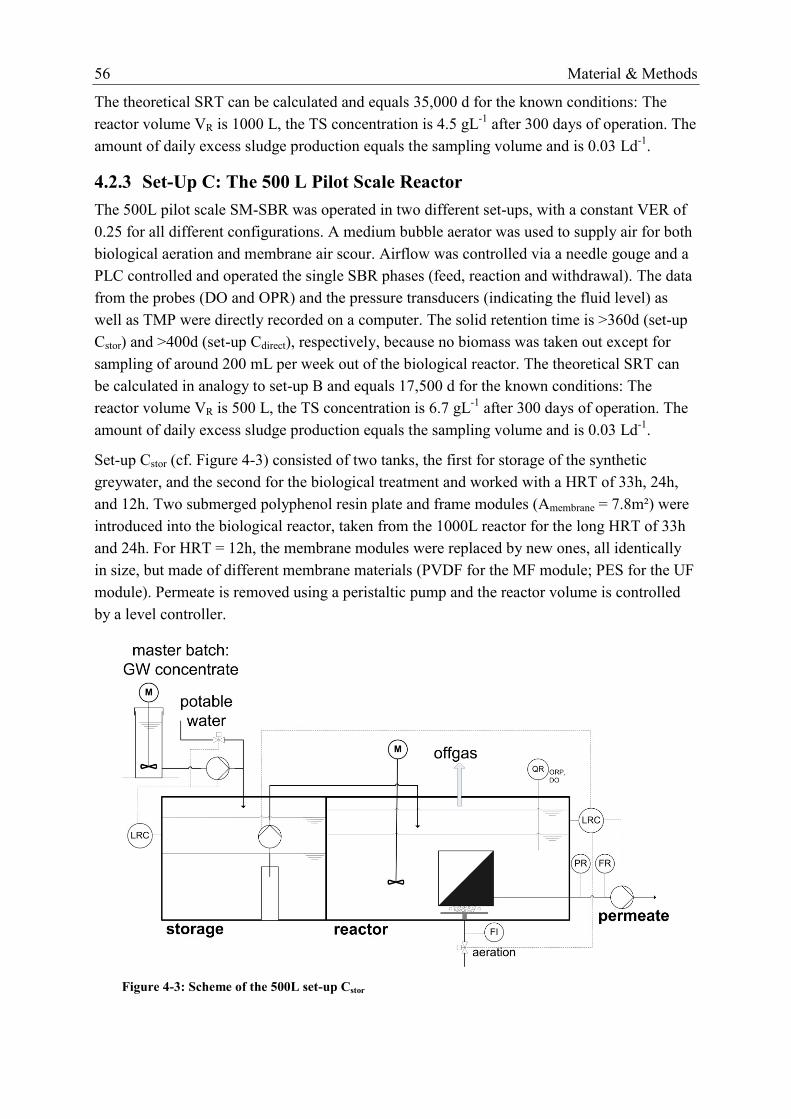
56 Material & Methods
The theoretical SRT can be calculated and equals 35,000 d for the known conditions: The
reactor volume VR is 1000 L, the TS concentration is 4.5 gL-1
after 300 days of operation. The
amount of daily excess sludge production equals the sampling volume and is 0.03 Ld-1
.
4.2.3 Set-Up C: The 500 L Pilot Scale Reactor
The 500L pilot scale SM-SBR was operated in two different set-ups, with a constant VER of
0.25 for all different configurations. A medium bubble aerator was used to supply air for both
biological aeration and membrane air scour. Airflow was controlled via a needle gouge and a
PLC controlled and operated the single SBR phases (feed, reaction and withdrawal). The data
from the probes (DO and OPR) and the pressure transducers (indicating the fluid level) as
well as TMP were directly recorded on a computer. The solid retention time is >360d (set-up
Cstor) and >400d (set-up Cdirect), respectively, because no biomass was taken out except for
sampling of around 200 mL per week out of the biological reactor. The theoretical SRT can
be calculated in analogy to set-up B and equals 17,500 d for the known conditions: The
reactor volume VR is 500 L, the TS concentration is 6.7 gL-1
after 300 days of operation. The
amount of daily excess sludge production equals the sampling volume and is 0.03 Ld-1
.
Set-up Cstor (cf. Figure 4-3) consisted of two tanks, the first for storage of the synthetic
greywater, and the second for the biological treatment and worked with a HRT of 33h, 24h,
and 12h. Two submerged polyphenol resin plate and frame modules (Amembrane = 7.8m²) were
introduced into the biological reactor, taken from the 1000L reactor for the long HRT of 33h
and 24h. For HRT = 12h, the membrane modules were replaced by new ones, all identically
in size, but made of different membrane materials (PVDF for the MF module; PES for the UF
module). Permeate is removed using a peristaltic pump and the reactor volume is controlled
by a level controller.
Figure 4-3: Scheme of the 500L set-up Cstor
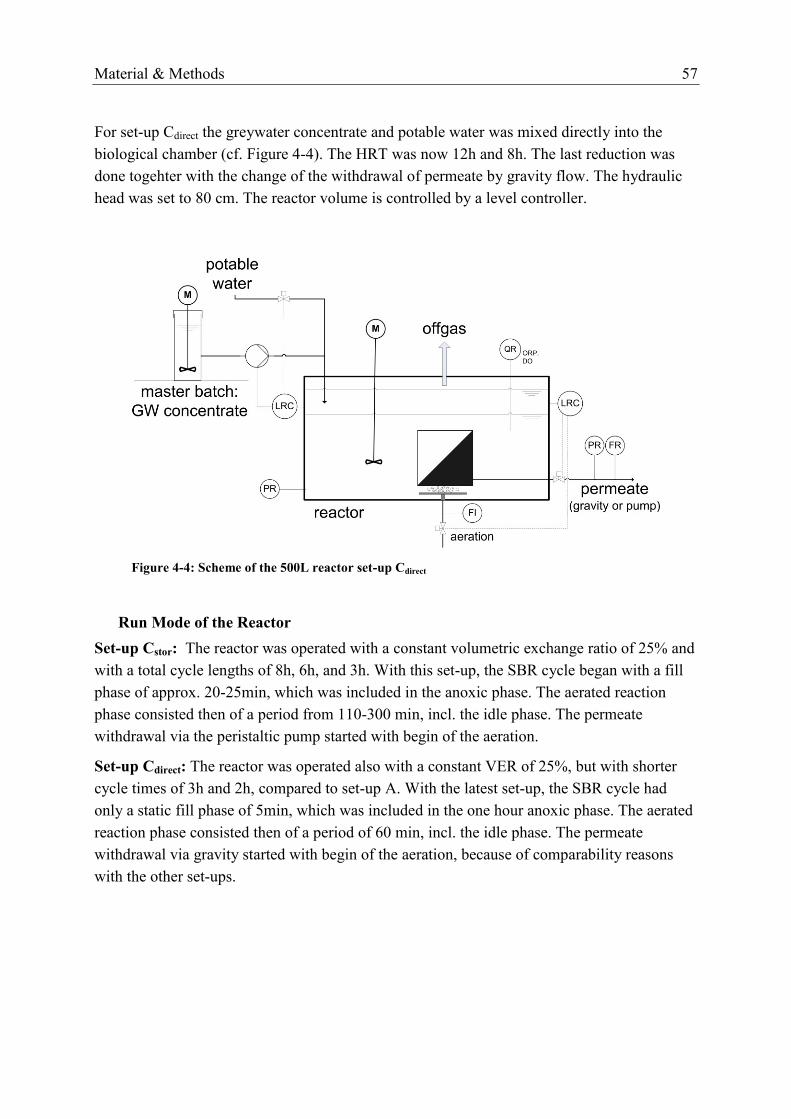
Material & Methods 57
For set-up Cdirect the greywater concentrate and potable water was mixed directly into the
biological chamber (cf. Figure 4-4). The HRT was now 12h and 8h. The last reduction was
done togehter with the change of the withdrawal of permeate by gravity flow. The hydraulic
head was set to 80 cm. The reactor volume is controlled by a level controller.
Figure 4-4: Scheme of the 500L reactor set-up Cdirect
Run Mode of the Reactor
Set-up Cstor: The reactor was operated with a constant volumetric exchange ratio of 25% and
with a total cycle lengths of 8h, 6h, and 3h. With this set-up, the SBR cycle began with a fill
phase of approx. 20-25min, which was included in the anoxic phase. The aerated reaction
phase consisted then of a period from 110-300 min, incl. the idle phase. The permeate
withdrawal via the peristaltic pump started with begin of the aeration.
Set-up Cdirect: The reactor was operated also with a constant VER of 25%, but with shorter
cycle times of 3h and 2h, compared to set-up A. With the latest set-up, the SBR cycle had
only a static fill phase of 5min, which was included in the one hour anoxic phase. The aerated
reaction phase consisted then of a period of 60 min, incl. the idle phase. The permeate
withdrawal via gravity started with begin of the aeration, because of comparability reasons
with the other set-ups.
58 Material & Methods
The following run modes, illustrated in Table 4-5, have been applied to set-up C.
Table 4-5: Run modes of set-up C: The 500L reactor
Set-up run mode HRT
[h]
anoxic phase
[min]
aerated phase
[min]
Cstor
I 33 180 300
II 24 150 210
III 12 70 110
Cdirect IV 12 60 120
V 8 60 60
4.3 Membrane Test Cell Applications
One of the major problems associated with membrane separation processes, which hinders the
widespread application of the process, is the reduction in permeability, commonly known as
‘membrane fouling’. For the design of a membrane process the characterisation of the
suspension is needed for prediction of required membrane area and optimal operating
conditions.
Therefore, filtration tests with a test cell were applied to investigate the fouling potential of
greywater sludge from the SM-SBR. In addition, nanofiltration (NF) membranes were tested
for the physical greywater treatment as an alternative to the membrane coupled biological
process. The obtained data were analysed and compared with the membrane behaviour in the
pilot plants, and with data from other test cell investigations undertaken with sludge from
different MBR processes in wastewater treatment.
Next to the test cell application, critical flux investigations have been performed within the
29L lab scale reactor. The method will be described next, before coming to the two test cell
assembles.
4.3.1 Critical Flux Determinations within the Lab Scale Reactor
In all tests permeate was returned to the top of the reactor to maintain practically a constant
head on the retentate side of the membrane, which means that changes in TMP were assumed
to be solely due to fouling. TMP was taken to equate to the difference between the average
hydraulic head at the mid-point of the membrane module and the permeate pressure. The
permeate flux was calculated by collecting a volume of filtrate over a defined time period and
was then repeated three times and an average calculated. The reactor was allowed a minimum
of 24h to recover between the tests.
Between each run, the small module was removed from the reactor, chemically cleaned and
tested with clean water to detect signs of permanent fouling prior to the next test. The
cleaning involved an initial 1h circulation with a pH adjusted 0.5% wt. sodium
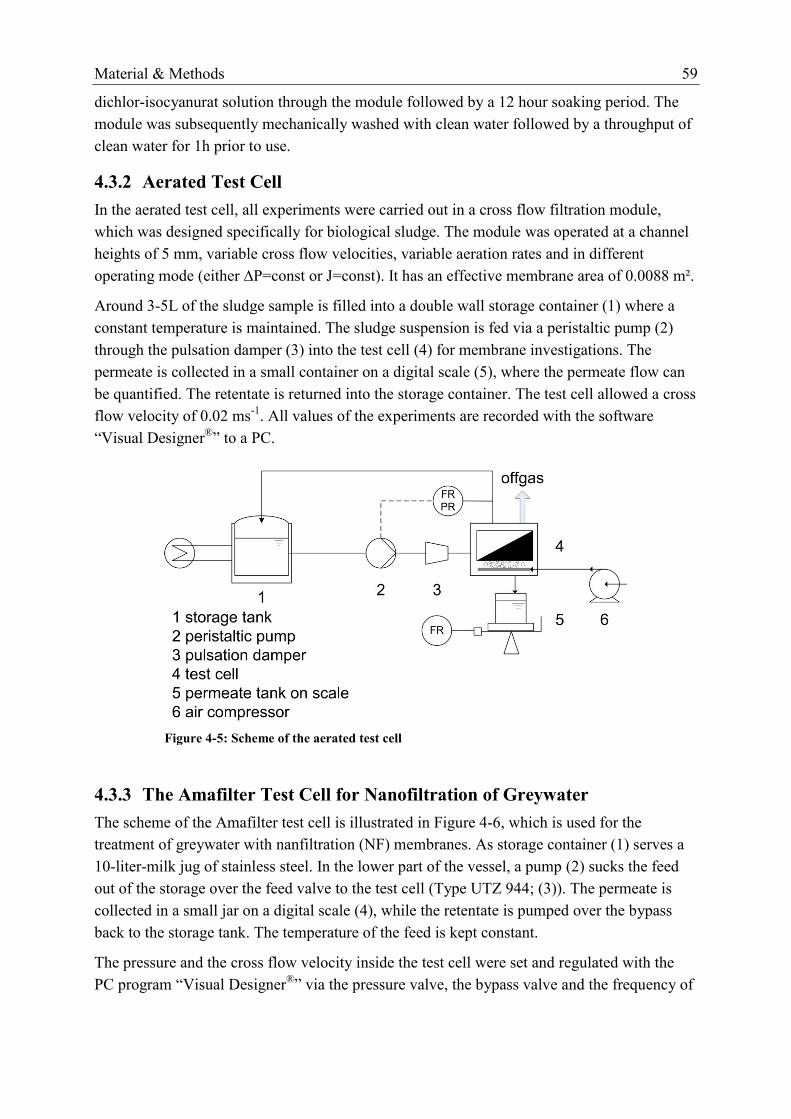
Material & Methods 59
dichlor-isocyanurat solution through the module followed by a 12 hour soaking period. The
module was subsequently mechanically washed with clean water followed by a throughput of
clean water for 1h prior to use.
4.3.2 Aerated Test Cell
In the aerated test cell, all experiments were carried out in a cross flow filtration module,
which was designed specifically for biological sludge. The module was operated at a channel
heights of 5 mm, variable cross flow velocities, variable aeration rates and in different
operating mode (either ∆P=const or J=const). It has an effective membrane area of 0.0088 m².
Around 3-5L of the sludge sample is filled into a double wall storage container (1) where a
constant temperature is maintained. The sludge suspension is fed via a peristaltic pump (2)
through the pulsation damper (3) into the test cell (4) for membrane investigations. The
permeate is collected in a small container on a digital scale (5), where the permeate flow can
be quantified. The retentate is returned into the storage container. The test cell allowed a cross
flow velocity of 0.02 ms-1
. All values of the experiments are recorded with the software
“Visual Designer®
” to a PC.
Figure 4-5: Scheme of the aerated test cell
4.3.3 The Amafilter Test Cell for Nanofiltration of Greywater
The scheme of the Amafilter test cell is illustrated in Figure 4-6, which is used for the
treatment of greywater with nanfiltration (NF) membranes. As storage container (1) serves a
10-liter-milk jug of stainless steel. In the lower part of the vessel, a pump (2) sucks the feed
out of the storage over the feed valve to the test cell (Type UTZ 944; (3)). The permeate is
collected in a small jar on a digital scale (4), while the retentate is pumped over the bypass
back to the storage tank. The temperature of the feed is kept constant.
The pressure and the cross flow velocity inside the test cell were set and regulated with the
PC program “Visual Designer®
” via the pressure valve, the bypass valve and the frequency of
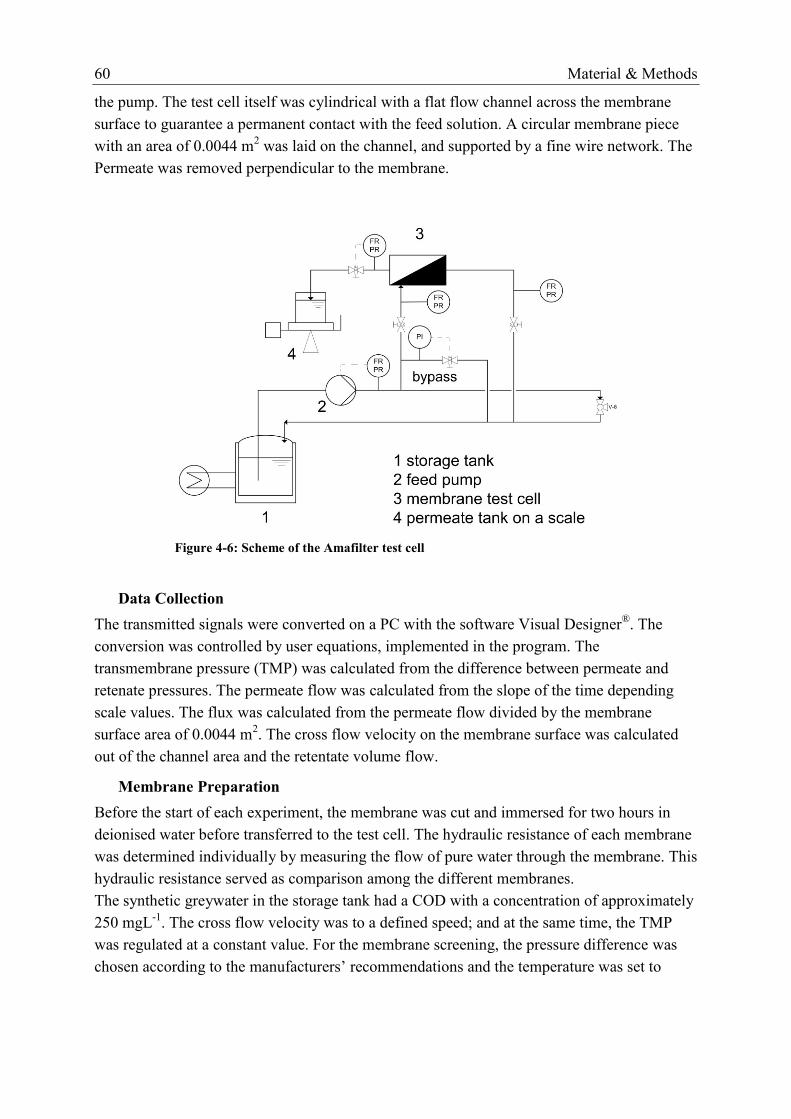
60 Material & Methods
the pump. The test cell itself was cylindrical with a flat flow channel across the membrane
surface to guarantee a permanent contact with the feed solution. A circular membrane piece
with an area of 0.0044 m2 was laid on the channel, and supported by a fine wire network. The
Permeate was removed perpendicular to the membrane.
Figure 4-6: Scheme of the Amafilter test cell
Data Collection
The transmitted signals were converted on a PC with the software Visual Designer®. The
conversion was controlled by user equations, implemented in the program. The
transmembrane pressure (TMP) was calculated from the difference between permeate and
retenate pressures. The permeate flow was calculated from the slope of the time depending
scale values. The flux was calculated from the permeate flow divided by the membrane
surface area of 0.0044 m2. The cross flow velocity on the membrane surface was calculated
out of the channel area and the retentate volume flow.
Membrane Preparation
Before the start of each experiment, the membrane was cut and immersed for two hours in
deionised water before transferred to the test cell. The hydraulic resistance of each membrane
was determined individually by measuring the flow of pure water through the membrane. This
hydraulic resistance served as comparison among the different membranes.
The synthetic greywater in the storage tank had a COD with a concentration of approximately
250 mgL-1
. The cross flow velocity was to a defined speed; and at the same time, the TMP
was regulated at a constant value. For the membrane screening, the pressure difference was
chosen according to the manufacturers’ recommendations and the temperature was set to
Material & Methods 61
25°C. The trials started 10min after the desired temperature was reached.
24h batch experiments were carried out to judge the separation capacity in terms of COD of
the tested membranes, in which the greywater circulated in the system; both permeate and
retentate where returned into the storage tank. Every five seconds TMP, permeate flow,
temperature and the cross flow velocity were recorded. Every two hours for the first 8h a
sample of 20mL from permeate and feed was taken, as well as after 22h at the end of each
experiment, to investigate a time dependency.
Influence of Operational Parameters
For the interpretation of membrane systems the separation characteristic for the specific
membrane wastewater is of significant importance. Therefore, the effects of various operating
parameters have been investigated in the Amafilter test cell.
At the beginning of the experiments, the water flow was measured for 30min together with
the later used TMP, which ranged from 5 to 25bar. The influence of the feed concentration on
the membrane behaviour was determined by changing the concentration by the factor of
2 and 4. By increasing the concentration in the feed concentrate, only ammonia is held at the
same low value as used in the screening test to see the effect of monovalent ions on the NF
membrane. The concentrate was stored at 4°C to produce freshly 10L feed solutions for the
test cell investigations. The experiments were at a constant temperature (25°C or 35°C) and at
a constant cross flow velocity of 2 ms-1
. The sampling started after one hour of establishing
constant operating conditions to measure the following parameter: BOD5, COD, TN and
NH4.
Cleaning
After each test, the Amafilter test cell apparatus was cleaned for 2 hours with distilled water.
Once a week, a 0.2% citric acid was used for maintenance cleaning, and afterwards rinsed
again with distilled water until the retentate was neutral again.
The membranes were rinsed for the first 30min with deionised water at 25°C, before cleaning
with a 0.1% P3 Ultrasil 60A solution at 35°C. Finally, a 30min rinse with deionised water at
25°C was carried out to close the cleaning procedure.
4.4 Batch Tests for Determination of Biokinetic Parameters
Batch tests are used in order to determinate kinetic parameters of microbial activity like
oxygen uptake rate (OUR), denitrification or nitrate-nitrogen utilisation rate (NUR),
nitrification or ammonia utilisation rate (AUR), phosphate release rate (PRR), and phosphate
uptake rate (PUR). These tests are also valuable instruments for characterisation of substrates
in wastewater and of biomass in wastewater treatment plants. Furthermore it is useful to
characterise these paramters on different days, because biomass behaves as a dynamic system
that varies with time. In this work only the first three parameters were calculated, because the

62 Material & Methods
design of the different MBR treating greywater did not incorporate biological phosphorous
removal.
In literature, several different methods are established for the determination of kinetic
parameters as well as for the COD fractioning of the feed. Most common is the use of
respirometry as a tool to measure the activity of microorganism via the usage of DO over
time. The advantage of this method is its robustness and its sensitivity. The results of these
investigations find their response in dynamic modelling of the activated sludge process, e.g.
ASM 1 (Henze et al., 1987), since the kinetic and stoichiometric relationship for COD
removal and bioactivity acts on mass balances, which is affected by (Vanrolleghem et al.,
1999):
process rates, depending on kinetic, stoichiometry, and concentration of involved
components, such as soluble carbon sources, ammonia, etc.
transport terms of nutients, depending on concentrations.
The methods in Table 4-6 have been identified to fit best to achieve the goals set in this study.
Table 4-6: Used methods for the determination of kinetic parameters
method purpose estimation
of:
information
needed:
Ekama et al.,
(1986)
determination of the COD fraction Xs in the
influent
experimental method for µmax of heterotrophic
bacteria
XS, kh, KX,
µmax
XH, YH
Kappeler and
Gujer, (1992)
simple method to estimate kinetic parameters
of heterotrophic biomass
determination of COD wastewater fractions
also usable for the determination of kinetic
parameters of nitrifying bacteria
XS, XH,
µmax, KS, kH
YH, kd
Sollfrank and
Gujer, (1991)
stoichiometric parameters necessary for the
description of heterotrophic growth and
hydrolysis of slowly biodegradable organic
matter
YH SI
Spanjers and
Vanrolleghem,
(1995)
respirometric measurements at low substrate
concentrations for estimation of biokinetic
parameters for autotrophic and heterotrophic
microorganism
simultaneous assessment of decay coefficient
XS, SNH, YA,
µmax,H,
µmax,A, KS,
bH, bA
XH, YH
Sludge from the SM-SBR (in most cases from set-up C, except for some AUR and NUR
measurements with set-up B) and synthetic greywater are introduced into a vessel of 3L and
1L at different F/M ratios to carry out the respirometry batch tests for the determination of the
OUR. The sample volume was set to 5 mL in order to constant operational conditions during
one batch run. The measuring system, as illustrated in Figure 4-7, is adapted from Kappeler
and Gujer, (1992) and consists of a closed batch reactor with a volume of either three or one

Material & Methods 63
litre. The biomass respiration rate is assumed to be independent of oxygen input over the
liquid surface. The temperature is set to 20°C by a thermostatic water bath, stirring is
maintained between 170 and 200 rpm, and the aeration device provides compressed air. The
DO sensor is connected with a transmitter to a data registration system and maintained
between 4 and 6 mgDOL-1
.
Figure 4-7: OUR batch assembly
Although one run with addition of ammonium chloride did not reveal any activity of the
nitrifying bacteria, allylthiourea (ATU) was added to inhibit autotrophic organism, e.g.
nitrifiers, activity at a dose of 2 mgL-1
, which was adequate for batch of less than 24 hours.
Several runs were undertaken with the addition of sodium acetate at different concentrations
as an easy biodegradable C-source for determination of a carbon balance and also for the
determination of µmax,H on a single C-source. In these runs, micro nutrients were added to
avoid nutrient limitation other than carbon.
Experiments in a 1L stirred vessel, in analogy to the OUR batch assembly, were undertaken to
determine the ammonium utilisation rate (AUR) and the nitrate-N utilisation rate (NUR) by
obtaining first aerobic conditions and then anoxic conditions. For some batch runs, acetate
was added as an easily degradable C-source to determine the NUR without substrate
limitations. The batch was filled with a sample and left idle for 20 minutes. During the run the
temperature was maintained at 20°C by a thermostatic water bath and stirred at low 130 rpm
all along the experiences. Each run contained two phases, the first started with 90 minutes
under aeration with a DO between 8 and 9 mgO2L-1
, and the second with N2-gas providing
anoxic condition with a DO below 0.3 mgO2L-1
. Samples were taken every 10 to 20 minutes
and filtered through a 0.2 µm cellulose acetate filter to be subsequently analysed using ion
chromatography.

64 Material & Methods
4.5 Analytics
4.5.1 Online Parameters
Dissolved Oxygen (DO) and Oxidation-Reduction Potential (ORP) were measured online via
calibrated probes (WTW Sentix 41 and Mettler Toledo P14805 respectively for the Lab scale
and the batch reactor, whereas WTW Ecoline Oxi 170 and Ecoline pH 170 respectively for
the other plants) and recorded directly onto the computer.
4.5.2 Physical Parameters
The electric conductivity (indicates indirectly the salt concentration in the reactor) was
measured with the Conductivity Meter LF 340 by WTW, whereas the pH was measured with
the pH-Meter 765 Calimatic. The turbidity of the permeate was analysed with the help of the
photometer SPECORD 200, by Carl Zeiss Technology, at a wave length of 520 nm, directly
after sampling.
The mean particle size was determined with a Mastersizer S (Malvern Instruments GmbH,
Herrenberg, Germany) with sample presentation unit, pump, stirrer and UV for a more
homogenous mixture of the sample. The 300RF lens was used, allowing the measurement of
particle sizes ranging from 0.05 – 900 µm.
4.5.3 Chemical Parameters
All samples were analysed directly after sampling, but if not possible for a maximum of 72h
stored at 4°C. Samples preparations were done by the filtration with a cellulose acetate filter
(pore size: 0.2 µm, Sartorius), before measuring NO2-N, NO3-N, NH4-N, PO4-P, according to
standardised methods from DIN (1996; 1999) with ion chromatography (DIONEX, DX-100
Ion Chromatograph). The samples for the COD and TN measurement were filtered with a
0.45 µm glass fibre filter by Sartorious, before they were analysed by Dr. Lange kits and
spectrophotometry (Dr. Lange, ISIS 9000 MDA Photometer). Later, NO3-N, NH3-N, PO4-P
was also measured with the usage of Dr. Lange kits.
4.5.4 Biomass Measurement
The biomass was determined as total volatile suspended solids. The sample was dried for 24 h
at 105°C, in order to obtain the total dried weight (TS), before the heating to 550°C for 2 h in
a muffle furnace scales the organic fraction of the sludge suspension.

Results & Discussion 65
5 Results and Discussion
The results from the investigations are presented and discussed in the following chapter. The
gained results and knowledge of the operation and maintenance of the different reactors are
used for comparison with the results from the real greywater treating MBRs located at the
Zer0-M partner institutes and with the data given in literature. The influence of different HRT
on carbon and nutrient degradation, sludge development and permeate quality is investigated
with detailed cycle analysis. The rate for degradation of nitrogen compounds in terms of
ammonium uptake rate (AUR) and nitrate nitrogen uptake rate (NUR) can be analysed
directly out of the SM-SBR operation and validated with batch experiments.
The question arising from the slow biomass growth, whether it was due to the used synthetic
feed or whether similar observations were made in greywater treatment with MBR, shall be
clarified. The batch experiments for further analysis of biokinetic parameters helped to solve
the questionable points and to understand better the characteristica of greywater sludge. These
obtained parameters were essential for the description of sludge properties. Furthermore, to
understand the treatment concept completely, the COD fractioning of the feed was necessary
to set the single fractions into relation with the biokinetic parameters. The incorporation into
valid mathematical models like the activated sludge model ASM 1 (Henze et al., 2000) were
meaningful for future design of MBR treating greywater.
Next to the evaluation of the biological parameters, it was also of great importance to analyse
the membrane behaviour. Therefore, critical flux investigations and determinations of fouling
tendencies were carried out. The first runs were done in the lab scale reactor; whereas later
experiments were done with the aerated test cell. The obtained results were set in contrast to
the online data from operation of the SM-SBR.
In some cases, e.g. treatment and reuse of water in cruise ships, a separation of surfactants and
other pollutants from the greywater via nanofiltration membranes may come into action.
Therefore first investigations with the Amafilter test cell were carried out. The results are
given in chapter 5.3.3.
5.1 Greywater Characteristics
Greywater (cf. Table 5-1) was characterised regarding the proportion of biodegradable COD
(expressed as the ratio BOD5/COD) and the nutrient fraction (expressed as the ratio
COD/NH4 N/PO4-P). In the literature the ratio BOD5/COD varied between 0.25 for greywater
(Jefferson et al., 1999) and 0.44 for domestic low strength wastewater (Metcalf and Eddy,
2003). The high concentrations of detergents in grey water are known to be slowly
biodegradable, explaining the difference to the low strength wastewater. The BOD5/COD
ratio of greywater has a value of 0.24 for the studies done with the SM-SBR. The average
ratio of COD/NH3/TP has been reported typically with 100/5/1 for domestic wastewater

66 Results & Discussion
(Metcalf and Eddy, 2003). Kargi and Uygur (2003) calculated an optimum COD/NH3/PO4-P
for a maximum nutrient removal in the activated sludge process for synthetic wastewater with
a five-step SBR of 145/5.87/1, whereas Jefferson et al. (1999) measured a COD/NH3/TP ratio
up to 1030/2.7/1 for greywater, indicating a macro-nutrient limitation. The synthetic
greywater used in these investigations have a COD/NH3/PO4-P ratio of 121/5.69/1, which is
very close to the optimum ratio found by Kargi and Uygur. For the highly diluted greywater
from studies done with shower effluent from a sports club the ratio of COD/NH3/TP is
determined at 100/14/1.5, favourable for biological treatment with no limitation concerning
the macro nutrients (Merz et al., 2007).
Table 5-1: Greywater characteristics
average values ± standard deviation
own studies Merz et al.
(2007)
Masi et al.
(2007)
Jefferson et
al. (1999)
Nolde (1999)
pH 7.50.3 7.60.4
BOD5, mgL-1
5011 5913 10445 50-100*
COD, mgL-1
20980 10933 502 207115 100-200
TN, mgL-1
17.36.7 9.6 5-10
TKN, mgL-1
15.24.5 2.5 3.914.72
NH4-N, mgL-1
7.35.4 11.84.2 1.7
NO3-N, mgL-1
0.90.9 0.32
TP, mgL-1
1.60.53 6.6 3.673.88 0.2-0.6
PO4-P, mgL-1
0.741.6 1.00.4
BOD5/COD 0.24 0.54
COD/NH3/TP 121/5.7/1** 100/14/1.5 1030/2.7/1
Conductivity, µs cm-1
64567
Faecal Coliform,
100mL-1
1.4*105
1.1*105 10
-1 - 10
1
* measured as BOD7 **as COD/NH3/PO4-P
5.2 Experiences from Operation of the SM-SBR
The SM-SBR was operated in three different set-ups as described in chapter 4: Set-up A was
the 29L lab scale reactor, set-up B was the 1000L pilot scale reactor and set-up C was the
500L reactor. Each configuration was operated for at least a year. The usage of synthetic feed
allowed a better comparison of different operational conditions, e.g. change of VER or change
in cycle time/phases time. The results were compared among each other with the research
emphasis on the evolution of biomass. The trials were complemented with additional batch
investigations to gain knowledge of kinetic parameters such as µmax, OUR and other rates like
DNR etc. The goal of this study was to identify the feasibility and the design parameters of
the SM-SBR to treat greywater with the purpose of reuse (indoor or irrigation).
The membrane was mainly used as a tool, as the separation device and was not in the focus of
this study. Nevertheless, some test cell, critical flux, and permeability investigations were
conducted (cf. chapter 5.3).

Results & Discussion 67
5.2.1 Development of Biomass
The sludge contains mainly particles of a size between 10 and 100 µm as can be seen in
Figure 5-1. The half logarithmic illustration shows a curve, similar to a Gaussion distribution
between the particle sizes of 1 to 300 µm, meaning that the particles between 20 - 60 µm
should be the greatest fraction on a quantity basis. This is not the case. A look into Figure 5-2
indicates that 50% of the sludge particles are smaller than 30µm for the SM-SBR as well as
for the MBR with the high SRT of 140 d. The mean particle size distribution of the MBR
operated with the low SRT of 25 d has its maximum at the particle size of 65 µm.
The sludge with the higher volume fraction of small particles comes from set-up C and the
MBR feed with synthetic wastewater and a SRT of 140d. This may build a denser layer of
biomass on the membrane surface and therefore influence the permeability negatively. Under
the microscope the sludge of the SM-SBR in set-up C shows a dense floc structure, cf. Figure
5-3, mainly composed out of bacteria, as well as a few protozoa and metazoa (cf. Figure 5-4).
0
2
4
6
8
10
12
0,1 1 10 100 1000
particle size [µm]
vo
lum
e f
rac
tio
n [
%]
SM-SBR; set-up C
MBR with post Denitrification; synth. WW; SRT = 25d
MBR; synth. WW; SRT = 140d
Figure 5-1: Particle size distribution of greywater sludge as volume fraction

68 Results & Discussion
0
20
40
60
80
100
0,1 1 10 100 1000
particle size [µm]
tota
l v
olu
me
[%
]
SM-SBR; set-up C
MBR (post Denitrific); synth. WW; SRT = 25d
MBR; synth. WW; SRT = 140d
Figure 5-2: Total volume of the particle size distribution of greywater sludge
Figure 5-3: GW sludge under the microscope
Figure 5-4: Rotaria in GW sludge
The quantification of biomass can be carried out by measuring the suspended solids (MLSS)
concentration and the volatile suspended solids (MLVSS) concentration. Another possibility
is the measurement of total solids (TS), which includes the biomass, as well as other soluble
organic and inorganic compounds. The organic total solids (oTS) is calculated from the TS
minus the inorganic fraction, which remains in the cup after heating up to 550°C. The
inorganic fraction mainly composed out of salts and inert particles inserted by the feed leaves
the system either with the soluble phase during permeate withdrawal or adsorbs on the sludge.
The Figure 5-5 shows the evolution of biomass of all three set-ups. Set-up A shows the
highest fluctuations. This may be the result of the various changes in opearion (VER, HRT),
necessary for the determination of the critical flux of the small membrane module. Set-up B
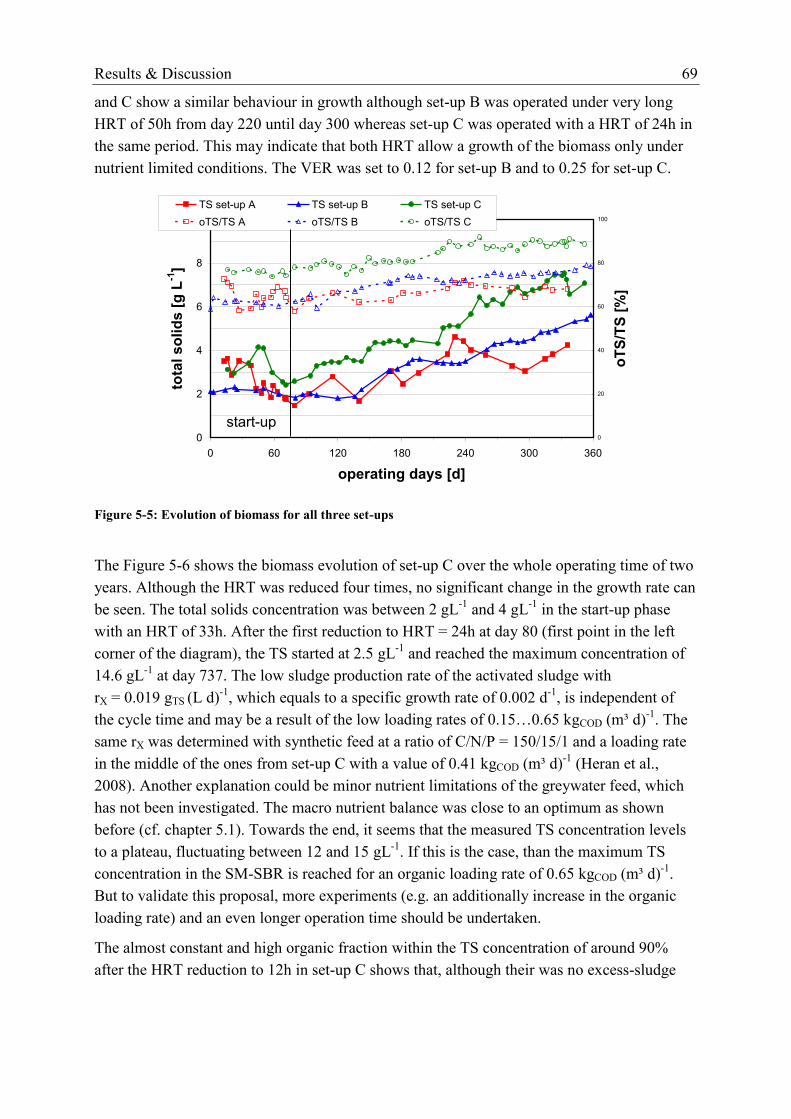
Results & Discussion 69
and C show a similar behaviour in growth although set-up B was operated under very long
HRT of 50h from day 220 until day 300 whereas set-up C was operated with a HRT of 24h in
the same period. This may indicate that both HRT allow a growth of the biomass only under
nutrient limited conditions. The VER was set to 0.12 for set-up B and to 0.25 for set-up C.
0
2
4
6
8
10
0 60 120 180 240 300 360
operating days [d]
tota
l s
olid
s [
g L
-1]
0
20
40
60
80
100
oT
S/T
S [
%]
TS set-up A TS set-up B TS set-up C
oTS/TS A oTS/TS B oTS/TS C
start-up
Figure 5-5: Evolution of biomass for all three set-ups
The Figure 5-6 shows the biomass evolution of set-up C over the whole operating time of two
years. Although the HRT was reduced four times, no significant change in the growth rate can
be seen. The total solids concentration was between 2 gL-1
and 4 gL-1
in the start-up phase
with an HRT of 33h. After the first reduction to HRT = 24h at day 80 (first point in the left
corner of the diagram), the TS started at 2.5 gL-1
and reached the maximum concentration of
14.6 gL-1
at day 737. The low sludge production rate of the activated sludge with
rX = 0.019 gTS (L d)-1
, which equals to a specific growth rate of 0.002 d-1
, is independent of
the cycle time and may be a result of the low loading rates of 0.15…0.65 kgCOD (m³ d)-1
. The
same rX was determined with synthetic feed at a ratio of C/N/P = 150/15/1 and a loading rate
in the middle of the ones from set-up C with a value of 0.41 kgCOD (m³ d)-1
(Heran et al.,
2008). Another explanation could be minor nutrient limitations of the greywater feed, which
has not been investigated. The macro nutrient balance was close to an optimum as shown
before (cf. chapter 5.1). Towards the end, it seems that the measured TS concentration levels
to a plateau, fluctuating between 12 and 15 gL-1
. If this is the case, than the maximum TS
concentration in the SM-SBR is reached for an organic loading rate of 0.65 kgCOD (m³ d)-1
.
But to validate this proposal, more experiments (e.g. an additionally increase in the organic
loading rate) and an even longer operation time should be undertaken.
The almost constant and high organic fraction within the TS concentration of around 90%
after the HRT reduction to 12h in set-up C shows that, although their was no excess-sludge

70 Results & Discussion
removal, no accumulation of inert anorganic substances occurred. Heran et al. (2008) reported
similar values with a VSS/TSS ratio in the range from 0.80 to 0.89, when the influent does not
contain particulate solids. Comparing these results with values for set-up C with the HRT of
24h and a low biomass concentration between 2.5 and 4.5 gL-1
, the organic fraction was only
around 70%, it can be said that the continuous reduction of cycle time and therefore of HRT
led to an improvement concerning the biomass structure in favour of a more abundant
fraction.
0
4
8
12
16
60 150 240 330 420 510 600 690 780
operating days [d]
tota
l so
lid
s [
g L
-1]
20
30
40
50
60
70
80
90
100
oT
S/T
S [
%]
TS [gL-1]
oTS/TS [%]
VER = 0.25
HRT = 24h
VER = 0.25
HRT = 8h
module cleanings
VER = 0.25
HRT = 12h
R2 = 0.9912
rx = 0.019 gTS(Ld)-1 sludge loss and fast
growth after problems in
operation combined with
2 intensive membrane
module cleanings
Figure 5-6: Biomass development over operation time, set-up C
The problems during the operation of the SM-SBR between day 530 and 560 occurred from
membrane failure. The membrane surface was ripped from its plate during the process of
cleaning and caused a leakage of sludge. After fixing the module, the biomass grew faster
compared too the period before. This was enhanced because the feed pump dosed more
concentrate into the reactor. With a normalisation of the process, biomass growth slowed
down and was within the same rate as before the membrane and feed pump failure.
The reductions of HRT during the operational period resulted in an increase of the organic
loading rate Lorg. The organic loading rate is defined as the amount of COD or BOD5 applied
per day to the micro-organism in the aerated tank. For the SM-SBR, the reactor was started
with a low value of 0.08 gCOD (Ld)-1
in set-up B with a HRT of 50 h and reached an average
Lorg of 0.65 gCOD (Ld)-1
during the shortest HRT of 8 h (cf. Table 5-2). The maximum organic
loading rate was at 1.09 gCOD (Ld)-1
due to a failure of the concentrate feeding pump, which
resulted in a higher feed concentration of 360mgL-1
. Writing the data into a diagram as
described in Figure 5-7 with data from literature (Stephenson et al., 2000) and data from other
investigation carried out at the Chair of Chemical Engineering, TU Berlin, a trend is visible.
A low Lorg enforced a low biomass concentration and a high Lorg resulted in a high biomass

Results & Discussion 71
concentration. Nevertheless, the specific Lorg of 0.07 0.03 d-1
remained more or less
unchanged for all configurations.
Table 5-2: Lorg [d-1
] for different HRT in GW treatment compared to municipal WW
reactor configuration Lorg [gCOD (L d)-1
]
set-up B, HRT = 50 h 0.008
set-up B, HRT = 33 h 0.16 0.02
set-up C, HRT = 24 h 0.32 0.16
set-up C, HRT = 12 h 0.50 0.25
set-up C, HRT = 8 h 0.65 0.26
GW - MBR, HRT = 13h (Merz et al., 2007) 0.19
WW - MBR (Vocks et al., 2005) 2.83
The very low contaminated greywater from shower effluent of a sports and leisure club which
was treated in a 3L lab scale MBR (Merz et al., 2007) lies in the bottom left corner, whereas
the municipal wastewater from a pressurised separation sewer in the outskirts of Berlin
(Vocks et al., 2005) is to be found in the upper right corner. In the middle of the imagined
diagonal are the values for the SM-SBR.
0
5
10
15
20
0,1 1 10
volumetric loading rate Lorg [gCOD (Ld)-1
]
slu
dg
e c
on
ce
ntr
ati
on
[g
TS L
-1]
municipal WW (Stephenson, 2000)
municipal WW, seperated sewer (170L MBR)
synthetic GW, HRT = 24 h
synthetic GW, HRT = 12 h set-up C (500L)
+ synthetic GW, HRT = 8 h
real GW (3L MBR)
}
Figure 5-7: Correlation of sludge concentration and volumetric organic loading rate Lorg
High loading rates induces a high concentration of total solids (sludge), whereas at low
loading rates a low sludge concentration can be expected. Now asking the question, if Lorg has
an influence not only at the total sludge concentration, but also at the sludge production the
answer is no. Figure 5-8 shows that no tendency of the different loading rates on the sludge
production is visible. The sludge production is between 0.05 kgTS(kgCOD)-1
and
0.5 kgTS(kgCOD)-1
for most measured points of set-up C with the corresponding range of Lorg
between 0.2 gCOD(Ld)-1
and 0.9 gCOD(Ld)-1
. The sludge production of the MBR treating
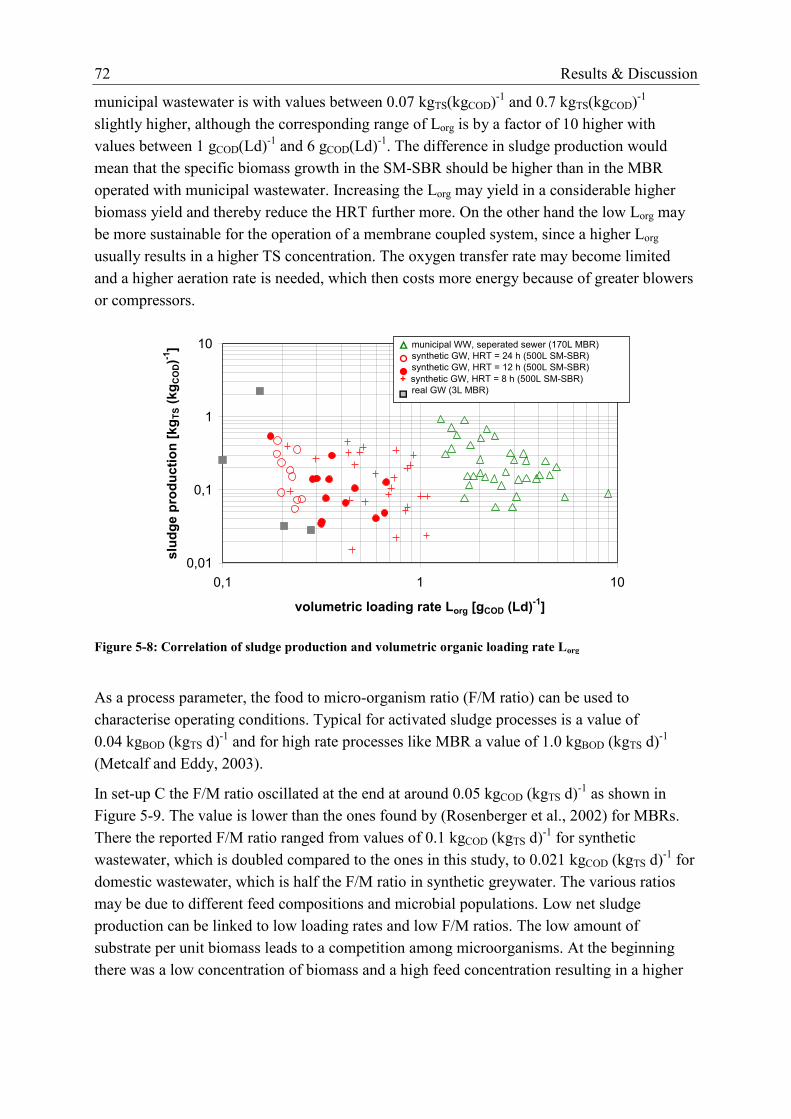
72 Results & Discussion
municipal wastewater is with values between 0.07 kgTS(kgCOD)-1
and 0.7 kgTS(kgCOD)-1
slightly higher, although the corresponding range of Lorg is by a factor of 10 higher with
values between 1 gCOD(Ld)-1
and 6 gCOD(Ld)-1
. The difference in sludge production would
mean that the specific biomass growth in the SM-SBR should be higher than in the MBR
operated with municipal wastewater. Increasing the Lorg may yield in a considerable higher
biomass yield and thereby reduce the HRT further more. On the other hand the low Lorg may
be more sustainable for the operation of a membrane coupled system, since a higher Lorg
usually results in a higher TS concentration. The oxygen transfer rate may become limited
and a higher aeration rate is needed, which then costs more energy because of greater blowers
or compressors.
0,01
0,1
1
10
0,1 1 10
volumetric loading rate Lorg [gCOD (Ld)-1
]
slu
dg
e p
rod
ucti
on
[kg
TS (
kg
CO
D)-1
] municipal WW, seperated sewer (170L MBR)
synthetic GW, HRT = 24 h (500L SM-SBR)
synthetic GW, HRT = 12 h (500L SM-SBR)
+ synthetic GW, HRT = 8 h (500L SM-SBR)
real GW (3L MBR)
Figure 5-8: Correlation of sludge production and volumetric organic loading rate Lorg
As a process parameter, the food to micro-organism ratio (F/M ratio) can be used to
characterise operating conditions. Typical for activated sludge processes is a value of
0.04 kgBOD (kgTS d)-1
and for high rate processes like MBR a value of 1.0 kgBOD (kgTS d)-1
(Metcalf and Eddy, 2003).
In set-up C the F/M ratio oscillated at the end at around 0.05 kgCOD (kgTS d)-1
as shown in
Figure 5-9. The value is lower than the ones found by (Rosenberger et al., 2002) for MBRs.
There the reported F/M ratio ranged from values of 0.1 kgCOD (kgTS d)-1
for synthetic
wastewater, which is doubled compared to the ones in this study, to 0.021 kgCOD (kgTS d)-1
for
domestic wastewater, which is half the F/M ratio in synthetic greywater. The various ratios
may be due to different feed compositions and microbial populations. Low net sludge
production can be linked to low loading rates and low F/M ratios. The low amount of
substrate per unit biomass leads to a competition among microorganisms. At the beginning
there was a low concentration of biomass and a high feed concentration resulting in a higher

Results & Discussion 73
F/M ratio. During the operation, the feed concentration was kept constant, but the TS
concentration grew. So, with no excess sludge removal, the feed concentration led to a
corresponding sludge concentration, which is specific for each wastewater.
0
0,2
0,4
0,6
0 60 120 180 240 300 360 420 480
time [d]
F/M
[kg
CO
D (
kg
TS d
)-1]
synthetic GW, HRT = 24 h (500L SM-SBR)
synthetic GW, HRT = 12 h (500L SM-SBR)
+ synthetic GW, HRT = 8 h (500L SM-SBR)
real GW (3L MBR)
Figure 5-9: Development of F/M ratio over time of GW sludge with no excess sludge removal
5.2.2 Cycle Analysis
For all set-ups, cycle analyses were carried out. Investigations of COD and nitrogen removal
within one cycle, combined with the online measurements of DO, ORP and flux of the
membrane module showed possible optimisation potentials in terms of time reduction for the
aerated and anoxic phase. A short HRT is desirable to build treatment plants with a low
footprint and to minimise their operational costs. Hu (2002) investigated the effect of different
HRT (between 0.25 to 3.85 h) on biological greywater treatment and found that the optimal
retention time in terms of COD, BOD5 and SS removal rates is 1.5 h. In this study, the
optimum cycle time, which correlates to the HRT, had to be determined while taken the
following parameters into account:
TS concentration in the reactor,
membrane permeability,
removal rates of COD, BOD5, nitrogen compounds, and
maintenance intervals for the application in remote areas.
The obtained profiles from the cycle analysis helped to identify the weak points of each
configuration as shown in Figure 5-10. The blue line of the left-hand graphic shows the
concentration of dissolved oxygen (DO) within the biological reactor. The dots represent the
flux through the membrane. It can be seen that the decline of DO during the anoxic phase is
very slow, while the uptake to saturation concentration is fast. The flux is measured with

74 Results & Discussion
8 L(m²h)-1
.
The sludge settled fast in the anoxic phase in set-up B, because the apparatus did not allow a
mixer to be integrated. This resulted in a poor oxygen uptake by the microorganisms during
this phase, since only over the interface water/sludge an oxygen mass transfer was possible.
Furthermore this led to the avoidance of denitrification (cf. Figure 5-10b). The nitrate-
nitrogen uptake rate (NUR) was only 0.38 mgNO3-N (goTS h)-1
, which lay in the middle of the
rates found by Kujawa and Klapwijk (cited in Kraume et al. (2005)) between 0.2 and 0.6
mgN (gMLVSS h)-1
for endogenous denitrification. The biomass was completely mixed only
during the aerated phase.
0
4
8
12
16
20
0 30 60 90 120 150 180 210 240
time [min]
Flu
x [
L(m
²h)-1
]
0
2
4
6
8
10
DO
[m
g L
-1]
Flux DOfeed & anoxic phase aerated phase
HRT = 33h
tc = 4h
VER = 0.12
a
0
2
4
6
8
10
12
0 30 60 90 120 150 180
time [min]
N-c
om
po
un
ds [
mg
L-1
]
NO2-N NH4-N
NO3-N TN
HRT = 33h
tc = 4h
VER = 0.12
org. loadin = ~151g COD(m³d)-1
b
Figure 5-10: Cycle of Set-up B; a: Online cycle measurement b: Cycle analysis of nitrogen compounds
Another example can be seen in the description of the cycle analysis of set-up C in Figure
5-11. It illustrates the results of one cycle for different HRT in terms of the parameters gained
from online measurements (Figure 5-11: a-d) and the evolution of the nitrogen compounds
(Figure 5-11: e-h). The cycle analyses indicate that the denitrification – nitrification process
works under all different HRT and still indicate a small optimisation potential in reduction of

Results & Discussion 75
the cycle time (tc) down to 90 min, meaning a further decrease of the HRT to 6 h. After 80
days the HRT in set-up C was reduced to 24 h and has been since reduced in consecutive
steps down to 8 h.
A complete denitrification was achieved mostly; only for an HRT of 33h complete
denitrification was not attained. This might be explained by the still remaining DO of up to
1 mgL-1
throughout the anoxic phase together with the long hunger period. The stirrer speed
of the mixer was too high and oxygen got over the water surface into the bulk of the liquid. In
Figure 5-11 b the oxygen curve shows that after nearly 60 min the biological activity
(degradation of ammonia) has ended, indicated by oxygen saturation. This is validated by the
corresponding nitrogen cycle analysis (cf. Figure 5-11 f). A similar evolution is recognisable
in Figure 5-11c, where the oxygen concentration starts to increase to saturation after 20 min.
But this observation is contradicted by the cycle analysis, which shows that only 45 min after
the beginning of aeration the nitrification process was finished (Figure 5-11g). With the
shortest HRT of 8h, 30 min aeration reveal a complete nitrification and 30 min of anoxic
condition a complete denitrification. Giving each phase 50% safety buffer time the total cycle
time could be reduced to 90 min. In order to achieve this modification more membrane area
should be introduced into the reactor. With an HRT = 8 h and gravity flow the flux equals to
25 Lm-2
h-1
for the UF-module and 35 Lm-2
h-1
for the MF-module. In studies on municipal and
domestic wastewater flux values for submerged membrane modules between 5 and 40 Lm-2
h-1
have been found (Stephenson et al., 2000).
5.2.3 Removal Efficiencies
The overall removal efficiencies for COD, TN and NH4-N for the different reactor
configurations are shown in Table 5-3, as well as the average feed and permeate
concentrations over the operation period. The samples have been taken 15 min after the
beginning of each cycle phase. It should be mentioned that the influence of time was
neglected during the sampling. The variation in feed concentrations can be explained on the
one hand with a first biodegradation of COD in the storage tank, and on the other hand by the
variation of pumping, due to the dead zones in the elbows of the short flexible hose in front of
and behind the peristaltic feed pump, the greywater concentrate directly into the reactor.
Table 5-3: Average concentrations ± standard derivation in feed and permeate and removal efficiencies
Feed
[mg L-1
]
Permeate
[mg L-1
]
Removal efficiency
set-up
A
set-up
B
set-up C
33h 24h 12h 8h
COD 203 ± 69 19.2 ± 6.1 0.73 0.89 0.91 0.91 0.91 0.91
TN 18.4 ± 6.7 5.8 ± 4.0 0.37 0.53 0.73 0.75 0.82 0.78
NH4-N 9.4 ± 6.1 0.38 ± 0.70 0.98 0.96 0.93 0.99 0.96 0.98
NO3-N 0.66 ± 0.78 4.0 ± 3.7 / / / / / /

76 Results & Discussion
0
2
4
6
8
10
0 60 120 180 240 300 360 420 480
time [min]
Flu
x [
L h
-1m
-2];
DO
[m
g L
-1]
35
40
45
50
55
60
flu
id level [c
m]
dissolved oxygen (DO)
flux
fluid level
feed & anoxic phase aerated phase
HRT = 33h
tc = 8h
a
0
2
4
6
8
10
12
0 60 120 180 240 300 360 420 480
time [min]
N-c
om
po
un
ds
[m
g L
-1]
NO2-N NH4-N
NO3-N TN
HRT = 33h
tc = 8h
org. loadin = ~145g COD(m³d)-1
e
0
2
4
6
8
10
0 60 120 180 240 300 360
time [min]
Flu
x [
L h
-1m
-2];
DO
[m
g L
-1]
35
40
45
50
55
60
flu
id level [c
m]
dissolved oxygen (DO)
flux
fluid level
feed & anoxic phase aerated phase
HRT = 24h
tc = 6h
b
0
2
4
6
8
0 60 120 180 240 300 360
time [min]
N-c
om
po
un
ds
[m
g L
-1]
NO2-N NH4-N
NO3-N TN
HRT = 24h
tc = 6h
org. loadin = ~215g COD(m³d)-1
f
0
2
4
6
8
10
0 30 60 90 120 150 180
time [min]
Flu
x [
L h
-1m
-2];
DO
[m
g L
-1]
35
40
45
50
55
60
flu
id level [c
m]
dissolved oxygen (DO)
flux
fluid level
feed & anoxic phase aerated phase
HRT = 12h
tc = 3h
c
0
2
4
6
8
0 30 60 90 120 150
time [min]
N-c
om
po
un
ds
[m
g L
-1]
NO2-N NH4-N
NO3-N TN
HRT = 12h
tc = 3h
org. loadin = ~430g COD(m³d)-1
g
0
10
20
30
40
50
60
70
80
0 30 60 90 120
time [min]
Flu
x [
L(m
²h)-1
]; F
luid
lev
el
[cm
]
0
1
2
3
4
5
6
7
8
DO
[m
g L
-1]
Flux MF Flux UF
fluid level DO
feed & anoxic phase aerated phase
HRT = 8h
tc = 2h
d
0
2
4
6
8
10
0 30 60 90 120
time [min]
N-c
om
po
un
ds
[m
g L
-1]
NO2-N NH4-N
NO3-N TN
HRT = 8h
tc = 2h
org. loadin = ~645g COD(m³d)-1
h
Figure 5-11: a-d: Online cycle measurement of set-up C; e-h: Cycle analysis of nitrogen compounds of set-up C
It is visible in Figure 5-12 that the poorest performance in COD and TN removal was
maintained by the 29 L lab scale reactor from set-up A. The various changes in HRT and
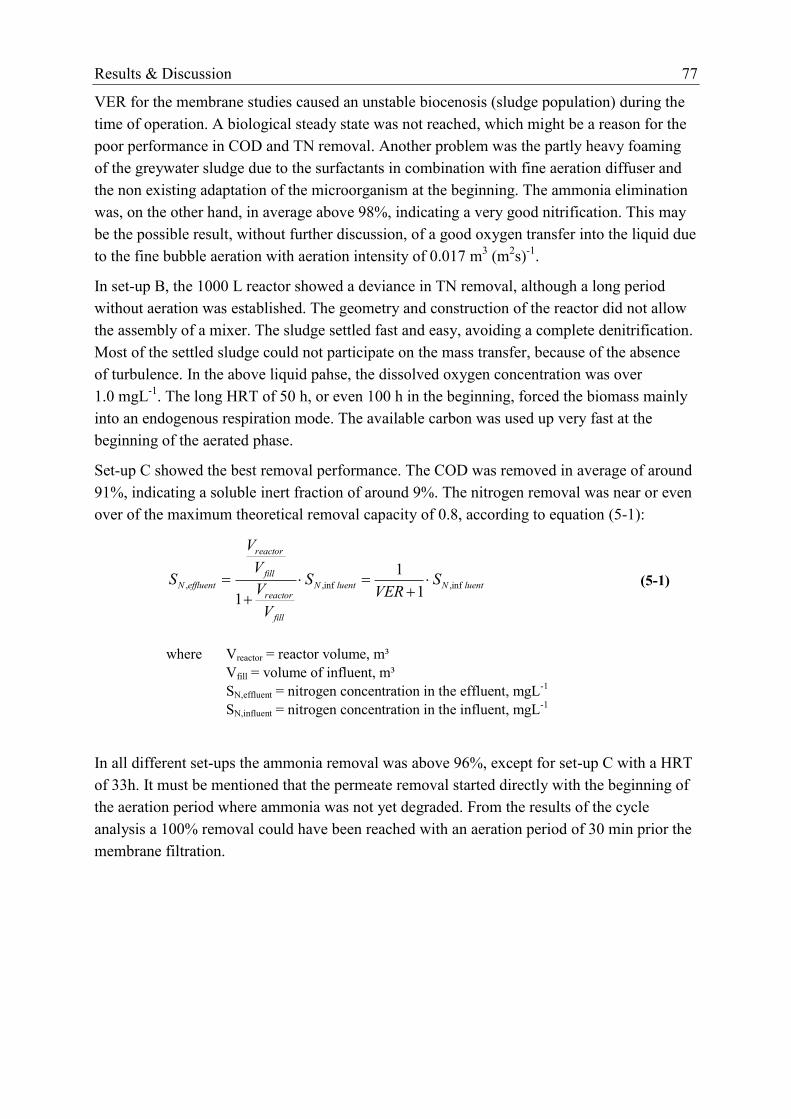
Results & Discussion 77
VER for the membrane studies caused an unstable biocenosis (sludge population) during the
time of operation. A biological steady state was not reached, which might be a reason for the
poor performance in COD and TN removal. Another problem was the partly heavy foaming
of the greywater sludge due to the surfactants in combination with fine aeration diffuser and
the non existing adaptation of the microorganism at the beginning. The ammonia elimination
was, on the other hand, in average above 98%, indicating a very good nitrification. This may
be the possible result, without further discussion, of a good oxygen transfer into the liquid due
to the fine bubble aeration with aeration intensity of 0.017 m3 (m
2s)
-1.
In set-up B, the 1000 L reactor showed a deviance in TN removal, although a long period
without aeration was established. The geometry and construction of the reactor did not allow
the assembly of a mixer. The sludge settled fast and easy, avoiding a complete denitrification.
Most of the settled sludge could not participate on the mass transfer, because of the absence
of turbulence. In the above liquid pahse, the dissolved oxygen concentration was over
1.0 mgL-1
. The long HRT of 50 h, or even 100 h in the beginning, forced the biomass mainly
into an endogenous respiration mode. The available carbon was used up very fast at the
beginning of the aerated phase.
Set-up C showed the best removal performance. The COD was removed in average of around
91%, indicating a soluble inert fraction of around 9%. The nitrogen removal was near or even
over of the maximum theoretical removal capacity of 0.8, according to equation (5-1):
luentNluentN
fill
reactor
fill
reactor
effluentN SVER
S
V
V
V
V
S inf,inf,,1
1
1
(5-1)
where Vreactor = reactor volume, m³
Vfill = volume of influent, m³
SN,effluent = nitrogen concentration in the effluent, mgL-1
SN,influent = nitrogen concentration in the influent, mgL-1
In all different set-ups the ammonia removal was above 96%, except for set-up C with a HRT
of 33h. It must be mentioned that the permeate removal started directly with the beginning of
the aeration period where ammonia was not yet degraded. From the results of the cycle
analysis a 100% removal could have been reached with an aeration period of 30 min prior the
membrane filtration.
78 Results & Discussion
0
20
40
60
80
100
COD TN NH4-N
Re
mo
va
l E
ffic
ien
cy [%
]
se
t-u
p B
HR
T =
33
h
HR
T =
24
h
HR
T =
12
h
HR
T =
8h
se
t-u
p A
se
t-u
p B
HR
T =
33
h
HR
T =
24
h
HR
T =
12
h
HR
T =
8h
se
t-u
p A
se
t-u
p B
HR
T =
33
h
HR
T =
24
h
HR
T =
12
h
HR
T =
8h
se
t-u
p A
Figure 5-12: Average removal efficiency and its min/max values for the different configurations
5.3 Membrane Performance
The membrane helps to reduce the cycle time since the operation becomes independent of
sludge settling ability and the withdrawal can start already during the reaction phase.
Nevertheless the reactor performance is next to a proper function of the biological degradation
of pollutants limited by the membrane permeability and stability. It is therefore indispensable
to secure a high grade of membrane functionality to receive a permeate of very good quality,
reusable in-house for toilet flushing or in agriculture, e.g. agriculture by enclosed cultivation
in greenhouses (Howell, 2004).
The widespread application of membrane technology in the municipal and industrial
wastewater treatment is limited due to the reduction in permeability, which is known as
‘membrane fouling’. The membrane has to be cleaned frequently to stay in economical
operation. Membrane fouling “occurs due to the following mechanisms: (1) adsorption of
solutes or colloids within/on membranes; (2) deposition of sludge flocs onto the membrane
surface; (3) formation of a cake layer on the membrane surface; (4) detachment of foulants
attributed mainly to shear forces; (5) the spatial and temporal changes of the foulant
composition during the long-term operation (e.g., the change of bacteria community and
biopolymer components in the cake layer). In other words, the membrane fouling can be
defined as the undesirable deposition and accumulation of microorganisms, colloids, solutes,
and cell debris within/on membranes” (Meng et al., 2009). A sustainable operation is possible
when operating the membrane below critical flux conditions (McAdam et al., 2005), which
depend on the transport of sludge over the membrane surface initiated by turbulence
generated through aeration as well as generated by the specific solute–membrane interactions,
affected by charge and hydrophobicity (Le-Clech et al., 2006). The theory of critical flux was
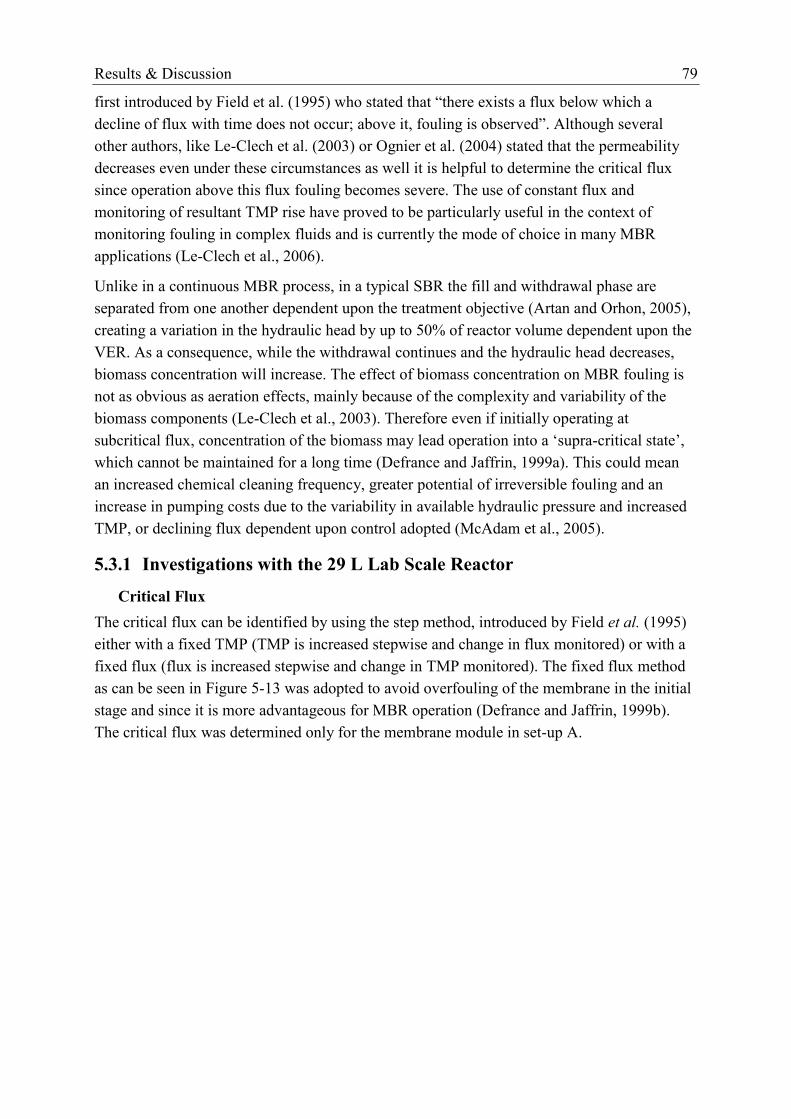
Results & Discussion 79
first introduced by Field et al. (1995) who stated that “there exists a flux below which a
decline of flux with time does not occur; above it, fouling is observed”. Although several
other authors, like Le-Clech et al. (2003) or Ognier et al. (2004) stated that the permeability
decreases even under these circumstances as well it is helpful to determine the critical flux
since operation above this flux fouling becomes severe. The use of constant flux and
monitoring of resultant TMP rise have proved to be particularly useful in the context of
monitoring fouling in complex fluids and is currently the mode of choice in many MBR
applications (Le-Clech et al., 2006).
Unlike in a continuous MBR process, in a typical SBR the fill and withdrawal phase are
separated from one another dependent upon the treatment objective (Artan and Orhon, 2005),
creating a variation in the hydraulic head by up to 50% of reactor volume dependent upon the
VER. As a consequence, while the withdrawal continues and the hydraulic head decreases,
biomass concentration will increase. The effect of biomass concentration on MBR fouling is
not as obvious as aeration effects, mainly because of the complexity and variability of the
biomass components (Le-Clech et al., 2003). Therefore even if initially operating at
subcritical flux, concentration of the biomass may lead operation into a ‘supra-critical state’,
which cannot be maintained for a long time (Defrance and Jaffrin, 1999a). This could mean
an increased chemical cleaning frequency, greater potential of irreversible fouling and an
increase in pumping costs due to the variability in available hydraulic pressure and increased
TMP, or declining flux dependent upon control adopted (McAdam et al., 2005).
5.3.1 Investigations with the 29 L Lab Scale Reactor
Critical Flux
The critical flux can be identified by using the step method, introduced by Field et al. (1995)
either with a fixed TMP (TMP is increased stepwise and change in flux monitored) or with a
fixed flux (flux is increased stepwise and change in TMP monitored). The fixed flux method
as can be seen in Figure 5-13 was adopted to avoid overfouling of the membrane in the initial
stage and since it is more advantageous for MBR operation (Defrance and Jaffrin, 1999b).
The critical flux was determined only for the membrane module in set-up A.
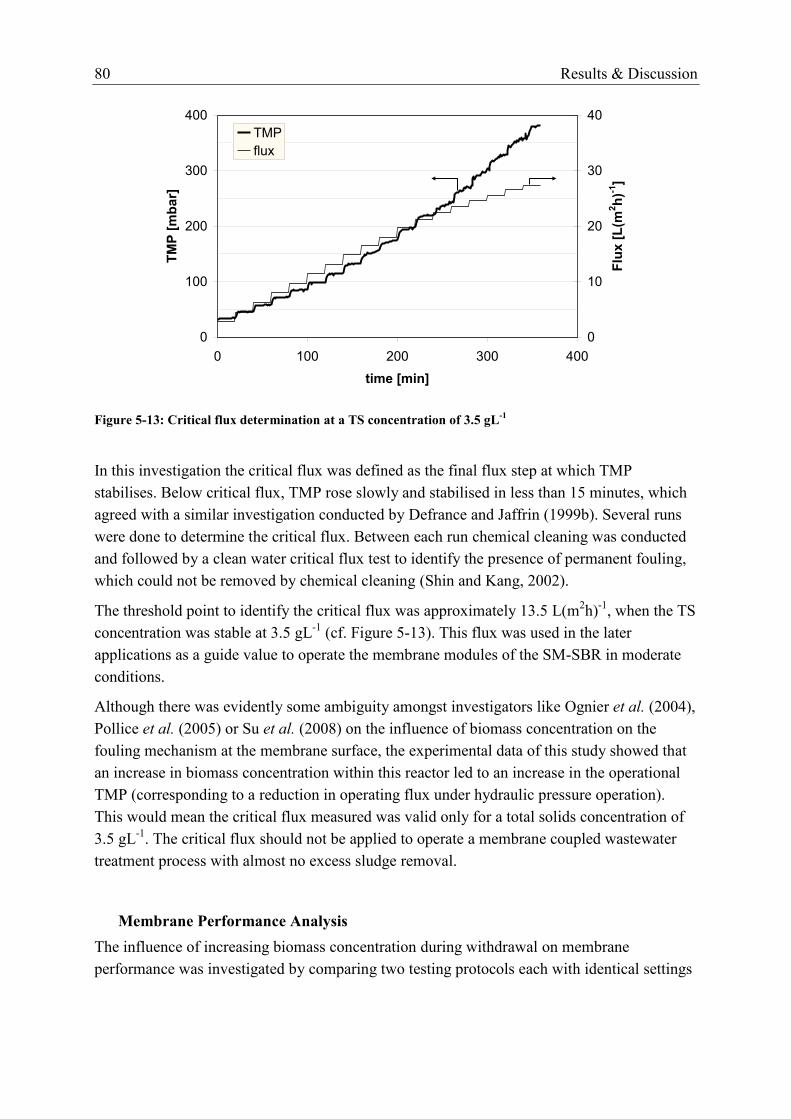
80 Results & Discussion
0
100
200
300
400
0 100 200 300 400
time [min]
TM
P [
mb
ar]
0
10
20
30
40
Flu
x [
L(m
2h
)-1]
TMP
flux
Figure 5-13: Critical flux determination at a TS concentration of 3.5 gL-1
In this investigation the critical flux was defined as the final flux step at which TMP
stabilises. Below critical flux, TMP rose slowly and stabilised in less than 15 minutes, which
agreed with a similar investigation conducted by Defrance and Jaffrin (1999b). Several runs
were done to determine the critical flux. Between each run chemical cleaning was conducted
and followed by a clean water critical flux test to identify the presence of permanent fouling,
which could not be removed by chemical cleaning (Shin and Kang, 2002).
The threshold point to identify the critical flux was approximately 13.5 L(m2h)
-1, when the TS
concentration was stable at 3.5 gL-1
(cf. Figure 5-13). This flux was used in the later
applications as a guide value to operate the membrane modules of the SM-SBR in moderate
conditions.
Although there was evidently some ambiguity amongst investigators like Ognier et al. (2004),
Pollice et al. (2005) or Su et al. (2008) on the influence of biomass concentration on the
fouling mechanism at the membrane surface, the experimental data of this study showed that
an increase in biomass concentration within this reactor led to an increase in the operational
TMP (corresponding to a reduction in operating flux under hydraulic pressure operation).
This would mean the critical flux measured was valid only for a total solids concentration of
3.5 gL-1
. The critical flux should not be applied to operate a membrane coupled wastewater
treatment process with almost no excess sludge removal.
Membrane Performance Analysis
The influence of increasing biomass concentration during withdrawal on membrane
performance was investigated by comparing two testing protocols each with identical settings

Results & Discussion 81
in cycle time of 4.5 h (anoxic: 90min, aerated: 180min), an HRT of 9 h, and a flux of
13.5 L(m2h)
-1 over a seven day operation period. The only difference was the fill and
withdrawal method as written in Table 5-4.
Table 5-4: Applied protocol for membrane performance analysis
protocol I ‘continuous head’ protocol II ‘falling head’
fill strategy replacing the withdrawn
permeate with fresh feed in the
reactor when a water level drop
of 0.03m occurred during the
aerated phase
instant fill at the beginning of
anoxic phase
withdrawal continuous intermittent
withdrawal during aerated
phase
endfluid
startfluid
h
h
,
,in the reactor ~ 0
0.5, leading to an increase of
biomass by the factor 2
The withdrawal with a permeate pump of the first cycle for the two protocols is given in
Figure 5-14. In both cases the TMP recovered to the recorded prior to the intermittent break
within the first few minutes of operation. In the case of continuous filtration TMP appeared to
stabilise after approximately 4 minutes until the following intermittent break, with only a
negligible increase throughout the withdrawal phase. In the case of the reducing hydraulic
head, once TMP has recovered, it continued to climb without a period of stabilisation. The
instability of the reducing hydraulic head system indicated that flux operation may be supra-
critical from the beginning of the cycle (Defrance and Jaffrin, 1999b). An approximate linear
TMP increase was observed with time. This may be directly attributed to the linear increase in
biomass concentration during permeate withdrawal.
0
50
100
150
0 30 60 90 120 150 180
Time [min]
TM
P [
mb
ar]
Cont. Head
Drop. Headset-up A with tc = 4.5 h
TS = 3.5 gL-1
Figure 5-14: Increase in TMP during 1st withdrawal in continuous and dropping head operating mode
82 Results & Discussion
Although the experiment started with a similar initial TMP of approximately 70 mbar the
slope differed strongly with the beginning of permeate withdrawal, because
of the supra-critical operation, which resulted from the reducing hydraulic head
operation and
of the conversely quasi-steady state operation, achieved under continuous hydraulic
conditions.
This tendency was evaluated with a long term investigation of several days (cf. Figure 5-15).
To simplify the long term data for the visualisation, only the final peak from each withdrawal
phase (=the last point of one cycle, before the new cycle starts again) was plotted in the
graphic. The break in the data of the reducing hydraulic head test between hour 42 and 88 is
due to a fault on the programmable logic controller (PLC) where the membrane underwent
complete aeration without permeate withdrawal. In order to complete the data set, operation
was allowed to continue further to ensure a minimum of seven days with usable operational
data from this point. Examination of the full data indicates a linear increase of TMP with time
as a consequence of progressive fouling and agrees with a trend observed by Tardieu et al.
(1998).
0
50
100
150
200
250
300
350
0 25 50 75 100 125 150 175 200 225 250
time [h]
TM
P [
mb
ar]
Cont. Head
Drop. Headset-up A with tc = 4.5 h
TS = 3.5 gL-1
fouling rate: 0.17 mbar h-1
fouling rate: 0.59 mbar h-1
Figure 5-15: Long term effect on TMP of the two different operating modes
It is generally recognised that fouling of the membrane is most critical at the start of the
filtration run, or when the change in pressure or flux is most rapid. Therefore by operating
with reducing hydraulic head conditions it is evident that fouling will continually occur
throughout each cycle. This development of fouling at the membrane surface is also thought
to lead to a greater risk of irreversible fouling. (Bacchin et al., 2006)
Results & Discussion 83
5.3.2 Membrane Module Performance in the SM-SBR
Many authors have reported the use of intermittent filtration in order to prolong the operation
period between chemical cleaning intervention (Drews et al., 2006; Judd, 2006; Psoch and
Schiewer, 2005; White and Lesecq, 1993). According to White and Lesecq (1993) the most
suitable intermittent operating mode for submerged MBRs is to maintain constant superficial
liquid velocity on the membrane surface and to vary applied flux or TMP, which can be done
by employing a cyclic on – off filtration mode . The technical handicap of membrane
filtration is the maintenance of a sufficiently high shear stress on the membrane surface in
order to erode the top layer of cake formed during permeate withdrawal. However, it has been
shown that cake formation cannot be reversed by lowering the TMP unless the fluid velocity
is high enough to reach the critical erosion stress for the particles in the cake (Kwon and
Vigneswaran, 1998). The recovery of flux with no increase of TMP after each relaxation
during the intermittent mode, as described exemplary in Figure 5-16, is similar to a study
undertaken by Defrance et al. (1999b), where the TMP rises rapid initially followed by a
gradually rising plateau. Partial cake breakage occurs when filtration stops and aeration
continues, but by restart of filtration the cake layer is reformed resulting in a slow pressure
increase.
The same behaviour was found during gravity operation as shown in Figure 5-16. The TMP
decreased during the aerated phase of one cycle. The withdrawal of permeate resulted in an
increasing biomass concentration, which was in addition responsible for the TMP rise.
Therefore the declining TMP under gravity flow in Figure 5-17 is the result of the dropping
water head of around 15 cm and the increase in TMP due to linear increase of sludge
concentration; hence visible is a reduction of TMP of less than 15 mbar. The horizontal TMP
devolution after the 110th
minute is because filtration has stopped. The SM-SBR is in the idle
phase.
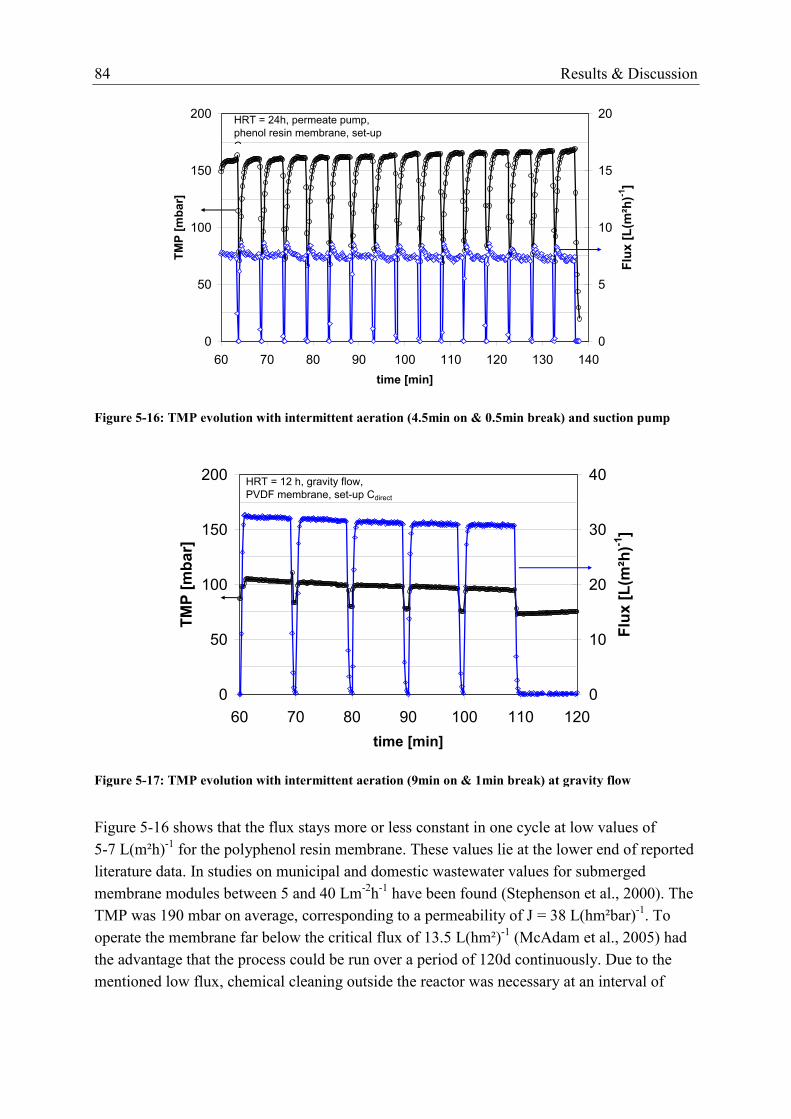
84 Results & Discussion
0
50
100
150
200
60 70 80 90 100 110 120 130 140
time [min]
TM
P [
mb
ar]
0
5
10
15
20
Flu
x [
L(m
²h)-1
]
HRT = 24h, permeate pump,
phenol resin membrane, set-up
Cstor
Figure 5-16: TMP evolution with intermittent aeration (4.5min on & 0.5min break) and suction pump
0
50
100
150
200
60 70 80 90 100 110 120
time [min]
TM
P [
mb
ar]
0
10
20
30
40
Flu
x [
L(m
²h)-1
]
HRT = 12 h, gravity flow,
PVDF membrane, set-up Cdirect
Figure 5-17: TMP evolution with intermittent aeration (9min on & 1min break) at gravity flow
Figure 5-16 shows that the flux stays more or less constant in one cycle at low values of
5-7 L(m²h)-1
for the polyphenol resin membrane. These values lie at the lower end of reported
literature data. In studies on municipal and domestic wastewater values for submerged
membrane modules between 5 and 40 Lm-2
h-1
have been found (Stephenson et al., 2000). The
TMP was 190 mbar on average, corresponding to a permeability of J = 38 L(hm²bar)-1
. To
operate the membrane far below the critical flux of 13.5 L(hm²)-1
(McAdam et al., 2005) had
the advantage that the process could be run over a period of 120d continuously. Due to the
mentioned low flux, chemical cleaning outside the reactor was necessary at an interval of
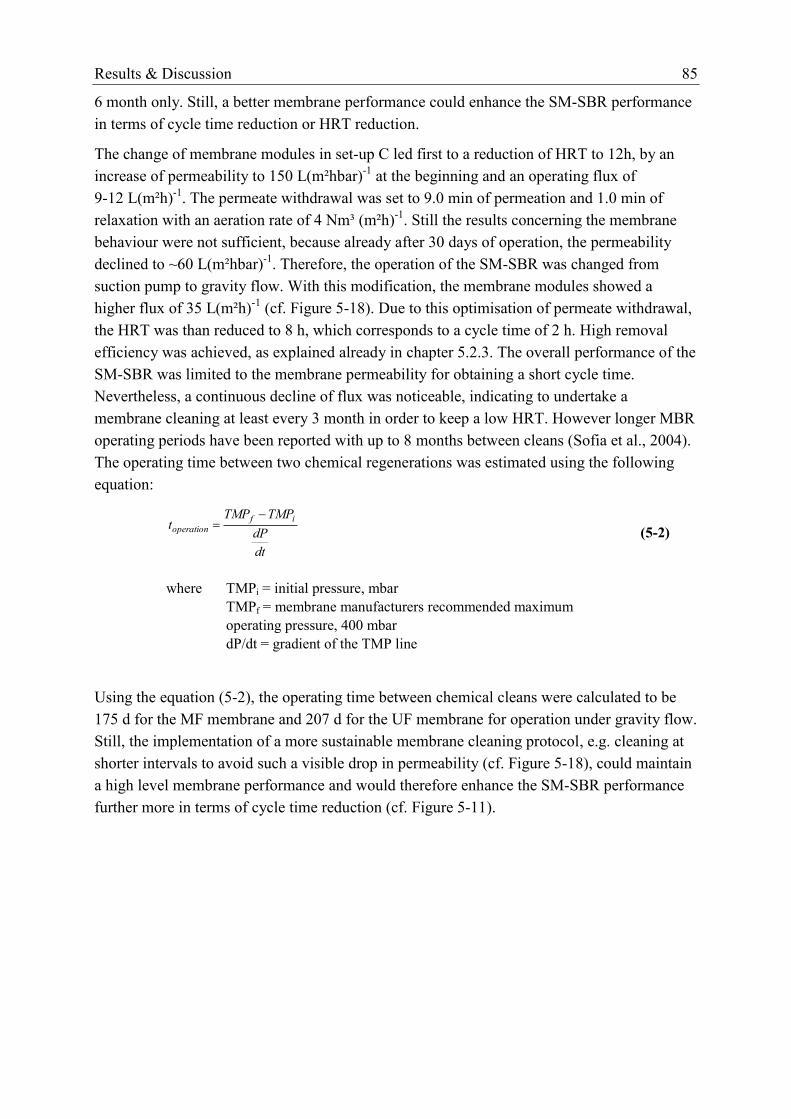
Results & Discussion 85
6 month only. Still, a better membrane performance could enhance the SM-SBR performance
in terms of cycle time reduction or HRT reduction.
The change of membrane modules in set-up C led first to a reduction of HRT to 12h, by an
increase of permeability to 150 L(m²hbar)-1
at the beginning and an operating flux of
9-12 L(m²h)-1
. The permeate withdrawal was set to 9.0 min of permeation and 1.0 min of
relaxation with an aeration rate of 4 Nm³ (m²h)-1
. Still the results concerning the membrane
behaviour were not sufficient, because already after 30 days of operation, the permeability
declined to ~60 L(m²hbar)-1
. Therefore, the operation of the SM-SBR was changed from
suction pump to gravity flow. With this modification, the membrane modules showed a
higher flux of 35 L(m²h)-1
(cf. Figure 5-18). Due to this optimisation of permeate withdrawal,
the HRT was than reduced to 8 h, which corresponds to a cycle time of 2 h. High removal
efficiency was achieved, as explained already in chapter 5.2.3. The overall performance of the
SM-SBR was limited to the membrane permeability for obtaining a short cycle time.
Nevertheless, a continuous decline of flux was noticeable, indicating to undertake a
membrane cleaning at least every 3 month in order to keep a low HRT. However longer MBR
operating periods have been reported with up to 8 months between cleans (Sofia et al., 2004).
The operating time between two chemical regenerations was estimated using the following
equation:
dt
dP
TMPTMPt
ifoperation
(5-2)
where TMPi = initial pressure, mbar
TMPf = membrane manufacturers recommended maximum
operating pressure, 400 mbar
dP/dt = gradient of the TMP line
Using the equation (5-2), the operating time between chemical cleans were calculated to be
175 d for the MF membrane and 207 d for the UF membrane for operation under gravity flow.
Still, the implementation of a more sustainable membrane cleaning protocol, e.g. cleaning at
shorter intervals to avoid such a visible drop in permeability (cf. Figure 5-18), could maintain
a high level membrane performance and would therefore enhance the SM-SBR performance
further more in terms of cycle time reduction (cf. Figure 5-11).
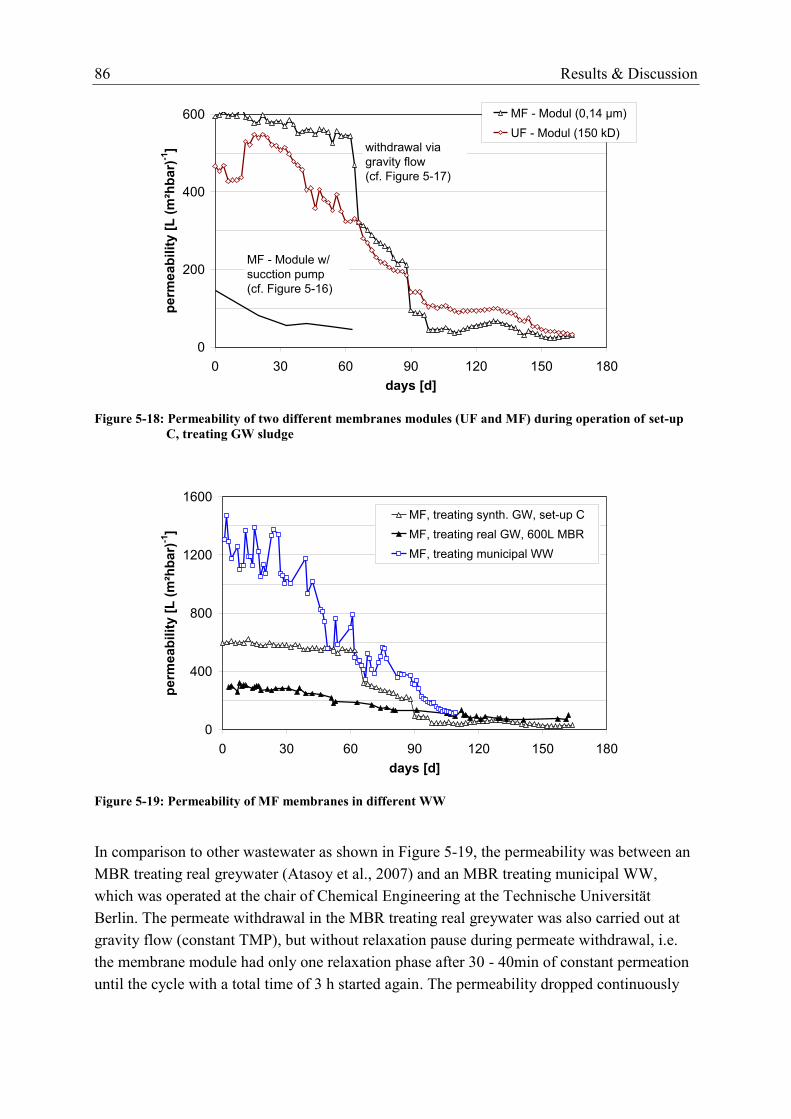
86 Results & Discussion
0
200
400
600
0 30 60 90 120 150 180
days [d]
perm
eab
ilit
y [
L (
m²h
bar)
-1]
MF - Modul (0,14 µm)
UF - Modul (150 kD)
MF - Module w/
sucction pump
(cf. Figure 5-16)
withdrawal via
gravity flow
(cf. Figure 5-17)
Figure 5-18: Permeability of two different membranes modules (UF and MF) during operation of set-up
C, treating GW sludge
0
400
800
1200
1600
0 30 60 90 120 150 180
days [d]
perm
eab
ilit
y [
L (
m²h
bar)
-1]
MF, treating synth. GW, set-up C
MF, treating real GW, 600L MBR
MF, treating municipal WW
Figure 5-19: Permeability of MF membranes in different WW
In comparison to other wastewater as shown in Figure 5-19, the permeability was between an
MBR treating real greywater (Atasoy et al., 2007) and an MBR treating municipal WW,
which was operated at the chair of Chemical Engineering at the Technische Universität
Berlin. The permeate withdrawal in the MBR treating real greywater was also carried out at
gravity flow (constant TMP), but without relaxation pause during permeate withdrawal, i.e.
the membrane module had only one relaxation phase after 30 - 40min of constant permeation
until the cycle with a total time of 3 h started again. The permeability dropped continuously
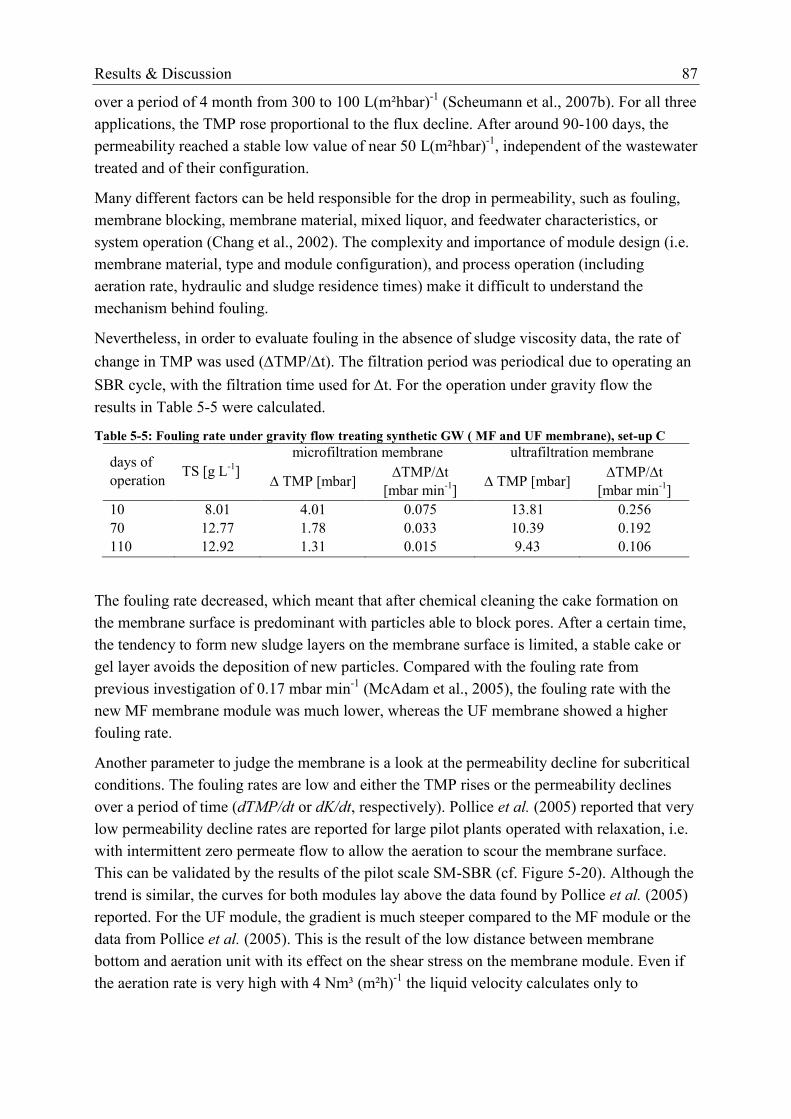
Results & Discussion 87
over a period of 4 month from 300 to 100 L(m²hbar)-1
(Scheumann et al., 2007b). For all three
applications, the TMP rose proportional to the flux decline. After around 90-100 days, the
permeability reached a stable low value of near 50 L(m²hbar)-1
, independent of the wastewater
treated and of their configuration.
Many different factors can be held responsible for the drop in permeability, such as fouling,
membrane blocking, membrane material, mixed liquor, and feedwater characteristics, or
system operation (Chang et al., 2002). The complexity and importance of module design (i.e.
membrane material, type and module configuration), and process operation (including
aeration rate, hydraulic and sludge residence times) make it difficult to understand the
mechanism behind fouling.
Nevertheless, in order to evaluate fouling in the absence of sludge viscosity data, the rate of
change in TMP was used (TMP/t). The filtration period was periodical due to operating an
SBR cycle, with the filtration time used for t. For the operation under gravity flow the
results in Table 5-5 were calculated.
Table 5-5: Fouling rate under gravity flow treating synthetic GW ( MF and UF membrane), set-up C
days of
operation TS [g L
-1]
microfiltration membrane ultrafiltration membrane
TMP [mbar] TMP/t
[mbar min-1
] TMP [mbar]
TMP/t
[mbar min-1
]
10 8.01 4.01 0.075 13.81 0.256
70 12.77 1.78 0.033 10.39 0.192
110 12.92 1.31 0.015 9.43 0.106
The fouling rate decreased, which meant that after chemical cleaning the cake formation on
the membrane surface is predominant with particles able to block pores. After a certain time,
the tendency to form new sludge layers on the membrane surface is limited, a stable cake or
gel layer avoids the deposition of new particles. Compared with the fouling rate from
previous investigation of 0.17 mbar min-1
(McAdam et al., 2005), the fouling rate with the
new MF membrane module was much lower, whereas the UF membrane showed a higher
fouling rate.
Another parameter to judge the membrane is a look at the permeability decline for subcritical
conditions. The fouling rates are low and either the TMP rises or the permeability declines
over a period of time (dTMP/dt or dK/dt, respectively). Pollice et al. (2005) reported that very
low permeability decline rates are reported for large pilot plants operated with relaxation, i.e.
with intermittent zero permeate flow to allow the aeration to scour the membrane surface.
This can be validated by the results of the pilot scale SM-SBR (cf. Figure 5-20). Although the
trend is similar, the curves for both modules lay above the data found by Pollice et al. (2005)
reported. For the UF module, the gradient is much steeper compared to the MF module or the
data from Pollice et al. (2005). This is the result of the low distance between membrane
bottom and aeration unit with its effect on the shear stress on the membrane module. Even if
the aeration rate is very high with 4 Nm³ (m²h)-1
the liquid velocity calculates only to
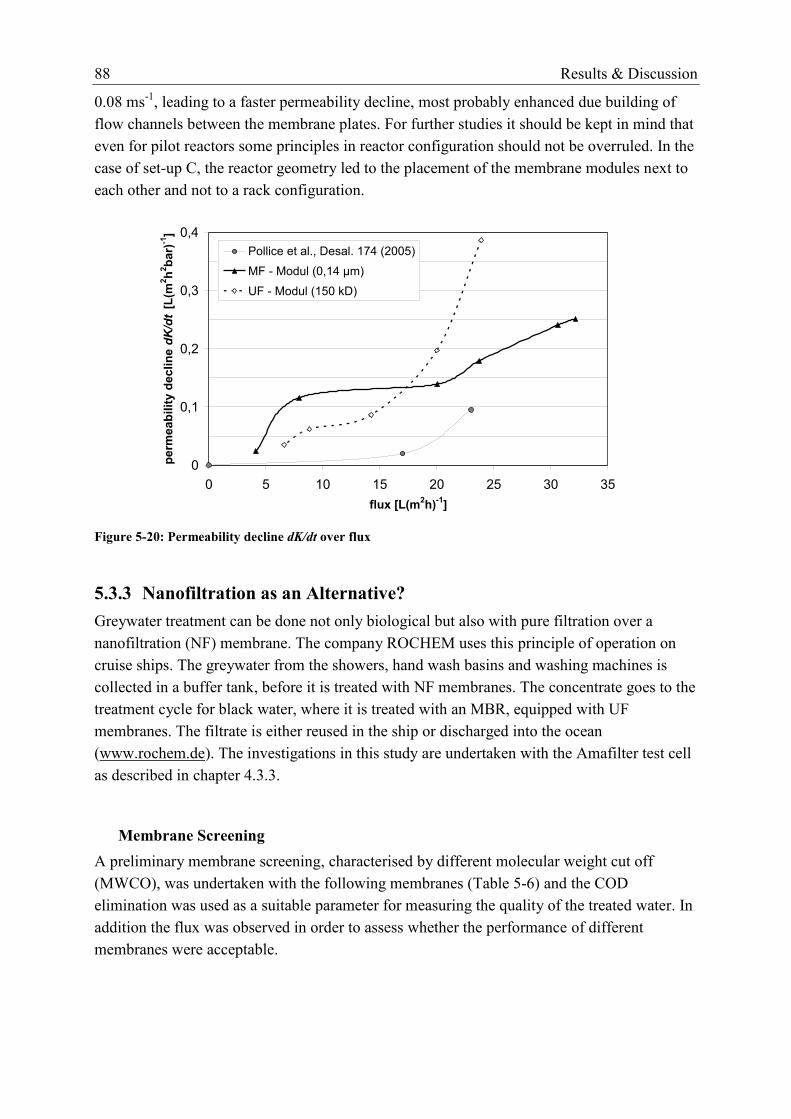
88 Results & Discussion
0.08 ms-1
, leading to a faster permeability decline, most probably enhanced due building of
flow channels between the membrane plates. For further studies it should be kept in mind that
even for pilot reactors some principles in reactor configuration should not be overruled. In the
case of set-up C, the reactor geometry led to the placement of the membrane modules next to
each other and not to a rack configuration.
0
0,1
0,2
0,3
0,4
0 5 10 15 20 25 30 35
flux [L(m2h)
-1]
pe
rme
ab
ilit
y d
ec
lin
e dK/dt [
L(m
2h
2b
ar)
-1]
Pollice et al., Desal. 174 (2005)
MF - Modul (0,14 µm)
UF - Modul (150 kD)
Figure 5-20: Permeability decline dK/dt over flux
5.3.3 Nanofiltration as an Alternative?
Greywater treatment can be done not only biological but also with pure filtration over a
nanofiltration (NF) membrane. The company ROCHEM uses this principle of operation on
cruise ships. The greywater from the showers, hand wash basins and washing machines is
collected in a buffer tank, before it is treated with NF membranes. The concentrate goes to the
treatment cycle for black water, where it is treated with an MBR, equipped with UF
membranes. The filtrate is either reused in the ship or discharged into the ocean
(www.rochem.de). The investigations in this study are undertaken with the Amafilter test cell
as described in chapter 4.3.3.
Membrane Screening
A preliminary membrane screening, characterised by different molecular weight cut off
(MWCO), was undertaken with the following membranes (Table 5-6) and the COD
elimination was used as a suitable parameter for measuring the quality of the treated water. In
addition the flux was observed in order to assess whether the performance of different
membranes were acceptable.

Results & Discussion 89
Table 5-6: Suitability test of different membrane materials for greywater treatment
membrane type material MWCO
[Da]
TMP
[bar]
temperature
25°C 35°C
COD concentration [mgL-1
]
0 250 450 900 0 450 900
Osmonics
Desal DK NF
polyamide
composite 150-300
5 X X X X X X
10 X X X X X X X
15 X X X X X X
20 X X X X X X
25 X X X X X X
Osmonics
Desal DL NF
polyamide
composite 150-300
5 X X X X X X
10 X X X X X X X
15 X X X X X X
20 X X X X X X
25 X X X X X X
Nadir
NF-PES-10 NF
permanent
hydrophilic
polyether
sulphone
>500 10 X X
Nadir P005F UF
permanent
hydrophilic
polyether
sulphone
5.000 3 X X
Nadir P020F UF
permanent
hydrophilic
polyether
sulphone
20.000 3 X X
Nadir P150F UF
permanent
hydrophilic
polyether
sulphone
150.000 0,7 X X
x = tested combination
The permeate quality and permeability of the tested membranes are illustrated in Figure 5-21.
It can be seen that with smaller MWCO the COD retention increases, while the permeability
decreases. The only exception comes from the Nadir P020F membrane with a MWCO of
20.000 Da compared to the Nadir P005F with a MWCO of 5.000 Da. The permeate quality of
Nadir P020F is better for higher feed COD than for the Nadir P005F membrane, but worse for
a low COD feed concentration (cf. Figure 5-22).

90 Results & Discussion
0,1
1
10
100
1000
1 10 100
permeate COD [mgL-1
]
pe
rme
ab
ilit
y [
L(m
2h
ba
r)-1
]
Osmonics DL
Osmonics DK
Nadir PES-10
Nadir P005
Nadir P020
Nadir P150
Figure 5-21: Membrane screening for GW filtration: permeability related to the permeate quality
The different behaviour of the two membranes can be explained by the adsorption of
surfactants in the pores of the membrane, as Jönsson (1991) describes for UF membranes, and
therefore, the MWCO gets smaller than 5000 Da during operation. It is assumed that the fine
pores of the membrane P005F are too small for the surfactants to penetrate into the membrane
pores, which results in a higher COD concentration of the permeate. The pore size of the
Nadir P150F is too big for the adsorption of surfactants and too big for a good COD retention.
The requested permeate quality with a COD concentration of less than 20 mgL-1
was given
for a CODfeed range between 100 and 300 mgL-1
only for the Osmonics DL and the Osmonics
DK membrane provided. The Nadir PES-10, P005 and P020 membranes achieved the COD
threshold only for a feed of low COD inlet concentration. Since it was reasonable to assume
that in a real system a concentration significantly higher than the feed concentrations for this
test, these membranes were excluded.
The differences of retention and permeability of the DL and DK membranes are likely to be
the result of the thinner layer of the DL membrane on top of the same polymer backbone for
both membranes. This resulted in a higher permeability but a lower COD retention of the DL
membrane. The other membranes showed essentially a significantly higher permeability, but
could not provide the desired permeate quality.
Based on an average COD retention of the two Osmonics membranes of more than 97% and a
COD concentration of ~5 mgL-1
in the permeate, it is expected that in a real plant design a
permeate recovery of 70-80% (as standard in RO application for desalination) could be
possible and hence the retentate concentration can be enhanced by a factor of 4-5, while the
produced permeate stays within the limit of 20 mgCODL-1
for reuse purposes. Hills et al.
(2001) reported that a combination of biological pre-treatment and membrane filtration with
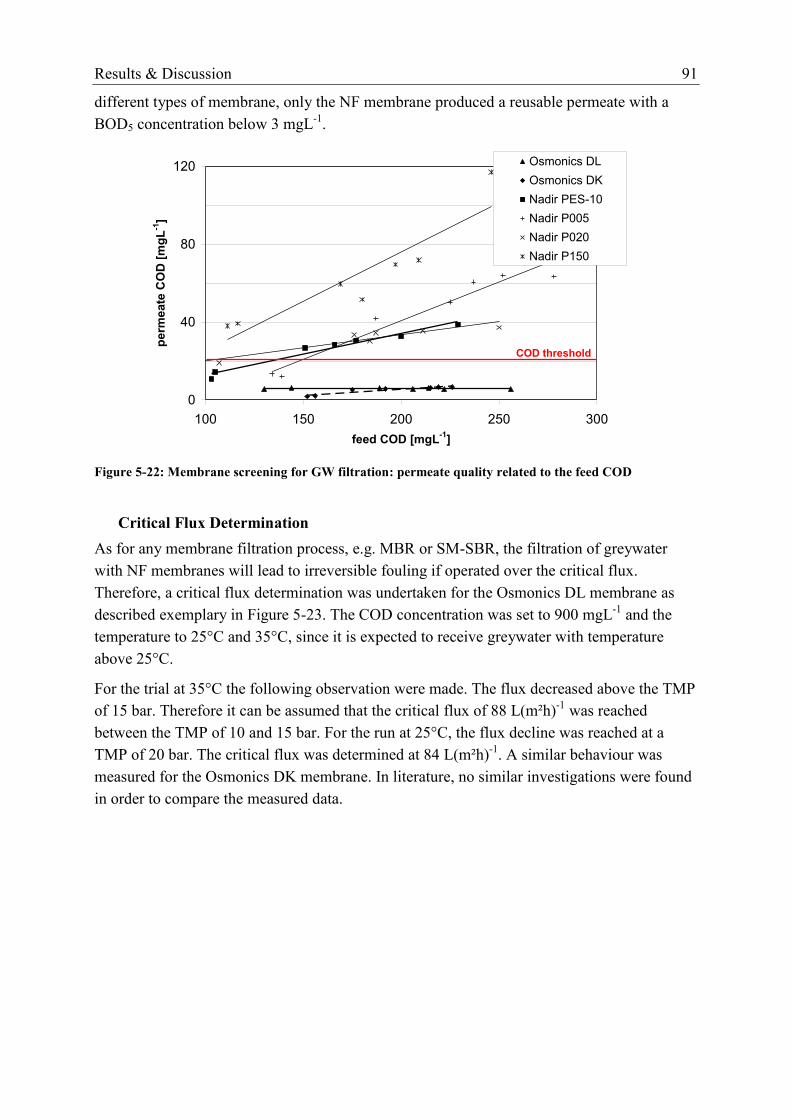
Results & Discussion 91
different types of membrane, only the NF membrane produced a reusable permeate with a
BOD5 concentration below 3 mgL-1
.
0
40
80
120
100 150 200 250 300
feed COD [mgL-1
]
pe
rme
ate
CO
D [
mg
L-1
]Osmonics DL
Osmonics DK
Nadir PES-10
Nadir P005
Nadir P020
Nadir P150
COD threshold
Figure 5-22: Membrane screening for GW filtration: permeate quality related to the feed COD
Critical Flux Determination
As for any membrane filtration process, e.g. MBR or SM-SBR, the filtration of greywater
with NF membranes will lead to irreversible fouling if operated over the critical flux.
Therefore, a critical flux determination was undertaken for the Osmonics DL membrane as
described exemplary in Figure 5-23. The COD concentration was set to 900 mgL-1
and the
temperature to 25°C and 35°C, since it is expected to receive greywater with temperature
above 25°C.
For the trial at 35°C the following observation were made. The flux decreased above the TMP
of 15 bar. Therefore it can be assumed that the critical flux of 88 L(m²h)-1
was reached
between the TMP of 10 and 15 bar. For the run at 25°C, the flux decline was reached at a
TMP of 20 bar. The critical flux was determined at 84 L(m²h)-1
. A similar behaviour was
measured for the Osmonics DK membrane. In literature, no similar investigations were found
in order to compare the measured data.
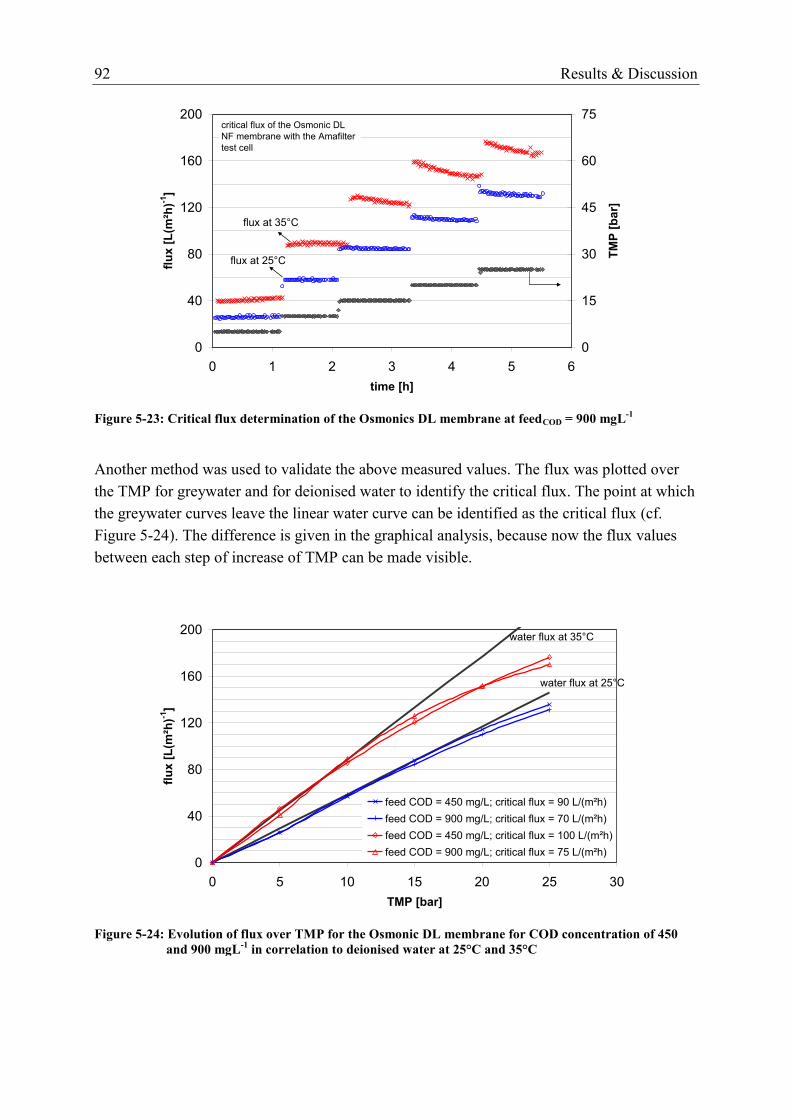
92 Results & Discussion
0
40
80
120
160
200
0 1 2 3 4 5 6
time [h]
flu
x [
L(m
²h)-1
]
0
15
30
45
60
75
TM
P [
ba
r]
flux at 35°C
flux at 25°C
critical flux of the Osmonic DL
NF membrane with the Amafilter
test cell
Figure 5-23: Critical flux determination of the Osmonics DL membrane at feedCOD = 900 mgL-1
Another method was used to validate the above measured values. The flux was plotted over
the TMP for greywater and for deionised water to identify the critical flux. The point at which
the greywater curves leave the linear water curve can be identified as the critical flux (cf.
Figure 5-24). The difference is given in the graphical analysis, because now the flux values
between each step of increase of TMP can be made visible.
0
40
80
120
160
200
0 5 10 15 20 25 30
TMP [bar]
flu
x [
L(m
²h)-1
]
feed COD = 450 mg/L; critical flux = 90 L/(m²h)
feed COD = 900 mg/L; critical flux = 70 L/(m²h)
feed COD = 450 mg/L; critical flux = 100 L/(m²h)
feed COD = 900 mg/L; critical flux = 75 L/(m²h)
water flux at 25°C
water flux at 35°C
Figure 5-24: Evolution of flux over TMP for the Osmonic DL membrane for COD concentration of 450
and 900 mgL-1
in correlation to deionised water at 25°C and 35°C
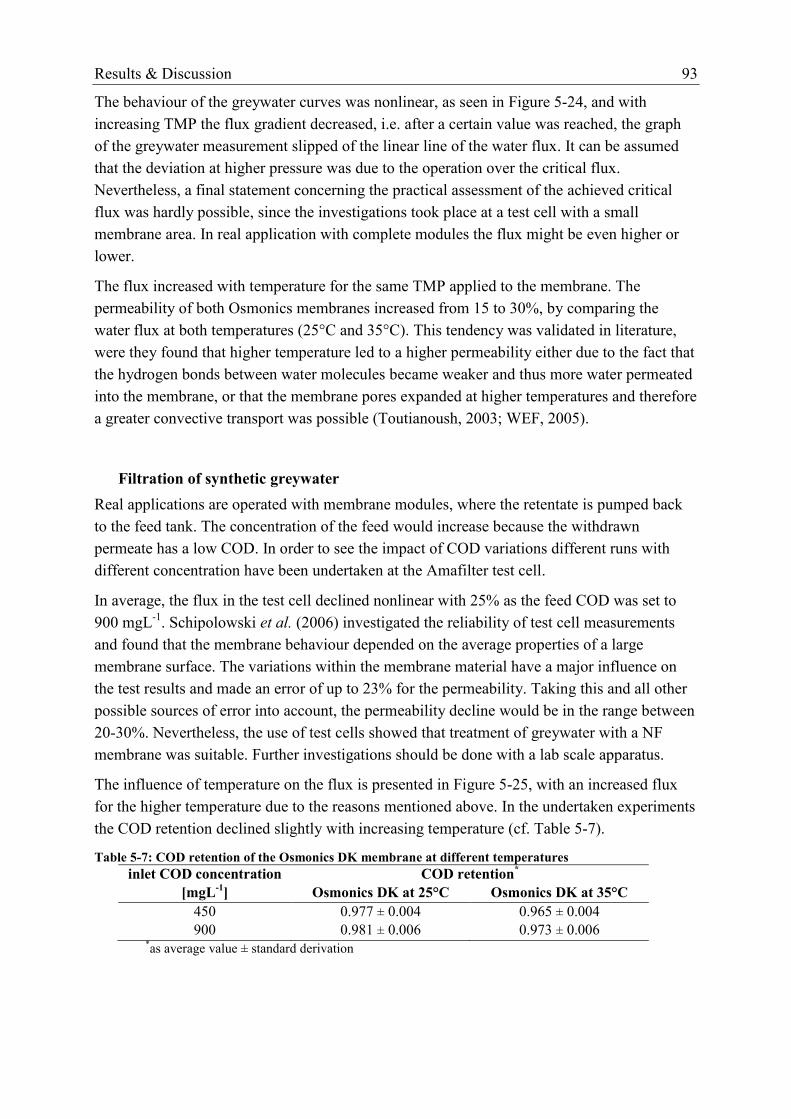
Results & Discussion 93
The behaviour of the greywater curves was nonlinear, as seen in Figure 5-24, and with
increasing TMP the flux gradient decreased, i.e. after a certain value was reached, the graph
of the greywater measurement slipped of the linear line of the water flux. It can be assumed
that the deviation at higher pressure was due to the operation over the critical flux.
Nevertheless, a final statement concerning the practical assessment of the achieved critical
flux was hardly possible, since the investigations took place at a test cell with a small
membrane area. In real application with complete modules the flux might be even higher or
lower.
The flux increased with temperature for the same TMP applied to the membrane. The
permeability of both Osmonics membranes increased from 15 to 30%, by comparing the
water flux at both temperatures (25°C and 35°C). This tendency was validated in literature,
were they found that higher temperature led to a higher permeability either due to the fact that
the hydrogen bonds between water molecules became weaker and thus more water permeated
into the membrane, or that the membrane pores expanded at higher temperatures and therefore
a greater convective transport was possible (Toutianoush, 2003; WEF, 2005).
Filtration of synthetic greywater
Real applications are operated with membrane modules, where the retentate is pumped back
to the feed tank. The concentration of the feed would increase because the withdrawn
permeate has a low COD. In order to see the impact of COD variations different runs with
different concentration have been undertaken at the Amafilter test cell.
In average, the flux in the test cell declined nonlinear with 25% as the feed COD was set to
900 mgL-1
. Schipolowski et al. (2006) investigated the reliability of test cell measurements
and found that the membrane behaviour depended on the average properties of a large
membrane surface. The variations within the membrane material have a major influence on
the test results and made an error of up to 23% for the permeability. Taking this and all other
possible sources of error into account, the permeability decline would be in the range between
20-30%. Nevertheless, the use of test cells showed that treatment of greywater with a NF
membrane was suitable. Further investigations should be done with a lab scale apparatus.
The influence of temperature on the flux is presented in Figure 5-25, with an increased flux
for the higher temperature due to the reasons mentioned above. In the undertaken experiments
the COD retention declined slightly with increasing temperature (cf. Table 5-7).
Table 5-7: COD retention of the Osmonics DK membrane at different temperatures
inlet COD concentration
[mgL-1
]
COD retention*
Osmonics DK at 25°C Osmonics DK at 35°C
450 0.977 ± 0.004 0.965 ± 0.004
900 0.981 ± 0.006 0.973 ± 0.006
*as average value ± standard derivation
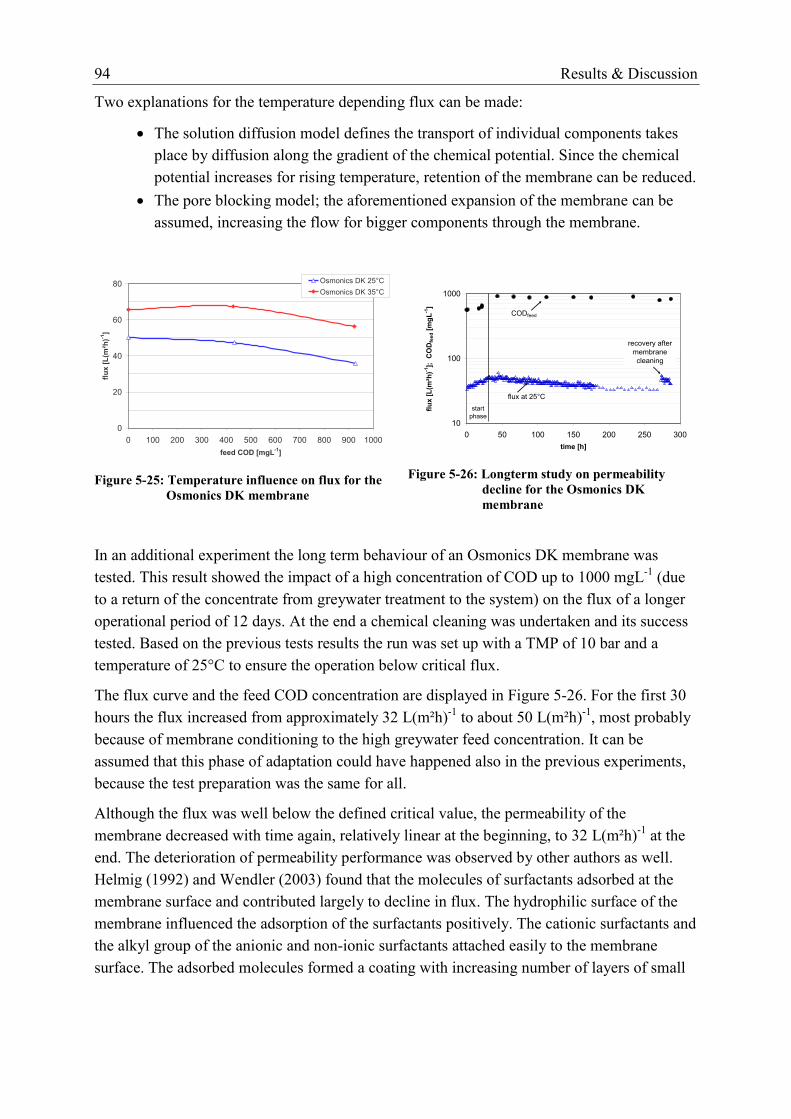
94 Results & Discussion
Two explanations for the temperature depending flux can be made:
The solution diffusion model defines the transport of individual components takes
place by diffusion along the gradient of the chemical potential. Since the chemical
potential increases for rising temperature, retention of the membrane can be reduced.
The pore blocking model; the aforementioned expansion of the membrane can be
assumed, increasing the flow for bigger components through the membrane.
0
20
40
60
80
0 100 200 300 400 500 600 700 800 900 1000
feed COD [mgL-1
]
flu
x [
L(m
²h)-1
]
Osmonics DK 25°C
Osmonics DK 35°C
Figure 5-25: Temperature influence on flux for the
Osmonics DK membrane
10
100
1000
0 50 100 150 200 250 300
time [h]
flu
x [
L(m
²h)-1
]; C
OD
feed [
mg
L-1
]
start
phase
recovery after
membrane
cleaning
flux at 25°C
CODfeed
Figure 5-26: Longterm study on permeability
decline for the Osmonics DK
membrane
In an additional experiment the long term behaviour of an Osmonics DK membrane was
tested. This result showed the impact of a high concentration of COD up to 1000 mgL-1
(due
to a return of the concentrate from greywater treatment to the system) on the flux of a longer
operational period of 12 days. At the end a chemical cleaning was undertaken and its success
tested. Based on the previous tests results the run was set up with a TMP of 10 bar and a
temperature of 25°C to ensure the operation below critical flux.
The flux curve and the feed COD concentration are displayed in Figure 5-26. For the first 30
hours the flux increased from approximately 32 L(m²h)-1
to about 50 L(m²h)-1
, most probably
because of membrane conditioning to the high greywater feed concentration. It can be
assumed that this phase of adaptation could have happened also in the previous experiments,
because the test preparation was the same for all.
Although the flux was well below the defined critical value, the permeability of the
membrane decreased with time again, relatively linear at the beginning, to 32 L(m²h)-1
at the
end. The deterioration of permeability performance was observed by other authors as well.
Helmig (1992) and Wendler (2003) found that the molecules of surfactants adsorbed at the
membrane surface and contributed largely to decline in flux. The hydrophilic surface of the
membrane influenced the adsorption of the surfactants positively. The cationic surfactants and
the alkyl group of the anionic and non-ionic surfactants attached easily to the membrane
surface. The adsorbed molecules formed a coating with increasing number of layers of small
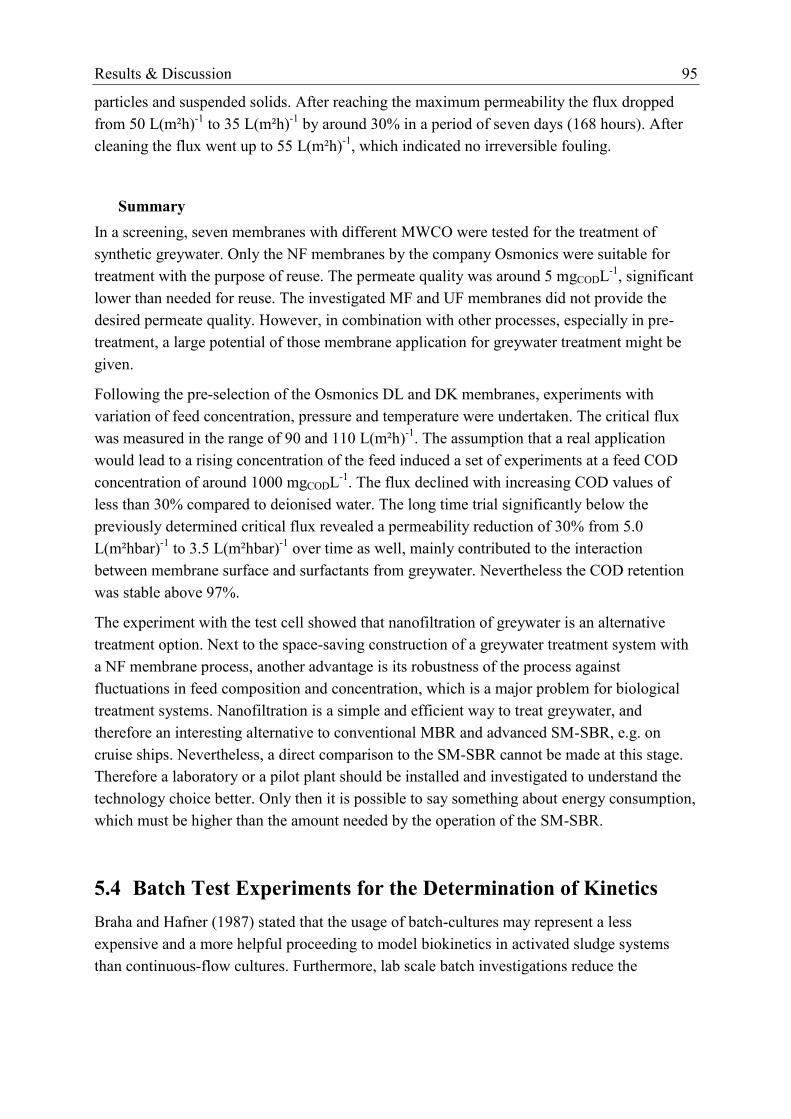
Results & Discussion 95
particles and suspended solids. After reaching the maximum permeability the flux dropped
from 50 L(m²h)-1
to 35 L(m²h)-1
by around 30% in a period of seven days (168 hours). After
cleaning the flux went up to 55 L(m²h)-1
, which indicated no irreversible fouling.
Summary
In a screening, seven membranes with different MWCO were tested for the treatment of
synthetic greywater. Only the NF membranes by the company Osmonics were suitable for
treatment with the purpose of reuse. The permeate quality was around 5 mgCODL-1
, significant
lower than needed for reuse. The investigated MF and UF membranes did not provide the
desired permeate quality. However, in combination with other processes, especially in pre-
treatment, a large potential of those membrane application for greywater treatment might be
given.
Following the pre-selection of the Osmonics DL and DK membranes, experiments with
variation of feed concentration, pressure and temperature were undertaken. The critical flux
was measured in the range of 90 and 110 L(m²h)-1
. The assumption that a real application
would lead to a rising concentration of the feed induced a set of experiments at a feed COD
concentration of around 1000 mgCODL-1
. The flux declined with increasing COD values of
less than 30% compared to deionised water. The long time trial significantly below the
previously determined critical flux revealed a permeability reduction of 30% from 5.0
L(m²hbar)-1
to 3.5 L(m²hbar)-1
over time as well, mainly contributed to the interaction
between membrane surface and surfactants from greywater. Nevertheless the COD retention
was stable above 97%.
The experiment with the test cell showed that nanofiltration of greywater is an alternative
treatment option. Next to the space-saving construction of a greywater treatment system with
a NF membrane process, another advantage is its robustness of the process against
fluctuations in feed composition and concentration, which is a major problem for biological
treatment systems. Nanofiltration is a simple and efficient way to treat greywater, and
therefore an interesting alternative to conventional MBR and advanced SM-SBR, e.g. on
cruise ships. Nevertheless, a direct comparison to the SM-SBR cannot be made at this stage.
Therefore a laboratory or a pilot plant should be installed and investigated to understand the
technology choice better. Only then it is possible to say something about energy consumption,
which must be higher than the amount needed by the operation of the SM-SBR.
5.4 Batch Test Experiments for the Determination of Kinetics
Braha and Hafner (1987) stated that the usage of batch-cultures may represent a less
expensive and a more helpful proceeding to model biokinetics in activated sludge systems
than continuous-flow cultures. Furthermore, lab scale batch investigations reduce the

96 Results & Discussion
expenditure for technical devices and the time between operational periods in single runs due
to a short transient behaviour. Gaudy and Gaudy (1972) have found out that the adaptation
processes of biomass occurs usually during the total reaction time, because the remaining
compounds of the mixed substrate may become less available with time due to
biodegradation, which may lead to complications in the process of adaptation of biomass.
This is also noted by Wentzel et al. (1995), who has reported differences between activated
sludge system and batch test kinetic constants. These variations have been attributed to the
activity of the biomass and the content of COD. However, theses differences should have a
lower impact for sludge from SBR operation, since it is already a batch operated system.
Today, respirometry and batch investigation are an established tool to validate mathematical
models, which describe the biological and microbiological activity of biocenosis in activated
sludge system (Brenner, 2000; Gildemeister et al., 2005; Moussa et al., 2005; Novák et al.,
1995). Examples are given by:
Ni and Yu (2007), who performed a lab scale SBR experiment involving storage
compounds to model the growth of multiple microbial species,
Vanrolleghem et al. (1995), who concentrated on the practical identifiability
properties of a mathematical model and on the design of informative experiments for
parameter estimations,
Dircks et al. (1999), who used respirometry batch experiments for the yield
determination,
Spérandio et al. (2005), who compared sludge characteristics of an MBR with an
ASP, and
Ekama et al. (1986), who determined with this tool different COD fractions in
wastewater.
Above all, it is important to be precise when measuring the different kinetic parameters. An
exceptional position holds the heterotrophic yield YH, because of its high dependency on
environmental conditions. That means that for each undertaken batch experiment the yield
should be determined separately. Usually, this would go beyond the operating expense.
Nevertheless, the yield was determined for the synthetic greywater with sludge from set-up C
in a number of batches and graphically calculated according to the method from Dircks et al.
(1999) in the form of
slopeYOU H 1 (5-3)
where OU = accumulated oxygen uptake, mgDO L-1
YH = heterotrophic yield coefficient
meaning that the yield coefficient YH equalled to 1 minus the slope of the line in Figure 5-27.
With this procedure, the defined YH coefficient was assumed to be valid for the whole range
of the examined substrate concentrations. The calculated yield with sludge from set-up C was
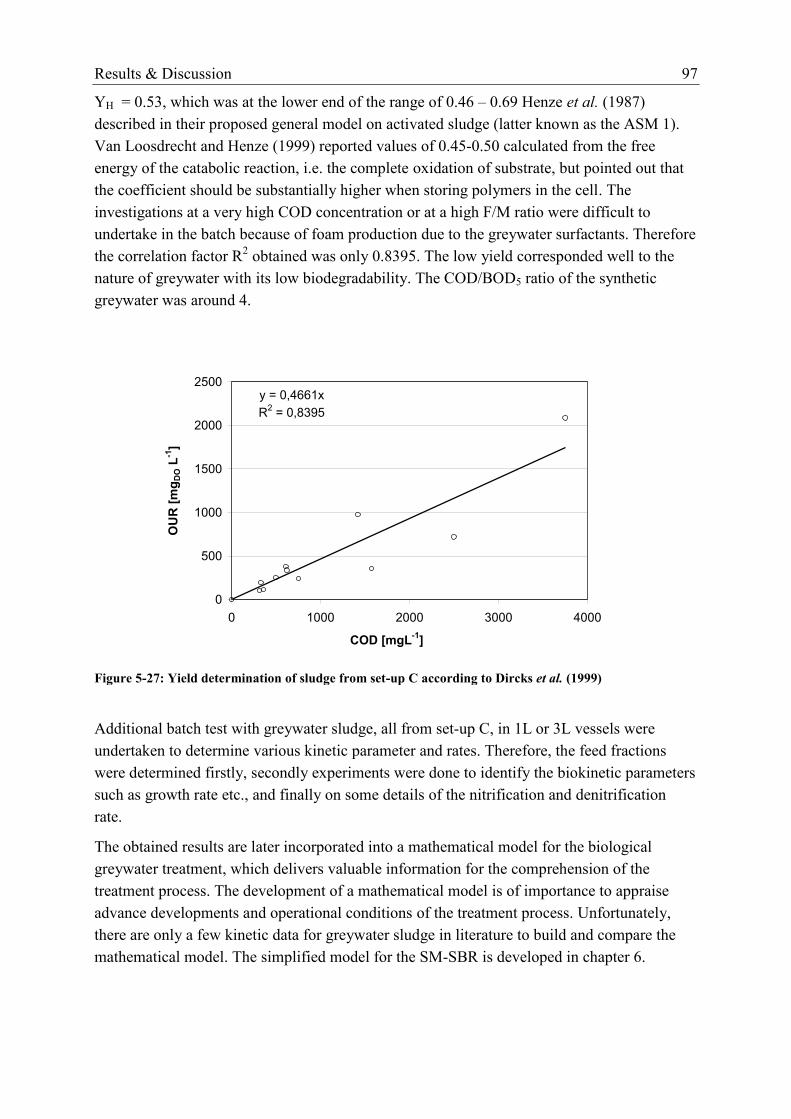
Results & Discussion 97
YH = 0.53, which was at the lower end of the range of 0.46 – 0.69 Henze et al. (1987)
described in their proposed general model on activated sludge (latter known as the ASM 1).
Van Loosdrecht and Henze (1999) reported values of 0.45-0.50 calculated from the free
energy of the catabolic reaction, i.e. the complete oxidation of substrate, but pointed out that
the coefficient should be substantially higher when storing polymers in the cell. The
investigations at a very high COD concentration or at a high F/M ratio were difficult to
undertake in the batch because of foam production due to the greywater surfactants. Therefore
the correlation factor R2 obtained was only 0.8395. The low yield corresponded well to the
nature of greywater with its low biodegradability. The COD/BOD5 ratio of the synthetic
greywater was around 4.
y = 0,4661x
R2 = 0,8395
0
500
1000
1500
2000
2500
0 1000 2000 3000 4000
COD [mgL-1
]
OU
R [
mg
DO L
-1]
Figure 5-27: Yield determination of sludge from set-up C according to Dircks et al. (1999)
Additional batch test with greywater sludge, all from set-up C, in 1L or 3L vessels were
undertaken to determine various kinetic parameter and rates. Therefore, the feed fractions
were determined firstly, secondly experiments were done to identify the biokinetic parameters
such as growth rate etc., and finally on some details of the nitrification and denitrification
rate.
The obtained results are later incorporated into a mathematical model for the biological
greywater treatment, which delivers valuable information for the comprehension of the
treatment process. The development of a mathematical model is of importance to appraise
advance developments and operational conditions of the treatment process. Unfortunately,
there are only a few kinetic data for greywater sludge in literature to build and compare the
mathematical model. The simplified model for the SM-SBR is developed in chapter 6.

98 Results & Discussion
5.4.1 COD Fractioning of the Synthetic Greywater
In chapter 3.4.2 an overview was given of the different wastewater constituents as for
example carbonaceous components. To determine the COD fractions in the used synthetic
greywater, experiments were carried out according to Ekama et al. (1986) and Kappeler and
Gujer (1992). It was necessary to define the different fractions, because these values were
used for later mathematical modelling. For instance, it was important to characterise the true
residence time of each fraction in the system in correlation to its associated removal-
mechanism and -rate. It was supposed that no particulate matter either biomass or others was
presented in the feed, because synthetic greywater is used.
The COD is divided into four fractions: readily biodegradable COD (rbCOD), slowly
biodegradable COD (sbCOD), soluble inert COD (nbsCOD), and particulate inert COD
(nbpCOD). An example of the OUR batch runs is given in Figure 5-28, where five different
phases could be identified.
0
10
20
30
40
50
60
70
80
0 5 10 15 20time [hours]
OU
R [
mg
O2 (
Lh
)-1]
td
ΔDO
I II III IV V
sbCOD
Figure 5-28: Determination of COD fractions via OUR batch test
The first period shows an OUR increase exponentially over time, due to heterotrophic active
biomass growth. In the second phase OUR drops (= DO in Figure 5-28) precipitously due to
depletion of rbCOD. During the third phase, OUR represents the growth of microorganism on
sbCOD followed by saturation due to sbCOD depletion (phase IV) and ultimately the OUR
decreases slowly, because of endogenous respiration and decay (phase V). The growth on
sbCOD becomes only visible when rbCOD becomes limiting. Despite the fact that wastewater
models do not show visible growth on sbCOD in phase I, it is assumed to be the growth on
both, the rbCOD and sbCOD utilisation. Nevertheless, the fraction of rbCOD can be
calculated using equation (5-4), with td as the time from start until the precipitous drop of
rbCOD depletion. (Wentzel et al., 1995)

Results & Discussion 99
td
t
sbCODtotal
H
dtOUROURY
rbCOD0
)(1
1 (5-4)
where td = time from start until precipitous drop, s
In the shown example (cf. Figure 5-28) the amount of the readily biodegradable fraction (SS)
is 264 mgL-1
, which is 35.0% of the initial COD concentration and the fraction of sbCOD
(XS) equals to 269 mgL-1
, which is 35.7% respectively. Once the decay phase is reached, the
residual COD in the batch gives the inert fraction (SI+XI) of the COD, which is 29.3% of the
initial COD. The nbCOD can be further subdivided in its particulate part, enmeshed in the
sludge, and in its soluble part, leaving the reactor with the permeate. The analysis of the
reactor shows that the effluent COD concentration is in average around 19 mgL-1
. This value
corresponds well to the fraction of snbCOD = 9.4%. The average values calculated for the
different fractions in comparison to literature values are listed in Table 5-8.
Table 5-8: COD fractions of different wastewaters
type of wastewater
total COD
[mgO2L-1
]
SS XS XH SI+XI
references [%] [%] [%] [%]
synthetic GW 203 ± 69 25 ± 16 42 ± 9 ~ 0* 33 ± 22 this study
raw WW 663 5 38 10 47 } (Ginestet et al., 2002) settled WW 403 8 51 10 31
primary effluent
(municipal WW) 250 11 53 7 29
(Kappeler and Gujer,
1992)
combined sewer 396 30 35 10 25 (Lagarde et al., 2005)
ASM1 separated sewer 878 43 19 8 30
municipal WW 410 9 77 within
XS 14 (Orhon et al., 1997)
municipal WW 20 40 20 20 (Henze, 1992), in:
(Orhon et al., 1997)
*assumed to be zero, because it is synthetic wastewater
The determined values indicate that the composition of the synthetic greywater is within the
reported literature values for different kind of wastewaters. (Mehlhart, 2005) reports that the
rbCOd from real greywater results mostly from detergents and skin grease and therefore
should content more particulate matter (hair, skin, and dandruff particles) than the synthetic
greywater used in this study. The particulate matter can account for the fraction of nbCOD or
sbCOD. The synthetic feed does not enclose such human wastes, but since the synthetic
greywater contains detergents and oil the rbCOD concentration should be comparable,
whereas the particulate fraction is most probably underestimated in comparison to real
greywater. Still, it is known that the quality of greywater strongly varies depending on the
source and on the cultural background. It does not necessarily mean that the values obtained
for the synthetic greywater are out of range or at any border compared to other sources of
greywater. Unfortunately in literature, no values can be found.

100 Results & Discussion
5.4.2 Respirometry for the Determination of Biokinetic Parameters
As mentioned earlier, an intensive literature survey showed the lack of biokinetic parameter in
greywater treatment, which is needed for proper plant design. Therefore, batch experiments
were carried out, where sludge biomass from the operated reactor and fresh feed was mixed in
different F/M ratios to determine µmax and other specific biokinetic data (kd, kh KS, etc.), as
shown in Table 5-9.
Table 5-9: Biokinetic parameters of sludge, coming from different wastewaters
Treatments
and feeds
at ~20°C
Biokinetic parameters
references
COD [mgL-1]
µmax
[d-1]
KS
[mgL-1]
kd
[d-1]
kh
[d-1]
SM-SBR GW 203±69 22.4 689 1.07 0.42±0.14 this study
SBR domestic
WW 200 6.5 5 0.15
(Artan and Orhon,
2005)
immersed MBR
synthetic WW 1.28 – 6.46
* 289 – 2933
*
0.151 –
0.0261*
(Al-Malack, 2006)
ASP municipal
WW 250 2 – 7 2.5 - 4.0 0.1 - 0.4 1.5 - 10
(Kappeler and
Gujer, 1992)
raw municipal
WW 663 8.8±2.3
(Ginestet et al.,
2002)
settled
municipal WW 403 11.6±2.8
settleable
fraction**
0.63±0.2
ASP municipal
WW 821 5.4 – 7.8 0.62
(Wentzel et al.,
1995) * Investigations were carried out at MLSS concentration from 3.0 to 15.0 gL
-1.
** equivalent to very slowly hydrolysable COD
Determination of µmax, KS and kd
The maximum growth rate μmax is the most important parameter for carbon removal and
nitrification, because it measures the speed of unlimited growth with substrate surplus. The
determination of this parameter is essential for every wastewater composition, since it is
strongly influenced by several factors such as temperature, pH, DO, inhibitors, organic
carbon, substrate, sludge age and so on. It is therefore important to determine the best F/M
ratio in order not to be substrate limited or substrate inhibited. Macro and micro nutrients
must be added to avoid limitation as well.
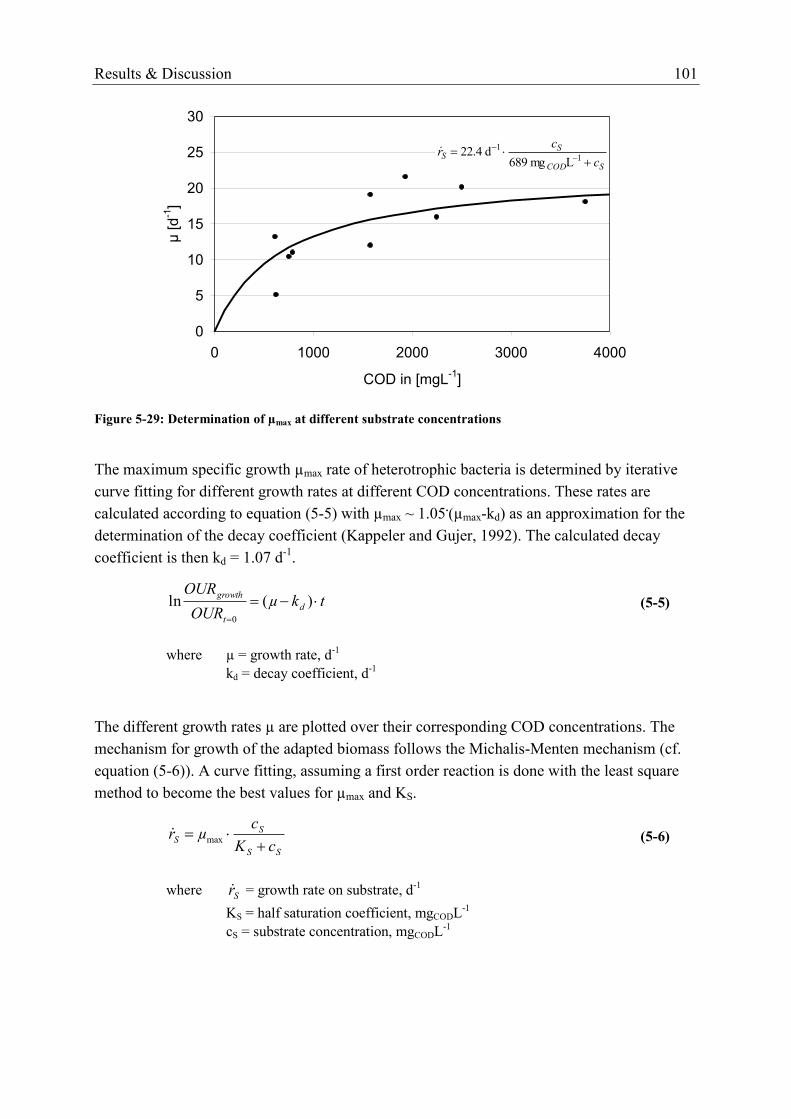
Results & Discussion 101
0
5
10
15
20
25
30
0 1000 2000 3000 4000
COD in [mgL-1
]
µ [d
-1]
SCOD
SS
c
cr
1
1
Lmg 689d 22.4
Figure 5-29: Determination of µmax at different substrate concentrations
The maximum specific growth µmax rate of heterotrophic bacteria is determined by iterative
curve fitting for different growth rates at different COD concentrations. These rates are
calculated according to equation (5-5) with µmax ~ 1.05.(µmax-kd) as an approximation for the
determination of the decay coefficient (Kappeler and Gujer, 1992). The calculated decay
coefficient is then kd = 1.07 d-1
.
tkµOUR
OURd
t
growth
)(ln0
(5-5)
where µ = growth rate, d-1
kd = decay coefficient, d-1
The different growth rates µ are plotted over their corresponding COD concentrations. The
mechanism for growth of the adapted biomass follows the Michalis-Menten mechanism (cf.
equation (5-6)). A curve fitting, assuming a first order reaction is done with the least square
method to become the best values for µmax and KS.
SS
SS
cK
cµr
max
(5-6)
where Sr = growth rate on substrate, d-1
KS = half saturation coefficient, mgCODL-1
cS = substrate concentration, mgCODL-1

102 Results & Discussion
For µmax determination the F:M ratio had to be high in order to obtain growth without
limitations. The added feed concentration (up to 40mL concentrate) can result in inhibition of
bacteria growth due to high ammonia concentration of more than 60 mgL-1
, (Metcalf and
Eddy, 2003), unless biomass is adopted. This is not the case for the sludge from the SM-SBR,
because during normal operation bacteria are exposed to a low concentration of ammonia.
Therefore, the NH4Cl concentration in the synthetic greywater was reduced by the factor of 2
for this series of experiments.
Using the above mentioned method yields a µmax of 22.4 d-1
and a KS of 689 mgL-1
,
respectively (cf. Figure 5-29). KS corresponds to the value of rbCOD equivalent to the half of
µmax. The determined values are very high compared to kinetic studies with municipal
wastewater reported in literature. Only Al-Malack (2006) found even higher KS values for
increasing MLSS concentration. Studies done with synthetic wastewater at the Chair of
Chemical Engineering, TU Berlin, yielded also high value for KS (up to 900 mgL-1
; an MBR
treating synthetic wastewater at long SRT of 50 d). Since all high KS values are determined
with synthetic feed, it might be a hypothesis that the difference to real wastewater lies in the
adaptation of biomass to the constant synthetic feed. While feeding a system with real
wastewater, the biomass is exposed to changes in its constituents and in COD concentration,
especially during rainfall. This is not the case for the operation of lab or pilot scale reactors
with synthetic wastewater. The biomass is very well adapted to the substrate and can yield
therefore with higher growth rates and higher KS values.
Although a high growth rate with the batch experiments is calculated, in normal operation of
the SM-SBR (set-up C), only a very low specific growth rate of µ* = 0.019 d
-1 can be found.
This might indicate that the HRT, even so it was reduced, is too long for optimal biomass
growth during reactor operation. Despite the low COD of greywater, the heterotrophic aerobic
biomass shows higher maximum growth rates on either rbCOD and/or sbCOD compared to
real wastewaters, whatever treatment process. A justification can be the cumulating effects of
a high fraction of rbCOD and the low yield coefficient, which is itself affected by bacteria
storage effect due to the long SRT and HRT of the SM-SBR (Dircks et al., 1999). A
hypothesis to be validated is that due to the long HRT and SRT, non-storing bacteria are
encouraged to utilize sbCOD and recalcitrant substance, such as dead cells, during the famine
period.
Determination of kH
As mentioned above, the growth on sbCOD becomes only visible when rbCOD is totally
depleted. Growth becomes limited by the substrate; the OUR is dominated by both, hydrolysis
of sbCOD content and by the hydrolysis coefficient kh, as shown in equation (5-7). This latter
depends to some extent on the biomass concentration (Henze et al., 2000).

Results & Discussion 103
sbCODsbCOD
hkdt
d (5-7)
where kh = hydrolysis coefficient, d-1
Hydrolysis makes available all sbCOD by transforming it into rbCOD. Substrate is made cell
available by extracellular enzymatic reactions. They are considered to be surface reactions in
close contact with the organism and are assumed to be active at all times, independently of the
electron donor. For the synthetic greywater kH = 0.42±0.14 d-1
. The data in literature show
higher hydrolysis rates (cf. Table 5-9) except for Ginestet et al. (2002), who shows similar
low rates. It can be said that the higher hydrolysis rates are obtained with batch experiments
lower than 24 h, whereas the lower values are deduced from long term experiments >24h.
This shows a time sensitivity of the evaluated results from batch experiments. If the slowly
biodegradable fraction is not well separated, the hydrolysis rate may include a quantity of the
rbCOD. Ginestet et al. (2002) explains that higher kH results mainly from the soluble and
colloidal fraction, which are quantified as readily hydrolysable matter.
5.4.3 Rates of Nitrification and Denitrification
The sludge was sampled from the SM-SBR 10 to 20 min after the end of the filling phase. A
waiting period of 20 min with a slow mixing speed of 50 rpm was incorporated before the
actual measurement of the different nitrogen compounds started. The equations (3-13), (3-15),
and the slope from the nutrients concentrations (ammonium, nitrate, and nitrite) versus time
(cf. Figure 5-32) were used to evaluate and calculate the different rates. In most batches
acetate was added as a source for rbCOD, but for comparison also experiments with
greywater concentrate and without any additional carbon source were undertaken. To
complete the picture the rates from cycle analysis were likewise calculated.
AUR and NUR results
The ammonium utilisation rate (AUR) was calculated from the slope of ammonia during the
aerobic phase, while the nitrate-N utilisation rate (NUR) was calculated from the slope of
nitrite and nitrate together during the anoxic phase. Figure 5-30 shows the results from a run
as an example for the many batches carried out with acetate as C-source. The sludge was
obtained from set-up C with an HRT = 12h.
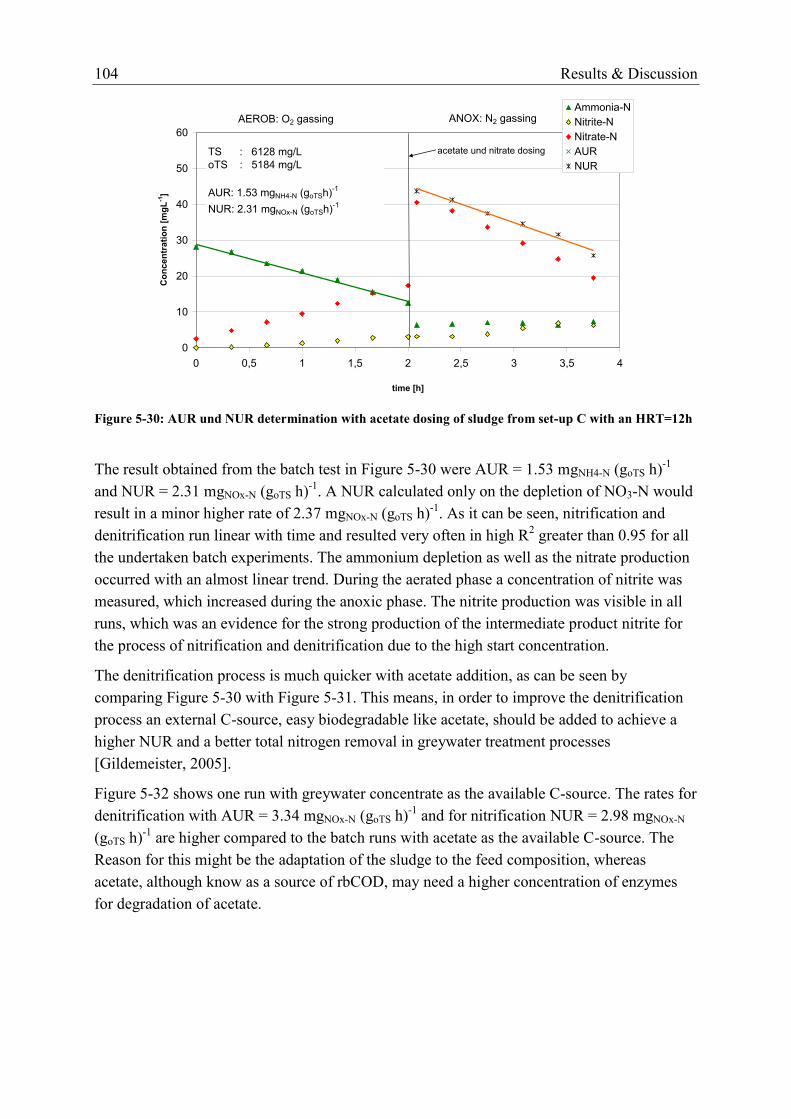
104 Results & Discussion
0
10
20
30
40
50
60
0 0,5 1 1,5 2 2,5 3 3,5 4
time [h]
Co
ncen
trati
on
[m
gL
-1]
Ammonia-N
Nitrite-N
Nitrate-N
AUR
NUR
AEROB: O2 gassing ANOX: N2 gassing
TS : 6128 mg/L
oTS : 5184 mg/L
AUR: 1.53 mgNH4-N (goTSh)-1
NUR: 2.31 mgNOx-N (goTSh)-1
acetate und nitrate dosing
Figure 5-30: AUR und NUR determination with acetate dosing of sludge from set-up C with an HRT=12h
The result obtained from the batch test in Figure 5-30 were AUR = 1.53 mgNH4-N (goTS h)-1
and NUR = 2.31 mgNOx-N (goTS h)-1
. A NUR calculated only on the depletion of NO3-N would
result in a minor higher rate of 2.37 mgNOx-N (goTS h)-1
. As it can be seen, nitrification and
denitrification run linear with time and resulted very often in high R2 greater than 0.95 for all
the undertaken batch experiments. The ammonium depletion as well as the nitrate production
occurred with an almost linear trend. During the aerated phase a concentration of nitrite was
measured, which increased during the anoxic phase. The nitrite production was visible in all
runs, which was an evidence for the strong production of the intermediate product nitrite for
the process of nitrification and denitrification due to the high start concentration.
The denitrification process is much quicker with acetate addition, as can be seen by
comparing Figure 5-30 with Figure 5-31. This means, in order to improve the denitrification
process an external C-source, easy biodegradable like acetate, should be added to achieve a
higher NUR and a better total nitrogen removal in greywater treatment processes
[Gildemeister, 2005].
Figure 5-32 shows one run with greywater concentrate as the available C-source. The rates for
denitrification with AUR = 3.34 mgNOx-N (goTS h)-1
and for nitrification NUR = 2.98 mgNOx-N
(goTS h)-1
are higher compared to the batch runs with acetate as the available C-source. The
Reason for this might be the adaptation of the sludge to the feed composition, whereas
acetate, although know as a source of rbCOD, may need a higher concentration of enzymes
for degradation of acetate.
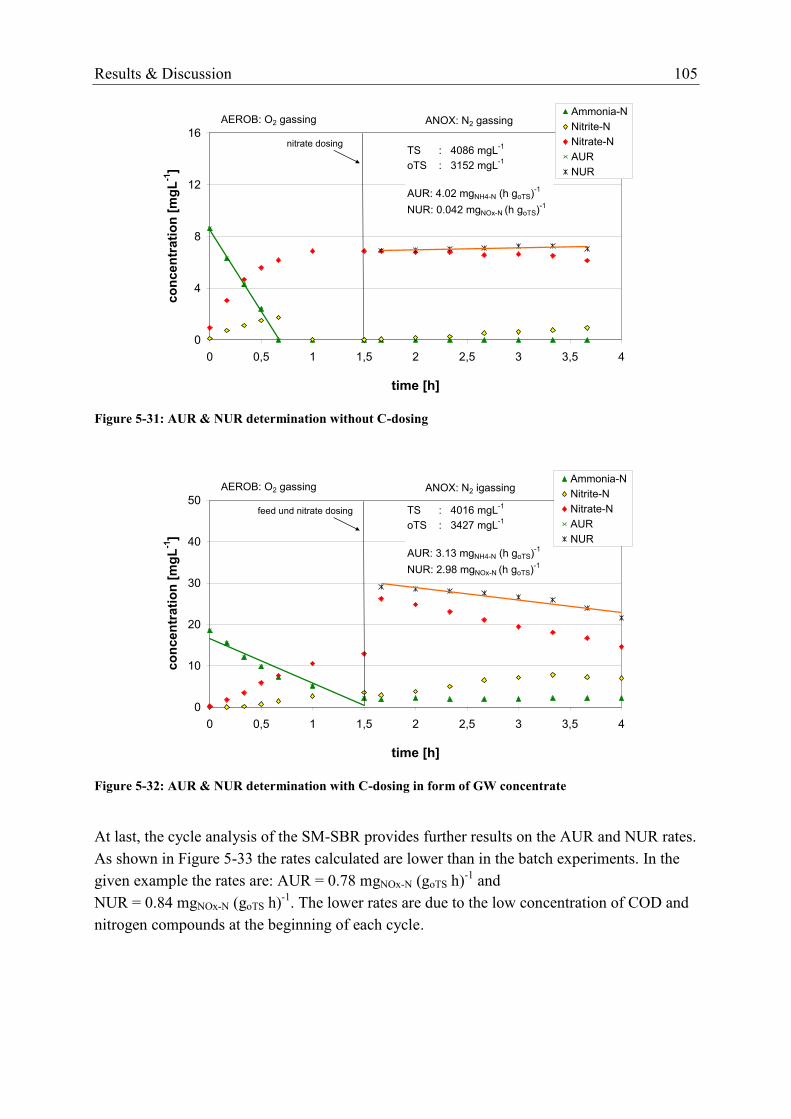
Results & Discussion 105
0
4
8
12
16
0 0,5 1 1,5 2 2,5 3 3,5 4
time [h]
co
ncen
trati
on
[m
gL
-1]
Ammonia-N
Nitrite-N
Nitrate-N
AUR
NUR
AEROB: O2 gassing ANOX: N2 gassing
TS : 4086 mgL-1
oTS : 3152 mgL-1
AUR: 4.02 mgNH4-N (h goTS)-1
NUR: 0.042 mgNOx-N (h goTS)-1
nitrate dosing
Figure 5-31: AUR & NUR determination without C-dosing
0
10
20
30
40
50
0 0,5 1 1,5 2 2,5 3 3,5 4
time [h]
co
ncen
trati
on
[m
gL
-1]
Ammonia-N
Nitrite-N
Nitrate-N
AUR
NUR
AEROB: O2 gassing ANOX: N2 igassing
TS : 4016 mgL-1
oTS : 3427 mgL-1
AUR: 3.13 mgNH4-N (h goTS)-1
NUR: 2.98 mgNOx-N (h goTS)-1
feed und nitrate dosing
Figure 5-32: AUR & NUR determination with C-dosing in form of GW concentrate
At last, the cycle analysis of the SM-SBR provides further results on the AUR and NUR rates.
As shown in Figure 5-33 the rates calculated are lower than in the batch experiments. In the
given example the rates are: AUR = 0.78 mgNOx-N (goTS h)-1
and
NUR = 0.84 mgNOx-N (goTS h)-1
. The lower rates are due to the low concentration of COD and
nitrogen compounds at the beginning of each cycle.
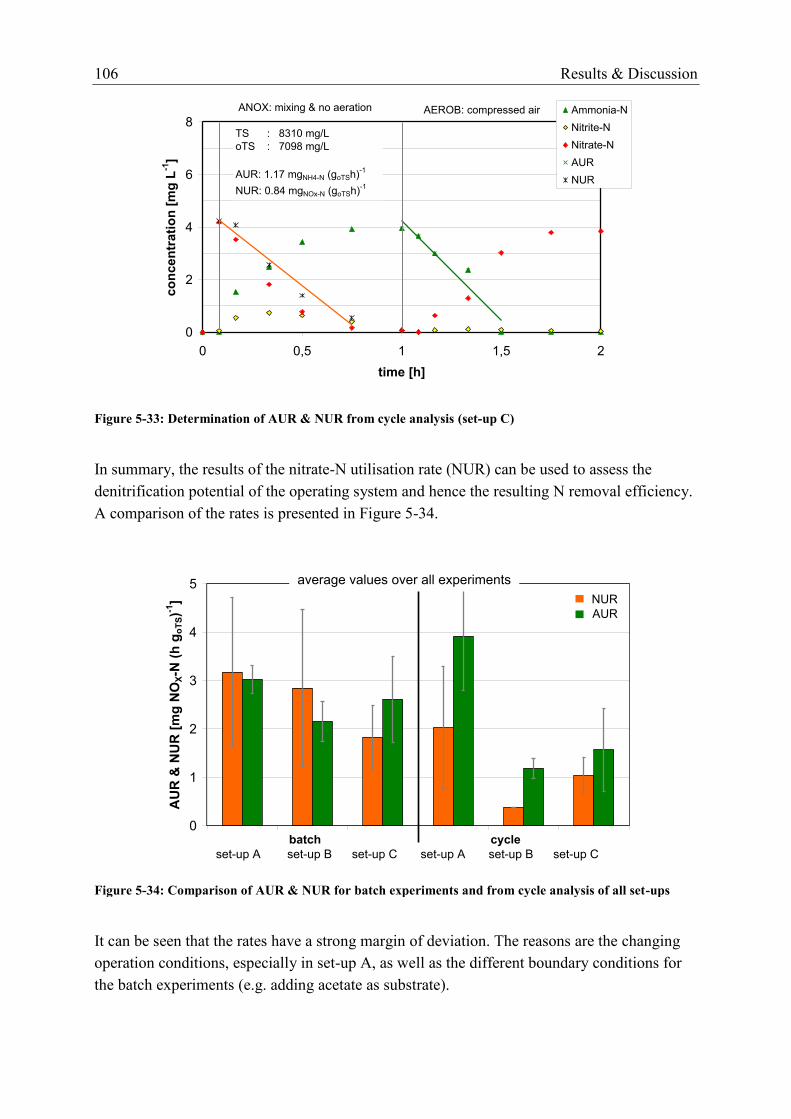
106 Results & Discussion
0
2
4
6
8
0 0,5 1 1,5 2
time [h]
co
ncen
trati
on
[m
g L
-1]
Ammonia-N
Nitrite-N
Nitrate-N
AUR
NUR
TS : 8310 mg/L
oTS : 7098 mg/L
AUR: 1.17 mgNH4-N (goTSh)-1
NUR: 0.84 mgNOx-N (goTSh)-1
AEROB: compressed airANOX: mixing & no aeration
Figure 5-33: Determination of AUR & NUR from cycle analysis (set-up C)
In summary, the results of the nitrate-N utilisation rate (NUR) can be used to assess the
denitrification potential of the operating system and hence the resulting N removal efficiency.
A comparison of the rates is presented in Figure 5-34.
0
1
2
3
4
5
1 1 1 1 1 1
AU
R &
NU
R [
mg
NO
X-N
(h
go
TS)-1
]
batch cycle
set-up A set-up B set-up C set-up A set-up B set-up C
NUR
AUR
average values over all experiments
Figure 5-34: Comparison of AUR & NUR for batch experiments and from cycle analysis of all set-ups
It can be seen that the rates have a strong margin of deviation. The reasons are the changing
operation conditions, especially in set-up A, as well as the different boundary conditions for
the batch experiments (e.g. adding acetate as substrate).
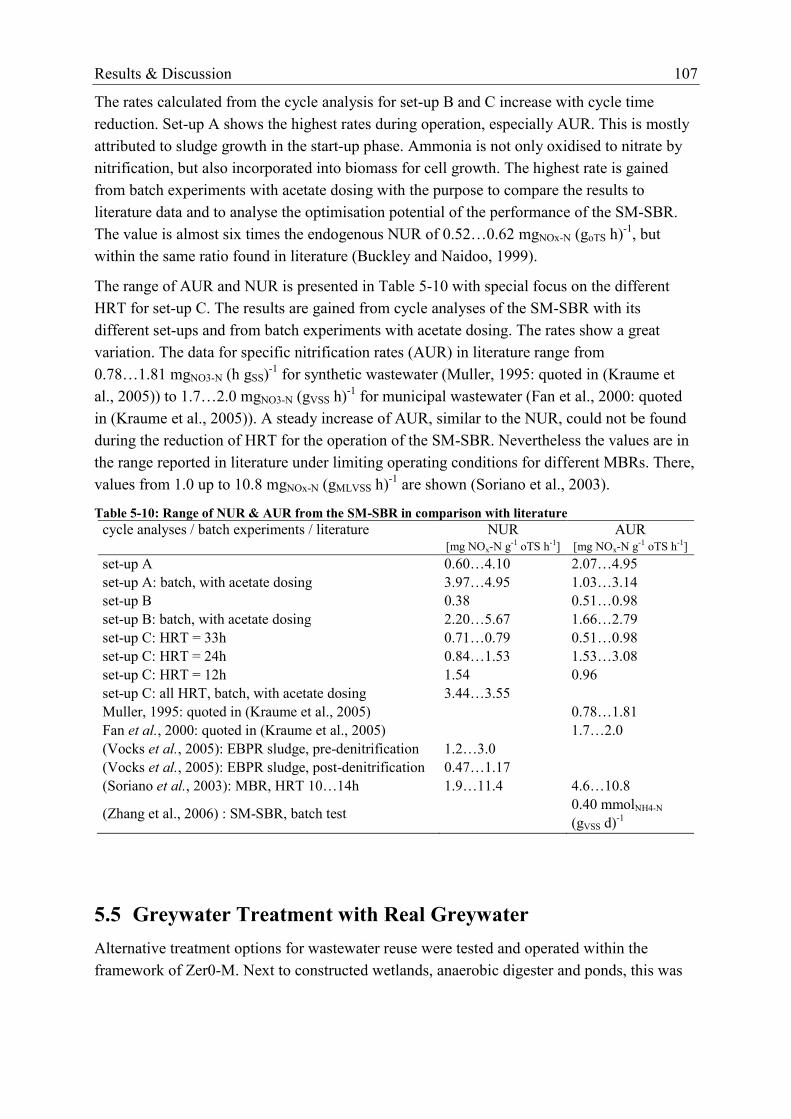
Results & Discussion 107
The rates calculated from the cycle analysis for set-up B and C increase with cycle time
reduction. Set-up A shows the highest rates during operation, especially AUR. This is mostly
attributed to sludge growth in the start-up phase. Ammonia is not only oxidised to nitrate by
nitrification, but also incorporated into biomass for cell growth. The highest rate is gained
from batch experiments with acetate dosing with the purpose to compare the results to
literature data and to analyse the optimisation potential of the performance of the SM-SBR.
The value is almost six times the endogenous NUR of 0.52…0.62 mgNOx-N (goTS h)-1
, but
within the same ratio found in literature (Buckley and Naidoo, 1999).
The range of AUR and NUR is presented in Table 5-10 with special focus on the different
HRT for set-up C. The results are gained from cycle analyses of the SM-SBR with its
different set-ups and from batch experiments with acetate dosing. The rates show a great
variation. The data for specific nitrification rates (AUR) in literature range from
0.78…1.81 mgNO3-N (h gSS)-1
for synthetic wastewater (Muller, 1995: quoted in (Kraume et
al., 2005)) to 1.7…2.0 mgNO3-N (gVSS h)-1
for municipal wastewater (Fan et al., 2000: quoted
in (Kraume et al., 2005)). A steady increase of AUR, similar to the NUR, could not be found
during the reduction of HRT for the operation of the SM-SBR. Nevertheless the values are in
the range reported in literature under limiting operating conditions for different MBRs. There,
values from 1.0 up to 10.8 mgNOx-N (gMLVSS h)-1
are shown (Soriano et al., 2003).
Table 5-10: Range of NUR & AUR from the SM-SBR in comparison with literature
cycle analyses / batch experiments / literature NUR [mg NOx-N g-1 oTS h-1]
AUR [mg NOx-N g-1 oTS h-1]
set-up A 0.60…4.10 2.07…4.95
set-up A: batch, with acetate dosing 3.97…4.95 1.03…3.14
set-up B 0.38 0.51…0.98
set-up B: batch, with acetate dosing 2.20…5.67 1.66…2.79
set-up C: HRT = 33h 0.71…0.79 0.51…0.98
set-up C: HRT = 24h 0.84…1.53 1.53…3.08
set-up C: HRT = 12h 1.54 0.96
set-up C: all HRT, batch, with acetate dosing 3.44…3.55
Muller, 1995: quoted in (Kraume et al., 2005) 0.78…1.81
Fan et al., 2000: quoted in (Kraume et al., 2005) 1.7…2.0
(Vocks et al., 2005): EBPR sludge, pre-denitrification 1.2…3.0
(Vocks et al., 2005): EBPR sludge, post-denitrification 0.47…1.17
(Soriano et al., 2003): MBR, HRT 10…14h 1.9…11.4 4.6…10.8
(Zhang et al., 2006) : SM-SBR, batch test 0.40 mmolNH4-N
(gVSS d)-1
5.5 Greywater Treatment with Real Greywater
Alternative treatment options for wastewater reuse were tested and operated within the
framework of Zer0-M. Next to constructed wetlands, anaerobic digester and ponds, this was
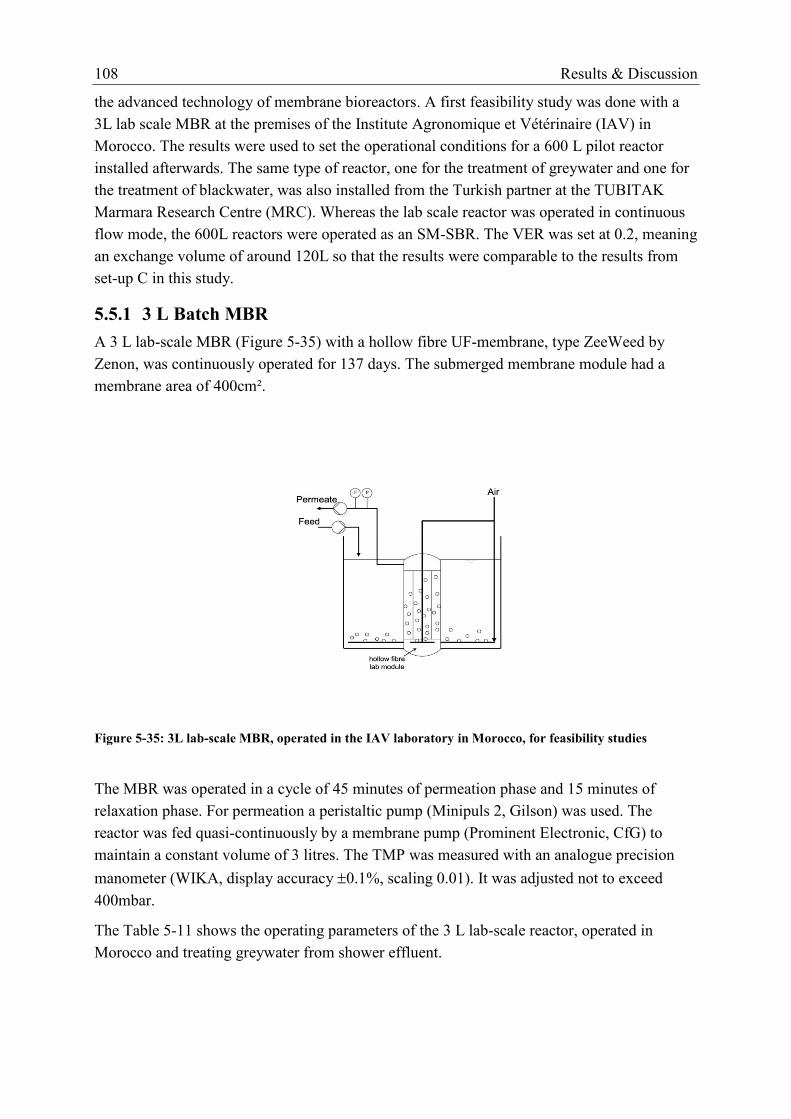
108 Results & Discussion
the advanced technology of membrane bioreactors. A first feasibility study was done with a
3L lab scale MBR at the premises of the Institute Agronomique et Vétérinaire (IAV) in
Morocco. The results were used to set the operational conditions for a 600 L pilot reactor
installed afterwards. The same type of reactor, one for the treatment of greywater and one for
the treatment of blackwater, was also installed from the Turkish partner at the TUBITAK
Marmara Research Centre (MRC). Whereas the lab scale reactor was operated in continuous
flow mode, the 600L reactors were operated as an SM-SBR. The VER was set at 0.2, meaning
an exchange volume of around 120L so that the results were comparable to the results from
set-up C in this study.
5.5.1 3 L Batch MBR
A 3 L lab-scale MBR (Figure 5-35) with a hollow fibre UF-membrane, type ZeeWeed by
Zenon, was continuously operated for 137 days. The submerged membrane module had a
membrane area of 400cm².
Figure 5-35: 3L lab-scale MBR, operated in the IAV laboratory in Morocco, for feasibility studies
The MBR was operated in a cycle of 45 minutes of permeation phase and 15 minutes of
relaxation phase. For permeation a peristaltic pump (Minipuls 2, Gilson) was used. The
reactor was fed quasi-continuously by a membrane pump (Prominent Electronic, CfG) to
maintain a constant volume of 3 litres. The TMP was measured with an analogue precision
manometer (WIKA, display accuracy 0.1%, scaling 0.01). It was adjusted not to exceed
400mbar.
The Table 5-11 shows the operating parameters of the 3 L lab-scale reactor, operated in
Morocco and treating greywater from shower effluent.

Results & Discussion 109
Table 5-11: Operating parameters of the lab-scale MBR
Operating Parameters Average Maximum Minimum
HRT, h 13 18 9
Membrane area, cm² 400 - -
Pore size, µm 0.1 - -
Transmembrane pressure, mbar 249 402 73
Flux, L(m2h)
-1 8 11 7
Aeration flow rate, Nm³(h)-1
0.32
MLSS, gL-1
1.30 0.42 1.85
MLVSS, gL-1
0.94 0.26 1.32
Lorg, kgCOD (m³d)-1
0.16 0.21 0.09
Feed/Biomass, mgCOD (d gVSS)-1
256 390 118
The raw greywater was filtered with a 1cm x 1cm and a 1mm x 1mm screen successively,
before it was pumped into the vessel. To achieve oxygen saturation and complete mixing in
the reactor, compressed air was continuously supplied at a flow rate of 0.32 m³h-1
. It was
partly introduced from the bottom of the membrane to enhance membrane cleaning, and
partly from a pipe, placed on the bottom around the reactor perimeter to prevent bacteria from
adhering to the reactor wall and settling in its edges. During the reported period the reactor
temperature increased from 9 to 20°C. The pH was in the range of 7.60.4.
Influent and effluent characteristics as well as overall removal performance are summarised in
Table 5-12. The shower effluent shows an average COD concentration of 109 mgL-1
and daily
peak loads not exceeding 170 mgL-1
. Hence, it can be said that this greywater is highly
diluted. Similar values are reported for a shower effluent of a students residence in Tunisia
where a mean COD of 102 mgL-1
and a mean BOD5 of 56 mgL-1
are found (Lamine et al.,
2007). Remarkably, the ratio COD/BOD5 is low with values between 1.1 and 2.0, which
indicates high biodegradability. In literature values up to 4 are reported (Scheumann and
Kraume, 2009).
The treatment of greywater with the MBR reduced the COD load on average by 85%. A mean
effluent concentration of 15 mgL-1
was obtained (Figure 5-36). The COD/BOD5 ratio in the
permeate reached values up to 25 indicating that BOD5 was almost completely removed.
Temperature and biomass concentration did not have a marked influence on removal
performance, because on day 40, the COD removal reached 86% at 11°C with a TS
concentration of 0.4 gVSSL-1
, whereas at day 137, the COD removal was 88% at 20°C with a
biomass concentration of 1.4gVSSL-1
.
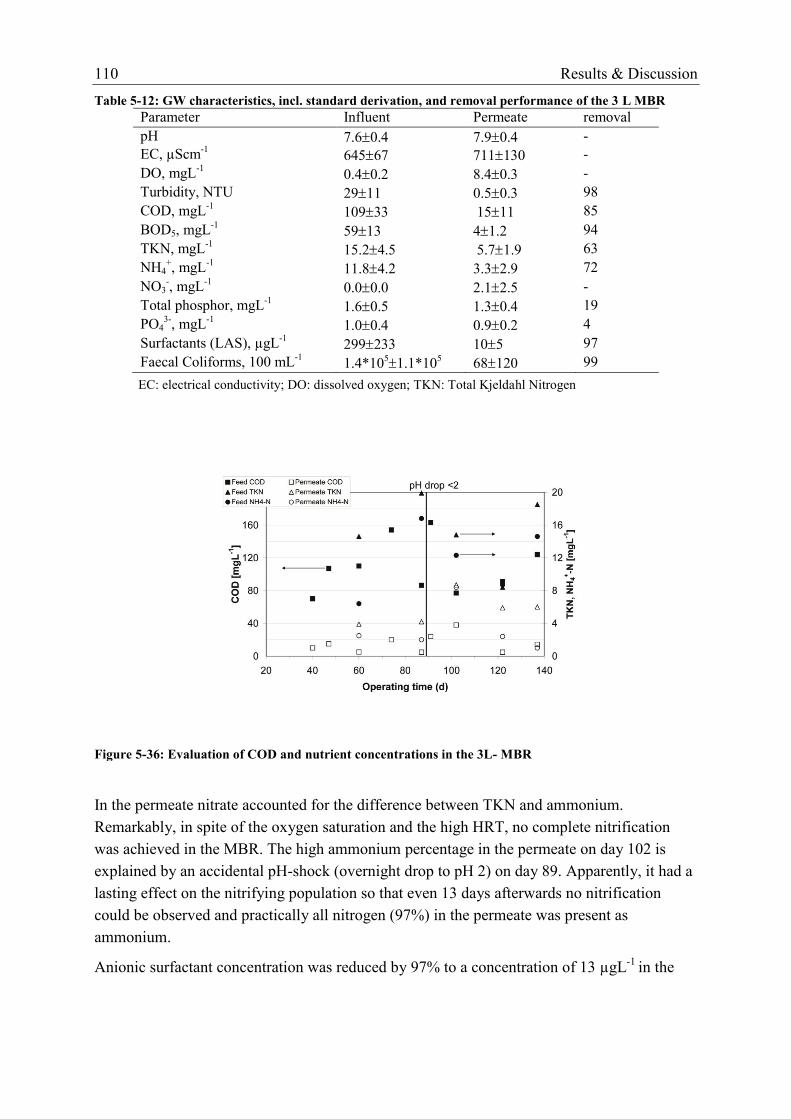
110 Results & Discussion
Table 5-12: GW characteristics, incl. standard derivation, and removal performance of the 3 L MBR
Parameter Influent Permeate removal
[%] pH 7.60.4 7.90.4 -
EC, µScm-1
64567 711130 -
DO, mgL-1
0.40.2 8.40.3 -
Turbidity, NTU 2911 0.50.3 98
COD, mgL-1
10933 1511
85
BOD5, mgL-1
5913 41.2 94
TKN, mgL-1
15.24.5 5.71.9 63
NH4+, mgL
-1 11.84.2 3.32.9 72
NO3-, mgL
-1 0.00.0 2.12.5
-
Total phosphor, mgL-1
1.60.5 1.30.4 19
PO43-
, mgL-1
1.00.4 0.90.2 4
Surfactants (LAS), µgL-1
299233 105 97
Faecal Coliforms, 100 mL-1
1.4*1051.1*10
5 68120 99
EC: electrical conductivity; DO: dissolved oxygen; TKN: Total Kjeldahl Nitrogen
Figure 5-36: Evaluation of COD and nutrient concentrations in the 3L- MBR
In the permeate nitrate accounted for the difference between TKN and ammonium.
Remarkably, in spite of the oxygen saturation and the high HRT, no complete nitrification
was achieved in the MBR. The high ammonium percentage in the permeate on day 102 is
explained by an accidental pH-shock (overnight drop to pH 2) on day 89. Apparently, it had a
lasting effect on the nitrifying population so that even 13 days afterwards no nitrification
could be observed and practically all nitrogen (97%) in the permeate was present as
ammonium.
Anionic surfactant concentration was reduced by 97% to a concentration of 13 µgL-1
in the
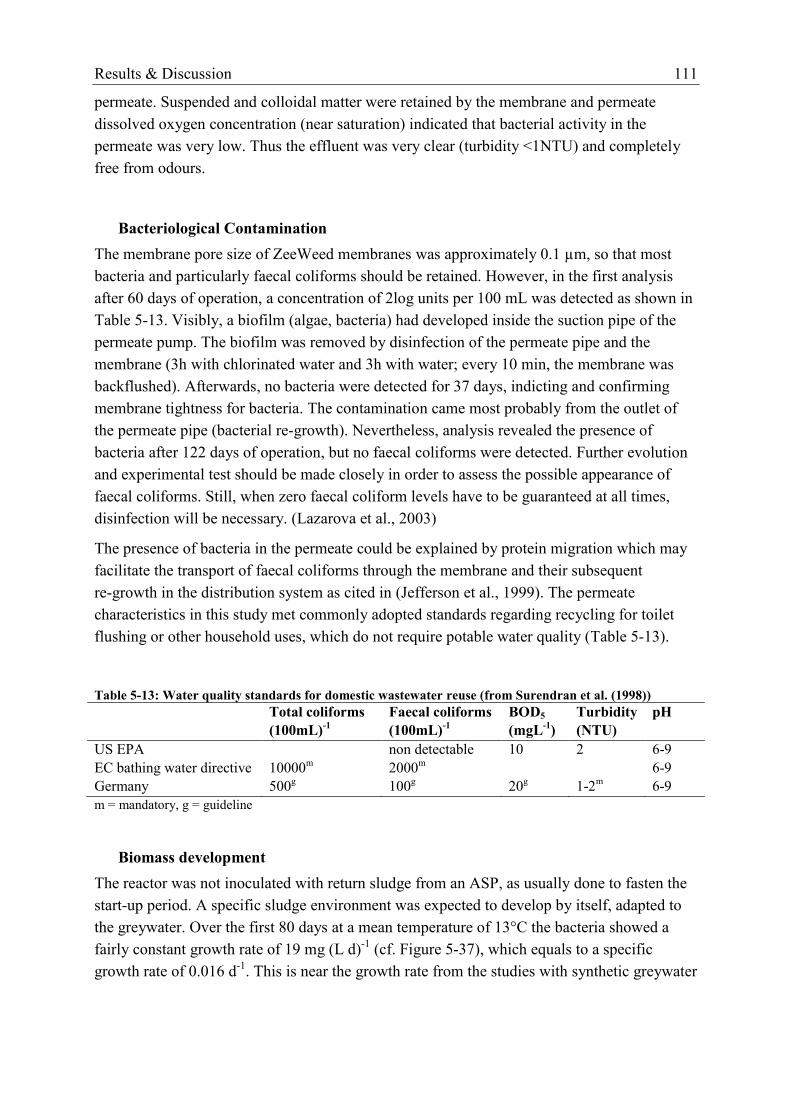
Results & Discussion 111
permeate. Suspended and colloidal matter were retained by the membrane and permeate
dissolved oxygen concentration (near saturation) indicated that bacterial activity in the
permeate was very low. Thus the effluent was very clear (turbidity <1NTU) and completely
free from odours.
Bacteriological Contamination
The membrane pore size of ZeeWeed membranes was approximately 0.1 µm, so that most
bacteria and particularly faecal coliforms should be retained. However, in the first analysis
after 60 days of operation, a concentration of 2log units per 100 mL was detected as shown in
Table 5-13. Visibly, a biofilm (algae, bacteria) had developed inside the suction pipe of the
permeate pump. The biofilm was removed by disinfection of the permeate pipe and the
membrane (3h with chlorinated water and 3h with water; every 10 min, the membrane was
backflushed). Afterwards, no bacteria were detected for 37 days, indicting and confirming
membrane tightness for bacteria. The contamination came most probably from the outlet of
the permeate pipe (bacterial re-growth). Nevertheless, analysis revealed the presence of
bacteria after 122 days of operation, but no faecal coliforms were detected. Further evolution
and experimental test should be made closely in order to assess the possible appearance of
faecal coliforms. Still, when zero faecal coliform levels have to be guaranteed at all times,
disinfection will be necessary. (Lazarova et al., 2003)
The presence of bacteria in the permeate could be explained by protein migration which may
facilitate the transport of faecal coliforms through the membrane and their subsequent
re-growth in the distribution system as cited in (Jefferson et al., 1999). The permeate
characteristics in this study met commonly adopted standards regarding recycling for toilet
flushing or other household uses, which do not require potable water quality (Table 5-13).
Table 5-13: Water quality standards for domestic wastewater reuse (from Surendran et al. (1998))
Total coliforms
(100mL)-1
Faecal coliforms
(100mL)-1
BOD5
(mgL-1
)
Turbidity
(NTU)
pH
US EPA non detectable 10 2 6-9
EC bathing water directive 10000m 2000
m 6-9
Germany 500g 100
g 20
g 1-2
m 6-9
m = mandatory, g = guideline
Biomass development
The reactor was not inoculated with return sludge from an ASP, as usually done to fasten the
start-up period. A specific sludge environment was expected to develop by itself, adapted to
the greywater. Over the first 80 days at a mean temperature of 13°C the bacteria showed a
fairly constant growth rate of 19 mg (L d)-1
(cf. Figure 5-37), which equals to a specific
growth rate of 0.016 d-1
. This is near the growth rate from the studies with synthetic greywater
112 Results & Discussion
carried out with set-up B and set-up C. There, values between 19 and 25 mg (L d)-1
were
found at a mean average temperature of 15°C, although the specific growth rate for set-up C
and B is lower by a factor of 10 and is calculated to 0.002 d-1
and 0.004, respectively.
Figure 5-37: Evolution of total and volatile suspended solids in the MBR
After a pH-shock in the lab-scale MBR, which destroyed nearly 25% of the biomass, a quick
recovery with a growth rate of 35 mg (L d)-1
, which equals to a specific growth rate of
0.023 d-1
, was observed. One reason for the quicker development could be the higher average
temperature (18°C) in the reactor at that time, because all other conditions stayed constant.
Another hypothesis could be that due to the death of the slow growing nitrifiers a selection
advantage for faster growing organisms was given.
Above 1.3 gVSSL-1
biomass stayed nearly constant. This indicates that at an average F/M ratio
of 0.12 gCOD(gVSS d)-1
substrate was almost exclusively consumed by endogenous respiration.
Average F/M-ratios for MBR treating municipal wastewater can be even below
0.12 gCOD(gVSS d)-1
for systems with a low sludge yield. This is advantageous with respect to
waste generation and can be seen as one of the key advantages of MBR (Judd, 2006).
During the time of operation the suspended organic solids (VSS) increased due to biomass
development, but their relative contribution to the total suspended solids (TSS) stayed almost
constant. After a slight initial increase the VSS/TSS-ratio stabilised at 76% indicating that
about one fourth of the TSS in the reactor was particulate inorganic as shown in Figure 5-37.
No accumulation of external inorganic matter took place in the system, because the
augmentation was due to particulate inorganics arising from biomass decay.
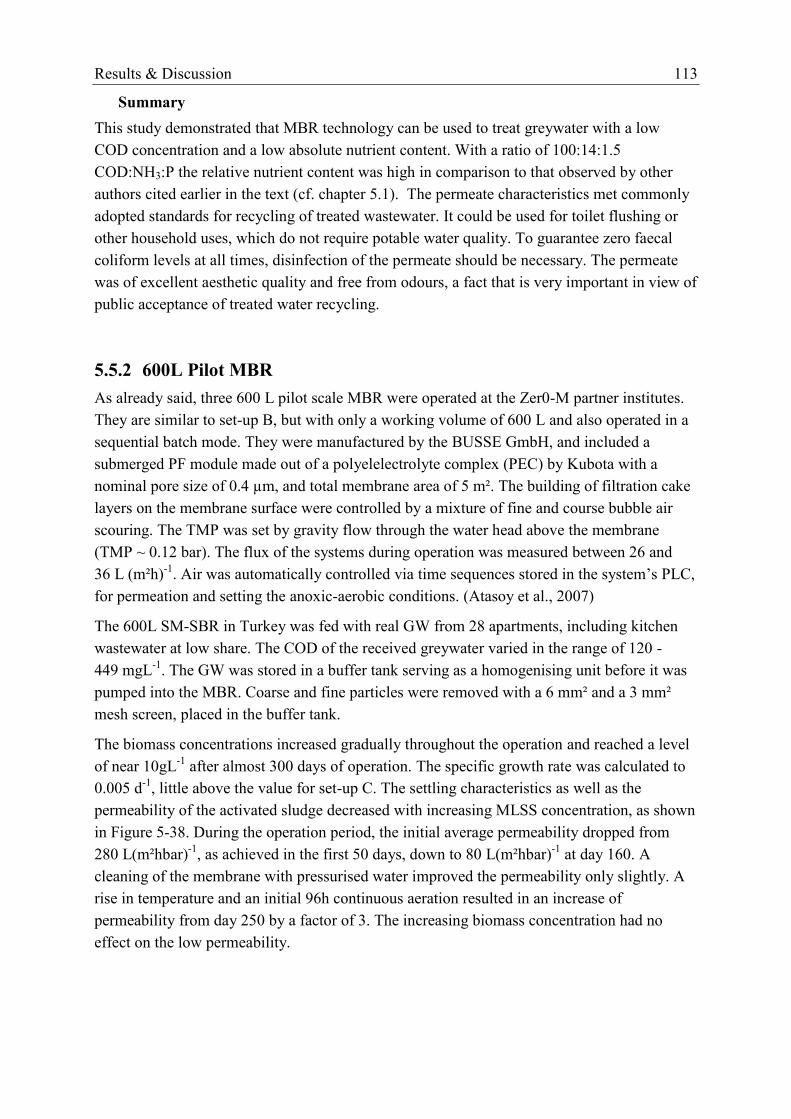
Results & Discussion 113
Summary
This study demonstrated that MBR technology can be used to treat greywater with a low
COD concentration and a low absolute nutrient content. With a ratio of 100:14:1.5
COD:NH3:P the relative nutrient content was high in comparison to that observed by other
authors cited earlier in the text (cf. chapter 5.1). The permeate characteristics met commonly
adopted standards for recycling of treated wastewater. It could be used for toilet flushing or
other household uses, which do not require potable water quality. To guarantee zero faecal
coliform levels at all times, disinfection of the permeate should be necessary. The permeate
was of excellent aesthetic quality and free from odours, a fact that is very important in view of
public acceptance of treated water recycling.
5.5.2 600L Pilot MBR
As already said, three 600 L pilot scale MBR were operated at the Zer0-M partner institutes.
They are similar to set-up B, but with only a working volume of 600 L and also operated in a
sequential batch mode. They were manufactured by the BUSSE GmbH, and included a
submerged PF module made out of a polyelelectrolyte complex (PEC) by Kubota with a
nominal pore size of 0.4 µm, and total membrane area of 5 m². The building of filtration cake
layers on the membrane surface were controlled by a mixture of fine and course bubble air
scouring. The TMP was set by gravity flow through the water head above the membrane
(TMP ~ 0.12 bar). The flux of the systems during operation was measured between 26 and
36 L (m²h)-1
. Air was automatically controlled via time sequences stored in the system’s PLC,
for permeation and setting the anoxic-aerobic conditions. (Atasoy et al., 2007)
The 600L SM-SBR in Turkey was fed with real GW from 28 apartments, including kitchen
wastewater at low share. The COD of the received greywater varied in the range of 120 -
449 mgL-1
. The GW was stored in a buffer tank serving as a homogenising unit before it was
pumped into the MBR. Coarse and fine particles were removed with a 6 mm² and a 3 mm²
mesh screen, placed in the buffer tank.
The biomass concentrations increased gradually throughout the operation and reached a level
of near 10gL-1
after almost 300 days of operation. The specific growth rate was calculated to
0.005 d-1
, little above the value for set-up C. The settling characteristics as well as the
permeability of the activated sludge decreased with increasing MLSS concentration, as shown
in Figure 5-38. During the operation period, the initial average permeability dropped from
280 L(m²hbar)-1
, as achieved in the first 50 days, down to 80 L(m²hbar)-1
at day 160. A
cleaning of the membrane with pressurised water improved the permeability only slightly. A
rise in temperature and an initial 96h continuous aeration resulted in an increase of
permeability from day 250 by a factor of 3. The increasing biomass concentration had no
effect on the low permeability.
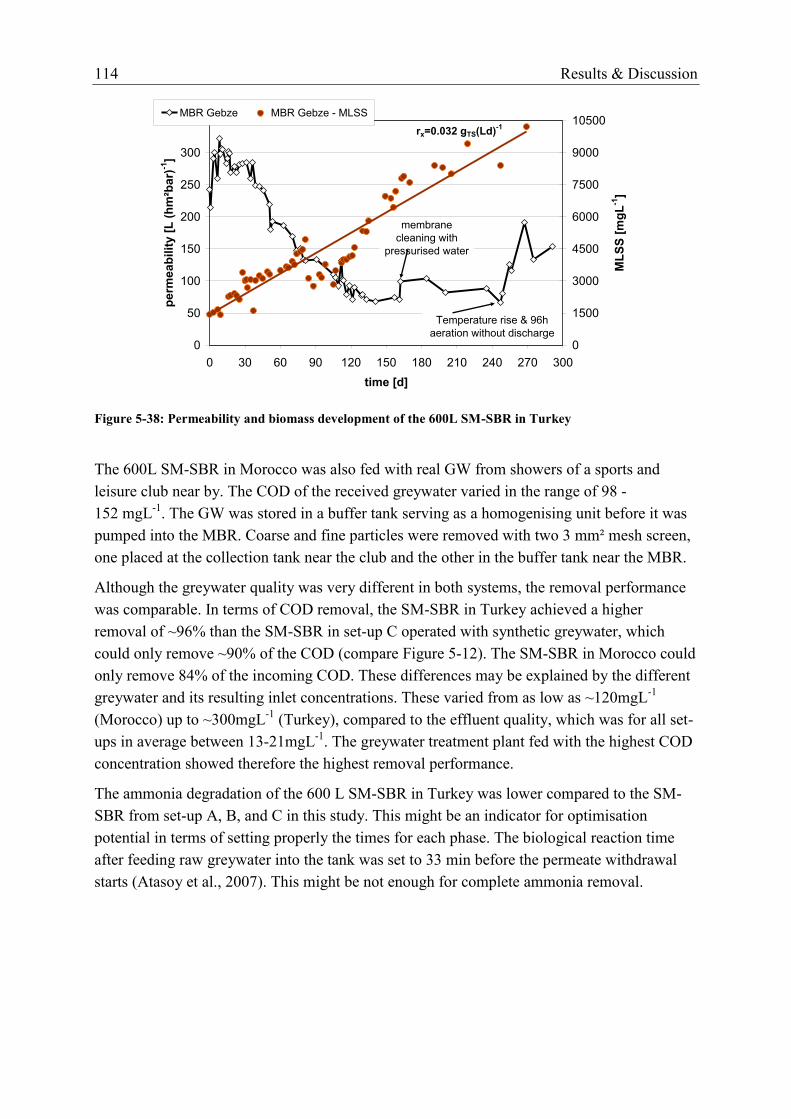
114 Results & Discussion
0
50
100
150
200
250
300
350
0 30 60 90 120 150 180 210 240 270 300
time [d]
pe
rme
ab
ilit
y [
L (
hm
²ba
r)-1
]
0
1500
3000
4500
6000
7500
9000
10500
ML
SS
[m
gL
-1]
MBR Gebze MBR Gebze - MLSS
Temperature rise & 96h
aeration without discharge
membrane
cleaning with
pressurised water
rx=0.032 gTS(Ld)-1
Figure 5-38: Permeability and biomass development of the 600L SM-SBR in Turkey
The 600L SM-SBR in Morocco was also fed with real GW from showers of a sports and
leisure club near by. The COD of the received greywater varied in the range of 98 -
152 mgL-1
. The GW was stored in a buffer tank serving as a homogenising unit before it was
pumped into the MBR. Coarse and fine particles were removed with two 3 mm² mesh screen,
one placed at the collection tank near the club and the other in the buffer tank near the MBR.
Although the greywater quality was very different in both systems, the removal performance
was comparable. In terms of COD removal, the SM-SBR in Turkey achieved a higher
removal of ~96% than the SM-SBR in set-up C operated with synthetic greywater, which
could only remove ~90% of the COD (compare Figure 5-12). The SM-SBR in Morocco could
only remove 84% of the incoming COD. These differences may be explained by the different
greywater and its resulting inlet concentrations. These varied from as low as ~120mgL-1
(Morocco) up to ~300mgL-1
(Turkey), compared to the effluent quality, which was for all set-
ups in average between 13-21mgL-1
. The greywater treatment plant fed with the highest COD
concentration showed therefore the highest removal performance.
The ammonia degradation of the 600 L SM-SBR in Turkey was lower compared to the SM-
SBR from set-up A, B, and C in this study. This might be an indicator for optimisation
potential in terms of setting properly the times for each phase. The biological reaction time
after feeding raw greywater into the tank was set to 33 min before the permeate withdrawal
starts (Atasoy et al., 2007). This might be not enough for complete ammonia removal.
Results & Discussion 115
0
20
40
60
80
100
COD TSS NH4-N
Re
mo
va
l E
ffic
ien
cy
[%
]
SM
-SB
R
Tu
rke
y
SM
-SB
R
Mo
roc
co
SM
-SB
R
Tu
rke
y
SM
-SB
R
Mo
roc
co
SM
-SB
R
Tu
rke
y
SM
-SB
R
Mo
roc
co
Figure 5-39: Removal efficiency of the pilot plants treating real greywater with its standard derivation
The MBR performance data reported generally refer to domestic wastewater treatment. There
are very few studies with detailed results of greywater treatment with an MBR. A pilot scale
study carried out by Lesjean and Gnirrs (2006) showed >85% COD, >80% TKN, and 99%
TSS removal performance for grey water generated from bathrooms and kitchens. It was
reported by Merz et al. (2007), that 85% COD, 63% TKN, and 94% BOD removal were
achieved by laboratory-scale MBR treatment of grey water generated form sport club
showers. The results from the above mentioned studies carried out by the Zer0-M project
team proved the technical feasibility of greywater treatment with membrane technology. Yet,
an important drawback remains: each treatment system has to be judged separately due to the
variations in greywater composition. If flux cannot be maintained at a high level, the required
membrane area must be increased and the associated costs will be high. However, in cases of
space limitation like e.g. in hotels or leisure clubs, the small footprint of the MBR can
compensate these inconveniences.

116 Development of a Mathematical Model
6 Process Description with a Mathematical Model
The increasingly stricter nitrogen and phosphorus limits on wastewater discharges have
stimulated studies on both:
understanding and modelling of the behaviour of activated sludge process, and
developing and improving the single sludge biological nutrient removal process
configurations.
With its intrinsic flexibility the modern SBR enjoys a gradually widening application, and is
subject to extensive research for a better comprehension and exploitation of the offered
advantages. Nevertheless, the influence of variable operation conditions or variable influent
concentrations should not affect the desired effluent quality. Therefore, a model can help to
understand, define and manipulate a performance evaluation as well as a prediction of the
desired design.
There are two main approaches to develop process models. The first one is based on empirical
data, and the second is based on the underlying physics and chemistry governing the
behaviour of the process. With the empirical models, such as lab scale or pilot scale reactors,
enough data can be collected from the process, but usually these data are site specific. Even if
a correlation structure between variables can be gained and maximised with the help of a
numerical technique, much depends on the availability of representative data for model
building. It is difficult to find parameters for the structure among the data and to validate them
against an artificial data set. Maybe many trial and error approaches need to be adopted,
before achieving a more general conclusion.
The development of mechanistic models uses fundamental knowledge of the interactions
between process variables to define the model structure. Different experiments need to be
performed to determine the parameters of the model independently, which can be very time
consuming. Numerical techniques can be applied to parameterise the model. In this case,
although the structure has been determined from process knowledge, the modelling procedure
becomes an empirical one. The numerical techniques in use are very different from those
usually encountered in purely empirical modelling. They tend to be iterative and more
complex. In general the mechanistic models can provide a more realistic prediction of the
process. Thus, while mechanistic models are used to design processes, empirical models are
frequently used as the basis for process controllers. The point is that model based controllers
only require the models to represent the trends in process behaviour with less accuracy.
Conservative tuning, together with the feedback mechanism are usually sufficient enough to
overcome any inaccuracies.
Another comparison can be made between the two modelling approaches when the focus is on
costs. Due to the complexity of many processes, mechanistic modelling is indeed very
expensive in terms of human effort and expertise. As the mechanistic modelling approach
forces a detailed examination of fundamental process behaviour, some of the cost can be
Development of a Mathematical Model 117
recovered in terms of increased ‘deep’ knowledge of process behaviour. On the other hand,
empirical models can be expensive as well, because they require large amounts of
‘representative’ data. The advantage with empirical modelling lies in the fact that empirical
modelling will deliver a form of working model in a much shorter time. The consequence is
that the question: “What is the purpose/ the usage of the model?” must be answered before
handed. If it is to design control algorithms, then an empirical model will serve, but if there is
a need to design a new process; or to trouble-shoot a process that is behaving poorly; or to
point towards fundamental improvements in process operability, then it is best to develop a
mechanistic model.
To describe the activated sludge process for biological treatment of wastewater, the first
mechanistic models were proposed in the sixties of the last century by McKinney, 1962 and
Jenkins and Garrison, 1968. The breakthrough came with the work of G. v. R. Marais,
G. A. Ekama and P. L. Dold. They described the activated sludge process in steady state
(Marais and Ekama, 1976), investigated the dynamic behaviour (Ekama and Marais, 1979)
and came up with the first general model, while identifying different COD fractions (Dold et
al., 1980). The work by the IAWPRC (later IAWQ and now IWA) task group on
mathematical modelling for design and operation of biological wastewater treatment
processes, which started in 1983, improved the model and lead over the years to the different
activated sludge models ASM1, ASM2, ASM2d and ASM3 (Henze et al., 2000).
Biological wastewater treatment involves a wide spectrum of biochemical reactions adopted
in different appropriate sequences of anaerobic, anoxic and aerobic conditions. The number of
processes during operation of the SM-SBR, the specific hydraulic behaviour of an SBR and
the number of compounds in the synthetic greywater make it mandatory to use a modelling
tool to predict the effluent quality and to specify accurate design criteria. This chapter aims to
develop and propose a simplified mechanistic model for nutrient removal in greywater
treatment with a membrane coupled SBR, based on the ASM 3 and relying on the relevant
principles of process stoichiometry and modelling.
6.1 Description of the Mathematical Model
As described earlier, the backbone of the activated sludge model is a matrix, which reflects
the stoichiometric relationship and which corresponds to the involved processes and
compounds. With increasing complexity of interactions and with a deeper understanding of
the biochemical process, the process rate equations become more and more difficult.
In the derived model the kinetic expressions are based on hyperbolic terms, Monod based
equations, and Michaelis-Menten based equations. They are called switching functions for
mathematical convenience: all biological processes are stopped when the educt concentration
reaches zero. Inhibition is modelled as 1-S/(Km+S) = Km/(Km+S).
The activated sludge model No. 3 (ASM 3, (Henze et al., 2000)) is selected as basis for the
derivation of an own mathematical model and therefore simplified, but also extended with a

118 Development of a Mathematical Model
two-step nitrification, as done by Manser et al. (2006), to enable separate modelling of
ammonia and nitrite oxidation. Denitrification is a single step process (NOx N2), neglecting
the possible intermediate of nitrite, whereas the nitrification is simulated as a two step process
(NH4 NO2 NO3). Ammonia is oxidised to nitrite as the first step, and further nitrite is
oxidised to nitrate in a second step. This approach is made necessary to predict possible nitrite
accumulation (Brouwer et al., 1998; Nowak et al., 1995). The loss of activity associated with
the loss of bacteria is modelled as a single process (endogenous respiration), but individually
for each group of bacteria, as well as separately for the anoxic and aerated phase.
The model includes seven soluble compounds (dissolved oxygen, ammonia, nitrite, nitrate,
organic nitrogen, rbCOD, and stored soluble COD) and three particulate compounds
(heterotrophic biomass, autotrophic biomass, and sbCOD). Concentration of soluble
compounds are characterised by “S”, and particulate compounds by “X”. The soluble fraction
can only be transported by water and carry ionic charge. The particulate fraction can be
assumed to be the activated sludge, capable of sedimentation in the clarifier or retained by the
membrane in the process. The stoichiometric and kinetic parameter values are given in the
known ASM matrix vji in the Table 6-1 to display the process in the SM-SBR.
Cell internal or external storage products are not identified separately in batch tests, although
they play an important role in this model, because growth of heterotrophic bacteria is based
on the stored substrate only. Therefore, the amount of storage products comes from the
hydrolysis and from the storage of readily biodegradable compounds (SS). Hydrolysis is the
necessary step for uptake of slowly biodegradable compounds (XS) into the cells.
The following soluble compounds are identified and used in the model.
dissolved oxygen SDO, which can be directly measured in the reactor
readily biodegradable organic substrates SS, which is directly stored and which can
be determinate with the help of respiration tests
stored substrate SSTO, which comes from hydrolysis of XS and from storage of SS
and is directly available for consumption by the heterotrophic organisms
ammonia nitrogen SNH4, which is assumed to be NH4+ for the balance of the ionic
charges and is equivalent to the observed concentrations in the reactor and in the
effluent
nitrate SNO3 and nitrite SNO2, as single compounds, because nitrification cycle
analysis show the production of nitrite
organic nitrogen SorgN (mainly urea of the synthetic wastewater), which is
transformed into ammonia during the anoxic phase
The following particulate compounds are identified and used in the model.
slowly biodegradable substrate XS, which is substrate of high molecular weight and
which must undergo an external cell hydrolysis before degradation
heterotrophic organism XBH, which is the quantitatively biggest group of organism
in the activated sludge and capable of growth under aerobic and anoxic conditions as
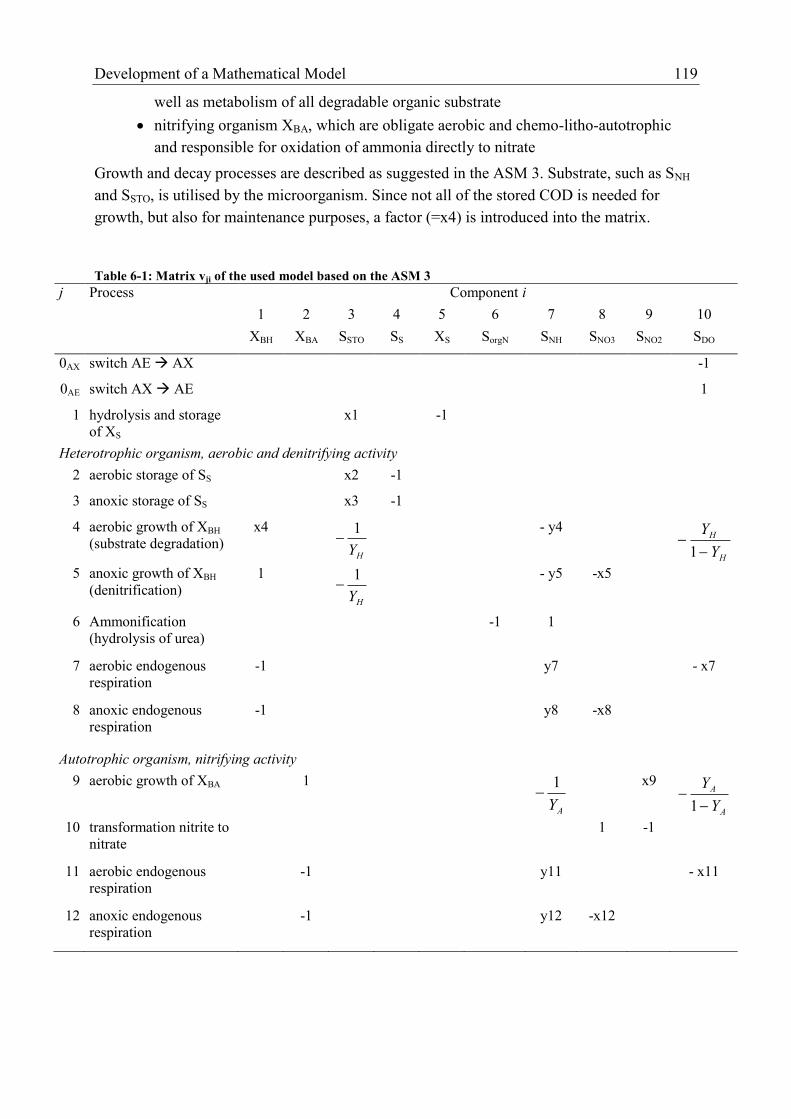
Development of a Mathematical Model 119
well as metabolism of all degradable organic substrate
nitrifying organism XBA, which are obligate aerobic and chemo-litho-autotrophic
and responsible for oxidation of ammonia directly to nitrate
Growth and decay processes are described as suggested in the ASM 3. Substrate, such as SNH
and SSTO, is utilised by the microorganism. Since not all of the stored COD is needed for
growth, but also for maintenance purposes, a factor (=x4) is introduced into the matrix.
Table 6-1: Matrix vji of the used model based on the ASM 3
j Process Component i
1 2 3 4 5 6 7 8 9 10
XBH XBA SSTO SS XS SorgN SNH SNO3 SNO2 SDO
0AX switch AE AX -1
0AE switch AX AE 1
1 hydrolysis and storage
of XS
x1 -1
Heterotrophic organism, aerobic and denitrifying activity
2 aerobic storage of SS x2 -1
3 anoxic storage of SS x3 -1
4 aerobic growth of XBH
(substrate degradation)
x4
HY
1
- y4
H
H
Y
Y
1
5 anoxic growth of XBH
(denitrification)
1
HY
1
- y5 -x5
6 Ammonification
(hydrolysis of urea)
-1 1
7 aerobic endogenous
respiration
-1 y7 - x7
8 anoxic endogenous
respiration
-1 y8 -x8
Autotrophic organism, nitrifying activity
9 aerobic growth of XBA 1
AY
1
x9
A
A
Y
Y
1
10 transformation nitrite to
nitrate
1 -1
11 aerobic endogenous
respiration
-1 y11 - x11
12 anoxic endogenous
respiration
-1 y12 -x12

120 Development of a Mathematical Model
All empty elements of vij indicate values of zero. All values of xj and yj can be calculated
using equation (6-1).
j
jiji pvr (6-1)
where:
ri: observation conversation rate;
vij: stoichiometric matrix;
pj: process rate
Furthermore it is known that the biochemical energy yield in form of ATP of the anoxic
respiration is smaller than in aerobic respiration. The following energy relationship can be
applied, assuming anoxic = 0.60 - 0.70 of the aerobic energy yield:
x
x
NOH
NOH
anoxic
OH
OH
Y
Y
Y
Y
,
,
,
, 11
2
2
(6-2)
The model includes only microbiological transformation processes. The 12 different
processes and their kinetic rates are shown in Table 6-2. The process number 0 serves only as
a switch to simulate the aeration when changing from anoxic to the aerated phase and back to
the anoxic. The heterotrophic organisms grow on the available stored substrate under aerobic
conditions as well as under anoxic condition, where the respiration is based on denitrification.
According to the ASM3, the anoxic reduction factor in this model is set to NOX = 0.6 to meet
the fact that only a fraction of the heterotrophic biomass in the activated sludge is capable of
denitrification. Endogenous respiration describes all forms of biomass loss and energy
requirements not associated with growth, like decay, lysis, predation, death and so on. The
process takes place under aerobic conditions as well as under anoxic conditions and must be
referred to both groups of organisms: autotrophic and heterotrophic.
Table 6-2: Kinetic rate expression of the used model
j Process Process Rate
0AX switch AE
AX
DODO
DO
DOSK
Sk
0AE switch AX
AE DO
saturation
DOL SSak with kLa of sludge
1 hydrolysis and
storage of XS BH
BH
S
h
BH
S
h X
X
XK
X
X
k

Development of a Mathematical Model 121
Table 6-2: Kinetic rate expression of the used model (cont.)
j Process Process Rate
Heterotrophic organism, aerobic and denitrifying activity
2 aerobic storage
of SS BH
ss
s
DODO
DO
sto XSK
S
SK
Sk
3 anoxic storage
of SS BH
NOxNOx
NOx
ss
s
DODO
DO
AXsto XSK
S
SK
S
SK
Kk
4
aerobic growth
of XBH
(substrate
degradation)
BH
NHNH
NH
BH
STOSTO
BH
STO
DODO
DOH X
SK
S
X
SK
X
S
SK
Sµ
5
anoxic growth
of XBH
(denitrification) BH
NOxNOx
NOx
NHNH
NH
BH
STOSTO
BH
STO
DODO
DOAXH X
SK
S
SK
S
X
SK
X
S
SK
Kµ
6
Ammonification
(hydrolysis of
urea) BH
orgNorgN
orgN
orgN XSK
Sk
7
aerobic
endogenous
respiration BH
DODO
DO
DOHd XSK
Sk
)(,
8
anoxic
endogenous
respiration BH
NOxNOx
NOx
DODO
DO
NOxHd XSK
S
SK
Kk
)(,
Autotrophic organism, nitrifying activity
9 aerobic growth
of XBA BA
NHNHA
NH
DODOA
DOA X
SK
S
SK
Sµ
,,
10 transformation
nitrite to nitrate BA
NOxNOxA
NOx
DODOA
DONOxA X
SK
S
SK
Sk
,,
,
11
aerobic
endogenous
respiration BA
DODOA
DODOAd X
SK
Sk
,
)(,
12
anoxic
endogenous
respiration BA
NOxNOxA
NOx
DODOA
DOA
NOxAd XSK
S
SK
Kk
,,
,
)(,
Based on the matrix vij and on the process rates j, the following mass balances during the
anoxic phase (cf. Table 6-3) and during the aerated phase (cf. Table 6-4) for each compound
can be identified.
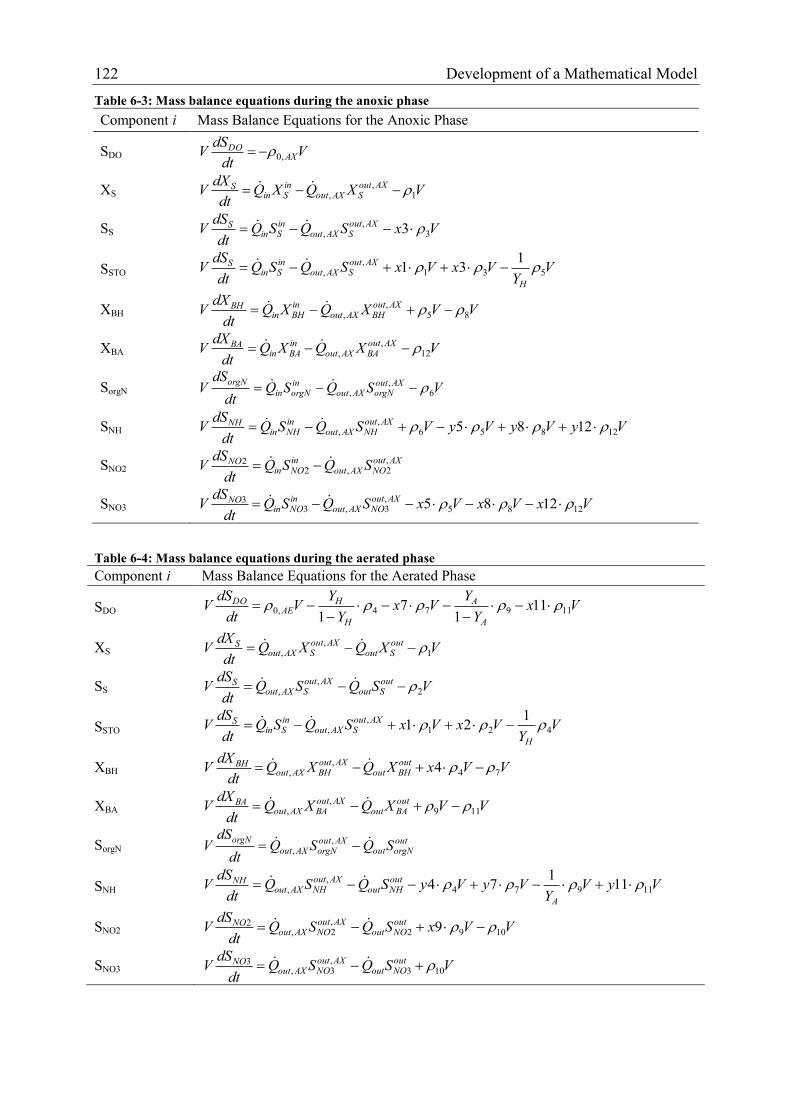
122 Development of a Mathematical Model
Table 6-3: Mass balance equations during the anoxic phase
Component i Mass Balance Equations for the Anoxic Phase
SDO Vdt
dSV AX
DO,0
XS VXQXQdt
dXV AXout
SAXoutinSin
S1
,,
SS VxSQSQdt
dSV AXout
SAXoutinSin
S3
,, 3
SSTO VY
VxVxSQSQdt
dSV
H
AXoutSAXout
inSin
S531
,,
131
XBH VVXQXQdt
dXV AXout
BHAXoutinBHin
BH85
,,
XBA VXQXQdt
dXV AXout
BAAXoutinBAin
BA12
,,
SorgN VSQSQdt
dSV AXout
orgNAXoutinorgNin
orgN
6,
,
SNH VyVyVyVSQSQdt
dSV AXout
NHAXoutinNHin
NH12856
,, 1285
SNO2 AXout
NOAXoutinNOin
NO SQSQdt
dSV ,
2,22
SNO3 VxVxVxSQSQdt
dSV AXout
NOAXoutinNOin
NO1285
,3,3
3 1285
Table 6-4: Mass balance equations during the aerated phase
Component i Mass Balance Equations for the Aerated Phase
SDO VxY
YVx
Y
YV
dt
dSV
A
A
H
HAE
DO11974,0 11
17
1
XS VXQXQdt
dXV out
SoutAXout
SAXoutS
1,
,
SS VSQSQdt
dSV out
SoutAXout
SAXoutS
2,
,
SSTO VY
VxVxSQSQdt
dSV
H
AXoutSAXout
inSin
S421
,,
121
XBH VVxXQXQdt
dXV out
BHoutAXout
BHAXoutBH
74,
, 4
XBA VVXQXQdt
dXV out
BAoutAXout
BAAXoutBA
119,
,
SorgN outorgNout
AXoutorgNAXout
orgNSQSQ
dt
dSV ,
,
SNH VyVY
VyVySQSQdt
dSV
A
outNHout
AXoutNHAXout
NH11974
,, 11
174
SNO2 VVxSQSQdt
dSV out
NOoutAXout
NOAXoutNO
1092,2,
2 9
SNO3 VSQSQdt
dSV out
NOoutAXout
NOAXoutNO
103,3,
3
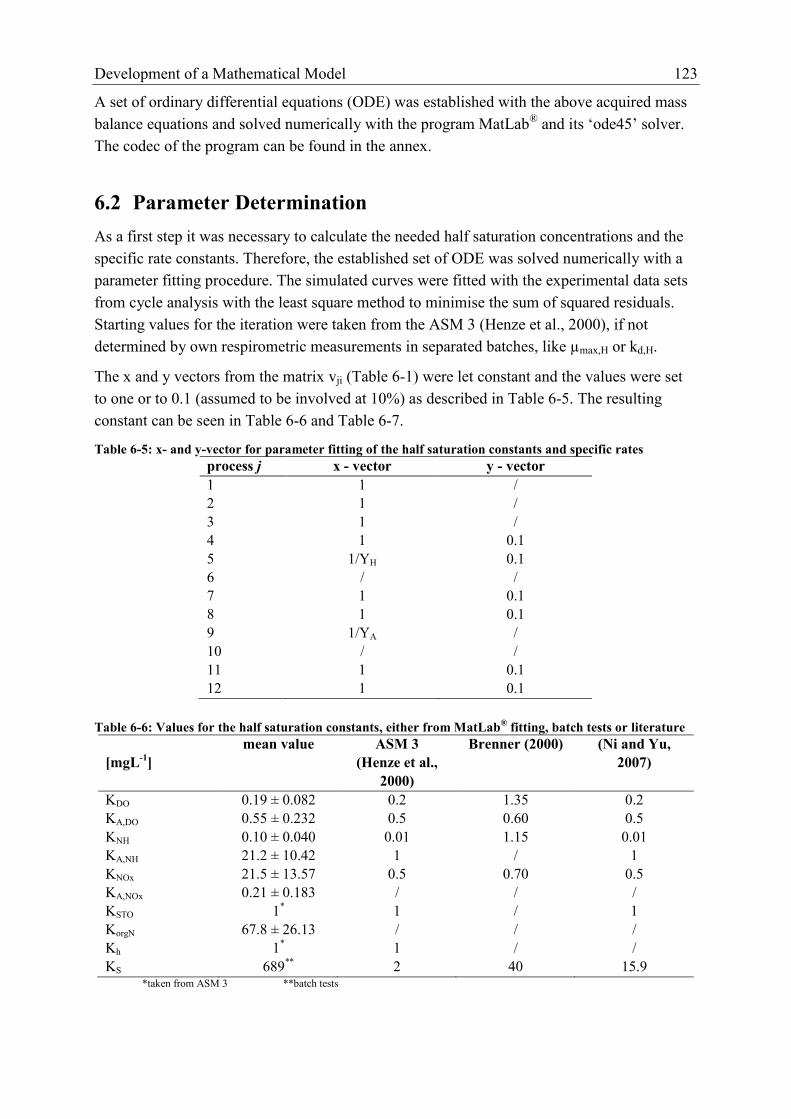
Development of a Mathematical Model 123
A set of ordinary differential equations (ODE) was established with the above acquired mass
balance equations and solved numerically with the program MatLab® and its ‘ode45’ solver.
The codec of the program can be found in the annex.
6.2 Parameter Determination
As a first step it was necessary to calculate the needed half saturation concentrations and the
specific rate constants. Therefore, the established set of ODE was solved numerically with a
parameter fitting procedure. The simulated curves were fitted with the experimental data sets
from cycle analysis with the least square method to minimise the sum of squared residuals.
Starting values for the iteration were taken from the ASM 3 (Henze et al., 2000), if not
determined by own respirometric measurements in separated batches, like µmax,H or kd,H.
The x and y vectors from the matrix vji (Table 6-1) were let constant and the values were set
to one or to 0.1 (assumed to be involved at 10%) as described in Table 6-5. The resulting
constant can be seen in Table 6-6 and Table 6-7.
Table 6-5: x- and y-vector for parameter fitting of the half saturation constants and specific rates
process j x - vector y - vector
1 1 /
2 1 /
3 1 /
4 1 0.1
5 1/YH 0.1
6 / /
7 1 0.1
8 1 0.1
9 1/YA /
10 / /
11 1 0.1
12 1 0.1
Table 6-6: Values for the half saturation constants, either from MatLab® fitting, batch tests or literature
[mgL-1
]
mean value ASM 3
(Henze et al.,
2000)
Brenner (2000) (Ni and Yu,
2007)
KDO 0.19 ± 0.082 0.2 1.35 0.2
KA,DO 0.55 ± 0.232 0.5 0.60 0.5
KNH 0.10 ± 0.040 0.01 1.15 0.01
KA,NH 21.2 ± 10.42 1 / 1
KNOx 21.5 ± 13.57 0.5 0.70 0.5
KA,NOx 0.21 ± 0.183 / / /
KSTO
1* 1 / 1
KorgN 67.8 ± 26.13 / / /
Kh 1* 1 / /
KS 689**
2 40 15.9 *taken from ASM 3 **batch tests

124 Development of a Mathematical Model
Table 6-7: Values for the specific rates, either from MatLab® fitting, batch tests or literature
[d-1
]
mean value ASM 3
(Henze et al.,
2000)
Brenner (2000) (Ni and Yu,
2007)
korgN 12.0 ± 6.85 (set-up C)
1 (set-up A and B)
/
/
/
/
/
/
kd,H 0.42 ± 0.14**
0.2 0.40 0.38
kd,A 0.15* 0.15 0.13 0.15
kh 1.07**
3 8 /
kSTO
689***
5 / 5.04 *taken from ASM 3 ** batch tests ***fixed manually
Attention should be paid to the high value for KA,NH compared with the value given in the
ASM 3. The other saturation concentration of KorgN and KNOx are high as well, but all three
parameters correspond with the high µmax rate calculated from the batches. The reason for the
high specific storage rate is the high KS value, determined during batch experiments. A high
storage rate kSTO represents the COD removal measured in the cycle analysis, because a low
kSTO would mean that COD degradation is only due to hydrolysis of XS. This would mean that
an uptake of SS could not be accomplished.
In a second step, the mean values for the constants and rates are used to fit the x- and y-
sectors. The results are presented in Table 6-8 and compared among example values taken
from the ASM 3 (Henze et al., 2000).
Table 6-8: x- and y-vector for parameter fitting of the half saturation constants and specific rates
process j x - vector y - vector
own study ASM 3 own study ASM 3
1 1.30 ± 0.259 / / /
2 1.18 ± 0.117 0.85 / /
3 1.16 ± 0.189 0.80 / /
4 0.53 ± 0.026 1 0.08 ± 0.012 0.07
5 7.04 ± 1.851 0.30 0.09 ± 0.021 0.07
6 / / / /
7 0.90 ± 0.071 0.80 0.07 ± 0.002 0.066
8 0.34 ± 0.046 0.28 0.05 ± 0.026 0.066
9 4.26 ± 0.397 1/YA / /
10 / / / /
11 0.93 ± 0.122 0.80 0.07 ± 0.006 0.066
12 0.25 ± 0.138 0.28 0.06 ± 0.021 0.066
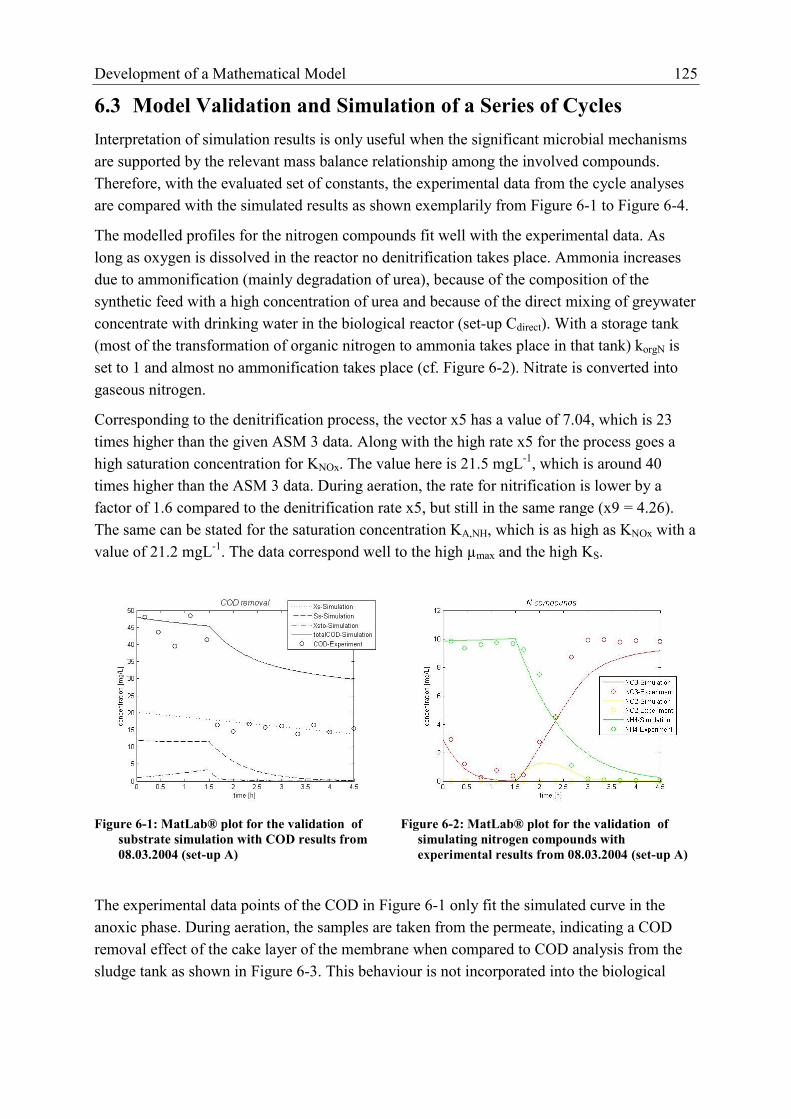
Development of a Mathematical Model 125
6.3 Model Validation and Simulation of a Series of Cycles
Interpretation of simulation results is only useful when the significant microbial mechanisms
are supported by the relevant mass balance relationship among the involved compounds.
Therefore, with the evaluated set of constants, the experimental data from the cycle analyses
are compared with the simulated results as shown exemplarily from Figure 6-1 to Figure 6-4.
The modelled profiles for the nitrogen compounds fit well with the experimental data. As
long as oxygen is dissolved in the reactor no denitrification takes place. Ammonia increases
due to ammonification (mainly degradation of urea), because of the composition of the
synthetic feed with a high concentration of urea and because of the direct mixing of greywater
concentrate with drinking water in the biological reactor (set-up Cdirect). With a storage tank
(most of the transformation of organic nitrogen to ammonia takes place in that tank) korgN is
set to 1 and almost no ammonification takes place (cf. Figure 6-2). Nitrate is converted into
gaseous nitrogen.
Corresponding to the denitrification process, the vector x5 has a value of 7.04, which is 23
times higher than the given ASM 3 data. Along with the high rate x5 for the process goes a
high saturation concentration for KNOx. The value here is 21.5 mgL-1
, which is around 40
times higher than the ASM 3 data. During aeration, the rate for nitrification is lower by a
factor of 1.6 compared to the denitrification rate x5, but still in the same range (x9 = 4.26).
The same can be stated for the saturation concentration KA,NH, which is as high as KNOx with a
value of 21.2 mgL-1
. The data correspond well to the high µmax and the high KS.
Figure 6-1: MatLab® plot for the validation of
substrate simulation with COD results from
08.03.2004 (set-up A)
Figure 6-2: MatLab® plot for the validation of
simulating nitrogen compounds with
experimental results from 08.03.2004 (set-up A)
The experimental data points of the COD in Figure 6-1 only fit the simulated curve in the
anoxic phase. During aeration, the samples are taken from the permeate, indicating a COD
removal effect of the cake layer of the membrane when compared to COD analysis from the
sludge tank as shown in Figure 6-3. This behaviour is not incorporated into the biological
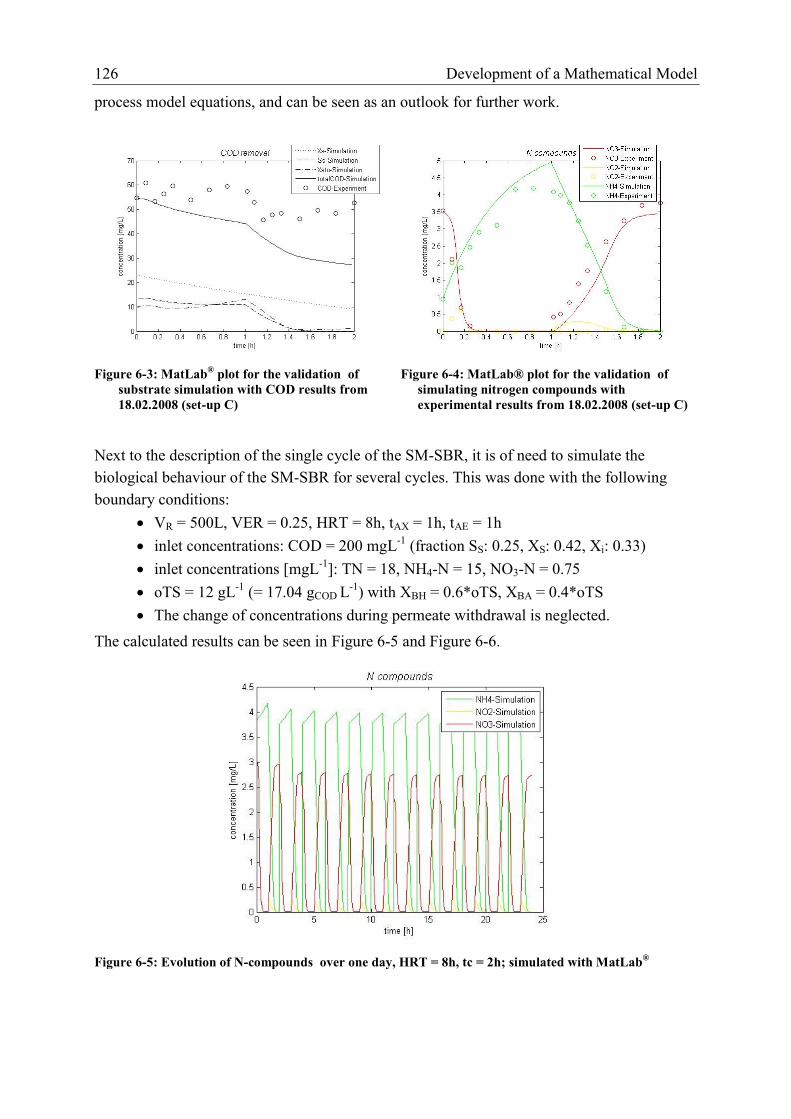
126 Development of a Mathematical Model
process model equations, and can be seen as an outlook for further work.
Figure 6-3: MatLab® plot for the validation of
substrate simulation with COD results from
18.02.2008 (set-up C)
Figure 6-4: MatLab® plot for the validation of
simulating nitrogen compounds with
experimental results from 18.02.2008 (set-up C)
Next to the description of the single cycle of the SM-SBR, it is of need to simulate the
biological behaviour of the SM-SBR for several cycles. This was done with the following
boundary conditions:
VR = 500L, VER = 0.25, HRT = 8h, tAX = 1h, tAE = 1h
inlet concentrations: COD = 200 mgL-1
(fraction SS: 0.25, XS: 0.42, Xi: 0.33)
inlet concentrations [mgL-1
]: TN = 18, NH4-N = 15, NO3-N = 0.75
oTS = 12 gL-1
(= 17.04 gCOD L-1
) with XBH = 0.6*oTS, XBA = 0.4*oTS
The change of concentrations during permeate withdrawal is neglected.
The calculated results can be seen in Figure 6-5 and Figure 6-6.
Figure 6-5: Evolution of N-compounds over one day, HRT = 8h, tc = 2h; simulated with MatLab®
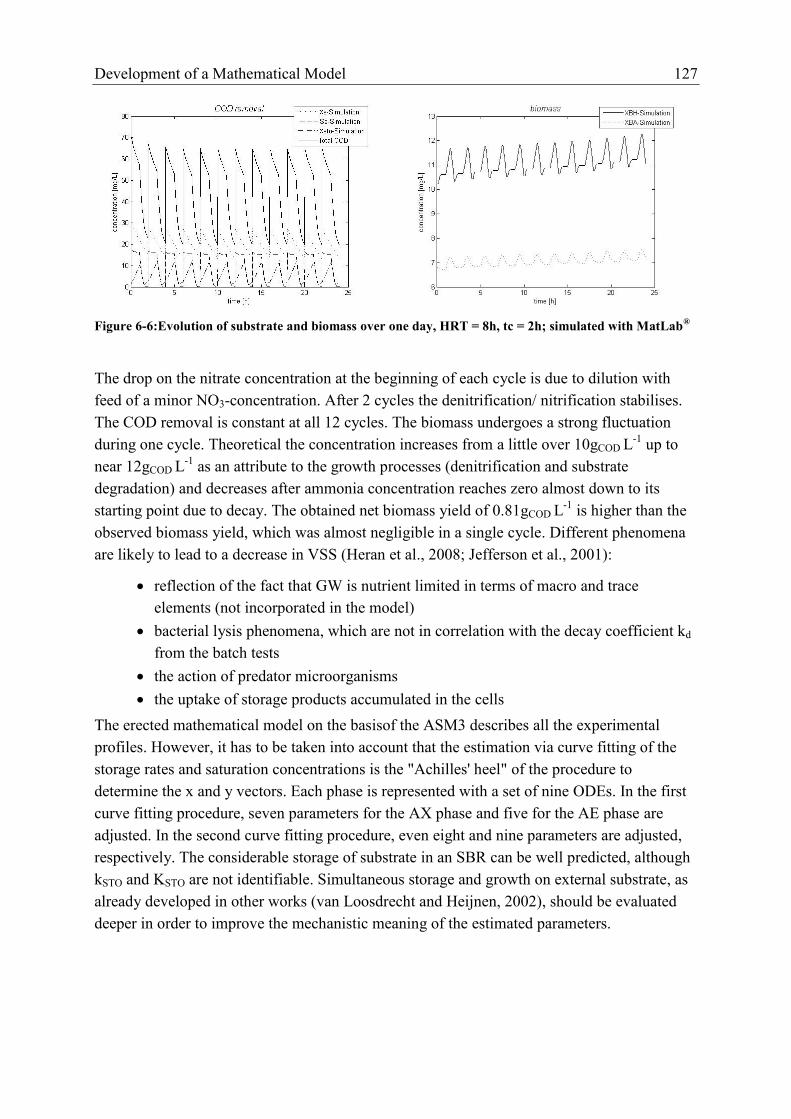
Development of a Mathematical Model 127
Figure 6-6:Evolution of substrate and biomass over one day, HRT = 8h, tc = 2h; simulated with MatLab®
The drop on the nitrate concentration at the beginning of each cycle is due to dilution with
feed of a minor NO3-concentration. After 2 cycles the denitrification/ nitrification stabilises.
The COD removal is constant at all 12 cycles. The biomass undergoes a strong fluctuation
during one cycle. Theoretical the concentration increases from a little over 10gCOD L-1
up to
near 12gCOD L-1
as an attribute to the growth processes (denitrification and substrate
degradation) and decreases after ammonia concentration reaches zero almost down to its
starting point due to decay. The obtained net biomass yield of 0.81gCOD L-1
is higher than the
observed biomass yield, which was almost negligible in a single cycle. Different phenomena
are likely to lead to a decrease in VSS (Heran et al., 2008; Jefferson et al., 2001):
reflection of the fact that GW is nutrient limited in terms of macro and trace
elements (not incorporated in the model)
bacterial lysis phenomena, which are not in correlation with the decay coefficient kd
from the batch tests
the action of predator microorganisms
the uptake of storage products accumulated in the cells
The erected mathematical model on the basisof the ASM3 describes all the experimental
profiles. However, it has to be taken into account that the estimation via curve fitting of the
storage rates and saturation concentrations is the "Achilles' heel" of the procedure to
determine the x and y vectors. Each phase is represented with a set of nine ODEs. In the first
curve fitting procedure, seven parameters for the AX phase and five for the AE phase are
adjusted. In the second curve fitting procedure, even eight and nine parameters are adjusted,
respectively. The considerable storage of substrate in an SBR can be well predicted, although
kSTO and KSTO are not identifiable. Simultaneous storage and growth on external substrate, as
already developed in other works (van Loosdrecht and Heijnen, 2002), should be evaluated
deeper in order to improve the mechanistic meaning of the estimated parameters.
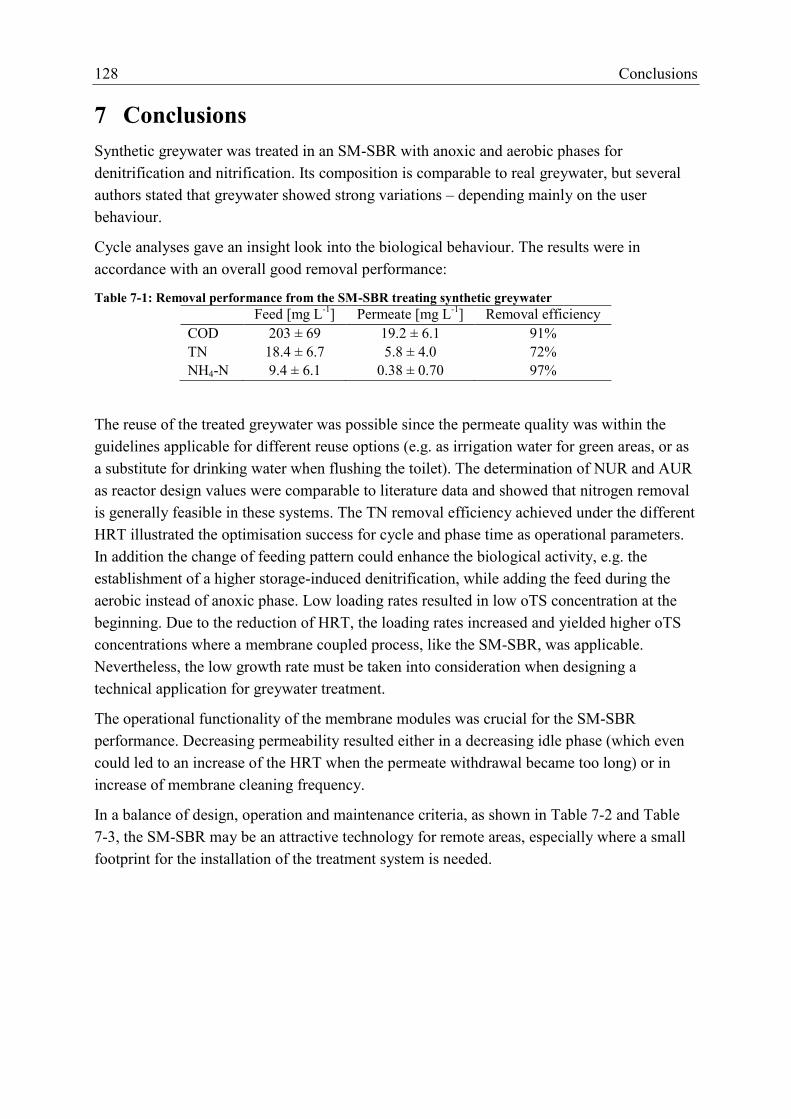
128 Conclusions
7 Conclusions
Synthetic greywater was treated in an SM-SBR with anoxic and aerobic phases for
denitrification and nitrification. Its composition is comparable to real greywater, but several
authors stated that greywater showed strong variations – depending mainly on the user
behaviour.
Cycle analyses gave an insight look into the biological behaviour. The results were in
accordance with an overall good removal performance:
Table 7-1: Removal performance from the SM-SBR treating synthetic greywater
Feed [mg L-1
] Permeate [mg L-1
] Removal efficiency
COD 203 ± 69 19.2 ± 6.1 91%
TN 18.4 ± 6.7 5.8 ± 4.0 72%
NH4-N 9.4 ± 6.1 0.38 ± 0.70 97%
The reuse of the treated greywater was possible since the permeate quality was within the
guidelines applicable for different reuse options (e.g. as irrigation water for green areas, or as
a substitute for drinking water when flushing the toilet). The determination of NUR and AUR
as reactor design values were comparable to literature data and showed that nitrogen removal
is generally feasible in these systems. The TN removal efficiency achieved under the different
HRT illustrated the optimisation success for cycle and phase time as operational parameters.
In addition the change of feeding pattern could enhance the biological activity, e.g. the
establishment of a higher storage-induced denitrification, while adding the feed during the
aerobic instead of anoxic phase. Low loading rates resulted in low oTS concentration at the
beginning. Due to the reduction of HRT, the loading rates increased and yielded higher oTS
concentrations where a membrane coupled process, like the SM-SBR, was applicable.
Nevertheless, the low growth rate must be taken into consideration when designing a
technical application for greywater treatment.
The operational functionality of the membrane modules was crucial for the SM-SBR
performance. Decreasing permeability resulted either in a decreasing idle phase (which even
could led to an increase of the HRT when the permeate withdrawal became too long) or in
increase of membrane cleaning frequency.
In a balance of design, operation and maintenance criteria, as shown in Table 7-2 and Table
7-3, the SM-SBR may be an attractive technology for remote areas, especially where a small
footprint for the installation of the treatment system is needed.
Conclusions 129
Table 7-2: Summary of design criteria for an SM-SBR
design criteria range comment
reactor dimensions (d/H) 1/2 … 1/4 -
membrane area to reactor
volume
15.6 m² / m³ The ratio shall be seen as a minimum value.
More membrane area is good to achieve short
withdrawal phases and operation under
sustainable fluxes.
membrane type plate & frame -
aeration unit coarse and fine The fine bubbles are needed for a better
oxygen transfer for the microorganism,
whereas the coarse aeration is for the shear
stress on the membrane surface to reduce
fouling.
Table 7-3: Summary of operation and maintenance parameters for an SM-SBR
operation
& maintenance parameters
range comment
cycle time, h 2 -
order of phases fill, anox,
aerated,
withdrawal
-
flux, L (m²h)-1
5 … 30 An optimum would be 10 to 15 L (m²h)-1
to
achieve higher cleaning intervals.
HRT, h 8 … 33 The process of denitrification and nitrification
is possible with a short HRT of 8 h.
TS concentration, g L-1
2 … 10 The anticipated TS concentration should be
between 8 and 10 gL-1, in order to use the
advantage of the membrane and still have
longer cleaning intervals.
SRT, d > 360 The SM-SBR can be operated without excess
sludge removal. This enhances the removal
performance of substance done with slow
growing bacteria.
cross flow velocity on
membrane, m s-1
1 comparable to MBR
anticipated effluent quality to fulfil reuse
guidelines
When humans are most likely to get in contact
with treated greywater than a residual
disinfection might be useful.
membrane cleaning interval,
month
1 … 6 The membrane operation must be set to run
stable with long cleaning intervals.
excess sludge removal none -
It was shown that physical greywater treatment with NF membranes may be a simple and
efficient way to treat greywater, and therefore be an interesting alternative to conventional

130 Conclusions
MBR and advanced SM-SBR. The NF membranes Desal DK 25 by the company Osmonics
were suitable for this purpose with a permeate quality around 5 mgCODL-1
, significant lower
than needed for reuse. In addition to a space-saving construction, the big advantage of the
treatment of greywater with NF-membranes was its robustness of the process against
fluctuations in feed composition and concentration, which can be a major problem for
biological treatment.
The kinetic studies in the batch tests were technically difficult, mainly because of foaming at
high F:M ratio. Nevertheless, it was an informative tool to gain insight understanding of the
biological behaviour of greywater sludge. The COD fractioning revealed that 25% belonged
to the rbCOD, 42% to the sbCOD and the remaining 33% to the inert fraction of the COD.
The share of soluble COD was low compared to the particulate one. OUR measurements were
undertaken to determine the growth and decay rate of XBH, as well as the hydrolysis rate. It
could be shown that the evaluation of kinetic data for GW showed significant differences to
municipal wastewater. Operation under substrate limitation due to long HRT led to a slow
biomass growth, while the respirometer measurements resulted in a much higher maximum
growth rate, regardless the low COD in GW. These results can be explained by the change of
feast and hunger due to the batch operation mode in the SM-SBR. At the end, the kinetic
studies helped to formulate a mathematical model, which pictured the sludge behaviour well.
The adaptation of the ASM 3 was suitable. It was shown that some of the constants differ
strongly from the proposed ASM values. Next to the high KS concentration measured from
batch tests, the saturation concentrations KNOx and KNH for nitrification and denitrification are
very high as well.
The 3L lab scale MBR treating real greywater was operated for 137 days at an average
organic loading rate of 0.16 mgCOD(Ld)−1
. Stable operation was achieved at a flux of
8 L (m²h)-1
resulting in a mean HRT of 13 h. A chemical membrane cleaning provided only a
short term increase in flux while a more permanent decrease in the TMP was reached.
Concluding, it can be stated that the low flux would have to be compensated by a big
membrane area in order to treat large lowly polluted volumes with the MBR. Activated sludge
concentration in the MBR under aerobic conditions reached 1.3gL-1
, which was equivalent to
a F/M-ratio of 120 mgCOD(gVSSd)-1
. Specific growth rates were low with values around 0.03d-
1, but higher than the specific growth rate of the sludge from the pilot scale SM-SBR with a
value of 0.02d-1
. The results from the pilot applications with 600L reactors operated from the
Zer0-M project team in Turkey and Morocco proved the technical feasibility of greywater
treatment with membrane technology as well, but an important drawback remains: The high
investment costs for small remote applications.
The permeate of the SM-SBR satisfied the effluent quality requirements for reuse in toilet
flushes or for other household uses, which do not require potable water quality. The treated
greywater was of very high aesthetic quality. To minimise the biological re-growth within the
distributing system, the BOD5 must be below 5 mgL-1
and an additional disinfection within
the distributing system might be needed.
Conclusions 131
GW treatment with membrane coupled processes is therefore viable for the future with further
optimisation potential of the membrane performance. MBR technology is preferable where
little space is available, i.e. for example inside buildings or on ships to overcome the
inconvenience of high investment cost.
132 References
8 References
Al-Beiruti, S. N. (2003). The Potential of Greywater Treatment and Reuse in Jordan: Exchange of Know-How
between Islamic Countries. Policies and strategic options for water management in the Islamic
countries, Tehran, Islamic Republic of Iran, IHP-VI, Technical Documents in Hydrology.
Al-Jayyousi, O. R. (2003). "Greywater reuse: Towards sustainable water management." Desalination 156(1-3):
181-192.
Al-Malack, M. H. (2006). "Determination of biokinetic coefficients of an immersed membrane bioreactor."
Journal of Membrane Science 271(1-2): 47-58.
Anderson, J. M. (1996). "Current water recycling initiatives in Australia: scenarios for the 21st century." Water
Science and Technology 33(10-11): 37-43.
Andreottola, G., P. Foladori and M. Ragazzi (2001). "On-line control of a SBR system for nitrogen removal
from industrial wastewater." Water Science & Technology 43(3): 93-100.
Artan, N. and D. Orhon (2005). Mechanism and Design of Sequencing Batch Reactors for Nutrient Removal,
IWA Publishing.
Artan, N., P. Wilderer, D. Orhon, E. Morgenroth and N. Özgür (2001). "The mechanism and design of
sequencing batch reactor systems for nutrient removal – the state of the art." Water Science &
Technology 43(3): 53-60.
Artan, N., P. Wilderer, D. Orhon, R. Tasli and E. Morgenroth (2002). "Model evaluation and optimisation of
nutrient removal potential for sequencing batch reactors." Water SA 28(4): 423-432.
Asano, T., F. L. Burton, H. Leverenz, R. Tsuchihashi and G. Tchobanoglous (2007). Water reuse: issues,
technologies, and applications. New York, Metcalf & Eddy.
Atasoy, E., S. Murat, A. Baban and M. Tiris (2007). "Membrane Bioreactor (MBR) Treatment of Segregated
Household Wastewater for Reuse." Clean 35(5): 465-472.
Australian-EPA (2006). National Guidelines for Water Recycling: Managing Health and Environmental Risks,
Environment Protection and Heritage Council; Natural Resource Management Ministerial Council;
Australian Health Ministers’ Conference.
Bacchin, P., P. Aimar and R. W. Field (2006). "Critical and sustainable fluxes: Theory, experiments and
applications." Journal of Membrane Science 281(1-2): 42-69.
Bae, T.-H., S.-S. Han and T.-M. Tak (2003). "Membrane sequencing batch reactor system for the treatment of
dairy industry wastewater." Process Biochemistry 39: 221-231.
Beeftink, H. H., R. Vanderheijden and J. J. Heijnen (1990). "Maintenance Requirements - Energy Supply from
Simultaneous Endogenous Respiration and Substrate Consumption." Fems Microbiology Ecology
73(3): 203-209.
Bernardes, R. S. and A. Klapwijk (1996). "Biological nutrient removal in a sequencing batch reactor treating
domestic wastewater." Water Science and Technology 33(3): 29-38.
Bingley, E. B. (1996). "Greywater reuse proposal in relation to the Palmyra Project." Desalination 106(1-3,
Desalination and Water Reuse): 371-375.
Birks, R., J. Colbourne, S. Hills and R. Hobson (2004). "Microbiological water quality in a large in-building,
water recycling facility." Water Sci Technol 50(2): 165-72.
Birks, R., S. Hills, C. Diaper and P. Jeffrey. (2005). "Assessment of water savings from single house domestic
grey water systems." 2007.
Braha, A. and F. Hafner (1987). "Use of lab batch reactors to model biokinetics." Water Research 21(1): 73-81.
Brenner, A. (2000). "Modelling of N and P transformations in an SBR treating municipal wastewater." Water
Science & Technology 42(1-2): 55-63.
Brock (1997). Biology of Microorganism. Upper Saddle River, New Jersey, Prentince-Hal, Inc.
Brouwer, H., A. Klapwijk and K. J. Keesman (1998). "Identification of activated sludge and wastewater
characteristics using respirometric batch experiments." Water Research 32(4): 1240-54.
Brundtland (1987). Our Common Future, Report of the World Commission on Environment and Development,
World Commission on Environment and Development. Published as Annex to General Assembly
document A/42/427:Report of the World Commission on Environment and Development, United
Nation.
References 133
Buckley, C. and V. Naidoo (1999). Municipal wastewater characterisation: Application of denitrification batch
tests. Final Report to the Water Research Commission for Project No. K5/820. Durban, Pollution
Research Group, School of Chemical Engineering, University of Natal.
Chang, H. N., R. K. Moon, B. G. Park, S. J. Lim, D. W. Choi, W. G. Lee, S. L. Song and Y. H. Ahn (2000).
"Simulation of sequential batch reactor (SBR) operation for simultaneous removal of nitrogen and
phosphorus." Bioprocess Engineering 23(5): 513-521.
Chang, I. S., P. Le Clech, B. Jefferson and S. Judd (2002). "Membrane fouling in membrane bioreactors for
wastewater treatment." Journal of Environmental Engineering-Asce 128(11): 1018-1029.
Chiemchaisri, C. and K. Yamamoto (2005). "Enhancement of oxygen transfer and nitrogen removal in a
membrane separation bioreactor for domestic wastewater treatment." Water Sci Technol 51(10): 85-92.
China (2002). Standards on Reuse: GB/T18920-2002, GB/T18921-2002, GB3838-2002.
Cho, B.-C., C.-N. Chang, S.-L. Liaw and P.-T. Huang (2001). "The feasible sequential control strategy of
treating high strength organic nitrogen wastewater with sequencing batch biofilm reactor." Water
Science & Technology 43(3): 115-122.
Cho, J. W., K.-H. Ahn, Y. H. Lee, B.-R. Lim and J. Y. Kim (2004). "Investigation of biological and fouling
characteristics of submerged membrane bioreactor process for wastewater treatment by model
sensitivity analysis." Water Science & Technology 49(2): 245–254.
Christova-Boal, D., R. E. Eden and S. McFarlane (1996). "An investigation into greywater reuse for urban
residential properties." Desalination 106(1-3, Desalination and Water Reuse): 391-397.
Cokgor, E. U., S. Sozen, D. Orhon and M. Henze (1998). "Respirometric analysis of activated sludge behaviour -
I. Assessment of the readily biodegradable substrate." Water Research 32(2): 461-475.
Conte, G., N. Martinuzzi, L. Giovannelli, B. Pucci and F. Masi (2001). "Constructed wetlands for wastewater
treatment in central Italy." Water Science and Technology 44(11-12): 339-343.
Corominas, L., G. Sin, S. Puig, A. Traore, M. Balaguer, J. Colprim and P. A. Vanrolleghem (2006). "Model-
based evaluation of an on-line control strategy for SBRs based on OUR and ORP measurements."
Water Science and Technology 53(4-5): 161-169.
Dangcong, P., W. Yi, W. Hao and W. Xiaochang (2005). "Biological denitrification in a sequencing batch
reactor." Water Science & Technology 50(10): 67-72.
Defrance, L. and M. Y. Jaffrin (1999a). "Comparison between filtrations at fixed transmembrane pressure and
fixed permeate flux: Application to a membrane bioreactor used for wastewater treatment." Journal of
Membrane Science 152(2): 203-210.
Defrance, L. and M. Y. Jaffrin (1999b). "Reversibility of fouling formed in activated sludge filtration." Journal
of Membrane Science 157: 73-84.
DIN (1996). DIN EN ISO 10304-2: Bestimmung der gelösten Anionen mittels Ionenchromatographie. Deutsche
Einheitsverfahren zur Wasser-, Abwasser- und Schlammuntersuchung; Anionen Gruppe D. N. W.
(NAW). Berlin, Deutsches Institut für Normung e.V.
DIN (1999). DIN EN ISO 14911: Bestimmung der gelösten Kationen mittels Ionenchromatographie. Deutsche
Einheitsverfahren zur Wasser-, Abwasser- und Schlammuntersuchung; Kationen Gruppe E. N. W.
(NAW). Berlin, Deutsches Institut für Normung e.V.
Dircks, K., P. F. Pind, H. Mosbaek and M. Henze (1999). "Yield determination by respirometry - The possible
influence of storage under aerobic conditions in activated sludge." Water Sa 25(1): 69-74.
Dold, P. L., G. A. Ekama and G. R. Marais (1980). "A General-Model for the Activated-Sludge Process."
Progress in Water Technology 12(6): 47-77.
Drews, A. (2004). Kontinuierliche Ferrichromproduktion mit Ustilago maydis im Membranreaktor. Düsseldorf,
VDI Verlag GmbH.
Drews, A., T. de la Torre, V. Iversen, J. Schaller, J. Stüber, F. Meng, B. Lesjean and M. Kraume (2008a).
Fouling - the unsolved mystery: Critical view on the practical use of various fouling characterisation
methods. Proc. of 12th AMK, Aachen, 29-30 October 2008.
Drews, A. and M. Kraume (2007). "On maintenance models in severely and long-term limited membrane
bioreactor cultivations." Biotechnology and Bioengineering 96(5): 892-903.
Drews, A., M. Vocks, U. Bracklow, V. Iversen and M. Kraume (2008b). "Does fouling in MBR depend on
SMP?" Desalination 231: 141-149.
Drews, A., M. Vocks, V. Iversen, B. Lesjean and M. Kraume (2006). "Influence of unsteady membrane

134 References
bioreactor operation on EPS formation and filtration resistance." Desalination 192(1-3): 1-9.
Ekama, G. A., P. L. Dold and G. V. Marais (1986). "Procedures for Determining Influent Cod Fractions and the
Maximum Specific Growth-Rate of Heterotrophs in Activated-Sludge Systems." Water Science and
Technology 18(6): 91-114.
Ekama, G. A. and G. V. R. Marais (1979). "Dynamic Behavior of the Activated-Sludge Process." Journal Water
Pollution Control Federation 51(3): 534-556.
Eriksson, E., K. Auffarth, M. Hnze and A. Ledin (2002). "Characteristics of grey wastewater." Urban Water
4(1): 85-104.
EuropeanParliament (1991). "Directive 91/271/EEC of 21 May 1991concerning urban waste water treatment."
Official Journal of the European Union: L135/40 - L135/55.
EuropeanParliament (2000). "Directive 2000/60/EC of the European Parliament and of the Council of 23
October 2000 establishing a framework for Community action in the field of water policy." Official
Journal of the European Union.
EuropeanParliament (2006). "Directive 2006/7/EC of 15 February 2006 concerning the management of bathing
water quality and repealing Directive 76/160/EEC." Official Journal of the European Union: L64/37-
L64/51.
Fan, X. J., V. Urbain, Y. Qian, J. Manem, W. J. Ng and S. L. Ong (2000). "Nitrification in a membrane
bioreactor (MBR) for wastewater treatment." Water Science and Technology 42(3-4): 289-294.
Field, R. W., D. WU, J. A. Howell and B. B. Gupta (1995). "Critical flux concept for microfiltration fouling."
Journal of Membrane Science 100: 259-272.
Flapper, T. G., N. J. Ashbolt, A. T. Lee and M. O’Neill (2001). "From the lab to full-scale SBR operation:
treating high strength and variable industrial wastewaters." Water Science & Technology 43(3): 347-
354.
Friedler, E. (2004). "Quality of individual domestic greywater streams and its implication for on-site treatment
and reuse possibilities." Environmental Technology 25(9): 997-1008.
Friedler, E. and M. Hadari (2006). "Economic feasibility of on-site greywater reuse in multi-storey buildings."
Desalination 190(1-3): 221-234.
Friedler, E., R. Kovalio and A. Ben-Zvi (2006). "Comparative study of the microbial quality of greywater treated
by three on-site treatment systems." Environmental Technology 27(6): 653-663.
Furumai, H., A. A. Kazmi, M. Fujita, Y. Furuya and K. Sasaki (1999). "Modeling long term nutrient removal in
a sequencing batch reactor." Water Research 33(11): 2708-2714.
Gapes, D., B. M. Wilen and J. Keller (2004). "Mass transfer impacts in flocculent and granular biomass from
SBR systems." Water Sci Technol 50(10): 203-12.
Gaudy, A. and E. Gaudy (1972). "Mixed microbial populations." Advances in Biochemical Engineering 2: 97-
141.
Gernaey, A. K., B. Petersen, J.-P. Ottoy and P. Vanrolleghem (2001). "Activated sludge monitoring with
combined respirometric-titrimetric measurements." Water Research 35(5): 1280-1294.
Gildemeister, R., A. Drews and M. Kraume (2005). "Greywater treatment in a submerged membrane sequencing
batch reactor (SM-SBR)." Environmental Protection Engineering 31(3-4): 39-52.
Gillot, S., S. Capela-Marsal, M. Roustan and A. Héduit (2005). "Predicting oxygen transfer of fine bubble
diffused aeration systems—model issued from dimensional analysis." Water Research 39: 1379-1387.
Ginestet, P., A. Maisonnier and M. Spérandio (2002). "Wastewater COD characterization: biodegradability of
physico-chemical fractions." Water Science & Technology 45(6): 89-97.
Green, W. and G. Ho (2005). "Small scale sanitation technologies." Water Sci Technol 51(10): 29-38.
Gunther, F. (2000). "Wastewater treatment by greywater separation: Outline for a biologically based greywater
purification plant in Sweden." Ecological Engineering 15(1-2): 139-146.
Hagendorf, U., K. Diehl, I. Feuerpfeil, A. Hummel, J. Lopez-Pila and R. Szewzyk (2005). "Microbiological
investigations for sanitary assessment of wastewater treated in constructed wetlands." Water Research
39(20): 4849-4858.
Helmig, J. (1992). Untersuchung zum Einsatz der Ultrafiltration für die Abtrennung kationischer Tenside aus
Fernheizwasser. Dortmund, Universität Dortmund.
Henze, M. (1992). "Characterization of Waste-Water for Modeling of Activated-Sludge Processes." Water

References 135
Science and Technology 25(6): 1-15.
Henze, M., C. P. L. Grady, W. Gujer, G. V. R. Marais and T. Matsuo (1987). "A General-Model for Single-
Sludge Waste-Water Treatment Systems." Water Research 21(5): 505-515.
Henze, M., W. Gujer, T. Mino and M. C. M. van Loosdrecht (2000). Activated sludge models ASM1, ASM2,
ASM2d and ASM3. London, IWA Publishing.
Heran, M., C. Wisniewski, J. Orantes and A. Grasmick (2008). "Measurement of kinetic parameters in a
submerged aerobic membrane bioreactor fed on acetate and operated without biomass discharge."
Biochemical Engineering Journal 38(1): 70-77.
Herbert, D. (1958). "Continuous Culture of Bacteria - Principles and Applications." Chemistry & Industry(13):
381-381.
Hernández Leal, L., G. Zeeman, H. Temmink and C. Buisman (2007). "Characterisation and biological treatment
of greywater." Water Science & Technology 56(5): 193-200.
Hills, S., A. Smith, P. Hardy and R. Birks (2001). "Water recycling at the Millennium Dome." Water Sci
Technol 43(10): 287-94.
Howell, J. A. (1995). "Sub-critical flux operation of microfiltration." Journal of Membrane Science 107: 165-
171.
Howell, J. A. (2004). "Future of membranes and membrane reactors in green technologies and for water reuse."
Desalination 162: 1-11.
Hu, B. (2002). "The most optimal retention time for greywater bio-chemical treatment." Huanjing Wuran Zhili
Jishu Yu Shebei 3(7): 30-31.
IKW (2005). Neue Regeln für Wasch- und Reinigungsmittel, Industrieverband Körperpflege- und Waschmittel
e.V.
Innocenti, L., D. Bolzonella, P. Pavan and F. Cecchi (2002). "Effects of sludge age on the performance of a
membrane bioreactor: influence on nutrient and metals removal." Desalination 146: 467-474.
Ishiguro, K., K. Imai and S. Sawada (1994). "Effects of Biological Treatment Conditions on Permeate Flux of Uf
Membrane in a Membrane Activated-Sludge Waste-Water Treatment System." Desalination 98(1-3):
119-126.
Iversen, V., A. Drew, R. Mehrez, M. Ernst, B. Lesjean, M. Jekel and M. Kraume (2007). Fouling control in
MBRs by on-line analyzing and dosing of flux enhancing chemicals. IMSTEC 5.-9.11.2007, Sydney,
Australia.
Jefferson, B., A. Brookes, P. L. Clech and S. J. Judd (2004). "Methods for understanding organic fouling in
MBRs." Water Science & Technology 49(2): 237-244.
Jefferson, B., J. E. Burgess, A. Pichon, J. Harkness and S. J. Judd (2001). "Nutrient addition to enhance
biological treatment of greywater." Water Res 35(11): 2702-10.
Jefferson, B., S. Judd and C. Diaper (2000). Treatment methods of grey water, In: P. Lens, Decentralised
Sanitation and Reuse - Concepts, Systems and Implementation. Chapt. 17, IWA publishing.
Jefferson, B., A. Laine, S. Parsons, T. Stephenson and J. S. (1999). "Technologies for domestic wastewater
recycling." Urban Water 1(4): 285-292.
Jeppesen, B. (1996). "Domestic greywater re-use: Australia's challenge for the future." Desalination 106(1-3,
Desalination and Water Reuse): 311-315.
Jönsson, A. J., B (1991). "The influence of nonionic and ionic surfactants on hydrophobic and hydrophilic
ultrafiltration membranes." Journal of Membrane Science 56: 49-76.
Judd, S. (2006). The MBR Book. London, Elsevier Ltd.
Kang, I. J., C. H. Lee and K. J. Kim (2003). "Characteristics of microfiltration membranes in a membrane
coupled sequencing batch reactor system." Water Research 37(5): 1192-1197.
Kappeler, J. and W. Gujer (1992). "Estimation of Kinetic-Parameters of Heterotrophic Biomass under Aerobic
Conditions and Characterization of Waste-Water for Activated-Sludge Modeling." Water Science and
Technology 25(6): 125-139.
Kargi, F. and A. Uygur (2003). "Nutrient removal performance of a five-step sequencing batch reactor as a
function of wastewater composition." Process Biochemistry 38: 1039-1045.
Keller, J., S. Watts, W. Battye-Smith and R. Chong (2001). "Full-scale demonstration of biological nutrient
removal in a single tank SBR process." Water Science & Technology 43(3): 355-362.

136 References
Ketchum, L. H. (1997). "Design and physical features of sequencing batch reactors." Water Science and
Technology 35(1): 11-18.
Komschuvara, K. (2002). UV disinfection in comparison with other small scale technologies for the treatment of
domestic greywater, University of Hertfordshire.
Konopka, A. (2000). "Microbial physiological state at low growth rate in natural and engineered ecosystems."
Current Opinion in Microbiology 3(3): 244-247.
Konopka, A., T. Zakharova, L. Oliver and R. F. Turco (1997). "Microbial biodegradation of organic wastes
containing surfactants in a continuous-flow reactor." Journal of Industrial Microbiology &
Biotechnology 18(4): 235-240.
Kosswig, K. and H. Stache (1993). Die Tenside. München, Carl Hanser Verlag.
Krampe, J. and K. Krauth (2000). SBR with submerged hollow fibre membranes for biomass separation (Poster
Presentation). 2nd IWA International Conference on SBR-Technology, Narbonne.
Krampe, J. and K. Krauth (2001). "Sequencing batch reactor with submerged hollow fibre membranes for the
biomass separation." Water Science & Technology 43(3): 195-199.
Kraume, M., U. Bracklow, M. Vocks and A. Drews (2005). "Nutrients removal in MBRs for municipal
wastewater treatment." Water Science & Technology 51(6-7): 391-402.
Kristensen, G. H., P. E. Jorgensen and M. Henze (1992). "Characterization of functional microorganism groups
and substrate in activated sludge and wastewater by AUR, NUR and OUR." Water Science &
Technology 25(6): 43-57.
Kuhn, R. and N. Mujkic (2003). Untersuchung zur biologischen Abbaubarkeit von ausgewählten Stoffgemischen
in Labor-Belebtschlammanlagen. Berlin, Institut für Umwelttechnik, Technische Universität Berlin.
Kwon, D. Y. and S. Vigneswaran (1998). "Influence of particle size and surface charge on critical flux of
crossflow microfiltration." Water Science & Technology 38(4-5): 481-488.
Lagarde, F., M. H. Tusseau-Vuillemin, P. Lessard, A. Héduit, F. Dutrop and J. M. Mouchel (2005). "Variability
estimation of urban wastewater biodegradable fractions by respirometry." Water Research 39(19):
4768-4778.
Lamine, M., L. Bousselmi and A. Ghrabi (2007). "Biological treatment of grey water using sequencing batch
reactor." Desalination 215(1-3): 127-132.
Lazarova, V., S. Hills and R. Birks (2003). "Using recycled water for non-potable, urban uses: a review with
particular reference to toilet flushing." Water Science & Technology: Water Supply 3(4): 69-77.
Lazarova, V., B. Levine, J. Sack, G. Cirelli, P. Jeffrey, H. Muntau, M. Salgot and F. Brissaud (2001). "Role of
water reuse for enhancing integrated water management in Europe and Mediterranean countries." Water
Science & Technology 43(10): 25-33.
Le-Clech, P., V. Chen and A. G. Fane (2006). "Fouling in membrane bioreactors used for wastewater treatment –
A review." Journal of Membrane Science 284: 17-53.
Le-Clech, P., B. Jefferson and S. J. Judd (2003). "Impact of aeration, solids concentration and membrane
characteristics on the hydraulic performance of a membrane bioreactor." Journal of Membrane Science
218(1-2): 117-129.
Le Clech, P., B. Jefferson, I. S. Chang and S. J. Judd (2003). "Critical flux determination by the flux-step method
in a submerged membrane bioreactor." Journal of Membrane Science 227: 81–93.
Lee, N., G. Amy, J.-P. Croue and H. Buissonc (2004). "Identification and understanding of fouling in low-
pressure membrane (MF/UF) filtration by natural organic matter (NOM)." Water Research 38: 4511–
4523.
Lesjean, B. and R. Gnirss (2006). "Grey water treatment with a membrane bioreactor operated at low SRT and
low HRT." Desalination 199: 432-434.
Levine, L. H., J. E. Judkins, N. C. Yorio, J. L. Adams, M. E. Hummerick and J. L. Garland (2001). "Direct
quantification of anionic, amphoteric, and nonionic surfactants in an alternative graywater treatment
system using LC/ion trap mass spectrometry." Preprints of Extended Abstracts presented at the ACS
National Meeting, American Chemical Society, Division of Environmental Chemistry 41(1): 151-155.
Li, Z., H. Gulyas, M. Jahn, D. R. Gajurel and R. Otterpohl (2003). "Greywater treatment by constructed wetlands
in combination with TiO2-based photocatalytic oxidation for suburban and rural areas without sewer
system." Water Sci Technol 48(11-12): 101-6.
Lin, S. H., C. M. Lin and H. C. Leu (1999). "Operating characteristics and kinetic studies of surfactant
References 137
wastewater treatment by fenton oxidation." Water Research 33(7): 1735-1741.
Liu, Y. (2006). "A simple thermodynamic approach for derivation of a general Monod equation for microbial
growth." Biochemical Engineering Journal 31(1): 102-105.
Liu, Y. (2007). "Overview of some theoretical approaches for derivation of the Monod equation." Applied
Microbiology and Biotechnology 73(6): 1241-1250.
Liwarska-Bizukojc, E., R. Scheumann, A. Drews, U. Bracklow and M. Kraume (2008). "Effect of anionic and
nonionic surfactants on the kinetics of the aerobic heterotrophic biodegradation of organic matter in
industrial wastewater." Water Research 42(4-5): 923-930.
Manser, R., W. Gujer and H. Siegrist (2005). "Membrane bioreactor versus conventional activated sludge
system: population dynamics of nitrifiers." Water Science and Technology 52(10-11): 417-425.
Manser, R., W. Gujer and H. Siegrist (2006). "Decay processes of nitrifying bacteria in biological wastewater
treatment systems." Water Research 40(12): 2416-2426.
Marais, G. V. R. and G. A. Ekama (1976). "The activated sludge process - part 1: Steady state behaviour." Water
SA 2(4): 164-200.
Masi, F., N. Martinuzzi, L. Bresciani, L. Giovannelli and G. Conte (2007). "Tolerance to hydraulic and organic
load fluctuations in constructed wetlands." Water Science & Technology 56(3): 39-48.
McAdam, E., S. J. Judd, R. Gildemeister, A. Drews and M. Kraume (2005). "Critical analysis of submerged
membrane sequencing batch reactor operating conditions." Water Research 39: 4011-4019.
Mehlhart, G. (2005). Greywater Recycling, Planning fundamentals and operation information. fbr - Information
Sheet H 201, Fachvereinigung Betriebs and Regenwassernutzung e.V.
Melin, T., B. Jefferson, D. Bixio, C. Thoeye, W. De Wilde, J. De Koning, J. van der Graaf and T. Wintgens
(2006a). "Membrane bioreactor technolgy for wastewater treatment and reuse." Desalination 187(271-
282).
Melin, T., B. Jefferson, D. Bixio, C. Thoeye, W. De Wilde, J. De Koning, J. van der Graaf and T. Wintgens
(2006b). "Membrane bioreactor technology for wastewater treatment and reuse." Desalination 187(1-3):
271-282.
Meng, F., S. R. Chae, A. Drews, M. Kraume, H. S. Shin and F. Yang (2009). "Recent advances in membrane
bioreactors (MBRs): Membrane fouling and membrane material. ." Water Research 43(6): 1489-1512.
Merz, C. (2006). Comparison of membrane bioreactor and gravel and sand filter as greywater treatment option in
Morocco. Dept. of Chemical Engineering. Berlin, Berlin University of Technology.
Merz, C., R. Scheumann, B. El Hamouri and M. Kraume (2007). "Membrane bioreactor technology for the
treatment of greywater from a sports and leisure club." Desalination 215: 37-43.
Messalem, R., A. Brenner, S. Shandalov, Y. Leroux, P. Uzlaner, G. Oron and D. Wolf (2000). "Pilot study of
SBR biological treatment and microfiltration for reclamation and reuse of municipal wastewater."
Water Science & Technology 42(1-2): 263-268.
Metcalf and Eddy (2003). Wastewater Engineering: Treatment and Reuse. New York, McGraw Hill.
Mohan, P. K., G. Nakhla and E. K. Yanful (2006). "Biokinetics of biodegradation of surfactants under aerobic,
anoxic and anaerobic conditions." Water Research 40(3): 533-540.
Morgenroth, E., P. A. Wilderer, J. Barnard, A. Boon, S. Williams, F. Xiong, A. Ware, T. Pitman and E. De Jong
(1998). "Sequencing batch reactor technology: Concepts, design and experiences (abridged) -
Discussion." Journal of the Chartered Institution of Water and Environmental Management 12(5): 314-
321.
Moussa, M. S., C. M. Hooijmans, H. J. Lubberding, H. J. Gijzen and M. C. M. van Loosdrecht (2005).
"Modelling nitrification, heterotrophic growth and predation in activated sludge." Water Research
39(20): 5080-5098.
Murat, S., E. Atasoy, A. Baban, K. Gunes and S. Ayaz (2007). Greywater treatment by a membrane bioreactor
and reuse options. MEDA WATER International Conference on Sustainable Water Management,
Tunis, Tunisia, Centre de Recherche et des Technologie des Eaux (CERTE).
NAWQAM (2004). Operational Drainage Water Reuse Guidelines, DR-TR-0103-006-DR. Drainage Research
Institute. Cairo, Egypt, NWRC.
Ng, A. N. L. and A. S. Kim (2007). "A mini-review of modeling studies on membrane bioreactor (MBR)
treatment for municipal wastewaters." Desalination 212(1-3): 261-281.
Nghiem, L. D. and A. I. Schafer (2006). "Fouling autospy of hollow-fibre MF membranes in wastewater
138 References
reclamation." Desalination 188(1-3): 113-121.
Ni, B.-J. and H.-Q. Yu (2007). "Model-based analysis on growth of activated sludge in a sequencing batch
reactor." Applied Microbiology and Biotechnology 77(3): 723-731.
Nolde, E. (1999). "Greywater reuse systems for toilet flushing in multi-storey buildings - over ten years
experience in Berlin." Urban Water 1(4): 275-284.
Nolde, E. (2005). "Greywater recycling systems in Germany-results, experiences and guidelines." Water Science
& Technology 51(10): 203-10.
Novák, L., L. Larrea and J. Wanner (1995). "Mathematical model for soluble carbonaceous substrate
biosorption." Water Science and Technology 31(2): 67-77.
Nowak, O., K. Svardal and P. Schweighofer (1995). "The Dynamic Behavior of Nitrifying Activated-Sludge
Systems Influenced by Inhibiting Waste-Water Compounds." Water Science and Technology 31(2):
115-124.
Ognier, S., C. Wisniewski and A. Grasmick (2004). "Membrane bioreactor fouling in sub-critical filtration
conditions: a local critical flux concept." Journal of Membrane Science 229: 171-177.
Orhon, D., N. Artan and E. Ates (1994). "A Description of 3 Methods for the Determination of the Initial Inert
Particulate Chemical Oxygen-Demand of Waste-Water." Journal of Chemical Technology and
Biotechnology 61(1): 73-80.
Orhon, D., E. Ates, S. Sozen and E. U. Cokgor (1997). "Characterization and COD fractionation of domestic
wastewaters." Environmental Pollution 95(2): 191-204.
Oschmann, N., L. D. Nghiem and A. I. Schafer (2005). "Fouling mechanisms of submerged ultrafiltration
membranes in greywater recycling." Desalination 179(1-3): 215-223.
Ottoson, J. and T. A. Stenstrom (2003). "Faecal contamination of greywater and associated microbial risks."
Water Res 37(3): 645-55.
Park, K. Y., J. W. Lee, Y. Inamori, M. Mizuochi and K. H. Ahn (2001). "Effects of fill modes on N2O emission
from the SBR treating domestic wastewater." Water Science & Technology 43(3): 147-150.
Parkin, G. F. and P. L. McCarty (1981). "A Comparison of the Characteristics of Soluble Organic Nitrogen in
Untreated and Activated-Sludge Treated Wastewaters." Water Research 15(1): 139-149.
Peters, M., M. Newland, T. Seviour, T. Broom and T. Bridle (2005). "Demonstration of enhanced nutrient
removal at two full-scale SBR plants." Water Science & Technology 50(10): 115-120.
Petersen, B., K. Gernaey, M. Devisscher, D. Dochain and P. A. Vanrolleghem (2003). "A simplified method to
assess structurally identifiable parameters in Monod-based activated sludge models." Water Research
37(12): 2893-2904.
Pirt, S. J. (1965). "Maintenance Energy of Bacteria in Growing Cultures." Proceedings of the Royal Society of
London Series B-Biological Sciences 163(991): 224-&.
Pirt, S. J. (1982). "Maintenance Energy - a General-Model for Energy-Limited and Energy-Sufficient Growth."
Archives of Microbiology 133(4): 300-302.
Pollice, A., A. Brookes, B. Jefferson and S. Judd (2005). "Sub-critical flux fouling in membrane bioreactors - A
review of recent literature." Desalination 174(3): 221-230.
Prieske, H., A. Drew and M. Kraume (2008). "Prediction of the circulation velocity in a membrane bioreactor."
Desalination 231(1-3): 219-226.
Psoch, C. and S. Schiewer (2005). "Long-term study of an intermittent air sparged MBR for synthetic
wastewater treatment." Journal of Membrane Science 260(1-2): 56-65.
Rose, J. B., G. S. Sun, C. P. Gerba and N. A. Sinclair (1991). "Microbial Quality and Persistence of Enteric
Pathogens in Graywater from Various Household Sources." Water Research 25(1): 37-42.
Rosenberger, S., U. Krüger, R. Witzig, W. Manz, U. Szewzyk and M. Kraume (2002). "Performance of a
bioreactor with submerged membranes for aerobic treatment of municipal waste water." Water
Research 36: 413-420.
Scheumann, R., A. Besançon, B. Jefferson and M. Kraume (2007a). Biological Paramters in Greywater
Treatment with a Submerged Membrane Sequencing Batch Reactor. 4th International Water
Association Conference on Membranes for Water and Wastewater Treatment (15-17 May 2007),
Harrogate, Großbritanien.
Scheumann, R. and M. Kraume (2007). Influence of different HRT for the operation of a Submerged Membrane
Sequencing Batch Reactor (SM-SBR) for the treatment of greywater. MEDA WATER International
References 139
Conference on Sustainable Water Management, Tunis, Tunesien.
Scheumann, R. and M. Kraume (2009). "Influence of different HRT for the operation of a Submerged Membrane
Sequencing Batch Reactor (SM-SBR) for the treatment of greywater." Desalination 248: 123-130.
Scheumann, R., F. Masi, B. El Hamouri and M. Kraume (2009). "Greywater treatment as an option for effective
wastewater management in small communities." Desalination and Water Treatment 4: 33-39.
Scheumann, R., C. Merz, E. Atasoy, S. Murat, A. Baban, B. ElHamouri and M. Kraume (2007b). Greywater
Treatment with Membrane Bioreactors: Comparison of Three Different Reactors Operated with
Synthetic and Real Greywater. 7. Aachener Tagung Wasser und Membranen (30.-31.10.2007), Aachen.
Schipolowski, T., A. Jezowska and G. Wozny (2006). "Reliability of membrane test cell measurements."
Desalination 189(1-3): 71-80.
Shimizu, Y., Y.-I. Okuno, K. Uryu, S. Ohtsubo and A. Watanabe (1996). "Filtration characteristics of hollow
fiber microfiltration membranes used in membrane bioreactors for domestic wastewater treatment."
Water Research 30(10): 2385-2392.
Shin, H.-S. and S. Kang (2002). "Performance and membrane fouling in a pilot scale SBR process coupled with
membrane." Water Science & Technology 47(1): 139-144.
Shin, H.-S., S.-M. Lee, I.-S. Seo, G.-O. Kim, K.-H. Lim and J.-S. Song (1998). "Pilot-scale SBR and MF
operation for removal of organic and nitrogen compounds from greywater." Water Science and
Technology 38(6): 79-88.
Sin, G. and P. A. Vanrolleghem (2007). "Extensions to modeling aerobic carbon degradation using combined
respirometric-titrimetric measurements in view of activated sludge model calibration." Water Research
41(15): 3345-3358.
Sofia, A., W. J. Ng and S. L. Ong (2004). "Engineering design approaches for minimum fouling in submerged
MBR." Desalination 160(1): 67-74.
Sollfrank, U. and W. Gujer (1991). "Characterisation of domestic wastewater for mathematical modelling of the
activated sludge process." Water Sci Technol 23: 1057-66.
Soriano, G. A., M. Erb, C. Garel and J. M. Audic (2003). "A comparative pilot-scale study of the performance of
conventional activated sludge and membrane bioreactors under limiting operation conditions." Water
Environment Research 75(3): 225-231.
Sotemann, S. W., E. V. Musvoto, M. C. Wentzel and G. A. Ekama (2005). "Integrated biological, chemical and
physical processes kinetic modelling Part 1 - Anoxic-aerobic C and N removal in the activated sludge
system." Water Sa 31(4): 529-544.
Sozen, S., E. U. Cokgor, D. Orhon and M. Henze (1998). "Respirometric analysis of activated sludge behaviour -
II. Heterotrophic growth under aerobic and anoxic conditions." Water Research 32(2): 476-488.
Spanjers, H. and P. Vanrolleghem (1995). "Respirometry as a tool for rapid characterization of wastewater and
activated sludge." Water Sci Technol 31(2): 105-114.
Spanjers, H., P. Vanrolleghem, G. Olsson and P. Dold (1998). Respirometry in control of the activated sludge
process: Principles, IWAQ.
Spérandio, M., A. Masse, M. C. Espinosa-Bouchot and C. Cabassud (2005). "Characterization of sludge
structure and activity in submerged membrane bioreactor." Water Science and Technology 52(10-11):
401-408.
Stephenson, T., S. Judd, B. Jefferson and K. Brindle (2000). Membrane Bioreactors for Wastewater Treatment,
IWA Publishing.
Su, Y. C., C. P. Huang, J. R. Pan and H. C. Lee (2008). Characteristics of membrane fouling in submerged
membrane bioreactor under sub-critical flux operation. Water Science and Technology. 57: 601-605.
Surendran, S., M. D. Smith, A. D. Wheatley, J. Murrer, M. Ward and I. Evans (1998). "Development of in-house
water reclamation systems for large institutions." Water Reuse Conference Proceedings, Lake Buena
Vista, Fla., Feb.1-4, 1998: 731-743.
Swisher, R. D. (1987). Surfactant Biodegradation. New York, Marcel Dekker Inc.
Tardieu, E., A. Grasmick, V. Geaugey and J. Manemd (1998). "Hydrodynamic control of bioparticle deposition
in a MBR applied to wastewater treatment." Journal of Membrane Science 147 1-12.
Teichgräber, B., D. Schreff, C. Ekkerlein and P. A. Wilderer (2003). "SBR technology in Germany – an
overview." Water Science & Technology 43(3): 323-330.
Toutianoush, A. (2003). Polyelektrolyt-Multischichtmembranen für Pervaporation, Dialyse, Nanofiltration und

140 References
Reversosmose. Mathematisch - Naturwissenschaftliche Fakultät. Köln, Universität zu Köln.
US-EPA (2004). Guidelines for Water Reuse: EPA/625/R-04/108, U.S. Environmental Protection Agency;
Municipal Support Division: Office of Wastewater Management, Washington DC.; Technology
Transfer and Support Division: National Risk Management & Research Laboratory Office of Research
and Development, Cincinnati, OH; U.S. Agency for International Development, Washington DC.
van Loosdrecht, M. C. M. and J. J. Heijnen (2002). "Modelling of activated sludge processes with structured
biomass." Water Science and Technology 45(6): 13-23.
van Loosdrecht, M. C. M. and M. Henze (1999). "Maintenance, endogeneous respiration, lysis, decay and
predation." Water Science Technology 39(1): 107-117.
Vanrolleghem, P. A., M. V. Daele and D. Dochain (1995). "Practical identifiability of a biokinetic model of
activated sludge respiration." Water Research 29(11): 2561-2570.
Vanrolleghem, P. A., H. Spanjers, B. Petersen, P. Ginestet and I. Takacs (1999). "Estimating (combinations of)
Activated Sludge Model No. 1 parameters and components by respirometry." Water Science and
Technology 39(1): 195-214.
Veneman, P. L. M. and B. Stewart (2002). Greywater characterization and treatment efficiency. Massachusetts,
The Massachusetts Department of Environmental Protection: Bureau of Resource Protection.
Vocks, M., C. Adam, B. Lesjean, R. Gnirss and M. Kraume (2005). "Enhanced post-denitrification without
addition of an external carbon source in membrane bioreactors." Water Research 39(14): 3360-3368.
WEF (2005). Membrane Systems for Wastewater Treatment. New York, The McGraw-Hill Companies.
Wendler, B. (2003). Nanofiltration von Tensidlösungen - Modellierung und experimentelle Analyse. Aachen,
Berlin, Shaker Verlag.
Wentzel, M. C., A. Mbewe and G. A. Ekama (1995). "Batch test for measurement of readily biodegradable COD
and active organism concentrations in municipal wastewaters." Water Sa 21(2): 117-124.
White, D. A. and P. Lesecq (1993). "Optimization of Intermittently Operated Microfiltration Processes."
Chemical Engineering Journal and the Biochemical Engineering Journal 52(2): 73-77.
WHO (2006). Guidelines for the safe use of wastewater, excreta and greywater. . Geneva, Switzerland, World
Health Organization Press.
Wilderer, P. A., W. L. Jones and U. Dau (1987). "Competition in denitrification systems affecting reduction rate
and accumulation of nitrite." Water Research 21(2): 239-245.
Zhang, B., K. Yamamoto, S. Ohgaki and N. Kamiko (1997). "Floc size distribution and bacterial activities in
membrane separation activated sludge processes for small-scale wastewater treatment/reclamation."
Water Science and Technology 35(6): 37-44.
Zhang, H. M., J. N. Xiao, Y. J. Cheng, L. F. Liu, X. W. Zhang and F. L. Yang (2006). "Comparison between a
sequencing batch membrane bioreactor and a conventional membrane bioreactor." Process
Biochemistry 41(1): 87-95.
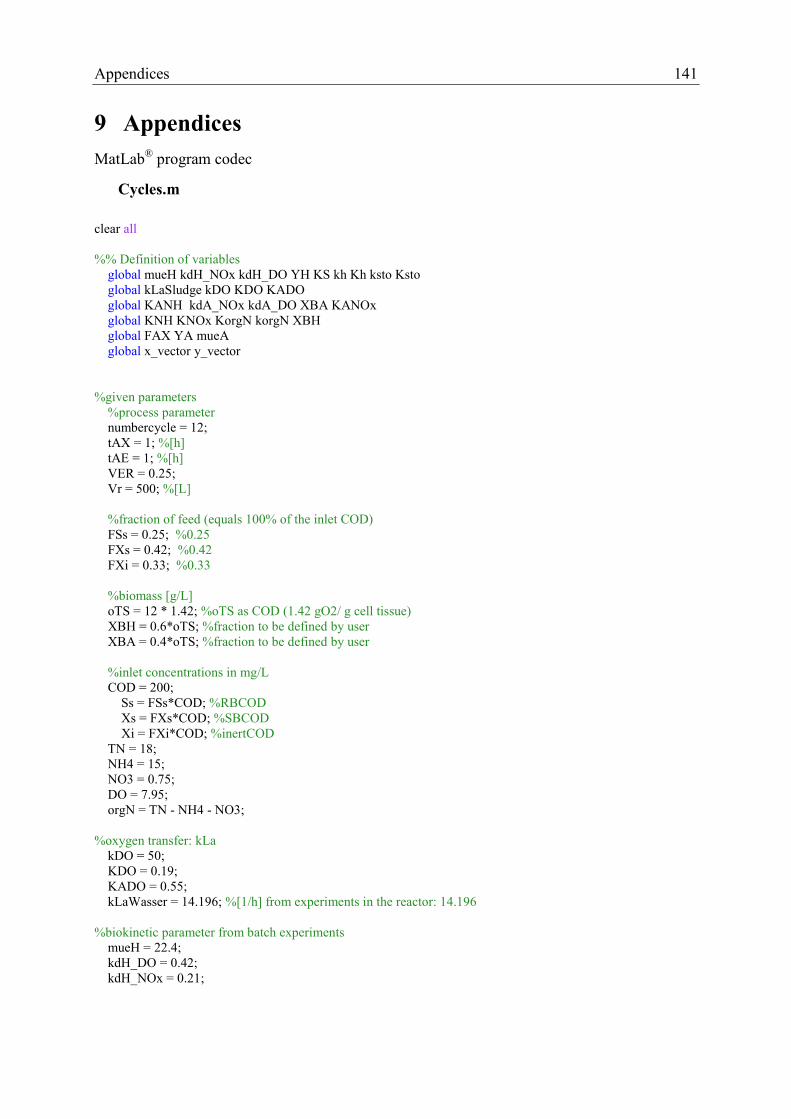
Appendices 141
9 Appendices
MatLab® program codec
Cycles.m
clear all
%% Definition of variables
global mueH kdH_NOx kdH_DO YH KS kh Kh ksto Ksto
global kLaSludge kDO KDO KADO
global KANH kdA_NOx kdA_DO XBA KANOx
global KNH KNOx KorgN korgN XBH
global FAX YA mueA
global x_vector y_vector
%given parameters
%process parameter
numbercycle = 12;
tAX = 1; %[h]
tAE = 1; %[h]
VER = 0.25;
Vr = 500; %[L]
%fraction of feed (equals 100% of the inlet COD)
FSs = 0.25; %0.25
FXs = 0.42; %0.42
FXi = 0.33; %0.33
%biomass [g/L]
oTS = 12 * 1.42; %oTS as COD (1.42 gO2/ g cell tissue)
XBH = 0.6*oTS; %fraction to be defined by user
XBA = 0.4*oTS; %fraction to be defined by user
%inlet concentrations in mg/L
COD = 200;
Ss = FSs*COD; %RBCOD
Xs = FXs*COD; %SBCOD
Xi = FXi*COD; %inertCOD
TN = 18;
NH4 = 15;
NO3 = 0.75;
DO = 7.95;
orgN = TN - NH4 - NO3;
%oxygen transfer: kLa
kDO = 50;
KDO = 0.19;
KADO = 0.55;
kLaWasser = 14.196; %[1/h] from experiments in the reactor: 14.196
%biokinetic parameter from batch experiments
mueH = 22.4;
kdH_DO = 0.42;
kdH_NOx = 0.21;
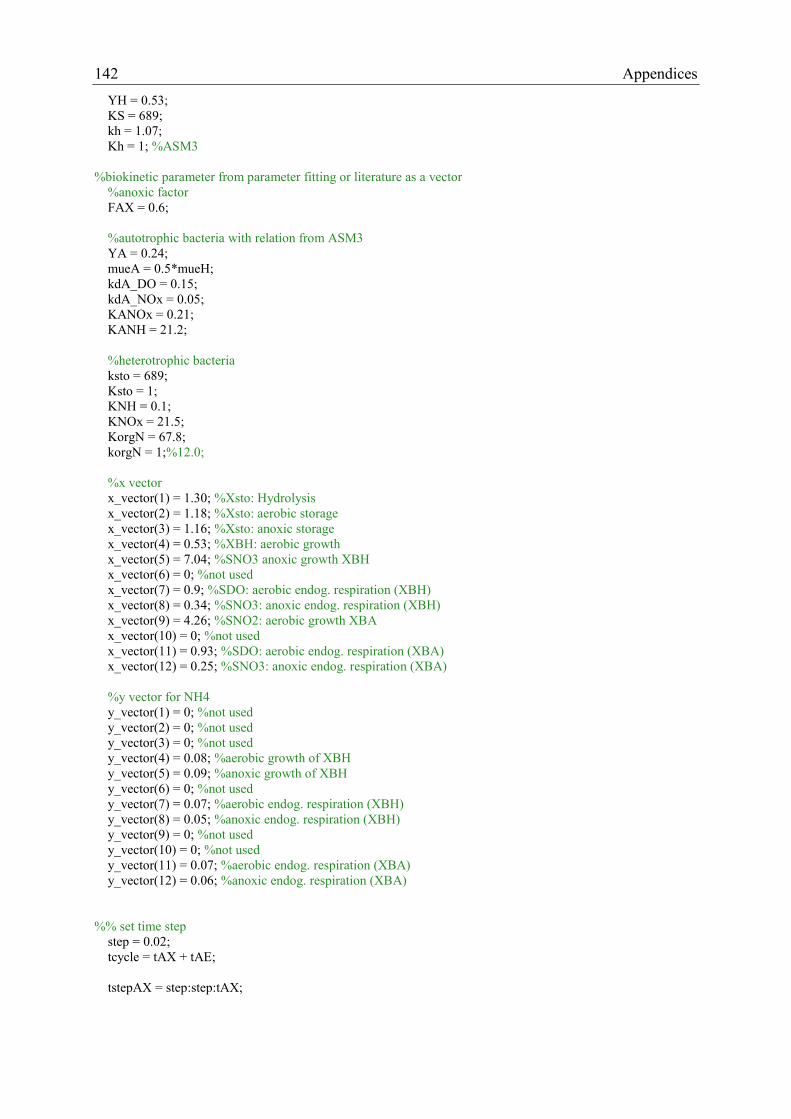
142 Appendices
YH = 0.53;
KS = 689;
kh = 1.07;
Kh = 1; %ASM3
%biokinetic parameter from parameter fitting or literature as a vector
%anoxic factor
FAX = 0.6;
%autotrophic bacteria with relation from ASM3
YA = 0.24;
mueA = 0.5*mueH;
kdA_DO = 0.15;
kdA_NOx = 0.05;
KANOx = 0.21;
KANH = 21.2;
%heterotrophic bacteria
ksto = 689;
Ksto = 1;
KNH = 0.1;
KNOx = 21.5;
KorgN = 67.8;
korgN = 1;%12.0;
%x vector
x_vector(1) = 1.30; %Xsto: Hydrolysis
x_vector(2) = 1.18; %Xsto: aerobic storage
x_vector(3) = 1.16; %Xsto: anoxic storage
x_vector(4) = 0.53; %XBH: aerobic growth
x_vector(5) = 7.04; %SNO3 anoxic growth XBH
x_vector(6) = 0; %not used
x_vector(7) = 0.9; %SDO: aerobic endog. respiration (XBH)
x_vector(8) = 0.34; %SNO3: anoxic endog. respiration (XBH)
x_vector(9) = 4.26; %SNO2: aerobic growth XBA
x_vector(10) = 0; %not used
x_vector(11) = 0.93; %SDO: aerobic endog. respiration (XBA)
x_vector(12) = 0.25; %SNO3: anoxic endog. respiration (XBA)
%y vector for NH4
y_vector(1) = 0; %not used
y_vector(2) = 0; %not used
y_vector(3) = 0; %not used
y_vector(4) = 0.08; %aerobic growth of XBH
y_vector(5) = 0.09; %anoxic growth of XBH
y_vector(6) = 0; %not used
y_vector(7) = 0.07; %aerobic endog. respiration (XBH)
y_vector(8) = 0.05; %anoxic endog. respiration (XBH)
y_vector(9) = 0; %not used
y_vector(10) = 0; %not used
y_vector(11) = 0.07; %aerobic endog. respiration (XBA)
y_vector(12) = 0.06; %anoxic endog. respiration (XBA)
%% set time step
step = 0.02;
tcycle = tAX + tAE;
tstepAX = step:step:tAX;
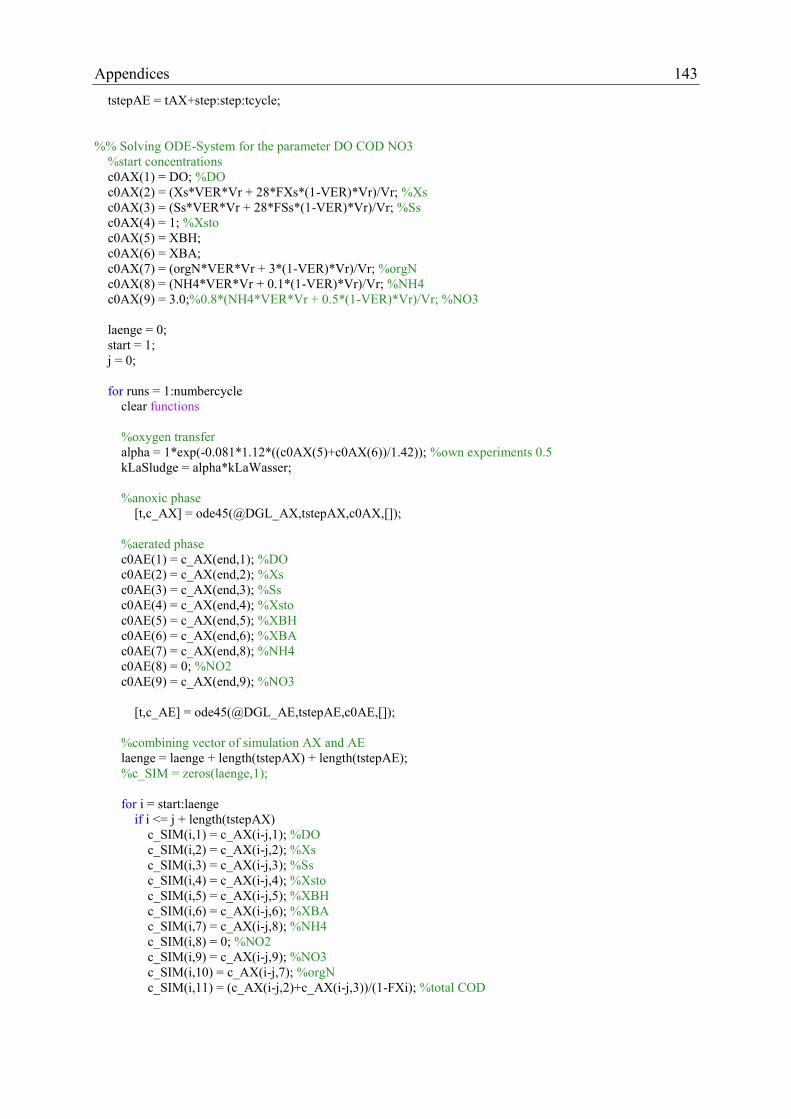
Appendices 143
tstepAE = tAX+step:step:tcycle;
%% Solving ODE-System for the parameter DO COD NO3
%start concentrations
c0AX(1) = DO; %DO
c0AX(2) = (Xs*VER*Vr + 28*FXs*(1-VER)*Vr)/Vr; %Xs
c0AX(3) = (Ss*VER*Vr + 28*FSs*(1-VER)*Vr)/Vr; %Ss
c0AX(4) = 1; %Xsto
c0AX(5) = XBH;
c0AX(6) = XBA;
c0AX(7) = (orgN*VER*Vr + 3*(1-VER)*Vr)/Vr; %orgN
c0AX(8) = (NH4*VER*Vr + 0.1*(1-VER)*Vr)/Vr; %NH4
c0AX(9) = 3.0;%0.8*(NH4*VER*Vr + 0.5*(1-VER)*Vr)/Vr; %NO3
laenge = 0;
start = 1;
j = 0;
for runs = 1:numbercycle
clear functions
%oxygen transfer
alpha = 1*exp(-0.081*1.12*((c0AX(5)+c0AX(6))/1.42)); %own experiments 0.5
kLaSludge = alpha*kLaWasser;
%anoxic phase
[t,c_AX] = ode45(@DGL_AX,tstepAX,c0AX,[]);
%aerated phase
c0AE(1) = c_AX(end,1); %DO
c0AE(2) = c_AX(end,2); %Xs
c0AE(3) = c_AX(end,3); %Ss
c0AE(4) = c_AX(end,4); %Xsto
c0AE(5) = c_AX(end,5); %XBH
c0AE(6) = c_AX(end,6); %XBA
c0AE(7) = c_AX(end,8); %NH4
c0AE(8) = 0; %NO2
c0AE(9) = c_AX(end,9); %NO3
[t,c_AE] = ode45(@DGL_AE,tstepAE,c0AE,[]);
%combining vector of simulation AX and AE
laenge = laenge + length(tstepAX) + length(tstepAE);
%c_SIM = zeros(laenge,1);
for i = start:laenge
if i <= j + length(tstepAX)
c_SIM(i,1) = c_AX(i-j,1); %DO
c_SIM(i,2) = c_AX(i-j,2); %Xs
c_SIM(i,3) = c_AX(i-j,3); %Ss
c_SIM(i,4) = c_AX(i-j,4); %Xsto
c_SIM(i,5) = c_AX(i-j,5); %XBH
c_SIM(i,6) = c_AX(i-j,6); %XBA
c_SIM(i,7) = c_AX(i-j,8); %NH4
c_SIM(i,8) = 0; %NO2
c_SIM(i,9) = c_AX(i-j,9); %NO3
c_SIM(i,10) = c_AX(i-j,7); %orgN
c_SIM(i,11) = (c_AX(i-j,2)+c_AX(i-j,3))/(1-FXi); %total COD

144 Appendices
else
c_SIM(i,1) = c_AE(i-j-length(tstepAX),1); %DO
c_SIM(i,2) = c_AE(i-j-length(tstepAX),2); %Xs
c_SIM(i,3) = c_AE(i-j-length(tstepAX),3); %Ss
c_SIM(i,4) = c_AE(i-j-length(tstepAX),4); %Xsto
c_SIM(i,5) = c_AE(i-j-length(tstepAX),5); %XBH
c_SIM(i,6) = c_AE(i-j-length(tstepAX),6); %XBA
c_SIM(i,7) = c_AE(i-j-length(tstepAX),7); %NH4
c_SIM(i,8) = c_AE(i-j-length(tstepAX),8); %NO2
c_SIM(i,9) = c_AE(i-j-length(tstepAX),9); %NO3
c_SIM(i,10) = c_AX(end,7); %orgN
c_SIM(i,11) = (c_AE(i-j-length(tstepAX),2)+c_AE(i-j-length(tstepAX),3))/(1-FXi); %total COD
end
end
j=i;
start = laenge + 1;
%set new start concentrations
c0AX(1) = c_SIM(end,1); %DO
c0AX(2) = (Xs*VER*Vr + c_SIM(end,11)*FXs*(1-VER)*Vr)/Vr; %Xs
c0AX(3) = (Ss*VER*Vr + c_SIM(end,11)*FSs*(1-VER)*Vr)/Vr; %Ss
c0AX(4) = c_SIM(end,4); %Xsto
c0AX(5) = c_SIM(end,5); %XBH
c0AX(6) = c_SIM(end,6); %XBA
c0AX(7) = (orgN*VER*Vr + c_SIM(end,10)*(1-VER)*Vr)/Vr; %orgN
c0AX(8) = (NH4*VER*Vr + c_SIM(end,7)*(1-VER)*Vr)/Vr; %NH4
c0AX(9) = (NO3*VER*Vr + c_SIM(end,9)*(1-VER)*Vr)/Vr; %NO3
end
%% plotten
tstep = 0:step:numbercycle*tcycle-step;
%plot DO profile
figure(1)
plot(tstep,c_SIM(:,1),'b');
legend('DO-Simulation');
title('\it{O2-profile}','Fontsize',12)
xlabel('{time [h]}','Fontsize',10)
ylabel('concentration [mg/L]','Fontsize',10)
hold on
%plotten COD
figure(2)
plot(tstep,c_SIM(:,2),'k:',tstep,c_SIM(:,3),'k--',tstep,c_SIM(:,4),'k-.',tstep,c_SIM(:,11),'k-');
legend('Xs-Simulation','Ss-Simulation','Xsto-Simulation','total COD');
title('\it{COD removal}','Fontsize',12)
xlabel('{time [h]}','Fontsize',10)
ylabel('concentration [mg/L]','Fontsize',10)
hold on
%plotten biomass
figure(3)
plot(tstep,c_SIM(:,5),'k',tstep,c_SIM(:,6),'k:');
legend('XBH-Simulation','XBA-Simulation');
title('\it{biomass}','Fontsize',12)
xlabel('{time [h]}','Fontsize',10)
ylabel('concentration [mg/L]','Fontsize',10)

Appendices 145
hold on
%plotten N compounds
figure(4)
plot(tstep,c_SIM(:,7),'g',tstep,c_SIM(:,8),'y',tstep,c_SIM(:,9),'r');
legend('NH4-Simulation','NO2-Simulation','NO3-Simulation');
title('\it{N compounds}','Fontsize',12)
xlabel('{time [h]}','Fontsize',10)
ylabel('concentration [mg/L]','Fontsize',10)
hold on
DGL_AX.m
function dcdt = DGL_AX(t,c)
global mueH kdH_NOx YH KS kh Kh ksto Ksto
global kDO KDO KADO
global KANOx kdA_NOx XBA
global KNH KNOx KorgN korgN XBH
global FAX
global x_vector y_vector
%x vector
x1 = x_vector(1);
x3 = x_vector(3);
x5 = x_vector(5);
x8 = x_vector(8);
x12 = x_vector(12);
%y vector
y5 = y_vector(5);
y8 = y_vector(8);
y12 = y_vector(12);
dcdt(1) = - kDO*c(1)/(KDO+c(1)); %cDO(t)
dcdt(2) = - kh*(c(2)/XBH)/(Kh+c(2)/XBH)*XBH; %cXs(t)
dcdt(3) = - FAX*ksto*KDO/(KDO+c(1))*c(3)/(KS+c(3))*c(9)/(KNOx+c(9))*XBH; %cSs(t)
dcdt(4) = x1*kh*c(2)/XBH/(Kh+c(2)/XBH)*XBH +
x3*FAX*ksto*KDO/(KDO+c(1))*c(3)/(KS+c(3))*c(9)/(KNOx+c(9))*XBH -
(1/YH)*mueH*FAX*KDO/(KDO+c(1))*c(4)/(Ksto+c(4))*c(8)/(KNH+c(8))*c(9)/(KNOx+c(9))*XBH;
%cXsto(t)
dcdt(5) =
mueH*FAX*KDO/(KDO+c(1))*(c(4)/XBH)/(Ksto+c(4)/XBH)*c(8)/(KNH+c(8))*c(9)/(KNOx+c(9))*XBH -
kdH_NOx*KDO/(KDO+c(1))*c(9)/(KNOx+c(9))*XBH; %cXBH(t)
dcdt(6) = - kdA_NOx*KADO/(KADO+c(1))*c(9)/(KANOx+c(9))*XBA; %cXBA(t)
dcdt(7) = - korgN*c(7)/(KorgN+c(7))*XBH; %corgN(t)
dcdt(8) = korgN*c(7)/(KorgN+c(7))*XBH -
y5*mueH*FAX*KDO/(KDO+c(1))*(c(4)/XBH)/(Ksto+c(4)/XBH)*c(8)/(KNH+c(8))*c(9)/(KNOx+c(9))*XBH
+ y8*kdH_NOx*KDO/(KDO+c(1))*c(9)/(KNOx+c(9))*XBH +
y12*kdA_NOx*KADO/(KADO+c(1))*c(9)/(KANOx+c(9))*XBA; %cNH(t)
dcdt(9) = -
x5*mueH*FAX*KDO/(KDO+c(1))*(c(4)/XBH)/(Ksto+c(4)/XBH)*c(8)/(KNH+c(8))*c(9)/(KNOx+c(9))*XBH
- x8*kdH_NOx*KDO/(KDO+c(1))*c(9)/(KNOx+c(9))*XBH -
x12*kdA_NOx*KADO/(KADO+c(1))*c(9)/(KANOx+c(9))*XBA; %cNO3(t)
dcdt = [dcdt(1);dcdt(2);dcdt(3);dcdt(4);dcdt(5);dcdt(6);dcdt(7);dcdt(8);dcdt(9)];
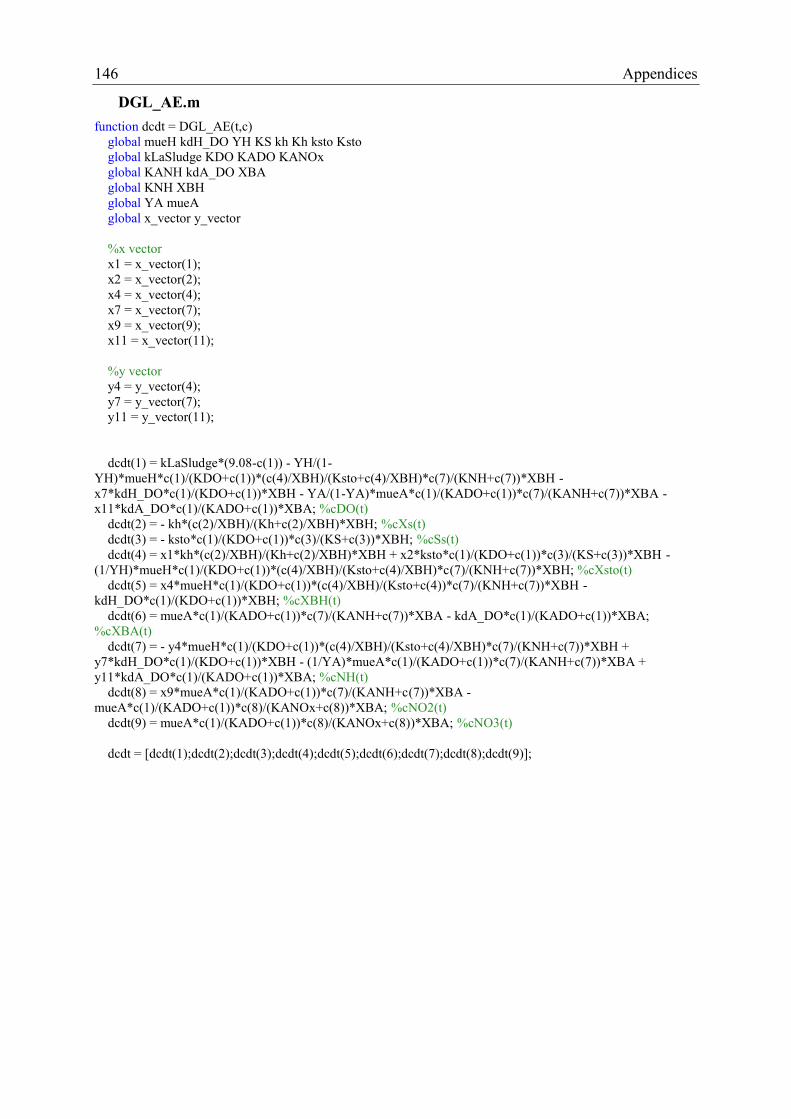
146 Appendices
DGL_AE.m
function dcdt = DGL_AE(t,c)
global mueH kdH_DO YH KS kh Kh ksto Ksto
global kLaSludge KDO KADO KANOx
global KANH kdA_DO XBA
global KNH XBH
global YA mueA
global x_vector y_vector
%x vector
x1 = x_vector(1);
x2 = x_vector(2);
x4 = x_vector(4);
x7 = x_vector(7);
x9 = x_vector(9);
x11 = x_vector(11);
%y vector
y4 = y_vector(4);
y7 = y_vector(7);
y11 = y_vector(11);
dcdt(1) = kLaSludge*(9.08-c(1)) - YH/(1-
YH)*mueH*c(1)/(KDO+c(1))*(c(4)/XBH)/(Ksto+c(4)/XBH)*c(7)/(KNH+c(7))*XBH -
x7*kdH_DO*c(1)/(KDO+c(1))*XBH - YA/(1-YA)*mueA*c(1)/(KADO+c(1))*c(7)/(KANH+c(7))*XBA -
x11*kdA_DO*c(1)/(KADO+c(1))*XBA; %cDO(t)
dcdt(2) = - kh*(c(2)/XBH)/(Kh+c(2)/XBH)*XBH; %cXs(t)
dcdt(3) = - ksto*c(1)/(KDO+c(1))*c(3)/(KS+c(3))*XBH; %cSs(t)
dcdt(4) = x1*kh*(c(2)/XBH)/(Kh+c(2)/XBH)*XBH + x2*ksto*c(1)/(KDO+c(1))*c(3)/(KS+c(3))*XBH -
(1/YH)*mueH*c(1)/(KDO+c(1))*(c(4)/XBH)/(Ksto+c(4)/XBH)*c(7)/(KNH+c(7))*XBH; %cXsto(t)
dcdt(5) = x4*mueH*c(1)/(KDO+c(1))*(c(4)/XBH)/(Ksto+c(4))*c(7)/(KNH+c(7))*XBH -
kdH_DO*c(1)/(KDO+c(1))*XBH; %cXBH(t)
dcdt(6) = mueA*c(1)/(KADO+c(1))*c(7)/(KANH+c(7))*XBA - kdA_DO*c(1)/(KADO+c(1))*XBA;
%cXBA(t)
dcdt(7) = - y4*mueH*c(1)/(KDO+c(1))*(c(4)/XBH)/(Ksto+c(4)/XBH)*c(7)/(KNH+c(7))*XBH +
y7*kdH_DO*c(1)/(KDO+c(1))*XBH - (1/YA)*mueA*c(1)/(KADO+c(1))*c(7)/(KANH+c(7))*XBA +
y11*kdA_DO*c(1)/(KADO+c(1))*XBA; %cNH(t)
dcdt(8) = x9*mueA*c(1)/(KADO+c(1))*c(7)/(KANH+c(7))*XBA -
mueA*c(1)/(KADO+c(1))*c(8)/(KANOx+c(8))*XBA; %cNO2(t)
dcdt(9) = mueA*c(1)/(KADO+c(1))*c(8)/(KANOx+c(8))*XBA; %cNO3(t)
dcdt = [dcdt(1);dcdt(2);dcdt(3);dcdt(4);dcdt(5);dcdt(6);dcdt(7);dcdt(8);dcdt(9)];