Mendelian Genetics Blue People of Kentucky Methemoglobinemia.

Gretchen Onstad ENV H 111
11/22/11

Global Water Overview Water Scarcity
Consumption Advanced treatment
Diarrheal disease prevention Point-of-use water treatment techniques
Groundwater contaminants Arsenic Fluoride Nitrate

Historical Water Use

Water Use and Trade

Water Resources and Water Scarcity High Plains Aquifer
30% irrigation in US Source: fossil water Withdrawal rate > return Will empty in 20-30 yrs Agriculture has influenced
water quality
High Plains Aquifer co.water.usgs.gov/nawqa/hpgw

Water Supply Water Stress: Water supply ≤ 1700 m3/person/year
Water Scarcity: Water supply ≤ 1000 m3/person/year
Water conservation Behavior & lifestyle changes
Less meat consumption & water waste Distribution system improvement
Repair leaky pipes Efficient irrigation & land use
Climate Change Aquifer storage & recovery Building additional reservoirs Using seawater as water resource
1 m3 = 1000 liters

Desalination Removal of salt and other minerals from water
Water for human consumption Irrigation water Table salt
Requires energy and specialized equipment Not dependent on rainfall Common Methods
Distillation Ion exchange Membrane Filtration
Reverse Osmosis Schematic of a multiflash evaporator A - Steam in, B - Seawater in, C - Potable water out, D - Waste out, E - Steam out, F - Heat exchange, G - Condensation collection, H - Brine heater
Castelnuovo (2010)

Fundamentals Filtration Media
Sorption Hydrophobic compounds stick to surface of particles ex: Sand or granular activated carbon (GAC)
Ion Exchange (cation or anion) Contains ionic pairs on particle surface that exchange ions for
ionic chemical contaminants
Reverse Osmosis Pressure applied to one side of membrane causes contaminants
to be retained and water to pass through
Units of chemical contaminants in water PPB = μg/L PPM = mg/L

Water Reuse – Reclaimed Water Process of separating solids from liquids in
wastewater and reusing liquid (after treatment) Industrial cooling Irrigation of non-edible plants (high N and P) Toilet flushing Recharge groundwater aquifers
Wastewater separation Black water: toilet wastes & garbage disposal Gray Water: bath & shower water

Prevention through Household Water Treatment
Water For Life (2005-2015) Millenium Development Goal set by WHO/UNICEF
50% reduction in population lacking access to improved water & sanitation by 2015
International Decade for Action: Water & Sanitation improvement projects
Public-private partnerships Investments by large corporations Focus on microfinancing & local initiatives with community-
based and nongovernmental organizations (NGOs) Ecological sanitation that’s culturally acceptable Develop water safety plan accounting for scarcity Greater use of household water treatment

Improved water access Household connections Public standpipes Rainwater collection Boreholes Protected wells
NOT Water vendors Unprotected wells, springs,
rivers, ponds Tanker truck water
Improved sanitation Connection to
Public sewers Septic systems Pour-flush and improved pit
latrines
NOT Shared, traditional or open
pit latrines

Diarrheal Disease 2.2 million deaths per year from unsafe water
WHO/UNICEF (2005)

Potential Contamination
Red Cross (2008)
Collection Transport Storage Consumption

Point-of-use Water Treatment: Prevention of Diarrheal Disease CDC recommends
Chlorination Ceramic Filtration SODIS (solar disinfection) PUR packets
Red Cross recommends Disinfection Sedimentation Filtration
WHO/UNICEF (2005)
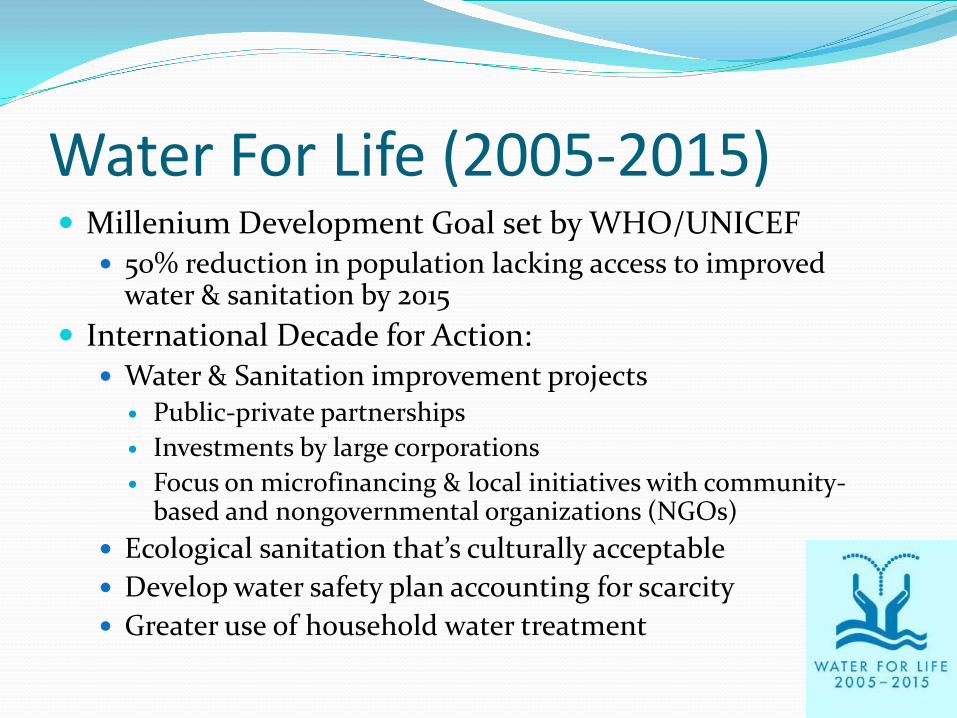
Household Chlorination Procedure
Capful added to water storage container
Benefits 22-84% reduction in diarrhea Cost 0.05 cents/liter Residual disinfectant Easy to use Scalable
Drawbacks Taste and odor Less protection against organisms in turbid water
The PSI Chlorination Product in Nigeria

Ceramic Filtration – Potters for Peace Trains local potters to make filters and creates local
industry Production
Local clay placed in metal mold Press by truck jack Fire in kiln Check flow is 1-2.5 L/hr Optional: dip in colloidal silver
Procedure Pour water in bucket containing filter
Disease Prevention Filter removes pathogens > 0.2 μm size Silver inactivates bacteria, viruses, fungi, parasites

Ceramic Filtration – Potters for Peace Benefits
60-70% reduction in diarrhea (safe storage) Cost 0.14 cents/liter Easy to use Long filter life Local production
Drawbacks Unknown virus protection Lack of residual disinfectant (potential
recontamination) Necessary user education for clean filter and receptacle Slow flow rates

Solar Disinfection Procedure
Pour water into plastic bottles Place in direct sunlight for 6 hours
Benefits UV irradiation kills pathogens (E.coli) Infrared irradiation raises temp to 50 ˚C, killing pathogens Prevents 9-86% diarrhea ZERO Cost Easy to use
Drawbacks Turbid water requires pretreatment Limited water volume Time required Plastic bottles required
www.eawag.ch

PUR: Flocculant / Disinfectant Powder Ingredients: iron sulfate and sodium hypochlorite (NaOCl) Procedure
Sachet added to 10 Liters water, stirred, settled, filtered through cotton cloth, wait 20 minutes
Benefits 16->90% reduction in diarrhea Cost 1 cent/liter Removes turbidity & some chemical contaminants Kills viruses & bacteria Disinfecting residual protection
Drawbacks Multiple steps Materials needed
www.purpurifierofwater.com

Naturally-occurring Groundwater Contaminants

Bangladesh Many polluted rivers 1970’s – 250,000 children died per year from
waterborne disease 1970-80’s - 12 million shallow (<50 m) tube wells
installed by UNICEF and World Bank 1990’s – Observed health effects from chronic Arsenic
ingestion 30% tube wells contain high Arsenic levels
sciguru.com

Arsenic Ingestion Health Effects Long-term exposure
Cancer (skin, bladder, kidney, liver, lung) Skin lesions
Hyper-pigmentation Keratosis
Peripheral vascular disease Liver necrosis (as low as 10 μg/L) GI disturbances Fatigue
Keratosis Hussam (2009) Global Environmental Health

Arsenic Sources
Anthropogenic – pesticides Volcanic – hot springs Natural weathering of arsenic bearing minerals – arsenopyrite
Strongly reducing conditions Arid environments with high pH Mining activities (low pH)
Natural abundance South Asia - Bangladesh South America
10 μg/L MCL in drinking water US EPA and WHO guidelines
Leupin (2004) ETH Thesis

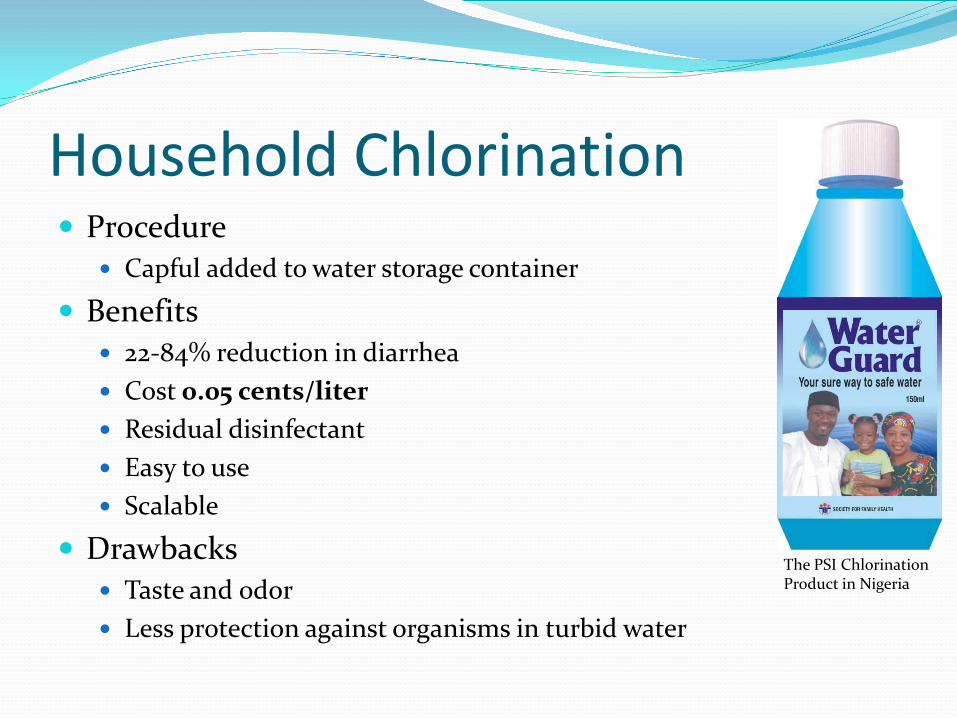
World Arsenic Map
Smedley (2002) Appl Geochem
Bangladesh Arsenic Map
Smedley (2002) Appl Geochem
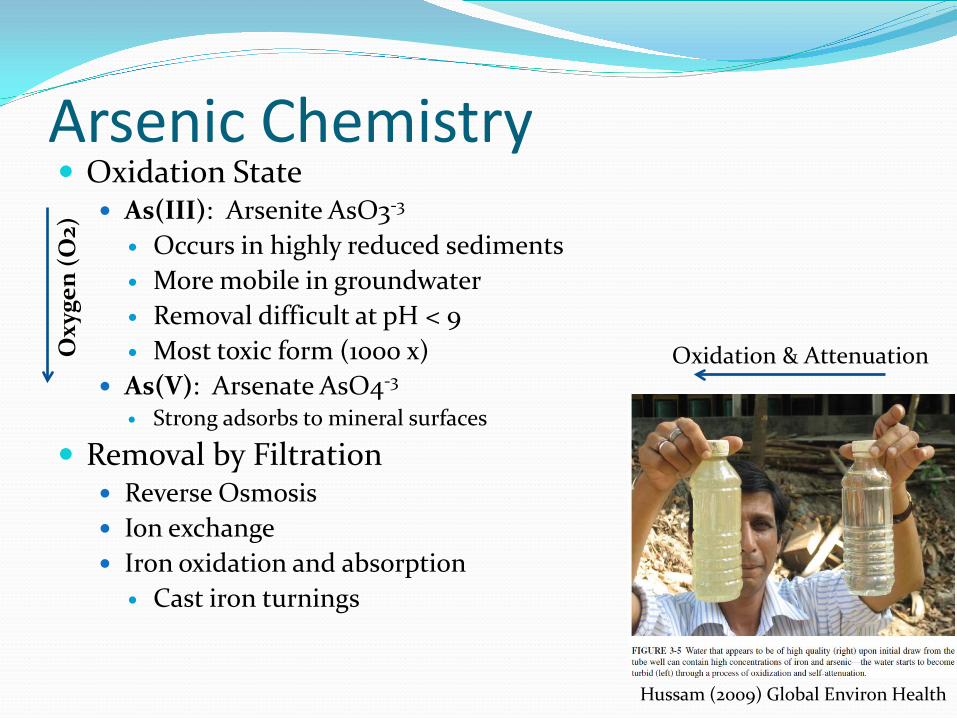
Arsenic Chemistry Oxidation State
As(III): Arsenite AsO3-3
Occurs in highly reduced sediments More mobile in groundwater Removal difficult at pH < 9 Most toxic form (1000 x)
As(V): Arsenate AsO4-3 Strong adsorbs to mineral surfaces
Removal by Filtration Reverse Osmosis Ion exchange Iron oxidation and absorption
Cast iron turnings
Hussam (2009) Global Environ Health
Oxidation & Attenuation Oxy
gen
(O2)

Arsenic Treatment
CIM: Composite Iron Matrix Hussam (2007) J Environ Sci Health Hussam (2009) Global Environmental Health

Arsenic Removal Benefits
20-60 liters/hour (5 years) Effluent <10 μg/L total As, <2 μg/L arsenite Removal of manganese, iron, barium, etc. CIM can be recycled for new filter or metallic iron
Drawbacks Cost $40 When iron hydroxide precipitates in sand, have to clean or
replace it Removal of arsenic from drinking water can significantly
reduce body burden of As within 2 years.

Fluoride Map
www.eawag.ch

Fluoride Removal WHO guideline 1.5 mg/L Up to 10 mg/L detected in groundwater Filtration through Bone Charcoal
ion-exchange/adsorption process Benefits
Prevention of dental/skeletal fluorosis Drawbacks
Taste and odor Social resistance to handling fresh bone Materials & time (kiln @400˚C, 5 days)
Bone char filter www.eawag.ch
Skeletal Fluorosis www.unicef.org
NO3-

Simplified Nitrogen Cycle
NH4 Ammonia
NO2–
Nitrite NO3
–
Nitrate N2
Nitrogen
Nitrosofying Bacteria
Nitrifying Bacteria
Denitrifying Bacteria
Nitrogen Fixation
Nitrification Denitrification
Aerobic Anaerobic

Sources of Nitrates in Water Septic systems
on-site waste water disposal systems Runoff and leaching from
agricultural land, residential lawns and gardens (nitrogenous fertilizers)
Animal wastes confined animal feeding operations horses in the pasture

Health Effects of Nitrates: Blue Baby Syndrome Methemoglobinemia
In humans, nitrate (NO3-) is reduced to nitrite (NO2
-) Nitrite binds with hemoglobin to form
methemoglobin (metHb), a substance that cannot bind and transport oxygen
Methemoglobinemia affects bottle-fed infants and pregnant women when >10% metHb
Maximum nitrite and nitrate concentrations allowed in drinking water are 1 mg/L NO2-N and 10 mg/L NO3-N

Health Effects of Nitrates: Cancer Risk Nitrate is reduced to nitrite (by denitrifying bacteria in
the body) Nitrite generates a variety of HxNyOz species that can
nitrosate amino acids Formation of genotoxic N-nitroso-compounds (NOC):
nitrosamines & nitrosamides Nitrate exposure has been associated with cancers of the
esophagus, stomach, colon, bladder, lymphatic system, and hematopoietic system
Ward MH, deKok TM, Levallois P, Brender J, Gulis G, Nolan BT, et al. Workgroup report: Drinking-water nitrate and health-recent findings and research needs. Environ Health Perspect. 2005;113(11):1607-14.
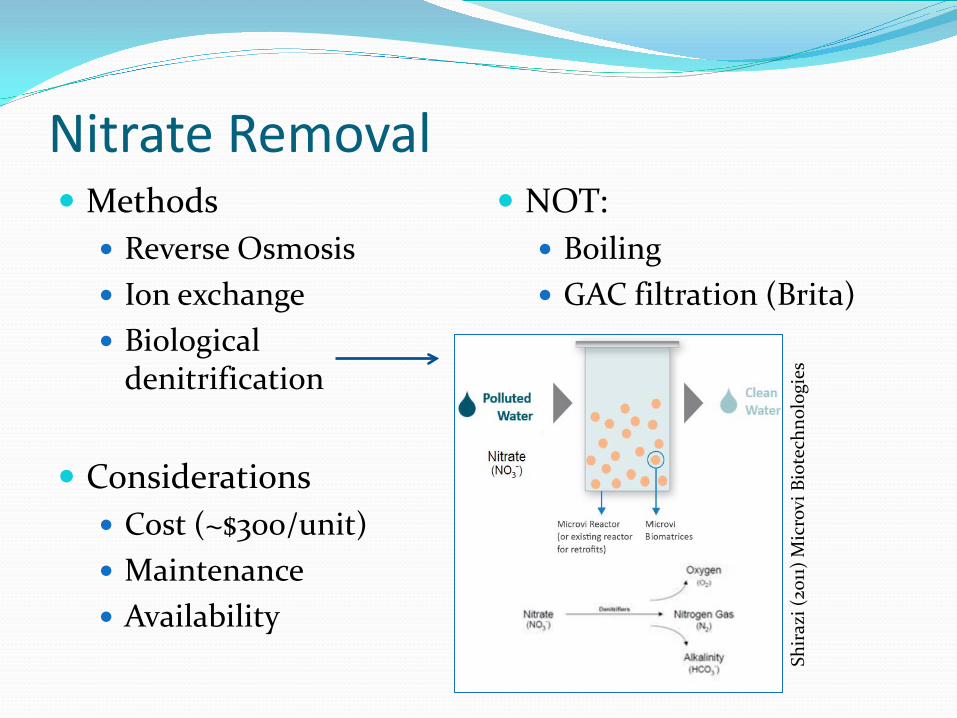
Nitrate Removal Methods
Reverse Osmosis Ion exchange Biological
denitrification
Considerations Cost (~$300/unit) Maintenance Availability
NOT: Boiling GAC filtration (Brita)
Shir
azi (
2011)
Mic
rovi
Bio
tech
nolo
gies
Case Study: Yakima Valley, WA Nitrate is the most common contaminant drinking water
wells in Washington State Dept of Health Study The specific objectives of this study were to: 1. Estimate the intake of methemoglobin inducers (i.e., nitrate,
copper, chlorination products, medications) by infants and their effects on methemoglobin levels.
2. Estimate the effect of potential endogenous production of nitrite (i.e. symptoms of infection and GI distress) on the level of methemoglobin in infants.
3. Examine mothers’ knowledge and attitudes regarding the risks associated with the use of private well water for infants.
http://cfpub.epa.gov/ncer_abstracts/index.cfm/fuseaction/display.abstractDetail/abstract/5379
VanDerslice J. Dose-Response of Nitrate and Other Methemoglobin Inducers on Methemoglobin Levels of Infants: US EPA National Center For Environmental Research, WSD Health 2007. EPA Grant Number: R829781

Case Study: Yakima Valley, WA
VanDerslice J. Dose-Response of Nitrate and Other Methemoglobin Inducers on Methemoglobin Levels of Infants: US EPA National Center For Environmental Research, WSD Health 2007. EPA Grant Number: R829781

Case Study: Yakima Valley, WA
VanDerslice J. Dose-Response of Nitrate and Other Methemoglobin Inducers on Methemoglobin Levels of Infants: US EPA National Center For Environmental Research, WSD Health 2007. EPA Grant Number: R829781

Case Study: Yakima Valley, WA
VanDerslice J. Dose-Response of Nitrate and Other Methemoglobin Inducers on Methemoglobin Levels of Infants: US EPA National Center For Environmental Research, WSD Health 2007. EPA Grant Number: R829781
RfD = 1.6 mg/(kg day)
* reference dose (RfD) is the US EPA's maximum acceptable oral dose of a toxic substance.

Case Study: Yakima Valley, WA
VanDerslice J. Dose-Response of Nitrate and Other Methemoglobin Inducers on Methemoglobin Levels of Infants: US EPA National Center For Environmental Research, WSD Health 2007. EPA Grant Number: R829781
10%

Case Study: Yakima Valley, WA No clinical cases of methemoglobinemia (>10% metHb) Exposure to nitrate from drinking water increases the risk
of an infant having elevated levels of methemoglobin Risk for exposures >0.5 mg NO3-N/kg day, 1/3 of RfD* 4 % of infants (1-5 months) with this exposure Infants who were given water containing >5 mg/L NO3-N
had exposures >0.5 mg/kg day. Exposure to Total Coliforms or E.Coli positive drinking
water was associated with having > 2 % metHb.
* reference dose (RfD) is the US EPA's maximum acceptable oral dose of a toxic substance.
VanDerslice J. Dose-Response of Nitrate and Other Methemoglobin Inducers on Methemoglobin Levels of Infants: US EPA National Center For Environmental Research, WSD Health 2007. EPA Grant Number: R829781

Nitrate Treatment Pilot Program Final Report - June 30, 2011 www.yakimacounty.us/nitrateprogram/english/default.htm
Lower Yakima Valley Groundwater. 2010
http://yosemite.epa.gov/R10/WATER.NSF/GWPU/lyakimagw

References Coussens, C. (2009) Global Environmental Health: Research gaps and barriers for providing
sustainable water, sanitation, and hygiene services. National Academic Press, Washington, D.C. Frumkin, H. (2010) Environmental Health: From Global to Local, 2nd Ed., Jossey-Bass. Leupin, O.X. (2004) Arsenic Removal at the Household Level, Dissertation ETH No. 15783, Zuerich,
Switzerland. Smedley, P.L.; Kinniburgh, D.G. (2002) Applied Geochemistry 17:517-568. Symons, J.M. (2010) Plain Talk About Drinking Water: Questions and Answers About the Water You
Drink. American Water Works Association, Denver, CO. Web links: Wikipedia.org, EPA.gov, pottersforpeace.org, cdc.gov, co.water.usgs.gov, unicef.org,
microvibiotech.com, doh.wa.gov