Greenhouse gas reporting of the LULUCF sector: background ...
74
I.J.J. van den Wyngaert, H. Kramer, P.J. Kuikman and J.P. Lesschen Alterra report 1035.8 ISSN 1566-7197 Greenhouse gas reporting of the LULUCF sector: background to the Dutch NIR 2011
Transcript of Greenhouse gas reporting of the LULUCF sector: background ...

Alterra is part of the international expertise organisation Wageningen UR (University & Research centre). Our mission is ‘To explore the potential of nature to improve the quality of life’. Within Wageningen UR, nine research institutes – both specialised and applied – have joined forces with Wageningen University and Van Hall Larenstein University of Applied Sciences to help answer the most important questions in the domain of healthy food and living environment. With approximately 40 locations (in the Netherlands, Brazil and China), 6,500 members of staff and 10,000 students, Wageningen UR is one of the leading organisations in its domain worldwide. The integral approach to problems and the cooperation between the exact sciences and the technological and social disciplines are at the heart of the Wageningen Approach.
Alterra is the research institute for our green living environment. We offer a combination of practical and scientific research in a multitude of disciplines related to the green world around us and the sustainable use of our living environment, such as flora and fauna, soil, water, the environment, geo-information and remote sensing, landscape and spatial planning, man and society.
More information: www.alterra.wur.nl/uk I.J.J. van den Wyngaert, H. Kramer, P.J. Kuikman and J.P. Lesschen
Alterra report 1035.8
ISSN 1566-7197
Greenhouse gas reporting of the LULUCF sector: background to the Dutch NIR 2011
Alterra is part of the international expertise organisation Wageningen UR (University & Research centre). Our mission is ‘To explore the potential of nature to improve the quality of life’. Within Wageningen UR, nine research institutes – both specialised and applied – have joined forces with Wageningen University and Van Hall Larenstein University of Applied Sciences to help answer the most important questions in the domain of healthy food and living environment. With approximately 40 locations (in the Netherlands, Brazil and China), 6,500 members of staff and 10,000 students, Wageningen UR is one of the leading organisations in its domain worldwide. The integral approach to problems and the cooperation between the exact sciences and the technological and social disciplines are at the heart of the Wageningen Approach.
Alterra is the research institute for our green living environment. We offer a combination of practical and scientific research in a multitude of disciplines related to the green world around us and the sustainable use of our living environment, such as flora and fauna, soil, water, the environment, geo-information and remote sensing, landscape and spatial planning, man and society.


Greenhouse gas reporting of the LULUCF sector:
background to the Dutch NIR 2011

Commissioned by Ministry of Agriculture, Nature Management and Food Quality, Cluster sustainable rural areas,
Theme climate change, project BO-01-004.)
Greenhouse gas reporting of the LULUCF sector: background to the Dutch NIR 2011
I.J.J. van den Wyngaert, H. Kramer, P.J. Kuikman and J.P. Lesschen
Alterra report 1035.8 Alterra, part of Wageningen UR Wageningen, 2011

Abstract Wyngaert, I.J.J. van den, H. Kramer, P.J. Kuikman and J.P. Lesschen, 2011. Greenhouse gas reporting of the LULUCF sector: background to the Dutch NIR 201. Wageningen, Alterra, Alterrareport 1035.8. 70 pp.; 10 fig.; 15 tab.; 9 ref. This report contains a complete description of the Dutch Greenhouse gas calculations and reporting of the LULUCF sector used for the 2011 submission Keywords: national system greenhouse gases, LULUCF, the Netherlands
ISSN 1566-7197 The pdf file is free of charge and can be downloaded via the website www.alterra.wur.nl (go to Alterra reports). Alterra does not deliver printed versions of the Alterra reports. Printed versions can be ordered via the external distributor. For ordering have a look at www.rapportbestellen.nl. © 2011 Alterra (an institute under the auspices of the Stichting Dienst Landbouwkundig Onderzoek) P.O. Box 47; 6700 AA Wageningen; The Netherlands, [email protected]
– Acquisition, duplication and transmission of this publication is permitted with clear acknowledgement of the source.
– Acquisition, duplication and transmission is not permitted for commercial purposes and/or monetary gain.
– Acquisition, duplication and transmission is not permitted of any parts of this publication for which the copyrights clearly rest
with other parties and/or are reserved.
Alterra assumes no liability for any losses resulting from the use of the research results or recommendations in this report. Alterra report 1035.8 Wageningen, August 2011

Contents
Preface 7
Summary 9
1 Introduction 11
2 National System for GHG reporting for the LULUCF sector - an overview 13
3 Definition of Land Use categories 15 3.1 Forest Land 15 3.2 Cropland 16 3.3 Grassland 16 3.4 Wetland 17 3.5 Settlements 17 3.6 Other Land 18 3.7 Overview of land use allocation 19
4 Land use change matrix 21 4.1 Introduction 21 4.2 Methodology 21 4.3 Land use change matrix 22 4.4 Peat soils 24 4.5 Conclusions 25
5 Update of the carbon emissions from living biomass 27 5.1 Forest land remaining Forest Land 27
5.1.1 Forest according to the Kyoto definition 27 5.1.2 Trees outside Forest 29
5.2 Forest Land converted to other land use classes 30 5.2.1 Forest according to the Kyoto definition 30 5.2.2 Trees outside Forest 31
5.3 Land converted to Forest Land 31 5.3.1 Forest according to the Kyoto definition 31 5.3.2 Trees outside Forest 33
6 Update of the carbon emissions from dead organic matter in forests 35 6.1 Forest according to the Kyoto definition 35 6.2 Trees outside Forest 37
7 Update of the carbon emissions from soils 39
8 Submission 2011: values and comparison with previous submissions 45 8.1 Calculated values for the submission 2011 45 8.2 Comparison with submission 2010 46
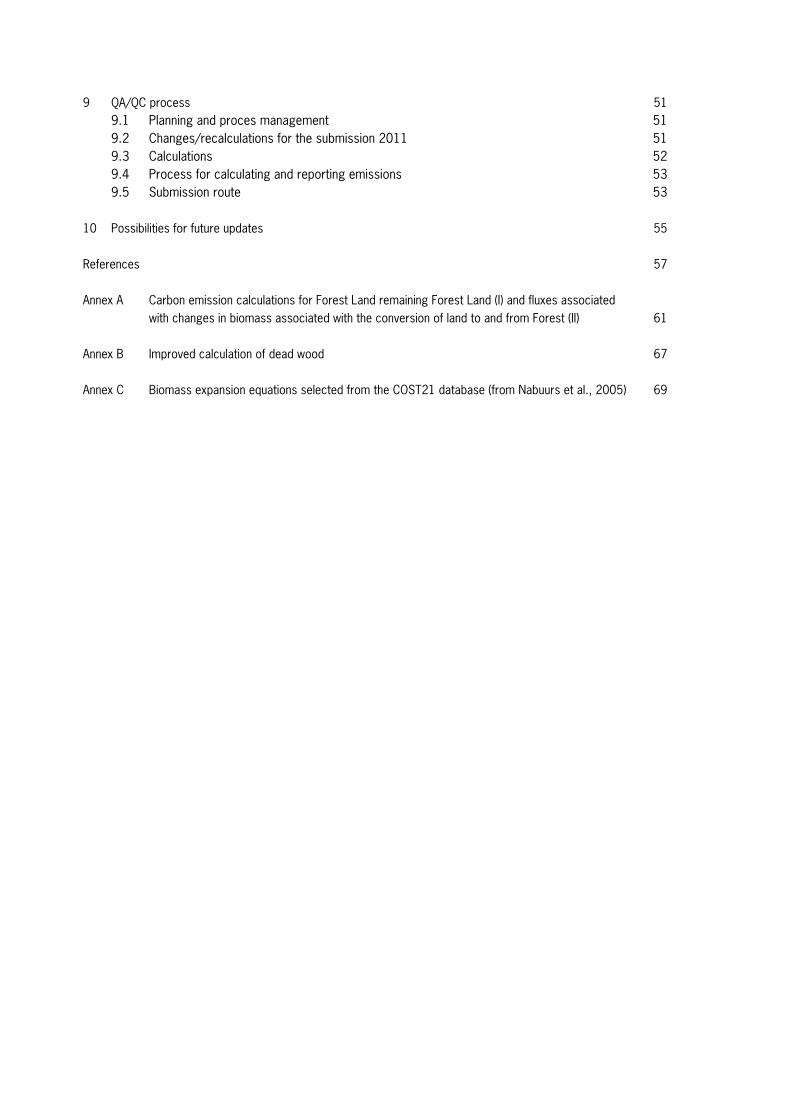
9 QA/QC process 51 9.1 Planning and proces management 51 9.2 Changes/recalculations for the submission 2011 51 9.3 Calculations 52 9.4 Process for calculating and reporting emissions 53 9.5 Submission route 53
10 Possibilities for future updates 55
References 57
Annex A Carbon emission calculations for Forest Land remaining Forest Land (I) and fluxes associated with changes in biomass associated with the conversion of land to and from Forest (II) 61
Annex B Improved calculation of dead wood 67
Annex C Biomass expansion equations selected from the COST21 database (from Nabuurs et al., 2005) 69

Alterra report 1035.8 7
Preface
This report contains a complete description of the Dutch National System for Greenhouse gas Reporting of the LULUCF sector used for the 2011 submission. The authors would like to thank Bas Clabbers, Gert-Jan van den Born, Klaas van der Hoek and Harry Vreuls, who contributed to the quality of this report by reading and commenting on earlier versions.

8 Alterra report 1035.8
Alterrareport 1035.8 9
Summary
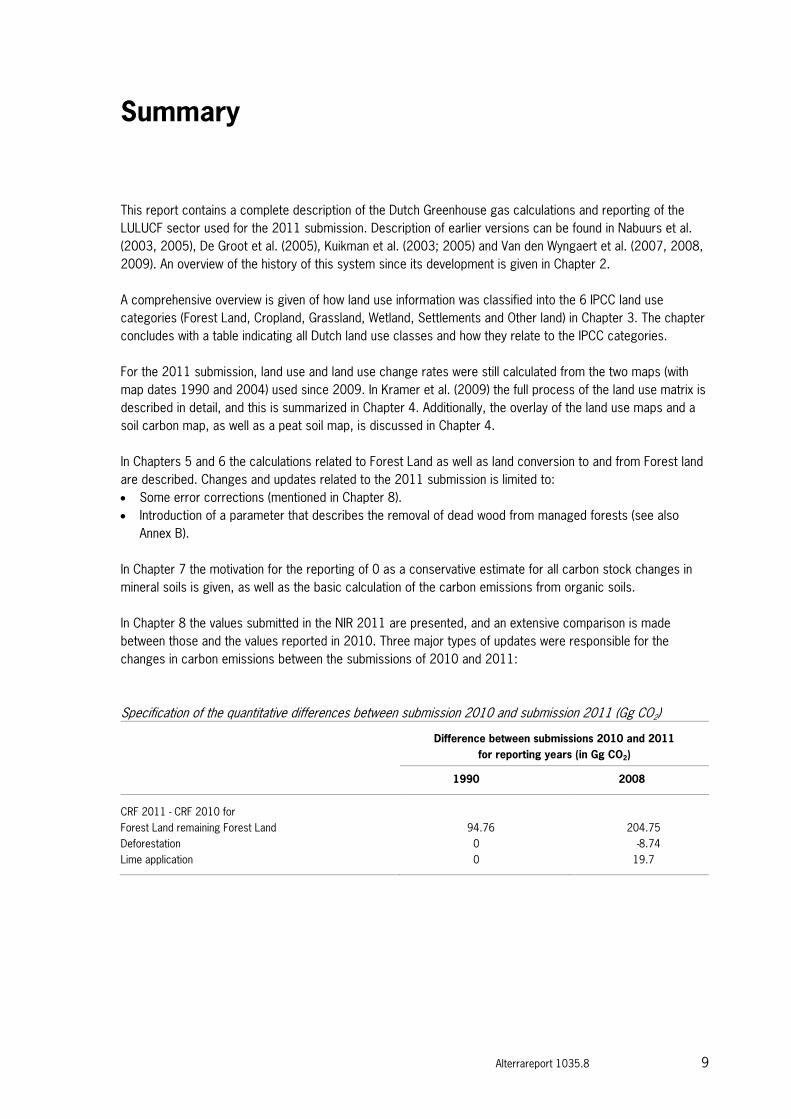
This report contains a complete description of the Dutch Greenhouse gas calculations and reporting of the LULUCF sector used for the 2011 submission. Description of earlier versions can be found in Nabuurs et al. (2003, 2005), De Groot et al. (2005), Kuikman et al. (2003; 2005) and Van den Wyngaert et al. (2007, 2008, 2009). An overview of the history of this system since its development is given in Chapter 2. A comprehensive overview is given of how land use information was classified into the 6 IPCC land use categories (Forest Land, Cropland, Grassland, Wetland, Settlements and Other land) in Chapter 3. The chapter concludes with a table indicating all Dutch land use classes and how they relate to the IPCC categories. For the 2011 submission, land use and land use change rates were still calculated from the two maps (with map dates 1990 and 2004) used since 2009. In Kramer et al. (2009) the full process of the land use matrix is described in detail, and this is summarized in Chapter 4. Additionally, the overlay of the land use maps and a soil carbon map, as well as a peat soil map, is discussed in Chapter 4. In Chapters 5 and 6 the calculations related to Forest Land as well as land conversion to and from Forest land are described. Changes and updates related to the 2011 submission is limited to: • Some error corrections (mentioned in Chapter 8). • Introduction of a parameter that describes the removal of dead wood from managed forests (see also
Annex B). In Chapter 7 the motivation for the reporting of 0 as a conservative estimate for all carbon stock changes in mineral soils is given, as well as the basic calculation of the carbon emissions from organic soils. In Chapter 8 the values submitted in the NIR 2011 are presented, and an extensive comparison is made between those and the values reported in 2010. Three major types of updates were responsible for the changes in carbon emissions between the submissions of 2010 and 2011: Specification of the quantitative differences between submission 2010 and submission 2011 (Gg CO2)
Difference between submissions 2010 and 2011 for reporting years (in Gg CO2)
1990 2008
CRF 2011 - CRF 2010 for Forest Land remaining Forest Land 94.76 204.75 Deforestation 0 -8.74 Lime application 0 19.7

10 Alterra report 1035.8
In Chapter 9 and Annex F the formal QA/QC is presented. Finally, in Chapter 10 some outlook into the future is proposed. The following improvements were identified in previous reports but were envisaged for the NIR 2010 or later, either because they are still under discussion, still under development or need data that will become available only at a point further in time: • installation of more subcategories in Grassland, i.e. distinction between rotational grassland, permanent
grassland and natural grasslands; • periodic updating of carbon emission from change in biomass in Forest land remaining Forest land as new
data become available (new MFV cycles).
Alterrareport 1035.8 11
1 Introduction
As a Party to the United Nations Framework Convention on Climate Change the Netherlands has the obligation to design and make operational a system for reporting of greenhouse gases (GHG) (Article 5 of the UNFCCC). For GHG reporting of the Land Use, Land Use Change and Forests (LULUCF) sector, the Netherlands has developed and improved an overall approach within the National System since 2003. This LULUCF part of the National System has been deployed for the National Inventory Reports (NIR’s) since 2005, covering the period since 2003. It was also used for a full recalculation of the period 1990 - 2003. This LULUCF part of the Dutch National System has been documented in several publications. See e.g. Nabuurs et al. (2003, 2005), Van den Wyngaert et al. (2007, 2008, 2009) and De Groot et al. (2005), Kuikman et al. (2003, 2005). The list of reports over the years reflects the continuous series of improvements and updates to the LULUCF sector within the Dutch National System. This report describes the current version, as used for the 2011 submission under the Convention. Reporting under the Kyoto protocol is described in Van den Wyngaert et al. (2011). An overview of the current version of the LULUCF sector, with the current Tiers and methodologies is provided (Chapter 2). The current definitions of land use categories as was written in 2009 is retained (Chapter 3). The latest land use change matrix is incorporated and consequences of extrapolation for the submitted values are discussed (Chapter 4). The calculation methods for living biomass in Forest Land are elaborated in Chapter 5, while Chapter 6 deals with the calculation of carbon storage (changes) in dead organic matter in Forest Land. Chapter 7 deals mainly with reporting of carbon emissions from mineral soils. Chapter 8 summarizes all values and compares the net effect of all improvements with earlier submissions. The QA/QC process that has been followed is given in Chapter 9. The report concludes with a plan of future improvements to the National System for LULUCF (Chapter 10).

12 Alterra report 1035.8

Alterrareport 1035.8 13
2 National System for GHG reporting for the LULUCF sector - an overview
The current national system is based on the establishment of a land use and land use change matrix for the period 1990-2004 based on topographical maps (see also De Groot et al. (2005) for motivation of topographical maps as basis for land use calculations). The maps for 1990 and 2004 are gridded in a harmonised way and an overlay produced all land use transitions within this period (Kramer et al., 2009). An overlay between the two land use maps with the organic soil map (Kuikman et al., 2005) allowed estimating the areas of organic soils for reporting categories Forest Land, Cropland and Grassland. The carbon balance for live and dead biomass in Forest Land remaining Forest Land is based on National Forest Inventory (NFI) data using a simple bookkeeping model (Nabuurs et al., 2005; Annex A). NFI plot data are available from two inventories: the HOSP dataset (1988-1992; 3448 plots) (Daamen and Stolp, 1997) and the MFV dataset (2001-2005; 3622 plots) (Dirkse et al., 2007). The accumulation of carbon in dead wood has been updated in 2011 to reflect better the difference in measured values in the two inventories. Carbon stored in litter is estimated from a combination of national data sets (see Chapter 7). The carbon balance for areas changing away from Forest Land is based on the mean national stocks as calculated from the NFI data for biomass and the combined data sets for forest litter. The carbon balance for areas changing to Forest Land is based on national mean growth rates for young forests derived from the NFI data (see also Chapter 6). Carbon in the soil is based on a recent National Soil Sampling Programme (NSSP) carried out between 1990 and 2000 (De Groot et al., 2005). A national soil C map was constructed based on these samples (including some gaps). The C stock for each land use (transition) category was derived from overlays between the soil C map and the land use maps for 1990 and 2000 (de Groot et al., 2005). The carbon emission from cultivation of organic soils was estimated for all organic soils based on ground surface lowering and the characteristics of the peat layers (Kuikman et al., 2005). Ground surface lowering was estimated from either ditch water level or mean lowest groundwater level (Kuikman et al., 2005). In the 2011 submission, the following calculated emission values are reported (Table 2.1).

14 Alterra report 1035.8
Table 2.1
Variables for which emissions are reported in the National System per land use (transition) category in 2011. New variables are
printed with black background.
From→ To↓
Forest Cropland Grassland Wetland Settlement Other land
Forest Biomass (gain, loss) + DOM (dead wood, litter)
Biomass gain Biomass gain Biomass gain Biomass gain Biomass gain
Cropland Biomass loss + DOM (dead wood, litter)
Lime application
- - - -
Grassland Biomass loss + DOM (dead wood, litter)
- Cultivation of organic soils
- - -
Wetland Biomass loss + DOM (dead wood, litter)
- - - - -
Settlement Biomass loss + DOM (dead wood, litter)
- - - - -
Other land Biomass loss + DOM (dead wood, litter)
- - - - -

Alterrareport 1035.8 15
3 Definition of Land Use categories
The IPCC GPG distinguishes six main groups of land use categories: Forest Land, Cropland, Grassland, Wetland, Settlements and Other Land. Countries are encouraged to stratify these main groups further e.g. by climate or ecological zones, or special circumstances (e.g. separate forest types in Forest Land) that affect emissions. In the Netherlands, stratification has been used for Forest Land, Grassland and Wetlands. The natural climax vegetation in the Netherlands is forest. Thus, except for natural water bodies and coastal sands, without human intervention all land would be covered by forests. Though different degrees of management may be applied in forests, all forests are relatively close to the natural climate vegetation. Extensive human intervention creates vegetation types that differ more from the natural climax vegetation like heathers and natural grasslands. More intensive human intervention results in agricultural grasslands. In general, an increasing degree of human intervention is needed for croplands and systems in the category Settlements are entirely created by humans. This logic is followed in the allocation of land to land use categories. In addition, lands are allocated to wetlands when they conform to neither of the former land use categories and do conform to the IPCC GPG definition of wetlands. This includes open water bodies, which are typically not defined as wetlands in the scientific literature. Until and including the 2008 submission, open water bodies were included in the Other Land category for that reason. However, from the 2009 submission on they form a separate subcategory of wetlands. The remaining lands in the Netherlands, belonging to neither of the former categories, are sandy areas with extremely little carbon in the soil. These were and are again included in Other Land. 3.1 Forest Land
The land use category 'Forest Land' is defined as all land with woody vegetation consistent with thresholds used to defined forest land in the national GHG inventory, sub divided into managed and unmanaged units and also by ecosystem type as specified in IPCC Guidelines. It also includes systems with vegetation that currently fall below, but are expected to exceed the threshold of the forest land category (IPCC, 2003, 2006). The Netherlands has chosen to define the land use category 'Forest Land' as all land with woody vegetation, now or expected in the near future (e.g. clearcut areas to be replanted, young afforestations). This is further stratified in: • 'Forest' or 'Forest according to the Kyoto definition' (FAD), i.e. all forest land which complies to the
following (more strict than IPCC) definition chosen by the Netherlands for the Kyoto protocol: forests are patches of land exceeding 0.5 ha with a minimum width of 30 m, with tree crown cover at least 20% and tree height at least 5 meters, or, if this is not the case, these thresholds are likely to be achieved at the particular site. Roads in the forest less than 6 meters wide are also considered to be forest. This definition conforms to the FAO reporting and was chosen within the ranges set by the Kyoto protocol.
• 'Trees outside Forests' (TOF), i.e. wooded areas that comply with the previous forest definition except for their surface (=< 0.5 ha or less than 30 m width). These represent fragmented forest plots as well as groups of trees in parks and nature terrains and most woody vegetation lining roads, fields etc… These areas comply to the GPG-LULUCF definition of Forest Land (i.e. they have woody vegetation) but not to the strict forest definition that the Netherlands applies.

16 Alterra report 1035.8
The TOP10Vector 0map classes that are reported under FAD and TOF are deciduous forest, coniferous forest, mixed forest, poplar plantations and willow coppice. A patch of a certain forest class is allocated to FAD if it exceeds the minimum requirements and to TOF otherwise. Groups of trees are mapped as forest only if they have a minimum surface of 50 m2, or of 1000 m2 in built-up areas or parks. 3.2 Cropland
The land use category 'Cropland' is defined as all arable and tillage land, including rice-fields, and agro-forestry systems where the vegetation structure falls below the thresholds used for the Forest Land category (IPCC, 2003). The Netherlands has chosen to define croplands as arable lands and nurseries (including tree nurseries). Intensive grasslands are not included in this category and are reported under Grasslands. For part of the agricultural land, rotation between arable land and grassland is frequent, but data on where exactly this is occurring are as yet lacking. Currently, the situation on the topographical map is leading, with lands under agricultural crops and classified as arable lands at the time of recording reported under Cropland and lands with grass vegetation at the time of recording classified as Grassland. The TOP10Vectore class arable land is reported under Cropland, as well as the class Tree nurseries. The latter does not conform to the forest definition, and the agricultural type of farming system justifies the inclusion in Cropland. Greenhouses are not included in Cropland, but instead they are considered as Settlement. 3.3 Grassland
The land use category 'Grassland' is defined as rangeland and pasture land that is not considered as croplands. It also includes vegetation that falls below the threshold used in the forest land category and are not expected to exceed, without human intervention, the threshold used in the forest land category. The category also includes all grassland from wild lands to recreational areas as well as agricultural and silvi-pastoral systems, subdivided into managed and unmanaged consistent with national definitions. (IPCC, 2003). It is stratified in: • 'Grasslands', i.e. all areas predominantly covered by grass vegetation (whether natural, recreational or
cultivated). • 'Nature', i.e. all natural areas excluding grassland (natural grasslands and grasslands used for recreation
purposes). It mainly consists of heathland, peat moors and other nature areas. Many have the occasional tree as part of the typical vegetation structure. This category was in the previous submissions a subcategory within Forest land.
The Netherlands currently reports under grassland any type of terrain which is predominantly covered by grass vegetation (equivalent to one general class of grasslands on the TOP10Vector maps). No distinction is made between agricultural intensively and extensively managed grasslands and natural grasslands. However, the potential and the need for this is currently under discussion. Apart from pure grasslands, all orchards (with standard fruit trees, dwarf varieties or shrubs) are included in the category grasslands. They do not conform to the forest definition, and while agro-forestry systems are mentioned in the definition of Croplands, this is motivated by the cultivation of soil under trees. However, in the Netherlands the main undergrowth of orchards is grass. We therefore chose to report them as grasslands. As for grasslands no change in above-ground biomass is reported, the carbon stored in these trees is not reported. The TOP10Vector map class heathland and peat moors, reported as Nature”, includes all land that is covered (mostly) with heather vegetation or rough grass species. Most of these were created in the Netherlands as a consequence of ancient grazing and sod cutting on sandy soils. As these practices are not part of the current

Alterrareport 1035.8 17
agricultural system anymore, conservation management is applied to halt the succession to forest and conserve the high landscape and biodiversity values associated it. 3.4 Wetland
The land use category 'Wetland' includes land that is covered or saturated with water for all or part of the year and does not fall into the forest land, cropland, grassland or settlements categories. It includes reservoirs as a managed sub-division and natural lakes and rivers as unmanaged sub-divisions (IPCC, 2003). Though the Netherlands is a country with many wet areas by nature, many of these are covered by a grassy vegetation and those are included under grasslands. Some wetlands are covered by a more rough vegetation of wild grasses or shrubby vegetation, which is reported in the subcategory 'Nature' of Grassland. Forested wetlands like willow coppice are reported in the subcategories FAD or TOF of Forest Land, depending on their surface. In the Netherlands, only reed marshes and open water bodies are included in the Wetland land use category. Reed marshes are areas where the presence of Common Reed (Phragmites australis) is indicated separately on the TOP10Vector maps. These may vary from wet areas in natural grasslands to extensive marshes. The presence of reed is marked with individual symbols which are translated to surfaces (Kramer et al., 2007) and conform to neither of the previous categories. Open water bodies are all areas which are indicated as water on the TOP10Vector maps (water is only mapped if the surface exceeds 50 m2). This includes natural or artificial large open waters (e.g. rivers, artificial lakes), but also small open water bodies like ditches and channels as long as they cover enough surface to be shown in the 25 m x 25 m grids. Additionally, it includes so called 'emerging surfaces', i.e. bare areas which are under water only part of the time as a result of tidal influences, and very wet areas without vegetation. It also includes 'wet' infrastructure for boats, i.e. waterways but also the water in harbours and docks. 3.5 Settlements
The land use category 'Settlements' includes all developed land, including transportation infrastructure and human settlements of any size, unless they are already included under other categories (IPCC, 2003). In the Netherlands, the main TOP10Vector classes included in Settlements are urban areas and transportation infrastructure, and built-up areas. Built-up areas include any constructed item, independent of the type of construction material, which is (expected to be) permanent, fixed to the soil surface (i.e. to distinguish from caravans,…) and serves as place for residence, trade, traffic and/or labour. Thus it includes houses, blocks of houses and apartments, office buildings, shops and warehouses but also fuel stations and greenhouses. Urban areas and transportation infrastructure include all roads, whether paved or not, are included in the land use category Settlements with exception of forest roads less than 6 m wide, which are included in the official forest definition. It also includes train tracks, (paved) open spaces in urban areas, parking lots and graveyards. Though some of the last class are actually covered by grass, the distinction cannot be made based on maps. As even the grass graveyards are not managed as grasslands, inclusion in the land use category 'Settlements' conforms better to the rationale of the land use classification.

18 Alterra report 1035.8
3.6 Other Land
The land use category 'Other Land' was included to allow the total of identified land to match the national area where data are available. It includes bare soil, rock, ice and all unmanaged land area that do not fall in any of the other five categories (IPCC, 2003). In general, Other Land does not have a substantial amount of carbon. The Netherlands uses this land use category to report the surfaces of bare soil which are not included in any other category. It does not include bare areas that emerge from shrinking and expanding water surfaces (these 'emerging surfaces' are included in wetlands). The TOP10Vector classes dominated by sand are completely included in it. It includes all terrains which do not have vegetation on them by nature. The last part of the phrase 'by nature' is used to distinguish this class from settlements and fallow croplands. It includes coastal dunes and beaches with little to no vegetation. It also includes inland dunes and shifting sands, i.e. areas where the vegetation has been removed to create spaces for early succession species (and which are being kept open by wind). Inland bare sand dunes developed in the Netherlands as a result of heavy overgrazing and were combated by planting forests for a long time. These areas were, however, the habitat to some species which have become extremely rare nowadays. Inland sand dunes can be created as vegetation and top soil is again removed as a conservation measure in certain nature areas. Table 3.1
Overview of allocation of TOP10Vector classes to IPCC land use (sub)categories (based on Kramer et al., 2007).
TOP10Vector Dutch TOP10Vector name GPG classes
Loofbos Forest Land
Coniferous forest Naaldbos Forest Land Mixed forest Gemengd bos Forest Land Poplar plantation Populierenopstand Forest Land Willow coppice Griend Forest Land Arable land Bouwland Cropland Tree nurseries Boomkwekerij Cropland Grasslands Weiland Grassland Orchard (high standards) Boomgaard Grassland Orchard (low standards and shrubs) Fruitkwekerij Grassland Heathland and peat moors Heide en hoogveen Grassland Reed marsh Rietmoeras Wetland Water (large open water bodies) Water (grote oppervlakte) Wetland Water (small open water bodies) Oeverlijn / Water (kleine oppervlakte) Wetland Ditch Sloten Wetland Emerging surfaces Laagwaterlijn / droogvallende gronden Wetland 'Wet' infrastructure Dok Wetland Urban areas and transportation infrastructure Stedelijk gebied en infrastructuur Settlement Built-up areas Bebouwd gebied Settlement Greenhouses Kassen Settlement Coastal dunes and beaches Strand en duinen Other land Inland dunes and shifting sands Inlandse duinen Other land

Alterrareport 1035.8 19
3.7 Overview of land use allocation
The basis of allocation for IPCC land use (sub)categories is the TOP10Vector land use/cover classification. For most of the TOP10Vector classes, there was one IPCC land use (sub)category where it could be unambiguously included. For other TOP10Vector classes, there were some reasons to include it in one, and other reasons to include it in another IPCC land use (sub)category. In these cases, we allocated it to the land use category where (in sequential order): 1) the majority of systems (based on surface) in the TOP10Vector class would fit best based on the degree of
human impact on the system (see also introduction), 2) or if this did not give an unambiguous solution, we allocated it where the different types of carbon emission
considered/reported represented the situation in the TOP10Vector class best. The resulting classification is summarized in Table 3.1.

20 Alterra report 1035.8

Alterrareport 1035.8 21
4 Land use change matrix
4.1 Introduction
The Netherlands has developed an overall approach within the National System since 2003, which has been deployed for the National Inventory Reports since 2005. After an extensive inventory of available land use datasets in the Netherlands (Nabuurs et al., 2003), information on the surface of the different land use categories and conversions between categories was based on a wall-to-wall map overlay, resulting in a national scale land use and land use change matrix (Nabuurs et al., 2005). The current submissions for the LULUCF sector is based on a land use change matrix that is derived from two maps representing the land use in 1990 and 2004 (Kramer et al., 2009). In Kramer et al. (2009) all steps involved in the calculation of the land use and land use change matrix used from 2009 on are described in detail. In this chapter only a short summary of the methodology is given. 4.2 Methodology
The land use maps are based on two maps for monitoring nature development in the Netherlands, 'Basiskaart Natuur' (BN), which are based on the Top10Vector topographical maps for 2004 (BN2004) and on a combination of Top10Vector and Top25 maps for 1990 (BN1990). The maps were created to monitor changes in nature areas, but because of its national coverage and inclusion of other land use types it is also very suitable as land use data set for the reporting of the LULUCF sector. In Table 4.1 the characteristics of both maps are presented. The land use change matrix is the result of an overlay between the 25 m × 25 m land use maps of 1990 and 2004. For both years, the land use maps were based on topographic maps, either digital (Top10Vector) or paper (Top25). The source material for BN1990 consists of the topographic map 1:25,000 (Top25) and digital topographical map 1:10,000 (Top10Vector). Map sheets with exploration years in the period 1986-1994 were used. The source material for BN2004 consists of the digital topographic map 1:10,000 (Top10Vector). All topographic maps have been explored in the period 1999-2003. Auxiliary information on areas managed for nature purposes was dated on 2004. The Top10Vector has an update frequency of four years, now decreasing to between two and four years. Higher update frequencies occur in urban areas, lower in rural areas. For both years map sheets were selected to constitute the source information of the land use maps. If the source information was a paper map, it was converted to a digital high resolution raster map. Then both Top10Vector files and digitised Top25 maps were (re)classified to match the requirements set by nature monitoring and UNFCCC reporting. In this process additional data sets were used. Simultaneously, harmonisation between the different source materials was applied to allow a sufficiently reliable overlay (see Kramer et al., 2009 for details). The final step in the creation of the land use maps was the aggregation to 25 m × 25 m raster maps. For the 1990 map, which had a large part of the information derived from paper maps, an additional validation step was applied to check on the digitising and classifying processes.

22 Alterra report 1035.8
Table 4.1
Characteristics of the BN1990 and BN2004 maps.
Characteristics BN1990 BN2004
Name Historical Land use Netherlands 1990 Base map Nature 2004 Aim Historical land use map for 1990 Base map for monitoring nature development Resolution 25 m 25 m Coverage Netherlands Netherlands Base year source data 1986-1994 1999-2003 Source data Hard copy topographical maps at 1:25,000 scale
and digital topographical maps at 1:10,000 Digital topographical maps at 1:10,000 and additional sources to distinguish specific nature types
Number of classes 10 10 Distinguished classes Grassland, Arable land, Heath land/peat moor,
Forest, Buildings, Water, Reed marsh, Sand, Built-up area, Greenhouses
Grassland, Nature grassland, Arable land, Heath land, Forest, Built-up area and infrastructure, Water, Reed marsh, Drifting sands, Dunes and beaches
4.3 Land use change matrix
The resulting land use map for 2004 is shown in Figure 4.1. An overlay was produced of the land use maps of 1990 and 2004, which resulted in a land use and land use change matrix over 14 years (1 January 1990 - 1 January 2004). The matrix shows the changes for thirteen land use categories (Table 4.2). For the purpose of the CRF and NIR, the thirteen land use categories are aggregated into the six land use classes that are defined in the LULUCF guidelines. The definition of the UNFCCC land use categories is given in Chapter 3. In Table 4.3 the resulting land use change matrix is given for the six UNFCCC land use categories.
Figure 4.1
Land use map of 2004.

Al
terr
a re
port
103
5.8
23
Tabl
e 4.
2
Land
Use
and
Lan
d Us
e Ch
ange
Mat
rix b
ased
on
the
clas
sific
atio
n in
13
clas
ses
(in h
a). S
hade
d ce
lls in
dica
te s
urfa
ces
not c
hang
ing
land
use
bet
wee
n 19
90 a
nd 2
004.
B
K_1
990
BK
_200
4 10
11
14
20
30
40
70
80
90
91
10
1 10
2 10
3 G
rand
Tot
al
10 G
rass
land
10
4788
9
2781
15
9806
25
5 63
88
3924
11
96
130
216
9505
13
4 95
3 12
3317
6
11 N
atur
e gr
assl
and
5820
6 40
878
380
1635
0 75
9 49
18
1679
19
58
74
1438
27
5 8
51
1269
73
14 T
rees
out
side
For
est
3949
30
6 11
336
2039
22
0 28
52
274
54
15
83
979
13
85
2220
7
20 A
rabl
e la
nd
1955
45
1002
38
6 73
9190
48
12
18
523
73
4 5
1456
9
158
9396
17
30 H
eath
er
332
338
155
641
4208
3 32
80
291
44
437
252
52
5 5
4791
5
40 F
ores
t (Ky
oto)
10
194
3065
23
52
1252
0 48
06
3342
11
569
319
205
348
1198
24
23
0 37
0041
70 O
pen
wat
er
8019
17
63
247
5042
73
9 11
97
7578
70
1419
17
1 23
32
1248
5
86
7801
39
80 R
eed
mar
sh
3813
42
74
71
1780
33
30
6 11
41
1557
7 1
78
44
3 3
2712
6
90 S
hifti
ng s
ands
94
21
9
88
147
197
103
1 23
03
8
1
2971
91 C
oast
al d
unes
13
9 38
1 10
1 11
3 12
4 50
2 26
63
24
3 30
838
103
0 10
35
002
101
Built
-up
area
67
151
889
2768
71
942
334
6344
23
98
158
235
345
1632
04
10
587
3263
53
102
Railw
ays
372
2 29
59
0 7
103
20
4 0
1
4885
18
3 61
95
103
Road
s 94
34
60
192
9252
11
58
3 24
0 17
6
43
1045
6 11
9 20
3371
23
3784
Gra
nd T
otal
14
0513
6 52
979
2080
6 10
1935
3 49
567
3621
00
7716
96
2084
3 35
84
3597
9 18
8529
52
05
2157
23
4151
500

24 Alterra report 1035.8
The total area of land use change in the period 1990 to 2004 is about 6700 km2, which is around 16% of the total area. The largest changes in land use are the conversion of cropland to grassland and vice versa. Other important land use changes are the conversions of cropland and grassland to settlement (urbanisation). Table 4.3
Land Use and Land Use Change Matrix aggregated to the six UNFCCC land use categories (in ha).
BN 1990
BN 2004 Forest land Cropland Grassland Wetland Settlement Other land Total
Forest land 350 751 14 560 22 540 1 217 2 530 651 392 248 Cropland 1 605 739 190 196 595 596 1 623 8 939 617 Grassland 17 902 176 797 1 190 740 9 092 10 987 2 547 1 408 064 Wetland 1 822 6 821 18 641 776 007 1 390 2 583 807 265 Settlement 10 019 81 783 78 259 2 836 392 805 630 566 332 Other land 809 201 907 2 791 122 33 144 37 974
Total 382 907 1 019 353 1 507 682 792 539 409 457 39 563 4 151 500
4.4 Peat soils
The areas of peat and mineral soils have to be reported separately under cropland, grassland and forest land. Therefore an overlay between the new land use maps and the Dutch soil map (De Vries et al., 2003) indicating the peat areas was made. The results are presented in Table 4.4. Regarding the six UNFCCC land use categories, 283 km2 of peat soils was under cropland, 2050 km2 under grassland and 131 km2 under forest land in 2004. More information about the emission from organic soils can be found in Chapter 7. Table 4.4
Peat areas under different land uses in 1990 and 2004.
Land use Peat area
1990 Peat area
2004 Total area
2004 % total land
1990 % total land
2004
ha ha ha
other grassland 199552 175028 1233176 16.2 14.2 nature grassland 10330 24963 126973 8.1 19.7 small forest 1305 1377 22207 5.9 6.2 arable land 31265 28336 939617 3.3 3.0 heath land 5260 4999 47915 11.0 10.4 forest 10341 11724 370041 2.8 3.2 water 9509 11059 780139 1.2 1.4 reed swamp 7625 8909 27126 28.1 32.8 shifting sands 12 10 2971 0.4 0.3 dunes, beaches and sand plates 1 2 35002 0.0 0.0 built-up area 5661 13078 326352 1.7 4.0 railroads 268 325 6195 4.3 5.2 roads 7741 9060 233784 3.3 3.9
Total 288869 288869 4151497 7.0
Alterrareport 1035.8 25
4.5 Conclusions
The 'Basiskaart Natuur' matches the requirements for a primary land use dataset for carbon reporting in a small, intensively managed country as the Netherlands. It is spatially explicit, covers the entire country and the spatial resolution allows sufficiently detailed representation of the fine-grained land use mosaic in the Netherlands. It is the basis for the monitoring of nature in the Netherlands, and as such it has a legal status. It is based on the digital topographical maps (Top10Vector) which had an update frequency of four years, which will even increase in the future. The spatially explicit land use map allows overlays with other maps to fulfil additional needs like reporting the areas on peat soils. The land use change matrix was derived by overlaying the 1990 and 2004 land use maps. The results were compared with expectations from policies and other sources. Taking into account all uncertainties, the trends and results from the land use matrix matched other sources remarkably well and could be explained from the specific land use policies in the Netherlands. It is therefore concluded that the approach taken is in compliance with GPG-LULUCF and gives the best estimate currently possible for land use and land use change for the Netherlands.

26 Alterra report 1035.8

Alterrareport 1035.8 27
5 Update of the carbon emissions from living biomass
5.1 Forest land remaining Forest Land
The land use category 'Forest land' is defined as all land with woody vegetation consistent with thresholds used to defined forest land in the national GHG inventory. In the Netherlands, unmanaged forests are non-existent and the only subdivision is based on the extent of the forest occurring: – 'Forest according to the Kyoto definition' (FAD) is all forest land which complies to the following definition:
patches of land exceeding 0.5 ha with a minimum width of 30 m, with tree crown cover at least 20% and tree height at least five meters, or, if this is not the case, these thresholds are likely to be achieved at the particular site. Roads in the forest less than six meters wide are also considered to be forest. This definition is used for the Kyoto protocol article 3.3 and as requested by 16/CPM.1, Annex E, section 16, included in the Initial Report.
– 'Trees outside Forests' (TOF) are wooded areas on the map that comply with the forest definition except for their surface (=< 0.5 ha). These represent fragmented forest plots as well as groups of trees in parks and nature terrains and most woody vegetation lining roads, fields etc.
In the following paragraphs the methods are described to calculate the changes in carbon stock for Forest Land remaining Forest Land (both subdivisions), and changes to and from Forest Land, as used for the 2011 submission. Where any updates, changes or improvements relative to the 2010 submissions are implemented, this is noted but not elaborated. The reader is then referred to the respective annex where the full motivation and comparison with earlier submissions is given. 5.1.1 Forest according to the Kyoto definition
The basic approach follows the IPCC Good Practice Guidance for Land Use, Land Use Change and Forestry where a stock change approach is suggested. The net flux is calculated as the difference in carbon contained in the forest between two points in time. Carbon in the forest is derived from the growing stock volume, making use of other forest traits routinely determined in forest inventories. If no repeated measurements are available, the flux is derived from the volume increment in consecutive years. The last approach was used in the Netherlands until now. For the period of interest, i.e. 1990 and on, two types of National Inventories were available for the Netherlands: the so called HOSP data (1988-1992) and the MFV data (2001-2005). The HOSP (Hout Oogst Statistiek en Prognose oogstbaar hout) inventory was designed to get insight in the amount of harvestable wood. In total 3448 plots were characterized by age, tree species, growing stock volume, increment, height, tree number and dead wood. Each plot represented a certain area of forest ('representative area') of between 0,4 ha and 728,3 ha. Together they represent an area of 310736,3 ha, the estimated surface of forest where harvesting was relevant in 1988 (The HOSP inventory was designed in 1988 and conducted between 1988 and 1992). The MFV (Meetnet Functie Vervulling Bos) inventory was designed as a randomized continuous forest inventory. In total 3622 plot recordings with forest cover were available for the years 2001, 2002, 2004 and 2005 (2003 was not inventoried because of a contagious cattle disease). Apart from the live and dead wood
28 Alterra report 1035.8
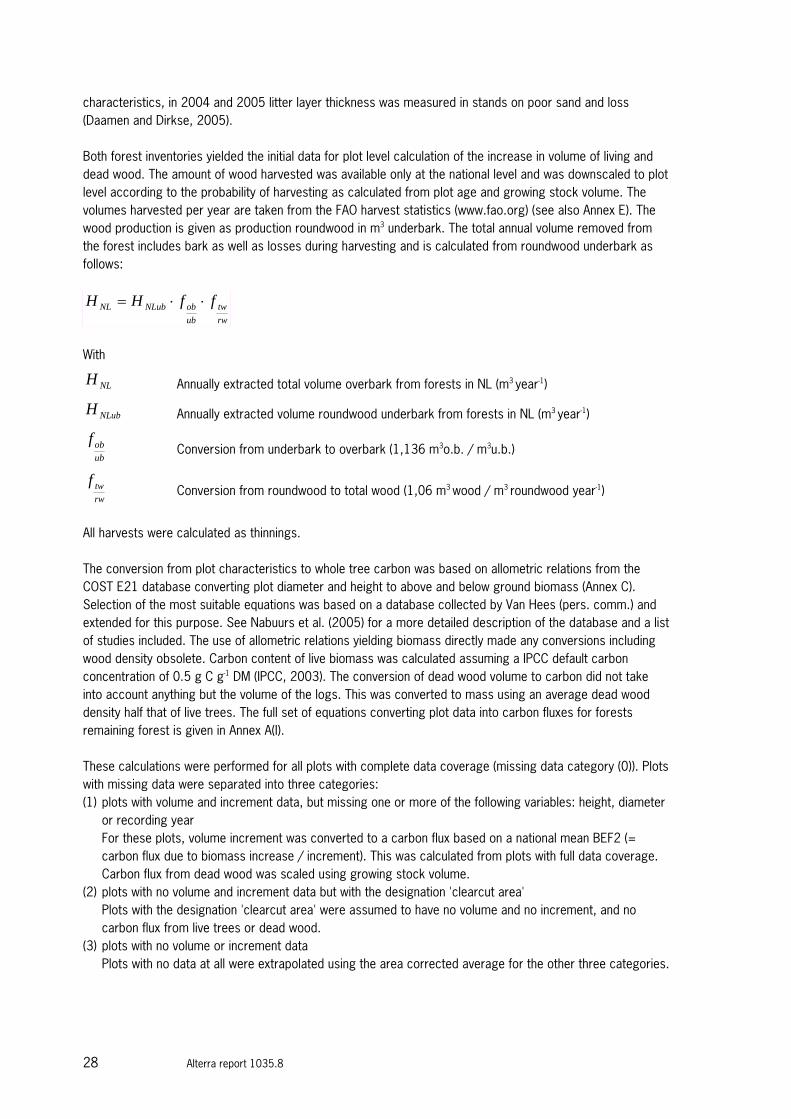
characteristics, in 2004 and 2005 litter layer thickness was measured in stands on poor sand and loss (Daamen and Dirkse, 2005). Both forest inventories yielded the initial data for plot level calculation of the increase in volume of living and dead wood. The amount of wood harvested was available only at the national level and was downscaled to plot level according to the probability of harvesting as calculated from plot age and growing stock volume. The volumes harvested per year are taken from the FAO harvest statistics (www.fao.org) (see also Annex E). The wood production is given as production roundwood in m3 underbark. The total annual volume removed from the forest includes bark as well as losses during harvesting and is calculated from roundwood underbark as follows:
rwtw
ubobNLubNL ffHH ⋅⋅=
With
NLH Annually extracted total volume overbark from forests in NL (m3 year-1)
NLubH Annually extracted volume roundwood underbark from forests in NL (m3 year-1)
ubobf
Conversion from underbark to overbark (1,136 m3o.b. / m3u.b.)
rwtwf
Conversion from roundwood to total wood (1,06 m3 wood / m3 roundwood year-1)
All harvests were calculated as thinnings. The conversion from plot characteristics to whole tree carbon was based on allometric relations from the COST E21 database converting plot diameter and height to above and below ground biomass (Annex C). Selection of the most suitable equations was based on a database collected by Van Hees (pers. comm.) and extended for this purpose. See Nabuurs et al. (2005) for a more detailed description of the database and a list of studies included. The use of allometric relations yielding biomass directly made any conversions including wood density obsolete. Carbon content of live biomass was calculated assuming a IPCC default carbon concentration of 0.5 g C g-1 DM (IPCC, 2003). The conversion of dead wood volume to carbon did not take into account anything but the volume of the logs. This was converted to mass using an average dead wood density half that of live trees. The full set of equations converting plot data into carbon fluxes for forests remaining forest is given in Annex A(I). These calculations were performed for all plots with complete data coverage (missing data category (0)). Plots with missing data were separated into three categories: (1) plots with volume and increment data, but missing one or more of the following variables: height, diameter
or recording year For these plots, volume increment was converted to a carbon flux based on a national mean BEF2 (=
carbon flux due to biomass increase / increment). This was calculated from plots with full data coverage. Carbon flux from dead wood was scaled using growing stock volume.
(2) plots with no volume and increment data but with the designation 'clearcut area' Plots with the designation 'clearcut area' were assumed to have no volume and no increment, and no
carbon flux from live trees or dead wood. (3) plots with no volume or increment data Plots with no data at all were extrapolated using the area corrected average for the other three categories.

Alterrareport 1035.8 29
Thus the following calculation is used to correct for missing data for carbon stock change due to biomass increase:
)0(
)0()1()1( I
CIC
∆=∆
0)2( =∆C
( )∑=
⋅∆+∆+∆=∆
2,1,0)(
)3()2()1()0()3(
xxArea
AreaCCCC
)3()2()1()0( CCCCCGFF ∆+∆+∆+∆=∆
With
)(xC∆ annual increase in carbon stocks (in Gg C) due to biomass increase in area represented by
plots with missing data category x
)(xArea total representative area for plots with missing data category x
)(xI total increment in m3 year-1 for area represented by plots with missing data category x
GFFC∆ annual increase in carbon stocks in Gg C due to biomass increase in forests in the
Netherlands The net carbon balance in FAD due to changes in biomass is then calculated as
LGLB FFFFFF CCC ∆−∆=∆ With
LBFFC∆ annual change in carbon stocks (in Gg C) due to biomass change in forests in the
Netherlands
GFFC∆ annual increase in carbon stocks (in Gg C) due to biomass increase in forests in the
Netherlands
LFFC∆ annual decrease in carbon stocks (in Gg C) due to biomass decrease in forests in the
Netherlands (for calculation see Annex A) 5.1.2 Trees outside Forest
For Trees outside Forest, no data on growth or increment are available. Similar to earlier years, it is assumed that Trees outside Forest grow with the same growth rate as Forests according to the Kyoto definition. The only difference between them is the size of the stand (< 0.5 ha for Trees outside Forest), so this seems a reasonable assumption. It is assumed that no building up of dead wood or litter occurs. It is also assumed that no harvesting takes place. Even if this assumption would not completely be met, the error would be negligible, as the harvested wood would be counted in the national harvest statistics and therefore would be counted under Forests according to the Kyoto definition.

30 Alterra report 1035.8
5.2 Forest Land converted to other land use classes
5.2.1 Forest according to the Kyoto definition
The total emissions from the tree component after deforestation is calculated by multiplying the total area deforested with the average carbon stock in living biomass, above as well as below ground (Nabuurs et al., 2005) and the average carbon stock in dead organic matter. Thus it is assumed that with deforestation, all carbon stored in above and below ground biomass as well as in dead wood and litter is lost to the atmosphere. National averages are used as there is no record of the spatial occurrence of specific forest types. The average carbon stock in living biomass follows the calculations from the gapfilled NFI data (see par. 5.1.1 and Annex A). The emission factors (in Mg C ha-1) are given in Table 5.1. The systematic increase in average standing carbon stock reflects the fact that annual increment exceeds annual harvests in the Netherlands. The average carbon stock in dead organic matter is the sum of two pools: dead wood and the litter layer (L+F+H) (IPCC, 2003). The average carbon in dead wood follows the calculations from the gapfilled NFI data (see par 5.1.1. and Annex A). The systematic increase reflects the increasing attention for more nature oriented forest management. The average carbon in litter is based on a national estimate using best available data for the Netherlands as described in Chapter 7.
Table 5.1
Emission Factors for deforestation in Mg C ha-1
NFI Year EFbiomass EF litter EF dead wood
Hosp 1990 60.4 28.97 0.45 Hosp 1991 61.5 29.22 0.64 Hosp 1992 63.0 29.78 0.79 Hosp 1993 64.2 30.34 0.92 Hosp 1994 65.7 30.90 1.03 Hosp 1995 67.1 31.46 1.13 Hosp 1996 68.5 32.02 1.21 Hosp 1997 70.0 32.59 1.28 Hosp 1998 71.4 33.15 1.35 Hosp 1999 72.8 33.71 1.41 MFV 2000 71.7 34.27 1.45 MFV 2001 73.6 34.82 1.43 MFV 2002 75.6 35.39 1.42 MFV 2003 77.7 35.95 1.43 MFV 2004 79.5 35.95 1.44 MFV 2005 81.3 35.95 1.46 MFV 2006 83.0 35.95 1.49 MFV 2007 84.6 35.95 1.52 MFV 2008 86.4 35.95 1.55 MFV 2009 88.1 35.95 1.58

Alterrareport 1035.8 31
5.2.2 Trees outside Forest
For Trees outside Forest the same biomass is assumed as for Forest according to the Kyoto definition. However, no dead wood nor litter layer is assumed. 5.3 Land converted to Forest Land
5.3.1 Forest according to the Kyoto definition
The built up of carbon in land converted to Forest Land is only reported for biomass. It is assumed that building up of dead wood starts only after the initial twenty years. For litter, good data are lacking to relate the built up of carbon to age. The current estimate is the outcome of the following steps/assumptions: 1. At time of regeneration, growth is close to zero. 2. Between regeneration and twenty years of age, the specific growth curve is unknown and is approximated
by the simplest function, being a linear curve. 3. The exact height of this linear curve is best approximated by a linear regression on the mean growth rates
per age as derived from the NFI. One mean value for each age is taken to avoid confounding effects of the age distribution of the NFI plots (some of which are not afforested but regenerating after a clearcut).
4. The emission factor is calculated for each annual set of afforested plots separately. Thus the specific age of the re/afforested plots is taken into account, and a general mean value is reached only at a constant rate of afforestation for more than twenty years.
5. Between 1990 and 2000, rates are based on the Hosp inventory. From 2000 onwards, rates are based on the MFV inventory (Figure 5.1).

32 Alterra report 1035.8
Figure 5.1
Regression of carbon emission (as calculated from increment data and IPCC expansion and conversion factors) on age.

Alterrareport 1035.8 33
Figure 5.2
Country specific Emission Factor (EF) for afforestation in the Netherlands assuming a constant afforestation rate and
IPCC default emission factors for afforestation.
5.3.2 Trees outside Forest
For Trees outside Forest the same biomass increase is assumed as for Forest according to the Kyoto definition. Similarly, no dead wood nor litter layer built up is assumed.

34 Alterra report 1035.8
Alterrareport 1035.8 35
6 Update of the carbon emissions from dead organic matter in forests
6.1 Forest according to the Kyoto definition
Dead wood volume was available from the Hosp and MFV forest inventory datasets. The change in dead wood was calculated using an average tree mortality of 0,4%, dead wood longevity from van Hees and Clerckx (1999) and a removal of 20% of the dead wood . The conversion of dead wood volume to carbon did not take into account anything but the volume of the logs. This was converted to mass using an average dead wood density half that of live trees. The equations are given in Annex A and a more detailed description is provided in Nabuurs et al. (2005). The method is updated for the 2011 submission and this is described in Annex B. Similar to the case for living biomass, the following calculation is used to correct for missing data for carbon stock change due to change in dead wood:
)0(
)0()1()1( V
CVC
∆=∆
0)2( =∆C
( )∑=
⋅∆+∆+∆=∆
2,1,0)(
)3()2()1()0()3(
xxArea
AreaCCCC
)3()2()1()0( CCCCCNL ∆+∆+∆+∆=∆
With
)(xC∆ carbon budget in Gg C for category x
)(xArea total representative area for plots with missing data category x
)(xV total volume in m3 for area represented by plots with missing data category x
The carbon stock change from changes in the litter layer was estimated using a stock change method at national level. Data for litter layer thickness and carbon in litter were available from five different datasets (data from Schulp and coworkers; De Vries and Leeters, 2001; Van den Burg, 1999; Forest Classification database; MFV litter inventory). The data from Van den Burg (1999) were collected between 1950 and 1990 and were used only to estimate bulk density based on organic matter content. The data from de Vries and Leeters (2001) were collected in 1990 and their median was used until now as a generic national estimate. They also provide species specific values of (mostly) conifer species. However, they sampled sandy soils only. The Forest Classification dataset was designed to provide abiotic attributes for a forest classification in 1990, not to sample the mean litter in forests. However, it is the only database that has samples outside sandy areas. Schulp and co-workers intensively sampled selected forest stands in 2006 and 2007 on poor and rich sands

36 Alterra report 1035.8
with the explicit purpose to provide conversion factors or functions. They based their selection of species and soils on the MFV forest inventory. During the last two years (2004 and 2005) the litter layer thickness was measured for plots located on poor sands and loss (Daamen & Dirkse, 2005). For 1440 plots values were filled, but only 960 (951 on sands) plots had any non-zero values. As it could not be made likely that all-zero value plots were really measured, only plots with at least one of the litter layers present were selected. None of these datasets could be used exclusively. Therefore, a stepwise approach was used to estimate the national litter carbon stock and change therein in a consistent way. First the datasets were compared for (if available) bulk density and carbon or organic matter content of litter separately as well as these combined into conversion factors or functions between litter thickness and carbon stock. Based on appropriate conversion factors, litter carbon stock was calculated for the Forest Classification database and the MFV inventory. These were compared to each other and the available data from De Vries and Leeters (2001). From these, a hierarchy was developed to accord mean litter stock values to any of the sampled plots of the HOSP (1988-1992) and MFV(2001-2005) inventories. The followed hierarchy was: 1. For non-sandy soils the only source of information was the Forest Classification database. Though sampled
around 1990, it was used for 1990 and 2004 alike. As such it is considered a conservative estimate for any changes occurring. The use of the same dataset in 1990 and 2004 means that changes in total litter stock on non-sandy soils only occur through changes in forest area and tree species composition. Peaty soils were kept outside the analysis.
2. For sandy soils with measured litter layer thickness (i.e. only from the MFV in the years 2004 and 2005), regressions for rich and poor sands based on data from Schulp and co-workers were used to convert them into litter carbon stock estimates. For sand rich in chalk (five plots) the regression equation of rich sand was used.
3. For sandy soils in the MFV without measured litter layer thickness, but with all other information, a regression was developed from the 951 plots with measured litter layers to estimate the carbon stock from plot location and stand characteristics. However, as this estimate was completely based on data from the MFV alone, we did not use it for the HOSP plots.
4. For sandy soils with missing data for the regression equation mentioned in 3. or for the sandy soils in the HOSP inventory, the following procedure was used:
4a. For reasons of consistency with the non-sandy soils, if a mean estimate was available for the tree species from the Forest Classification database, that was accorded to the plots.
4b. If no such estimate was available, the species specific estimate from the study of De Vries and Leeters (2001) was accorded. In this study, only median values were given and the mean value was taken as midway between the 5% and the 95% percentile.
4c. If no such estimate was available, the mean aspecific value for sandy soils from the Forest Classification database was accorded. This value was always available. However, the next option would have been to accord the mean aspecific value from De Vries and Leeters (2001).
Though this implied using data from 1990 for 2004, this was thought of as a conservative estimate, i.e. underestimating rather than overestimating change. As the changes pointed to an increase of carbon in litter at the national level, an underestimate of change was considered to be conservative for the reporting of emissions.
5. For plots with missing soil information, the total area was summed and the total carbon litter stock in mineral soils was scaled up on an area basis.
Alterrareport 1035.8 37
The difference between 2004 (MFV litter layer thickness measurements) and 1990 (Forest Classification database, De Vries and Leeters, 2001) was estimated and a mean annual rate of carbon accumulation was calculated. A Monte Carlo uncertainty analysis was carried out with random carbon litter stocks assigned to plots from a distribution rather than from the mean values. The results of the Monte Carlo analysis consistently showed a carbon sink in litter, however the magnitude was very uncertain. As such, it was assumed to be the more conservative estimate to set the accumulation of carbon in litter in Forest Land - FAD remaining Forest Land-FAD to zero. The uncertainty was attributed largely to the fact that no litter information was collected in the HOSP inventory which was used for 1990. In future, when a new MFV inventory will be carried out, more certain estimates of the carbon accumulation in litter over time will be possible and will be reported. 6.2 Trees outside Forest
For Trees outside Forest no dead wood nor litter layer build up is assumed. As the patches are smaller and any edge effects therefore larger, the uncertainty on dead wood and litter accumulation is much higher here. For very small patches and linear woody vegetation, the chance of dead wood removal may be very high. Disturbance effects on litter may prevent accumulation. Therefore the conservative estimate of no carbon accumulation in these pools is applied.
38 Alterra report 1035.8
Alterrareport 1035.8 39
7 Update of the carbon emissions from soils
Within the National Inventory Report the Netherlands has to report how carbon stocks are determined and how changes in the stocks are calculated as a part of internationally mandatory reporting. In 2002 and 2003 it was investigated how stocks can be determined and which databases are available for a Dutch monitoring system and which data are missing (see Kuikman et al., 2003; Nabuurs et al., 2003; Kuikman et al., 2004). Since 2009 the carbon stock change in mineral soils is conservatively reported to be zero, stating that mineral soils in the Netherlands as a whole are not a source for carbon. The motivation for this is described in this chapter. The Netherlands has detailed soil information on its entire land area, which is derived from the soil map of the Netherlands at a scale of 1:50,000. The carbon content in the soil can therefore be expressed with a relatively high degree of accuracy. Kuikman et al. (2002) made a start on this topic using descriptions of profile details in the so-called LSK, a national sample survey of soil map units (Finke et al., 2001). A limited number of soil chemical parameters were quantified in the laboratory, including soil organic matter content. This sample survey was meant to provide further quantitative information for the existing soil maps. The sample survey was implemented in the period 1990-2000 on a nationwide and stratified scale, where main soil categories were combined in order to produce a more homogeneous grouping with respect to landscape position, soil formation or parent material. Based on the ALBOS file, the land use 'nature' has been distinguished separately (see Nabuurs et al., 2005). In total about 1200 locations were sampled at five different depths. Each of these sample points can be linked to a soil unit of the soil map of the Netherlands. The resulting soil carbon stock map based on the LSK survey is shown in Figure 7.1. More information about the quantification of the soil organic carbon stocks and its uncertainties is given in De Groot et al. (2005). Although the total soil organic carbon stocks are well known, little information is available about the changes over time. Since the LSK sample survey was only performed once at each sample point, no temporal trends on soil organic matter can be obtained. Although the entire sampling survey was performed during the period 1990 to 2000, the results from different years cannot be used to establish trends in SOC levels, because the samples were stratified to soil mapping unit and groundwater class, and especially the last one was highly correlated to SOC level (De Groot et al., 2005). Besides, the stratification was not based on land use, which would be required for the assessment of SOC stocks for the different land use types for reporting to the UNFCCC. However, recently two studies (Hanegraaf et al., 2009; Reijneveld et al., 2009) have been published, which used a different source of soil organic carbon data in the Netherlands. Additionally, these studies especially assessed the changes in soil organic carbon contents over time. Data were derived from a database with about two million results of soil analyses from farmers’ fields. Within the database 304,000 data on SOC content were available. All samples were taken and analysed by one laboratory (BLGG in Oosterbeek) during the period 1984-2004.

40 Alterra report 1035.8
Figure 7.1
Soil carbon stocks (0-30 cm) for the Netherlands.
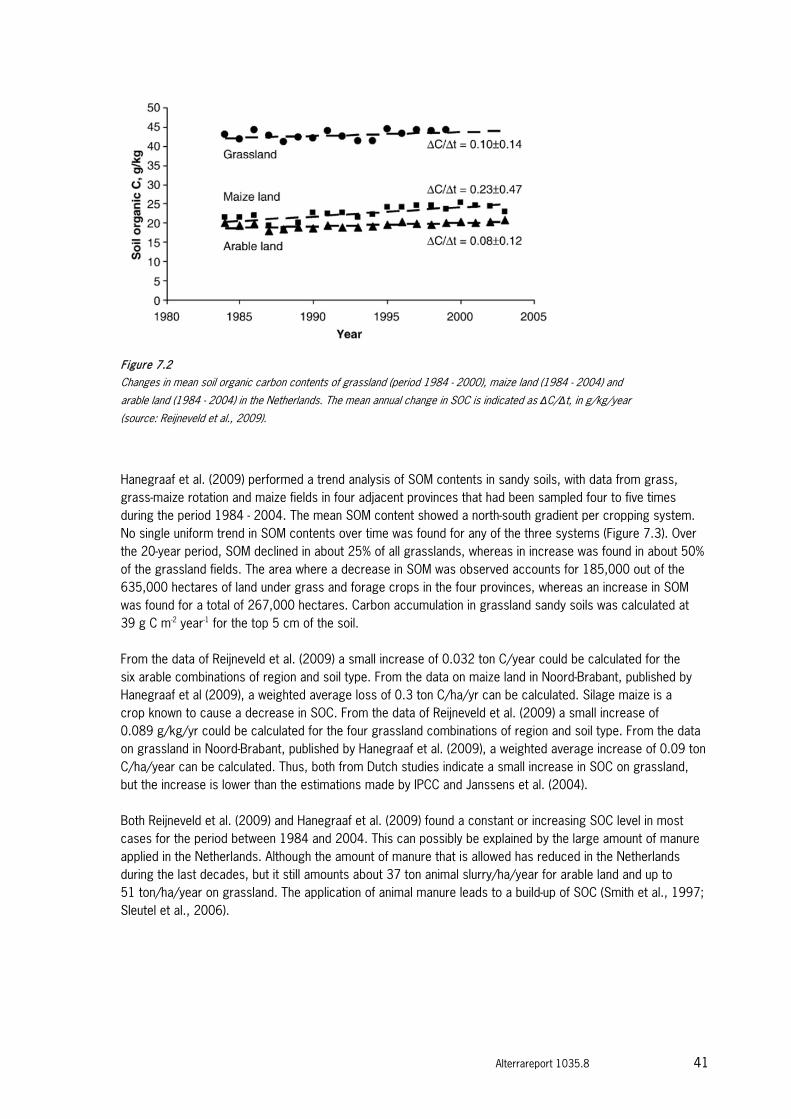
Reijneveld et al. (2009) report on the changes in the mean SOC contents of the topsoil (0 - 5 cm) of grassland and the topsoil (0 - 25 cm) of arable land in the Netherlands during the period 1984 - 2004. The analyses were made for all agricultural land on mineral soils and for agricultural land in nine regions with distinct differences in mean soil textures and SOC contents, and for different land uses (arable land and permanent grassland). The study did not include samples from peat soils and samples with a SOC content of more than 125 g/kg. Mean SOC content of soils under arable land in 2003 ranged from 13 to 22 g/kg for sand, loess and clay soils to 59 g/kg for reclaimed peat soils. Mean SOC content of soils under permanent grassland in 2003 ranged from 22 to 56 g/kg for sand and clay soils. Mean SOC contents of all mineral soils under grasslands and arable land tended to increase annually by 0.10 and 0.08 g/kg, respectively (Figure 7.2). Large differences in mean trends were observed between regions. Regions with relatively low SOC contents tended to accumulate C by up to 0.37 g/kg/year, while regions with relatively high SOC contents (e.g., peaty clays) tended to lose C by up to 0.98 g/kg/year. They concluded that mean SOC contents of the topsoil of mineral soils of agricultural land in most regions in the Netherlands tended to increase slightly during the period 1984 - 2004.
Alterrareport 1035.8 41
Figure 7.2
Changes in mean soil organic carbon contents of grassland (period 1984 - 2000), maize land (1984 - 2004) and
arable land (1984 - 2004) in the Netherlands. The mean annual change in SOC is indicated as ΔC/Δt, in g/kg/year
(source: Reijneveld et al., 2009).
Hanegraaf et al. (2009) performed a trend analysis of SOM contents in sandy soils, with data from grass, grass-maize rotation and maize fields in four adjacent provinces that had been sampled four to five times during the period 1984 - 2004. The mean SOM content showed a north-south gradient per cropping system. No single uniform trend in SOM contents over time was found for any of the three systems (Figure 7.3). Over the 20-year period, SOM declined in about 25% of all grasslands, whereas in increase was found in about 50% of the grassland fields. The area where a decrease in SOM was observed accounts for 185,000 out of the 635,000 hectares of land under grass and forage crops in the four provinces, whereas an increase in SOM was found for a total of 267,000 hectares. Carbon accumulation in grassland sandy soils was calculated at 39 g C m-2 year-1 for the top 5 cm of the soil. From the data of Reijneveld et al. (2009) a small increase of 0.032 ton C/year could be calculated for the six arable combinations of region and soil type. From the data on maize land in Noord-Brabant, published by Hanegraaf et al (2009), a weighted average loss of 0.3 ton C/ha/yr can be calculated. Silage maize is a crop known to cause a decrease in SOC. From the data of Reijneveld et al. (2009) a small increase of 0.089 g/kg/yr could be calculated for the four grassland combinations of region and soil type. From the data on grassland in Noord-Brabant, published by Hanegraaf et al. (2009), a weighted average increase of 0.09 ton C/ha/year can be calculated. Thus, both from Dutch studies indicate a small increase in SOC on grassland, but the increase is lower than the estimations made by IPCC and Janssens et al. (2004). Both Reijneveld et al. (2009) and Hanegraaf et al. (2009) found a constant or increasing SOC level in most cases for the period between 1984 and 2004. This can possibly be explained by the large amount of manure applied in the Netherlands. Although the amount of manure that is allowed has reduced in the Netherlands during the last decades, but it still amounts about 37 ton animal slurry/ha/year for arable land and up to 51 ton/ha/year on grassland. The application of animal manure leads to a build-up of SOC (Smith et al., 1997; Sleutel et al., 2006).

42 Alterra report 1035.8
Figure 7.3
Absolute changes in SOM content (%) in sandy soils in four provinces in the Netherlands over 20 years (increase,
+ 1% or more; decrease, - 1% or more). (A) grassland; (B) continuous maize (no results for Drenthe due to lack of data)
(source: Hanegraaf et al., 2009).
These two studies are further discussed in Chardon et al. (2009), who compare the results with other studies on temporal trends of soil organic carbon in Western Europe. Chardon et al. (2009) also reviewed the effects of manure application on the soil organic carbon levels from several studies and from a modelling approach with the Century model, which was calibrated for Dutch conditions (see also Heesmans and De Willigen, 2008). It is thus concluded that for the majority of the mineral and non-organic agricultural soils (< 70 g C/kg), the SOC content is either constant or even increases, and in a few cases (soil type with specific land use) may decrease a little. The fact that agricultural soils in the Netherlands to a large extent maintain or even increase their SOC content is probably best explained by the relatively high amounts of animal manure that is applied on these soils. In the absence of a detailed monitoring system, it is considered fair and conservative to conclude that the SOC content of the Dutch agricultural soils overall does not change, so no net emission of CO2 takes place due to changes in SOC stocks in the Netherlands. Therefore it was decided to report the emissions from carbon stock changes in mineral soils as a conservative zero aggregated at the national level.

Alterrareport 1035.8 43
Carbon emissions from cultivated organic soils For carbon emissions from cultivated organic soils1 the methodology is described in Kuikman et al. (2005). This method is based on subsidence as a consequence of oxidation of organic matter. Oxidation typically is caused by a low groundwater table, which also causes two other types of subsidence: (irreversible) shrinking of the peat as a consequence of drying and compaction due to changes in hydrostatic pressure (consolidation). However, the last two processes are of importance only a few years after a sudden decrease in groundwater level. Based on many series of long-term measurements, a relation was established between subsidence and either ditch water level or mean lowest groundwater level (Kuikman et al., 2005). For all peat soils in the Netherlands, the estimated subsidence could thus be predicted. The occurrence of peat soils was based on the application of the IPCC definition to the (updated) Dutch soil map (De Vries et al., 2003). This resulted in 223,147 ha of peat soils under agricultural land use in the Netherlands. The carbon emissions per ha are calculated from the mean ground surface lowering using the following general equation:
(1)
With
emC Carbon emission from oxidation of peat (kg C ha-1 year-1)
GSLR Rate of ground surface lowering (m year-1)
peatρ Bulk density of lowest peat layer (kg soil m-3)
oxf Oxidation status of the peat (-)
[ ]OM Organic matter content of peat (kg OM kg-1 soil)
[ ]OMC Carbon content of organic matter (0.55 kg C kg-1 OM)
convf Conversion from kg C m-2 year-1 to kg C ha-1 year-1 (104)
For deep peats (> 120 cm), the calculation is based on the properties of raw peat (bulk density of 140 kg soil m-3, oxidation status of 1, and organic matter content of 0.80 kg OM kg-1 soil), which results in an emission of 616 kg C ha-1 year-1 for each mm of annual ground surface lowering. For shallow peat soils (40 < depth < 120 cm), the (higher) bulk density of half ripened peat should be used. During the process of oxidation of the peat and further ground surface lowering, the decomposability of the remaining peat decreases, resulting in a decreasing rate of ground surface lowering, an increasing bulk density and a decreasing organic matter content. Up to a peat layer depth of about 80 cm all values in equation (1) can be the same as for a deep peat soil, because the change in subsidence and bulk density of the raw peat below 60 cm depth is negligible. Also for peat soils thinner than 80 cm all values in equation (1) were used. This estimation is done because there is no data on subsidence of such shallow peat soils and because this would just cause a small error, because the fast majority of the Dutch peat soils are thicker than 80 cm. Besides, the underestimation of the bulk density will be compensated more or less by the overestimation of the subsidence.
1 N2O is reported under land use category 4 Agriculture and not further considered here.
[ ] [ ] convOMoxpeatGSLem fCOMfRC ⋅⋅⋅⋅⋅= ρ

44 Alterra report 1035.8
In Table 7.1 the calculated ground surface lowering and the surface is shown for the different combinations of soil type of the upper soil layer, the peat type and drainage class. In the last column of the table the annual emission of Carbon is reported. The total annual loss of carbon from organic soils under agricultural land use is 1.158 Mton of C, which is an annual emission of 4.246 Mton of CO2. This emission is reported under the category grassland remaining grassland.
Table 7.1
Carbon emissions as resulting from classification of peat soils in the Netherlands, estimated mean ground surface lowering (gsl)
and surface (in ha).
Soil type upper soil layer
Peat type Bad drainage Reasonable drainage
Good drainage Total C-emission
gsl Surface (ha)
gsl Surface
(ha)
gsl Surface
(ha)
Surface
(ha)
ton C year-1
Clay Eutrophic 3 16149 8 17250 13 531 33929 119100 Mesotrophic 3 12780 8 22294 13 2863 37935 156403 Oligotrophic 3 9421 8 10480 13 416 20315 72380 Peat Eutrophic 6 16668 12 16846 18 206 33719 188415 Mesotrophic 6 18668 12 31607 18 7169 57443 382118 Oligotrophic 6 8688 12 10054 18 1168 19911 119381 Humus-rich sand Mesotrophic 3 148 8 3184 13 4771 8102 54167 Oligotrophic 3 27 8 760 13 2256 3041 21856 Sand Mesotrophic 3 1365 8 3370 13 1318 6051 29681 Oligotrophic 3 415 8 1450 13 836 2700 14604
Total 84325 117291 21531 223147 1158105

Alterrareport 1035.8 45
8 Submission 2011: values and comparison with previous submissions
8.1 Calculated values for the submission 2011
Table 8.1
Sector report for land use, land-use change and forestry of Net CO2 emissions or removals in 1990 and 2009 as submitted in
the NIR 2011. NE: not estimated. NA: not applicable. IE: included elsewhere.
GREENHOUSE GAS SOURCE AND SINK CATEGORIES
Activity data (ha) Net CO2 emissions/removals,
Reporting year 1990 2009 1990 2009
Total Land-Use Categories 4,194.15 4,194.15 2,691.86 2,475.03
A. Forest Land 383.57 396.25 -2,436.99 -2,849.69 1. Forest Land remaining Forest Land 380.61 336.97 -2,434.17 -2,143.76
2. Land converted to Forest Land 2.96 59.28 -2.82 -705.93
B. Cropland 1,013.66 905.44 34.68 48.98 1. Cropland remaining Cropland 999.94 891.13 IE,NA,NE IE,NA,NE
2. Land converted to Cropland 14.32 14.32 34.68 48.98
C. Grassland 1,500.57 1,365.37 4,640.47 4,802.21 1. Grassland remaining Grassland 1,485.04 1,349.85 4,246.00 4,246.00
2. Land converted to Grassland 15.52 15.52 394.47 556.21
D. Wetlands 793.59 813.58 40.29 56.80 1. Wetlands remaining Wetlands 791.36 811.34 NE NE
2. Land converted to Wetlands 2.23 2.23 40.29 56.80
E. Settlements 420.66 633.56 212.14 300.17 1. Settlements remaining Settlements 408.27 621.17 NE NE
2. Land converted to Settlements 12.39 12.39 212.14 300.17
F. Other Land 39.45 37.29 18.13 25.52 1. Other Land remaining Other Land 39.10 36.95
2. Land converted to Other Land 0.35 0.35 18.13 25.52
G. Other 183.15 91.05 Harvested Wood Products NE NE
Lime application in all land use categories 183.15 91.05
Information items
Forest Land converted to other Land-Use Categories 699.70 699.70
Grassland converted to other Land-Use Categories -1.53 -1.53
Table 8.1 shows the integral set of values reported for main land use categories in the NIR 2011, including activity data, for 1990 (baseline year) and 2009 (t-2 year). Changes relative to the submission 2010 are identified and discussed in paragraph 8.2 for all categories A-F.
46 Alterra report 1035.8
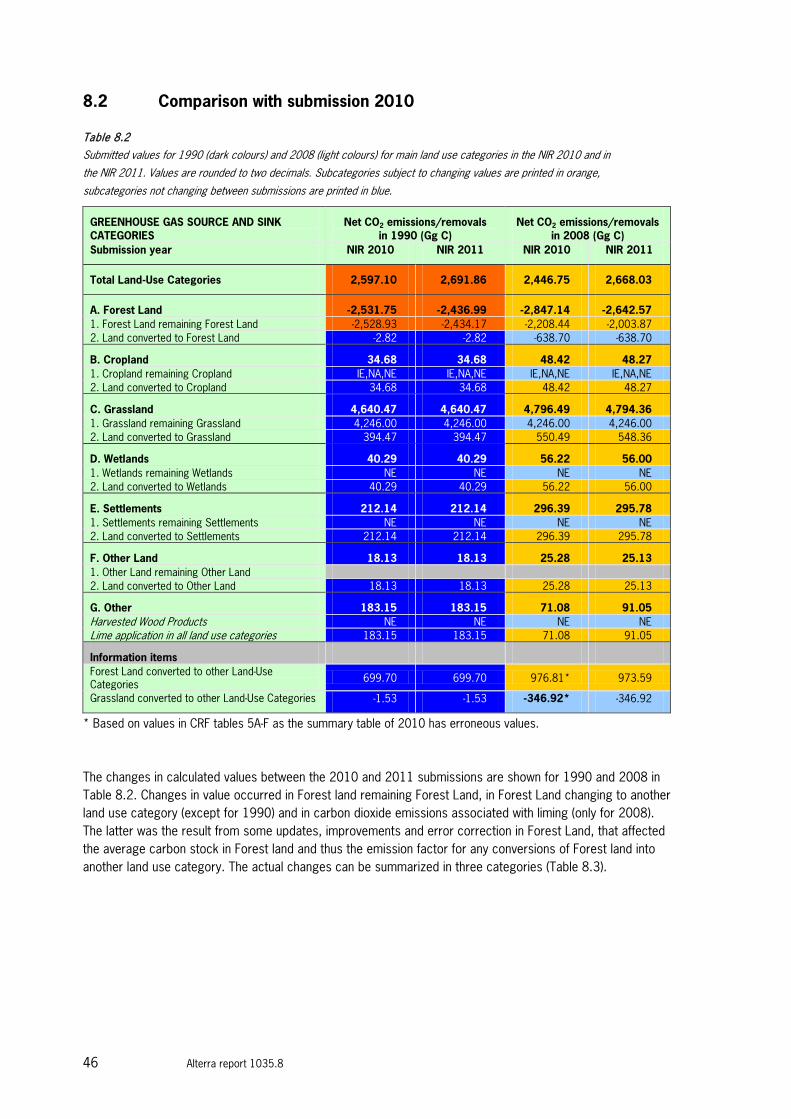
8.2 Comparison with submission 2010
Table 8.2
Submitted values for 1990 (dark colours) and 2008 (light colours) for main land use categories in the NIR 2010 and in
the NIR 2011. Values are rounded to two decimals. Subcategories subject to changing values are printed in orange,
subcategories not changing between submissions are printed in blue.
GREENHOUSE GAS SOURCE AND SINK CATEGORIES
Net CO2 emissions/removals in 1990 (Gg C)
Net CO2 emissions/removals in 2008 (Gg C)
Submission year NIR 2010 NIR 2011 NIR 2010 NIR 2011
Total Land-Use Categories 2,597.10 2,691.86 2,446.75 2,668.03
A. Forest Land -2,531.75 -2,436.99 -2,847.14 -2,642.57 1. Forest Land remaining Forest Land -2,528.93 -2,434.17 -2,208.44 -2,003.87 2. Land converted to Forest Land -2.82 -2.82 -638.70 -638.70
B. Cropland 34.68 34.68 48.42 48.27 1. Cropland remaining Cropland IE,NA,NE IE,NA,NE IE,NA,NE IE,NA,NE 2. Land converted to Cropland 34.68 34.68 48.42 48.27
C. Grassland 4,640.47 4,640.47 4,796.49 4,794.36 1. Grassland remaining Grassland 4,246.00 4,246.00 4,246.00 4,246.00 2. Land converted to Grassland 394.47 394.47 550.49 548.36
D. Wetlands 40.29 40.29 56.22 56.00 1. Wetlands remaining Wetlands NE NE NE NE 2. Land converted to Wetlands 40.29 40.29 56.22 56.00
E. Settlements 212.14 212.14 296.39 295.78 1. Settlements remaining Settlements NE NE NE NE 2. Land converted to Settlements 212.14 212.14 296.39 295.78
F. Other Land 18.13 18.13 25.28 25.13 1. Other Land remaining Other Land 2. Land converted to Other Land 18.13 18.13 25.28 25.13
G. Other 183.15 183.15 71.08 91.05 Harvested Wood Products NE NE NE NE Lime application in all land use categories 183.15 183.15 71.08 91.05
Information items Forest Land converted to other Land-Use Categories
699.70 699.70 976.81* 973.59
Grassland converted to other Land-Use Categories -1.53 -1.53 -346.92* -346.92
* Based on values in CRF tables 5A-F as the summary table of 2010 has erroneous values. The changes in calculated values between the 2010 and 2011 submissions are shown for 1990 and 2008 in Table 8.2. Changes in value occurred in Forest land remaining Forest Land, in Forest Land changing to another land use category (except for 1990) and in carbon dioxide emissions associated with liming (only for 2008). The latter was the result from some updates, improvements and error correction in Forest Land, that affected the average carbon stock in Forest land and thus the emission factor for any conversions of Forest land into another land use category. The actual changes can be summarized in three categories (Table 8.3).

Alterrareport 1035.8 47
Table 8.3
Specification of the quantitative differences between submission 2010 and submission 2011 (Gg CO2).
CRF 2011 - CRF 2010 for Difference between submissions 2010 and 2011 for reporting years (in Gg CO2)
1990 2008
Forest Land remaining Forest Land 94.76 204.75 Deforestation 0 -8.74
Lime application 0 19.7
The changes in emissions associated with Forest Land remaining Forest Land result from: 1. an error correction in the distribution of the total harvested wood over deforested areas and forest
since 1990 onwards; 2. an error correction in the harvest from 2000 onwards; 3. update in the calculation of dead wood over time. Table 8.4 gives a more detailed overview of how the emissions of Forest land remaining Forest land are built up in the 2010 and 2011 submissions. The only effects are due to changes in emission factors, the activity data are the same for both submissions. The effects on biomass gains and biomass losses are both due to the corrected harvest values. In the bookkeeping model that is used, carbon stock changes in biomass from biomass gains are affected (though quite weakly) by the amount of carbon harvested in the year before. In the 2010 version of this model, the distribution of harvested wood over deforested areas and Forest Land was based on a rounded approximation of the area that was deforested each year. In the 2011 version, this distribution was based on the actual area that is deforested from the land use change matrix (not rounded). The effect is extremely small, and increases from negligible (< 10-12%) to 0.00006 % in 1999. From 2000 onwards, the effect cannot be distinguished from the error correction in harvest values. In the course of 2010 it became obvious that there was an error related to the way harvest values were coupled to the specific years. All harvest values are stored in one input file. For the period 1990-1999, the harvest values were drawn from the input file linking the right years. However, for the reporting period which is based on the MFV (2000 and onwards) the program started counting at the wrong year and continued from there on. This was solved in the values presented here and results in a distinctly different pattern of carbon loss from harvests for the period 2000-2008 (Figure 8.1). This in its turn further affected the carbon stock change values for biomass increase by between 0.04% and 0.2%. The error correction was reflected in a much better correlation between volume of wood harvested in the Netherlands and carbon stock change from biomass loss over the years (Figure 8.2).

48 Alterra report 1035.8
Figure 8.1
Carbon stock change - decrease associated with biomass loss in Forest Land as reported in the NIR 2010 and in the NIR 2011.
Figure 8.2
Relation between carbon stock change from a decrease in biomass as reported in the NIR and annual harvested wood,
values from the NIR 2010 and the NIR 2011.
-500
-450
-400
-350
-300
-250
-200
-150
-100
-50
01988 1990 1992 1994 1996 1998 2000 2002 2004 2006 2008 2010
Gg
C y
ear-1
Submission 2011 Submission 2010
-500
-450
-400
-350
-300
-250
-200
-150
-100
-50
00 200000 400000 600000 800000 1000000 1200000 1400000 1600000 1800000
Harvested wood (m3)
CSC
from
bio
mas
s lo
ss (G
g C
)
Submission 2010 Submission 2011

Alterrareport 1035.8 49
Table 8.4
Calculation of C emissions in Forest Land remaining Forest Land - comparison of the values for 2010 and 2011 submission
(EF = emission factor; CSC = Carbon Stock Change).
Submission 2011 Submission 2010 Subm 2011 - Subm 2010
Category FAD TOF FAD + TOF FAD TOF FAD + TOF FAD + TOF
1 9 9 0
Area (kha) 360.28 20.33 380.61 360.28 20.33 380.61 0 EF_biomass_increase (Mg C ha-1)
2.84 2.84 2.84 2.84 2.84 2.84 0
EF_biomass_decrease (Mg C ha-1)
-1.32 -1.25 -1.32 -1.25 0
EF_DOM (Mg C ha-1) 0.16 0.15 0.23 0.12 -0.07 CSC_biomass_increase (Gg C)
1023.94 57.79 1081.73 1023.94 57.79 1081.73 0
CSC_biomass_decrease (Gg C)
-476.09 -476.09 -475.99 -475.99 -0.10
CSC_DOM (Gg C) 58.22 58.22 83.97 83.97 -25.75 CSC_tot (Gg C) 606.08 57.79 663.86 631.92 57.79 689.71 -25.84 CSC_tot (Gg CO2) -2222 -212 -2434 -2317 -212 -2529 94.76
2 0 0 8
Area (kha) 327.44 11.82 339.27 327.44 11.82 339.27 0 EF_biomass_increase (Mg C ha-1)
2.68 2.68 2.68 2.68 2.68 2.68 -0.01
EF_biomass_decrease (Mg C ha-1)
-1.13 -1.10 -1.2 -1.16 0.06
EF_DOM (Mg C ha-1) 0.03 0.03 0.26 0.25 -0.22 CSC_biomass_increase (Gg C)
876.47 31.65 908.12 878.47 31.72 910.19 -2.06
CSC_biomass_decrease (Gg C)
-317.60 -317.60 -392.65 -392.65 21.05
CSC_DOM (Gg C) 9.99 9.99 84.76 84.76 -74.77 CSC_tot (Gg C) 514.86 546.51 570.58 31.72 602.30 -55.79 CSC_tot (Gg CO2) -1888 -2004 -2092 -116 -2208 204.58
The emissions associated with deforestation (Forest Land FAD & TOF converted to other land use type ) are not changed for 1990 (and 2000, data not shown), as both years are calculated based on measured inventory data. All other years have a slightly higher carbon emission caused by biomass decrease, and a slightly lower carbon emission caused by the removal of dead wood (see Table 8.5 for 1990 and 2008). Both reflect changes in average carbon stock in the respective pools in the Netherlands as a result of the changes in Forest Land remaining Forest Land (see above).

50 Alterra report 1035.8
Table 8.5
Calculation of C emissions caused by deforestation - comparison of the values for 2010 and 2011 submission ((I)
EF = (implied) emission factor; CSC = Carbon Stock Change).
Submission 2011 Submission 2010 Subm 2011 - Subm 2010
Category FAD TOF FAD + TOF FAD TOF FAD + TOF FAD + TOF
1 9 9 0
Area (kha) 1.79 0.51 2.30 1.79 0.51 2.30 0 EF_biomass_increase (Mg C ha-1)
-60.42 -60.42 -60.42 -60.42 -60.42 -60.42 0
EF_biomass_decrease (Mg C ha-1)
-29.11 -22.67 -29.11 -22.67 0
EF_DOM (Mg C ha-1) -0.45 -0.45 0 CSC_biomass_increase (Gg C)
-108.46 -30.72 -138.77 -108.46
-30.72 -138.77 0
CSC_biomass_decrease (Gg C)
-52.06 52.06 -52.06 52.06 0
CSC_DOM (Gg C) -0.81 -0.81 -0.81 -0.81 0 CSC_tot (Gg C) -160.11 -30.72 -190.83 -
160.11 -30.72 -190.83 0
CSC_tot (Gg CO2) 587 113 700 587 113 700 0
2 0 0 8
Area (kha) 1.79 0.51 2.30 1.79 0.51 2.30 EF_biomass_increase (Mg C ha-1)
EF_biomass_decrease (Mg C ha-1)
-86.41 -86.41 -86.41 -85.25 -85.25 -85.25 1.16
EF_DOM (Mg C ha-1) -37.50 -29.20 -39.47 -30.74 -35.95 -27.99 -35.95 -27.99 -1.55 -1.20 -3.52 -2.74 CSC_biomass_increase (Gg C)
-154.53 -43.94 -198.47 -152.46
-43.35 -195.81 -2.66
CSC_biomass_decrease (Gg C)
-67.06 -67.06 -70.59 -70.59 3.54
CSC_DOM (Gg C) -2.77 -2.77 -6.30 -6.30 3.54 CSC_tot (Gg C) -221.59 -43.94 -265.52 -
223.05 -43.35 -266.40 0.88
CSC_tot (Gg CO2) 812 161 974 818 159 -977 -3.22
The emissions associated with liming are changed for 2008 only. The values submitted in 2010 were preliminary for 2008 and copied from 2007, as the actual values were not available yet. Now, the actual values are available for 2008 and they are updated. The values submitted for 2009 are preliminary again and copied from 2008. These will be updated in the 2012 submission.
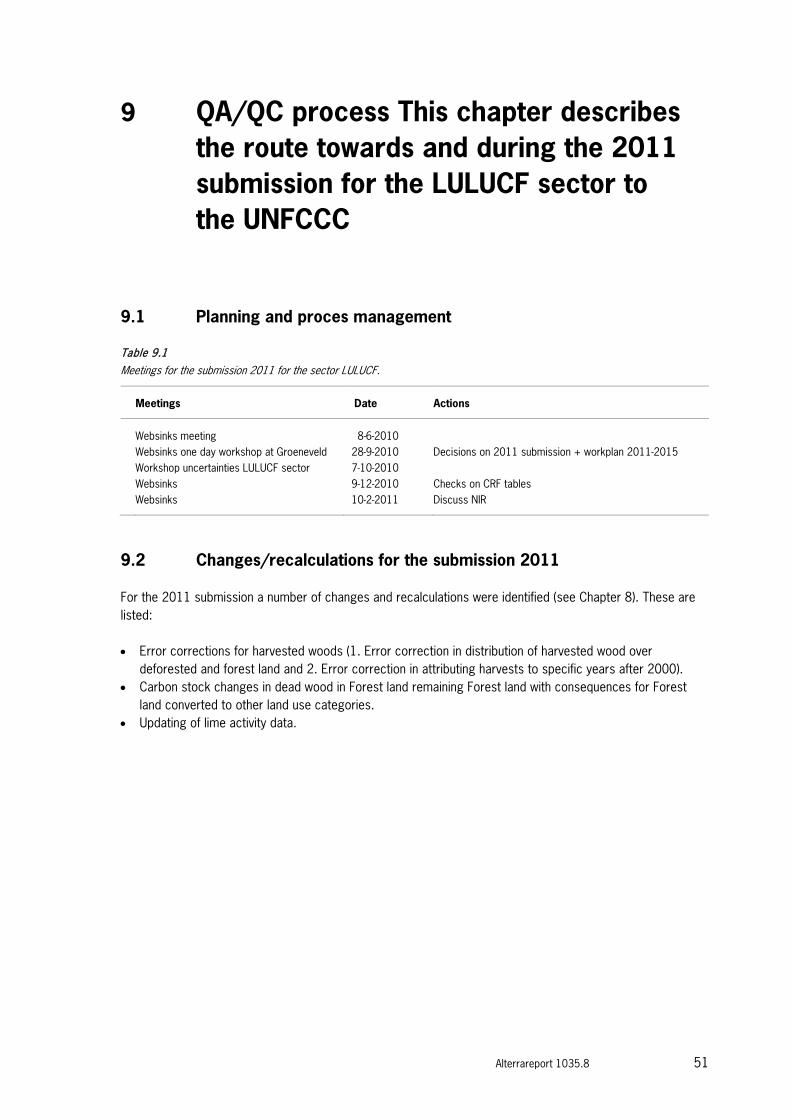
Alterrareport 1035.8 51
9 QA/QC process This chapter describes the route towards and during the 2011 submission for the LULUCF sector to the UNFCCC
9.1 Planning and proces management
Table 9.1
Meetings for the submission 2011 for the sector LULUCF.
Meetings Date Actions
Websinks meeting 8-6-2010 Websinks one day workshop at Groeneveld 28-9-2010 Decisions on 2011 submission + workplan 2011-2015 Workshop uncertainties LULUCF sector 7-10-2010 Websinks 9-12-2010 Checks on CRF tables Websinks 10-2-2011 Discuss NIR
9.2 Changes/recalculations for the submission 2011
For the 2011 submission a number of changes and recalculations were identified (see Chapter 8). These are listed: • Error corrections for harvested woods (1. Error correction in distribution of harvested wood over
deforested and forest land and 2. Error correction in attributing harvests to specific years after 2000). • Carbon stock changes in dead wood in Forest land remaining Forest land with consequences for Forest
land converted to other land use categories. • Updating of lime activity data.

52 Alterra report 1035.8
9.3 Calculations
Table 9.2
Overview of calculations supporting the LULUCF submission 2011.
Category What Who Description
Activity data: area Land use change matrix based on topographical maps
CGI, Alterra Kramer et al., 2009
C emissions from changes in biomass for 'Forest Land remaining Forest Land'
Simple bookkeeping model based on NFI data
Forest Ecology, Alterra Nabuurs et al., 2005 Van den Wyngaert et al., 2007 Van den Wyngaert et al., 2009 Chapter 5 (5A_CO2_forest_2011.pdf)
C emissions from changes in DOM-dead wood for 'Forest Land remaining Forest Land'
Simple bookkeeping model based on NFI data
Forest Ecology, Alterra Nabuurs et al., 2005 Van den Wyngaert et al., 2007 Van den Wyngaert et al., 2009 Chapter 6 (5A_CO2_forest_2011.pdf)
C emissions from changes in DOM-litter for 'Forest Land remaining Forest Land'
Stock change at national level using a combination of several data sets
Forest Ecology, Alterra Van den Wyngaert et al., 2009 Chapter 6 (5A_CO2_forest_2011.pdf)
C emissions from changes in biomass for 'Land converted to Forest Land'
Based on mean growth of young forest calculated from NFI data
Forest Ecology, Alterra Nabuurs et al., 2005 Van den Wyngaert et al., 2009 Chapter 5 (5A_CO2_forest_2011.pdf)
C emissions from changes in biomass for 'Forest Land converted to other category Land'
Based on mean C stock in forest biomass from the model based on NFI data
Forest Ecology, Alterra Nabuurs et al., 2005 Van den Wyngaert et al., 2009 Chapter 5 (5A_CO2_forest_2011.pdf)
C emissions for cultivation of organic soils
Based on groundwater level map and soil surface lowering
Soil Quality and Nutrients, Alterra
Kuikman et al., 2005 Chapter 7 5_CO2_land_use_categories_2011.pdf
C emissions from use of calcareous fertilizers
Based on national use and default emission values
PBL NIR

Alterrareport 1035.8 53
9.4 Process for calculating and reporting emissions
The Dutch land use matrix is derived from an overlay between land use maps for 1990 and 2004. Both are made by CGI (Alterra) based on the topographical maps (Kramer et al., 2009). The land use change maps are delivered to Soil Centre (Alterra). At the Soil Quality and Nutrients team (Alterra) an overlay is made between the land use maps, the soil carbon map and the soil peat map. The land use change matrix for land on mineral soils and for land on peat soils is delivered to the sectoral expert at Forest Ecology (Alterra). The emission factor of emissions associated with Forest land or conversions to and from Forest Land (Gg C ha-1) are calculated by Forest Ecology (Alterra). Emissions associated with use of organic soils are calculated by Soil Quality and Nutrients (Alterra). Emissions or emission factors are sent to the sectoral expert at Forest Ecology (Alterra). Carbon emissions associated with the agricultural use of chalk (CaCO3) or dolomite (CaMg(CO3)2) on croplands or grasslands is calculated by PBL and sent to the sector expert at Forest Ecology (Alterra). Once all values for the submission are available, a series of actions is performed to check for typing or copying errors, internal consistency, international consistency, completeness, etc. 9.5 Submission route
The reported values are entered in a copy of the CRF reporter by the sector expert at Alterra (Figure 9.1, A t/m D). After completely filling the LULUCF sector, a CRF is generated and checked by Alterra. After accordance a XML file is generated and sent to TNO (Figure 9.1, D t/m F). Then the draft CRF tables for LULUCF are generated from the CRF reporter by TNO and sent to Alterra and RIVM for checking (Figure 9.1, G t/m I). Alterra sends the spreadsheet for internal checking class 5A (Forest) and for classes 5B to 5F (Cropland, Grassland, Wetland, Settlements, Other Land). After checking and commenting Alterra reports back to TNO. PBL checks independently whether the values in the CRF are right. This is a check on all actions between calculating the values and the actual submission. TNO generates the final CRF tables (Figure 9.1, H t/m J). This loop is followed until there is full accordance. The final tables are sent to RIVM who actually performs the official submission (Figure 9.1, K). Based on the CRF and the different reports, RIVM writes the LULUCF chapter for the NIR. This chapter is read by Alterra.
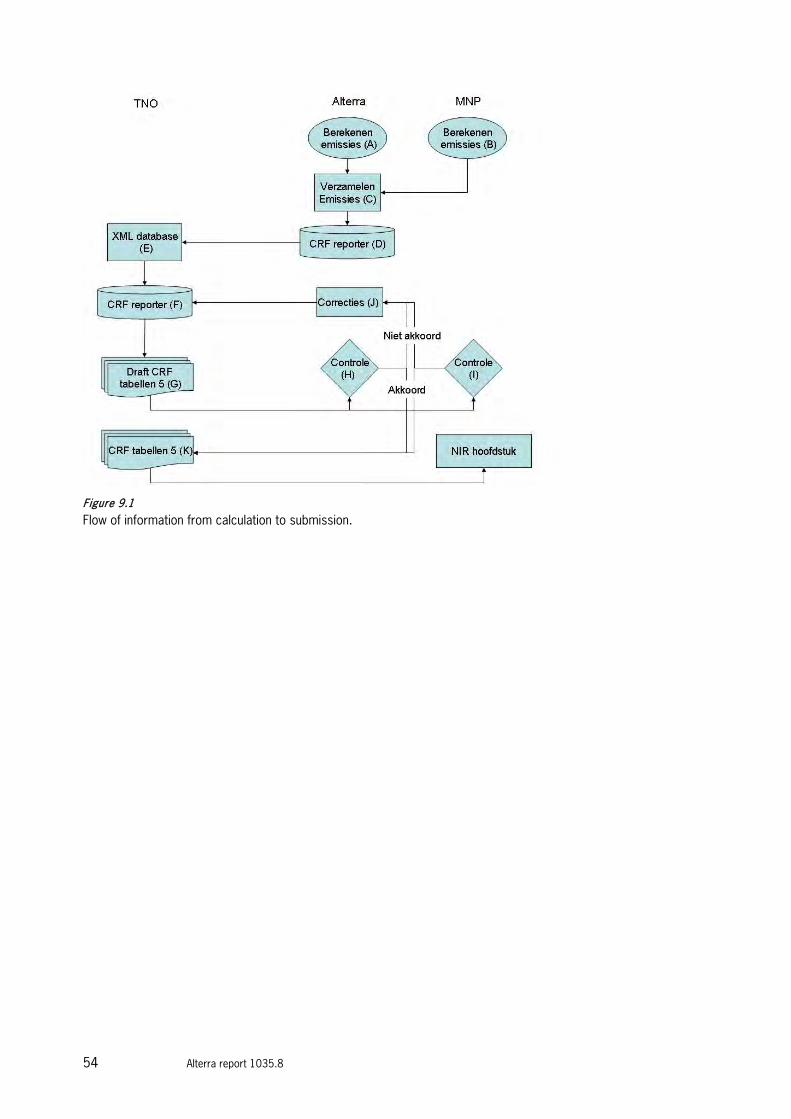
54 Alterra report 1035.8
Figure 9.1
Flow of information from calculation to submission.

Alterrareport 1035.8 55
10 Possibilities for future updates
When the current system was implemented for the LULUCF sector, it was already envisaged that there would be regular improvements over time. In Van den Wyngaert et al. (2009) a short list of proposed improvements were given that need further attention. These do not have a fixed data tied to them, and are repeated here for reasons of completeness. • Installation of subcategories in Grassland, i.e. distinction between rotational grassland, permanent
grassland and natural grasslands More than half of the land use conversions occurs between Grassland and Cropland, in either direction. The use of area as grasslands as part of a full rotational cycle is part of the agricultural system in many parts of the Netherlands. However, as such it is not possible to discriminate between 'permanent' land use changes, and its related emissions, and 'temporary' land use changes between Cropland and Grassland. Currently, it is possible to distinguish natural grasslands with a management directed towards the conservational value from grassland with a mostly agricultural purpose using a dataset on subsidies. In future it may be possible to add a further distinction between rotational grasslands and permanent agricultural grasslands. For the moment this is a conceptual idea. Due to financial reasons it is not expected to progress further in the coming years. • Periodic updating of carbon emission from change in biomass in Forest land remaining Forest land as new
data become available (new MFV cycles) The Dutch National Forest Inventory is a cyclic inventory. During a number of consecutive years, a country-wide subset of the total number of inventory plots is recorded. After a time lag, this is repeated for the permanent plots and a new selection of temporary plots is made to complement the set. Thus, a situation is foreseen where only a small subset of plots is actually recorded for a certain year and for some years none. Then a strategy will need to be developed how to incorporate the slowly becoming available plots in the reporting system based on an overview of European reporting practices in this aspect. • Reliability of carbon emission from change in biomass in Forest land remaining Forest land if a new MFV
cycle is not occurring Due to financial reasons the MFV has been postponed for some years, and it is currently not clear when a new cycle will be initiated. Until now, the gap in data between two NFI’s (HOSP and MFV) and after an NFI cycle was filled based on the data from the NFI previous to the calculated years, assuming no change in net annual increment. The validity of this assumption was tested in Van den Wyngaert et al. (2007) and accepted. • Uncertainty estimates based on the yearly calculated estimates. The current estimates for the uncertainty are based on the LULUCF calculations as they were for the NIR 2006, using Tier 1 methodologies (Olivier et al., 2009). Since then the LULUCF sector has been updated. A system to incorporate uncertainty estimates in the LULUCF calculations would guarantee a continuous updating of uncertainty estimates along with updating of the calculated values.

56 Alterra report 1035.8
Alterrareport 1035.8 57
References
Chardon, W.J., H.I.M. Heesmans, and P.J. Kuikman, 2009. Trends in carbon stocks in Dutch soils: datasets and modeling results. Alterra-report 1869, Alterra, Wageningen. Daamen W.P. and Dirkse, G.M. 2005. Veldinstructie. Meetnet FunctieVervulling 2005. Daamen, W.P. and J.A.N. Stolp. 1997 Country report for the Netherlands. In: Study on European Forestry Information and Communication System. Reports on forestry inventory and survey systems. Vol. 2. European Commission. Dirkse, G.M., W.P. Daamen, H. Schoonderwoerd, M. Japink, M. van Jole, R. van Moorsel, P. Schnitger, W.J. Stouthamer and M. Vocks. 2007. Meetnet Functievervulling bos 2001-2005. Vijfde Nederlandse Bosstatistiek. Directie Kennis, Ministerie van Landbouw, Natuur en Voedselkwaliteit. Rapport DK nr 2007/065. Ede. Finke, P.A., J.J. de Gruijter en R. Visschers, 2001. Status 2001 Landelijke steekproef Kaarteenheden en toepassingen, Gestructureerde bemonstering en karakterisering Nederlandse bodems. Alterra-rapport 389, Alterra, Wageningen. Groot, W.J.M. de, R. Visschers, E. Kiestra, P.J. Kuikman and G.J. Nabuurs, 2005. National system to report to the UNFCCC on carbon stock and change of carbon stock related to land use and changes in land use in the Netherlands (in Dutch). Alterra-rapport 1035-3, Alterra, Wageningen. Hanegraaf, M.C., E. Hoffland, P.J. Kuikman, and L. Brussaard. 2009. Trends in soil organic matter contents in Dutch grasslands and maize fields on sandy soils. Eur. J. Soil Sci. 60: 213 - 222. Heesmans, H.I.M., and P. de Willigen. 2008. Ontwikkeling van koolstofgehalte in Nederlandse bodems bij wisselend landgebruik, Resultaten van berekeningen met het model Century4. Alterra-report 1704, Alterra Wageningen. Hees, A.F.M. van and A.P.P.M. Clerkx. 1999. Dead wood in the forest. De Levende Natuur 100(5), p. 168-172 (in Dutch). IPCC 2003. LUCF Sector Good Practice Guidance. Penman et al. (Eds.), IPCC Good practice Guidance for Land Use, Land Use Change and Forestry. IPCC NGGIP Programme. Published by IGES for IPCC. Japan. IPCC 2006, 2006 IPCC Guidelines for National Greenhouse Gas Inventories, Prepared by the National Greenhouse Gas Inventories Programme, Eggleston H.S., Buendia L., Miwa K., Ngara T. and Tanabe K. (eds). Published: IGES, Japan. Janssens, I.A., A. Freibauer, B. Schlamadinger, R. Ceulemans, P. Ciais, A.J. Dolman, M. Heimann, G.-J. Nabuurs, P. Smith, R. Valentini, and E.-D. Schulze. 2004. The carbon budget of terrestrial ecosystems at country-scale - a European case study. Biogeosciences Discussions 1: 167-193.

58 Alterra report 1035.8
Kramer, H., G.W. Hazeu, J. Clement. 2007. Basiskaart Natuur 2004. Vervaardiging van een landsdekkend basisbestand terrestrische natuur in Nederland. WOT werkdocument 40. Alterra, Wageningen. Kramer, H., G.J. van den Born, J.P. Lesschen, J. Oldengarm, I.J.J. Van den Wyngaert. 2009. Land Use and Land Use Change for LULUCF reporting under the Convention on Climate Change and the Kyoto protocol. Alterra-report 1916, Alterra, Wageningen. Kuikman, P.J., W.J.M. de Groot, R.F.A. Hendriks, J. Verhagen, and F. de Vries. 2003. Stocks of C in soils and emissions of CO2 from agricultural soils in the Netherlands. Alterra-report 561, Alterra, Wageningen. Kuikman, P.J., L. Kooistra, and G.J. Nabuurs. 2004. Land use, agriculture and greenhouse gas emissions in the Netherlands: omissions in the National Inventory Report and potential under Kyoto Protocol article 3.4. Alterra-report 903, Alterra, Wageningen. Kuikman, P.J., J.J.H. van den Akker and F. de Vries, 2005. Emission of N2O and CO2 from organic agricultural soils. Alterra-report 1035.2. Alterra, Wageningen. Nabuurs, G.J., W. Daamen, G.M. Dirkse, J. Paasman, P.J. Kuikman, and J. Verhagen. 2003. Present readiness of and white spots in the Dutch National System for greenhouse gas reporting of the Land Use, Land-Use Change and Forestry sector (LULUCF). Alterra-report 774, Alterra, Wageningen. Nabuurs, G.J., I.J.J. van den Wyngaert, W.D. Daamen, A.T.F. Helmink, W. de Groot, W.C. Knol, H. Kramer and P. Kuikman. 2005. National system of greenhouse gas reporting for forest and nature areas under UNFCCC in the Netherlands. Alterra report 1035.1, Alterra, Wageningen. 57 p. Olivier, J.G.J., L.G. Brandes, R.A.B. te Molder. 2009. Estimate of annual and trend uncertainty for Dutch sources of greenhouse gas emissions using the IPCC Tier 1 approach. PBL Report 500080013, PBL, Bilthoven. Reijneveld, A., J. van Wensem, and O. Oenema. 2009. Trends in soil organic carbon of agricultural land in the Netherlands between 1984 and 2004. Geoderma 152, 231-238. Sleutel, S., S. De Neve, D. Beheydt, C. Li, and G. Hofman. 2006. Regional simulation of long-term organic carbon stock changes in cropland soils using the DNDC model: 2. Scenario analysis of management options. Soil Use Manage. 22: 352-361. Smith, P., D.S. Powlson, M.J. Glendining, and J.U. Smith. 1997. Potential for carbon sequestration in European soils: Preliminary estimates for five scenarios using results from long-term experiments. Global Change Biol. 3: 67-79. Vries F. de, W.J.M. de Groot, T.Hoogland, and J. Denne. 2003. De Bodemkaart van Nederland digitaal;. Toelichting bij inhoud, actualiteit en methodiek en korte beschrijving van additionele informatie. Alterra report 811, Alterra, Wageningen. Wyngaert, I.J.J. van den, W. de Groot, P. Kuikman, G.J. Nabuurs. 2007. Updates of the Dutch National System for greenhouse gas reporting of the LULUCF sector. Alterra-report 1035.5, Alterra, Wageningen.

Alterrareport 1035.8 59
Wyngaert, I.J.J. van de, H. Kramer, P. Kuikman, G.J. Nabuurs, H. Vreuls. 2008. Greenhouse gas reporting of the LULUCF sector, revisions and updates related to the Dutch NIR 2008. Alterra-report 1035.6, Alterra, Wageningen. Wyngaert, I.J.J. van de, H. Kramer, P. Kuikman, J.P.Lesschen. 2009. Greenhouse gas reporting of the LULUCF sector, revisions and updates related to the Dutch NIR 2009. Alterra-report 1035.7, Alterra, Wageningen.

60 Alterra report 1035.8

Alterrareport 1035.8 61
Annex A Carbon emission calculations for Forest Land remaining Forest Land (I) and fluxes associated with changes in biomass associated with the conversion of land to and from Forest (II)
A(I). Forest remaining forest The carbon budget of forests in the Netherlands is based on a simulated annual carbon stock change budget for each of the NFI plots, which are then aggregated to the country scale based on the representative areas of the plots. The calculated biomass values are used for the calculation of an emission factor for deforestation. Plot level simulation model to calculate annual plot scale carbon stock and carbon stock change 1. Calculate age from recording year and regeneration year
regrcdit ttT −= where
itT Age of NFI plot i at time t (years) rcdt Year of recording of NFI plot i regt (Estimated) year of regeneration of NFI plot i
2. Calculate maximal height from age and measured dominant height
87
87
)1/(
)1(cTc
iti
cTciit
it
it
ehSI
eSIh−
−
−=⇔
−⋅=
where
itT Age of NFI plot i at time t (years)
ith Dominant height of NFI plot i at time t (m)
iSI Site index of NFI plot i, i.e. asymptote of hdom→ ∞ (m) [MFV]
c7, c8 Tree species specific constants (year-1 , -)

62 Alterra report 1035.8
3. Calculate current mean tree volume and dbh from total standing stock, tree density and dominant height
it
itit nt
VV =
where
itV Stand volume of NFI plot i at time t (m3 ha-1) itnt Living tree density of NFI plot i at time t (ha-1)
itV Average tree volume of NFI plot i at time t (m3)
))l n ()( l n (1)l n (
)l n ()l n ()l n (
chbVa
d b h
chbd b haV
ehd b hV
i ti ti t
i ti ti t
cbi t
ai ti t
−×−×=⇔
+×+×=⇔
××=
where
itV Average tree volume of NFI plot i at time t (m3)
itdbh Average tree diameter of NFI plot i at time t (cm)
ith Dominant height of NFI plot I at time t (m) cba ,, Type-specific constants
4. Calculate current mean tree mass and total plot biomass and carbon from current tree dimensions
( )( )i ti tB GB G
i ti tA GA G
B GA Gti
hd b hb fB
hd b hb fB
BBB
i t
i t
i ti t
,
,
=
=
+=
where
itB Average tree biomass of NFI plot i at time t (kg DW)
itAGB Above ground mean tree biomass of NFI plot i at time t (kg DW)
itBGB Below ground mean tree biomass of NFI plot i at time t (kg DW)
( )AGbf Biomass function relating mean tree above ground biomass to mean DBH and height
( )BGbf Biomass function relating mean tree below ground biomass to mean DBH and height
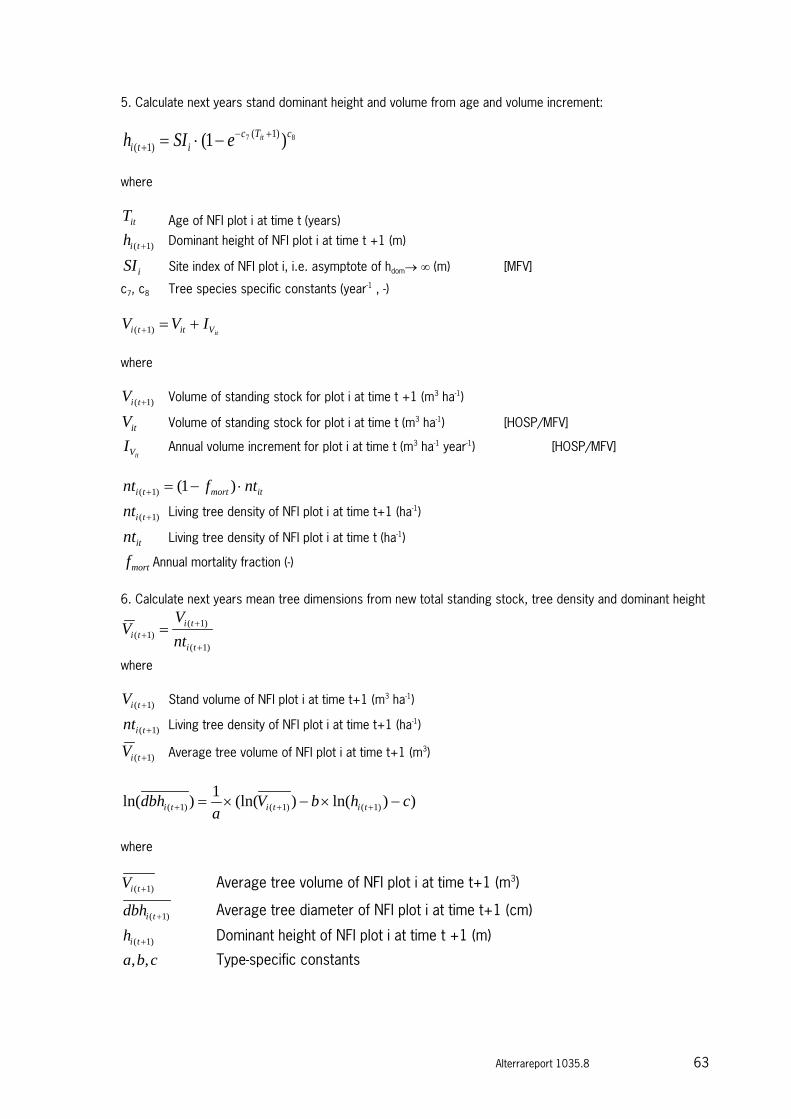
Alterrareport 1035.8 63
5. Calculate next years stand dominant height and volume from age and volume increment:
87 )1( )1()1(
cTciti
iteSIh +−+ −⋅=
where
itT Age of NFI plot i at time t (years)
)1( +tih Dominant height of NFI plot i at time t +1 (m)
iSI Site index of NFI plot i, i.e. asymptote of hdom→ ∞ (m) [MFV]
c7, c8 Tree species specific constants (year-1 , -)
itVitti IVV +=+ )1( where
)1( +tiV Volume of standing stock for plot i at time t +1 (m3 ha-1)
itV Volume of standing stock for plot i at time t (m3 ha-1) [HOSP/MFV]
itVI Annual volume increment for plot i at time t (m3 ha-1 year-1) [HOSP/MFV]
itmortti ntfnt ⋅−=+ )1()1(
)1( +tint Living tree density of NFI plot i at time t+1 (ha-1)
itnt Living tree density of NFI plot i at time t (ha-1)
mortf Annual mortality fraction (-)
6. Calculate next years mean tree dimensions from new total standing stock, tree density and dominant height
)1(
)1()1(
+
++ =
ti
titi nt
VV
where
)1( +tiV Stand volume of NFI plot i at time t+1 (m3 ha-1)
)1( +tint Living tree density of NFI plot i at time t+1 (ha-1)
)1( +tiV Average tree volume of NFI plot i at time t+1 (m3)
))ln()(ln(1)ln( )1()1()1( chbVa
dbh tititi −×−×= +++
where
)1( +tiV Average tree volume of NFI plot i at time t+1 (m3)
)1( +tidbh Average tree diameter of NFI plot i at time t+1 (cm)
)1( +tih Dominant height of NFI plot i at time t +1 (m)
cba ,, Type-specific constants

64 Alterra report 1035.8
7. Calculate next years mean tree mass and total plot biomass and carbon from new tree dimensions
( )( ))1()1(
)1()1(
)1(
,
,
)1(
)1(
)1()1(
++
++
+
=
=
+=
+
+
++
titiBGBG
titiAGAG
BGAGti
hdbhbfB
hdbhbfB
BBB
ti
ti
titi
where
)1( +tiB Average tree biomass of NFI plot i at time t (kg DW)
)1( +tiAGB Above ground mean tree biomass of NFI plot i at time t (kg DW)
)1( +tiBGB Below ground mean tree biomass of NFI plot i at time t (kg DW)
)1( +tih Dominant height of NFI plot i at time t +1 (m)
( )AGbf Biomass function relating mean tree above ground biomass to mean DBH and height
( )BGbf Biomass function relating mean tree below ground biomass to mean DBH and height 8. Distribute national harvest values over plots
( )[ ]
ititHL
itit
NLH
itit
ititit
BntHpfB
VHpHf
TVTV
Hp
it⋅⋅⋅=
⋅=
>∨><∧<
=
∑)(
11030011103000
)(
where
)(Hpit Chance of a harvest occurring in plot i at time t (-)
itV Stand volume of NFI plot i at time t (m3 ha-1)
itT Age of NFI plot i at time t (years)
Hf Fraction of plot i that is harvested at time t (-)
NLH Annually harvested volume at national scale (m3)
itLB Biomass harvested in plot i at time t (kg DW)
itnt Living tree density of NFI plot i at time t (in ha-1)
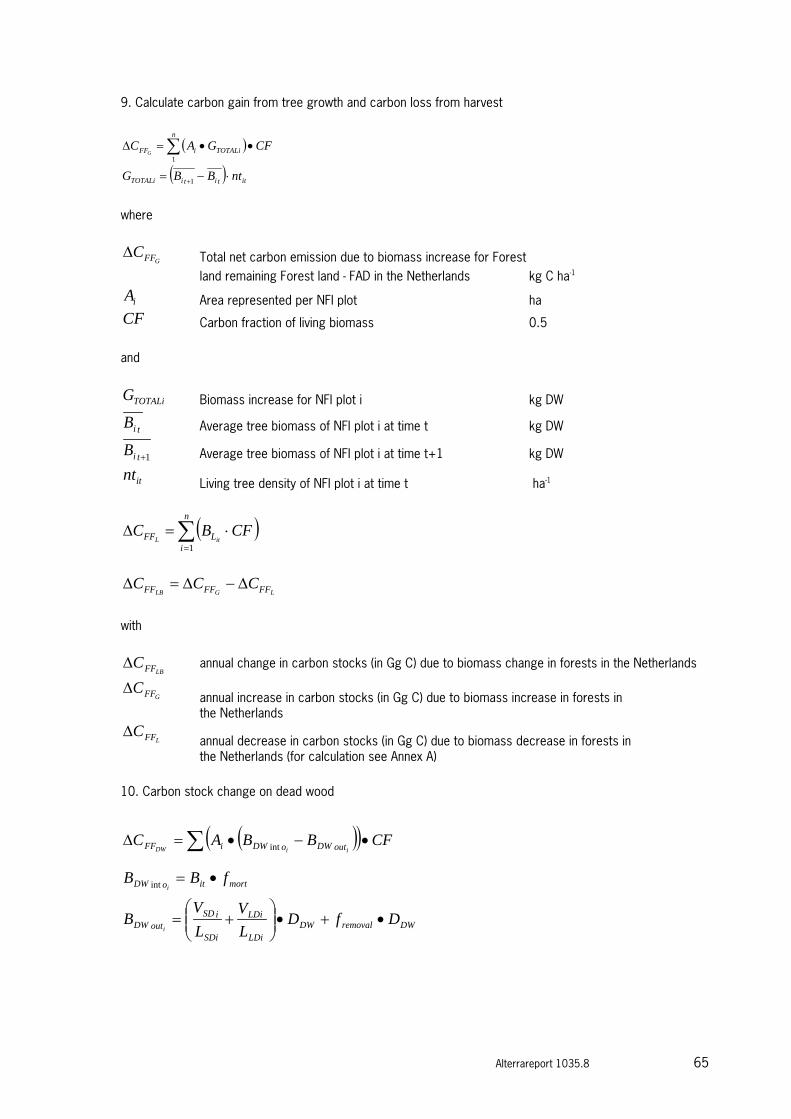
Alterrareport 1035.8 65
9. Calculate carbon gain from tree growth and carbon loss from harvest
( )
( ) ittitiTOTALi
n
TOTALiiFF
ntBBG
CFGACG
⋅−=
••=∆
+
∑
1
1
where
GFFC∆ Total net carbon emission due to biomass increase for Forest land remaining Forest land - FAD in the Netherlands kg C ha-1
iA Area represented per NFI plot ha CF Carbon fraction of living biomass 0.5 and
TOTALiG Biomass increase for NFI plot i kg DW
tiB Average tree biomass of NFI plot i at time t kg DW
1+tiB Average tree biomass of NFI plot i at time t+1 kg DW
itnt Living tree density of NFI plot i at time t ha-1
( )∑=
⋅=∆n
iLFF CFBC
itL1
LGLB FFFFFF CCC ∆−∆=∆ with
LBFFC∆ annual change in carbon stocks (in Gg C) due to biomass change in forests in the Netherlands
GFFC∆ annual increase in carbon stocks (in Gg C) due to biomass increase in forests in
the Netherlands
LFFC∆ annual decrease in carbon stocks (in Gg C) due to biomass decrease in forests in
the Netherlands (for calculation see Annex A) 10. Carbon stock change on dead wood
( )( )
DWremovalDWLDi
LDi
SDi
iSDoutDW
mortitoDW
outDWoDWiFF
DfDLV
LV
B
fBB
CFBBAC
i
i
iiDW
•+•
+=
•=
•−•=∆ ∑
int
int

66 Alterra report 1035.8
DWFFC∆ Total net carbon emission due to change in dead wood for Forest land remaining Forest land - FAD in the Netherlands
ioDWB int Annual mass transfer into dead wood pool of NFI plot i
ioutDWB Annual mass transfer out of dead wood pool of NFI plot i
itB Stand living biomass of NFI plot i at time t
mortf Mortality fraction (0.4% year-1)
iSDV Volume of standing dead wood of NFI plot i
LDiV Volume of lying dead wood of NFI plot i
SDiL Species specific longevity of standing dead wood
LDiL Species specific longevity of standing lying wood
DWD Species specific average wood density of dead wood
removalf Removal fraction of dead wood (0.2 year-1)
A(II). Afforestation & deforestation Following calculations are carried out to derive the annual carbon balance from the live tree compartment through afforestation and deforestation 1. Afforestation
( )∑=
⋅=∆20
1tLFtLF tGrowth
AEFC
Where
GrowthLFC∆ Change in carbon stock in living biomass in land annually converted to forest land (Gg C)
tEF Emission factor for young plots of age t (see par. 5.3.1) (Gg C ha-1)
tLFA Area of land converted to forest of age t (ha)
2. Deforestation
( )CF
ABA
ACi
itiFLFL tLoss
⋅⋅
⋅=∆∑
∑
LossFLC∆ change in carbon stocks in living biomass due to conversion of Forest land to other land use
categories (Gg C)
tFLA Area of land deforested annually (ha)
iA Area of land represented by plot i (ha)
itB Stand biomass of living trees of NFI plot i at time t (kg DW)

Alterrareport 1035.8 67
Annex B Improved calculation of dead wood
Rationale
The EU gave feedback that the accumulation of carbon in dead organic matter was very high for the Netherlands. The Netherlands in return looked more in detail to the way the C stock evolved over time. The accumulation of carbon in dead wood estimated for 2000 proved much higher than the measured values in the MFV inventory. The accumulation of carbon in dead wood was based on estimated mortality rates and measured decomposition values for the Netherlands (Clerkx and Van Hees, 1999). However, any effect of management was not taken into account, as the removal of dead wood was set to zero. Though there is a lot of attention for the importance of dead wood for biodiversity, this does not prevent dead wood removal in ALL forests in the Netherlands. Effect of new parameter for dead wood removal
The calculation of dead wood is updated in Annex A to include a parameter that specifies removal of dead wood (see also Box). Calibrating this parameter on the Hosp and MFV values yielded a removal fraction of 20%. Calculating the carbon stock with and without including removal of dead wood resulted in the values as shown in Figure B0-1. It is clear that the old method gave an increasingly overestimate of the carbon stock in litter in years further removed from inventoried years. As these values are the carbon stocks and not stock changes, they were reported only for deforestation. However, they were added to the carbon stock in litter (DOM = dead wood + litter) and thus the strong changes in the data were as such not reflected in the reported values in the CRF.
10. Carbon stock change on dead wood
( )( )
DWremovalDWLDi
LDi
SDi
iSDoutDW
mortitoDW
outDWoDWiFF
DfDLV
LV
B
fBB
CFBBAC
i
i
iiDW
•+•
+=
•=
•−•=∆ ∑
int
int
DWFFC∆ Total net carbon emission due to change in dead wood for Forest land remaining Forest land - FAD in the Netherlands
ioDWB int Annual mass transfer into dead wood pool of NFI plot i
ioutDWB Annual mass transfer out of dead wood pool of NFI plot i
itB Stand living biomass of NFI plot i at time t
mortf Mortality fraction (0.4% year-1)

68 Alterra report 1035.8
10. Carbon stock change on dead wood (continued)
iSDV Volume of standing dead wood of NFI plot i
LDiV Volume of lying dead wood of NFI plot i
SDiL Species specific longevity of standing dead wood
LDiL Species specific longevity of standing lying wood
DWD Species specific average wood density of dead wood
removalf Removal fraction of dead wood (0.2 year-1)
Figure B0-1
Carbon stock (per ha) in dead wood as calculated for the NIR 2010 and for the NIR 2011and measured values from
the HOSP (1990) and MFV (2000) forest inventories.
0
0.5
1
1.5
2
2.5
3
3.5
4
1985 1990 1995 2000 2005 2010
year
C s
tock
in d
ead
woo
d (M
g C
ha
-1)
NIR 2010 NIR 2011 measured values

Alterrareport 1035.8 69
Annex C Biomass expansion equations selected from the COST21 database (from Nabuurs et al., 2005)
Table C0-1
Allometric equations used to calculate aboveground biomass (in kg) from inventory data (D in cm, H in m).
Species group Equation Developed for Country Reference
Acer spp 0.00029*(D*10)2.50038 Betula pubescens Sweden Johansson 1999a Alnus spp 0.00309*(D*10)2.022126 Alnus glutinosa Sweden Johansson 1999b Betula spp 0.00029*(D*10)2.50038 Betula pubescens Sweden Johansson 1999a Fagus sylvatica 0.0798*D2.601 Fagus sylvatica The Netherlands Bartelink 1997 Fraxinus excelsior 0.41354*D2.14 Quercus robur and
Quercus petraea Austria Hochbichler 2002
Larix spp 0.0533*(D2*H)0.8955 Picea abies European Russia Hamburg et al. 1997 Picea spp 0.0533*(D2*H)0.8955 Picea abies European Russia Hamburg et al. 1997 Pinus other 0.0217*(D2*H)0.9817 Pinus sylvestris European Russia Hamburg et al. 1997 Pinus sylvestris 0.0217*(D2*H)0.9817 Pinus sylvestris European Russia Hamburg et al. 1997 Populus spp 0.0208*(D2*H)0.9856 Populus tremula European Russia Hamburg et al. 1997 Pseudotsuga menziesii 0.111*D2.397 Pseudotsuga menziesii The Netherlands Van Hees 2001 Quercus spp 0.41354*D2.14 Quercus robur and
Quercus petraea Austria Hochbichler 2002
Coniferous other 0.0533*(D2*H)0.8955 Picea abies European Russia Hamburg et al. 1997 Broadleaved other 0.41354*D2.14 Quercus robur and
Quercus petraea Austria Hochbichler 2002
Table C0-2
Allometric equations used to calculate belowground biomass (in kg) from inventory data (D in cm, H in m).
Species group Equation Species Country Reference
Acer spp 0.0607*D2.6748*H-0.561 Betula pubescens European Russia Hamburg et al. 1997 Alnus spp 0.0607*D2.6748*H-0.561 Betula pubescens European Russia Hamburg et al. 1997 Betula spp 0.0607*D2.6748*H-0.561 Betula pubescens European Russia Hamburg et al. 1997 Fagus sylvatica e-3.8219*D2.5382 Fagus sylvatica France Le Goff & Ottorini 2001 Fraxinus excelsior -1.551*0.099*D2 Quercus petraea France Drexhage et al. 1999 Larix spp 0.0239*(D2*H)0.8408 Picea abies European Russia Hamburg et al., 1997 Picea spp 0.0239*(D2*H)0.8408 Picea abies European Russia Hamburg et al., 1997 Pinus other 0.0144*(D2*H)0.8569 Pinus sylvestris European Russia Hamburg et al., 1997 Pinus sylvestris 0.0144*(D2*H)0.8569 Pinus sylvestris European Russia Hamburg et al., 1997 Populus spp 0.0145*(D2*H)0.8749 Populus tremula European Russia Hamburg et al., 1997 Pseudotsuga menziesii 0.0239*(D2*H)0.8408 Picea abies European Russia Hamburg et al., 1997 Quercus spp -1.551*0.099*D2 Quercus petraea France Drexhage et al. 1999 Coniferous other 0.0239*(D2*H)0.8408 Picea abies European Russia Hamburg et al., 1997 Broadleaved other -1.551*0.099*D2 Quercus petraea France Drexhage et al. 1999

70 Alterra report 1035.8
References Bartelink, H.H., 1997, Allometric relationship for biomass and leaf area of beech (Fagus sylvatica L), Annals of Forest Science, 1997, 54: p39-50 Drexhage, M., Chauvière, M. , Colin, F. , Nielsen, C.N.N. (1999) Development of structural root architecture and allometry of Quercus petraea Canadian Journal of Forest research 29 p 600-608
Gracia, C. Vayreda, J. Sabaté, S. Ibáñez, J. (2004) Main Components of the Aboveground Biomass Expansion Factors. Presentation at COST-Action E-21 WG 1 Meeting on BEF’s. Hämeenlinna, Finland
Hamburg, S.P. Zamolodchikov, D.M. Korovin, G.N. Nefedjev, V.V. Utkin, A.I., Gulbe, J.I., Gulbe, T.A. (1997) Estimating the carbon content of Russian forests: a comparison of phytomass/volume and allometric projections. Mitigation and Adaptation Strategies for Global Change 2: p247-265
Hees, A,F,M, van,2001, Biomass development in unmanaged forests, Nederlands Bosbouwtijdschrift 73 (5): p2-5
Hochbichler, Eduar (2002): Vorläufige Ergebnisse von Biomasseninventuren in Buchen- und Mittelwald-beständen, In Dietrich, H,-P,, Raspe, S,, Preushsler, T,: Inventur von Biomasse- und Nährstoffvorräten in Waldbeständen, Forstliche Forschungsberichte, Heft 186, LWF, München, Germany, p37-46
Johansson, T, 1999b Dry matter amounts and increment in 21-to 91-year-old common alder and grey alder some practical implicatons, Canadian Journal of Forest Research 29, p1679-1690
Johansson, T, 1999a Biomass equations for determining functions of pendula and pubescent birches growing on abandoned farmland and some practical implicatons, Biomass and bioenergy 16, p223-238
Le Goff, N, and J,-M, Ottorini, 2001, Root biomass and biomass increment in a beech (Fagus sylvatica L,) stand in North-East France, Annals of Forest Science, 2001, 58: p1-13


Alterra is part of the international expertise organisation Wageningen UR (University & Research centre). Our mission is ‘To explore the potential of nature to improve the quality of life’. Within Wageningen UR, nine research institutes – both specialised and applied – have joined forces with Wageningen University and Van Hall Larenstein University of Applied Sciences to help answer the most important questions in the domain of healthy food and living environment. With approximately 40 locations (in the Netherlands, Brazil and China), 6,500 members of staff and 10,000 students, Wageningen UR is one of the leading organisations in its domain worldwide. The integral approach to problems and the cooperation between the exact sciences and the technological and social disciplines are at the heart of the Wageningen Approach.
Alterra is the research institute for our green living environment. We offer a combination of practical and scientific research in a multitude of disciplines related to the green world around us and the sustainable use of our living environment, such as flora and fauna, soil, water, the environment, geo-information and remote sensing, landscape and spatial planning, man and society.
More information: www.alterra.wur.nl/uk I.J.J. van den Wyngaert, H. Kramer, P.J. Kuikman and J.P. Lesschen
Alterra report 1035.8
ISSN 1566-7197
Greenhouse gas reporting of the LULUCF sector: background to the Dutch NIR 2011
Alterra is part of the international expertise organisation Wageningen UR (University & Research centre). Our mission is ‘To explore the potential of nature to improve the quality of life’. Within Wageningen UR, nine research institutes – both specialised and applied – have joined forces with Wageningen University and Van Hall Larenstein University of Applied Sciences to help answer the most important questions in the domain of healthy food and living environment. With approximately 40 locations (in the Netherlands, Brazil and China), 6,500 members of staff and 10,000 students, Wageningen UR is one of the leading organisations in its domain worldwide. The integral approach to problems and the cooperation between the exact sciences and the technological and social disciplines are at the heart of the Wageningen Approach.
Alterra is the research institute for our green living environment. We offer a combination of practical and scientific research in a multitude of disciplines related to the green world around us and the sustainable use of our living environment, such as flora and fauna, soil, water, the environment, geo-information and remote sensing, landscape and spatial planning, man and society.