Greenhouse Gas Assessment Workbook for Road Projects · Greenhouse Gas Assessment Workbook for ......
120
Greenhouse Gas Assessment Workbook for Road Projects February 2013 Transport Authorities Greenhouse Group
Transcript of Greenhouse Gas Assessment Workbook for Road Projects · Greenhouse Gas Assessment Workbook for ......
Greenhouse Gas Assessment Workbook for Road Projects
February 2013
Transport Authorities Greenhouse Group

GREENHOUSE GAS ASSESSMENT WORKBOOK FOR ROAD PROJECTS V6.DOCX
Revision Details Date Amended By
00 Original 9 November 2010 A Dilger / C Riley
01 Update post review workshop 17 December 2010 A Dilger / C Riley
02 Updated with maintenance and operation 4 March 2011 A Dilger / C Riley
03 Final 31 March 2011 A Dilger / C Riley
04 Final 09 June 2011 A Dilger
05 Final 20 December 2011 S.Renton
06 2013 Update 14 February 2013 S.Renton
©Transport Authorities Greenhouse Group Australia and New Zealand (TAGG) [2011].
This document was developed on behalf of TAGG by Parsons Brinkerhoff and Edge Environmental. Copyright in the drawings, information and data recorded in this document (the information) is the property of TAGG. This document and the information are solely for the use of the authorised recipient and this document may not be used, copied or reproduced in whole or part for any purpose other than that for which it was supplied by TAGG. TAGG makes no representation, undertakes no duty and accepts no responsibility to any third party who may use or rely upon this document or the information.
Author: Alison Dilger / Callan Riley / Suzi Young / Jonas Bengtsson / Ben Kneppers .......
Signed:
Reviewer: Derek Low / G Gilpin ...........................................................................................
Signed: ...................................................................................
Approved by: D Low ..................................................................................................................
Signed: ...................................................................................
Date: 09 June 2011 .......................................................................................................
Please note that when viewed electronically this document may contain pages that have been intentionally left blank. These blank pages may occur because in consideration of the environment and for your convenience, this document has been set up so that it can be printed correctly in double-sided format.

Greenhouse Gas Assessment Workbook for Road Projects
GREENHOUSE GAS ASSESSMENT WORKBOOK FOR ROAD PROJECTS V6.DOCX Page iii
Contents Page number
Glossary vi
1. Introduction 1
1.1 Overview of workbook 1
2. Greenhouse gas assessments – background information 3
2.1 Greenhouse gases 3
2.2 Carbon dioxide equivalence and global warming potential 3
2.3 Greenhouse gas assessment boundary 3
2.3.1 Emission scopes 4 2.3.2 Materiality and revising the activities to be assessed 6
3. Estimating the ‘whole of life’ greenhouse gas emissions for a road project 7
3.1 When can I do an assessment? 7
3.2 How do I undertake a GHG assessment? 7
3.3 Benchmarking 11
4. Module 1 – Design 13
4.1 Exception – air travel 13
5. Module 2 – Construction 14
5.1 Construction GHG assessment boundary 14
5.1.1 Alternative processes or materials 17 5.2 Construction emission sources and required data 17
5.3 Default quantity factors – road construction 26
5.3.1 Site offices and plant 26 5.3.2 Plant and Equipment 28 5.3.3 Demolition and earthworks 30 5.3.4 Pavements 37 5.3.5 Road structures 40 5.3.6 Drainage 41 5.3.7 Road furniture 42
5.4 Road projects that include tunnels 44
6. Module 3 – Operation 46
6.1 Operation GHG assessment boundary 46
6.2 Operation emission sources and required data 48
6.3 Electricity ratings for typical road lighting and signals 50

Greenhouse Gas Assessment Workbook for Road Projects
Page iv GREENHOUSE GAS ASSESSMENT WORKBOOK FOR ROAD PROJECTS V6.DOCX
6.4 Default quantity factors – operation 51
6.5 Intelligent transport systems 53
7. Module 4 – Maintenance 54
7.1 Maintenance GHG assessment boundary 54
7.2 Maintenance emission sources and required data 56
7.3 Default quantity factors – maintenance 58
8. Carbon Gauge 60
8.1 Overview of Carbon Gauge 60
8.2 The Carbon Gauge Menu 61
8.3 Entering information into Carbon Gauge 61
8.4 Overview of GHG Emissions 61
List of tables Page number
Table 5-1 Emission sources to be included in GHG assessment of construction 15 Table 5-2 Data required to estimate GHG emissions from road construction 18 Table 5-3 Default quantity factors – Site offices and vehicles 26 Table 5-4 Default quantity factors - Vehicles 27 Table 5-5 Default quantity factors – Plant and Equipment 28 Table 5-6 Default quantity factors – demolition and earthworks 31 Table 5-7 Default Quantity Factors - New Zealand Vegetation Carbon Dioxide Sequestration 35 Table 5-8 Default quantity factors – pavements 37 Table 5-9 Default quantity factors – road structures 40 Table 5-10 Default quantity factors – drainage 41 Table 5-11 Default quantity factors – road furniture 42 Table 5. -12 Information required to estimate the GHG emissions from construction of tunnels 44 Table 6-1 Emission sources to be included in GHG assessment of road operation 46 Table 6-2 Data required to estimate the GHG emissions associated with the operation of a road 49 Table 6-3 Electricity ratings for typical road lighting and signals 50 Table 6-4 Default quantity factors – street lights 51 Table 6-5 Default quantity factors – Traffic signals for typical interchanges (LED) 52 Table 7-1 Emission sources to be included in GHG assessment of maintenance 54 Table 7-2 Data required to estimate the road maintenance related GHG emissions 57 Table 7-3 Default quantity factors – Maintenance activities 59 Table 8-1 The scope of GHG emissions estimated by the calculator. 61

Greenhouse Gas Assessment Workbook for Road Projects
GREENHOUSE GAS ASSESSMENT WORKBOOK FOR ROAD PROJECTS V6.DOCX Page v
List of figures Page number
Figure 6.1 Operation GHG assessment boundary 47 Figure 7.1 Maintenance GHG assessment boundary 55
Appendices Appendix A Checklists Appendix B GHG emissions reporting templates Appendix C Conversion factors Appendix D Emission factors Appendix E Vegetation Emissions Methodology

Greenhouse Gas Assessment Workbook for Road Projects
Page vi GREENHOUSE GAS ASSESSMENT WORKBOOK FOR ROAD PROJECTS V6.DOCX
Glossary Activity An action that gives rise to an emission source and the release of greenhouse
gases.
Assessment boundary In the context of estimating GHG emissions for a road project, the assessment boundary is considered to be: all of the GHG emissions from operations/activities over which the designers, constructors and operators have control.
Boundary The boundary is an imaginary line around the emission sources and activities that are included in the GHG assessment. Emission sources and activities outside the boundary are excluded.
Carbon dioxide equivalent (CO2-e)
The mass of a greenhouse gas that is emitted is multiplied by its global warming potential to convert greenhouse gas emissions to an equivalent quantity of CO2 emissions, referred to as carbon dioxide equivalent. For simplicity of reporting, the mass of each greenhouse gas emitted is commonly translated into a carbon dioxide equivalent (CO2-e) amount so that the total impact from all sources can be summed to one figure
CFL Compact Fluorescent Lamp/Light
CH4 Methane, a greenhouse gas.
CO2 Carbon dioxide, a greenhouse gas.
Construction Construction is considered to be the time between obtaining development approvals and funding and handing over the asset to the relevant authority at the end of the defect liability period.
Conversion Factor A numerical value to enable conversion from one unit of measure to another (e.g. a density conversion factor is used to convert a volume of a material to a mass of a material or vice versa)
Default quantity factor (DQF)
Default quantity factors convert an indicator of activity into estimated activity data quantities, which can be used in greenhouse gas emission calculations.
Design Design is considered to be the time between conceiving the road project and obtaining development approvals and funding
Emission Refers to greenhouse gas emissions
Emission factor Emission factors convert an indicator of activity into estimated greenhouse gas emissions.
Emission source A source from which greenhouse gases are released
Facility A facility refers to the road project site
GHG Greenhouse gas
GHG Protocol The World Resource Institute and the World Business Council for Sustainable Development’s Greenhouse Gas Protocol: a corporate accounting and reporting standard
GJ Standard abbreviation for Giga-Joule. A unit of energy, equal to 1,000 MJ.
Global Warming Potential (GWP)
GWP is a measure of how much a given mass of a greenhouse gas is estimated to contribute to global warming. It is a relative scale that compares a gas with the same mass of carbon dioxide and is calculated over a specific time interval.
Greenfield Project A project that lacks any constraints imposed by prior work
Greenhouse gas assessment boundary
The GHG assessment boundary defines which emission sources and activities are included in the assessment and which are excluded.
Greenhouse gases Greenhouse gases are those gases which reduce the loss of heat from the earth's atmosphere by absorbing infrared radiation. Six greenhouse gases are regulated by the Kyoto Protocol: Carbon dioxide (CO2), Methane (CH4), Nitrous oxide (N2O), Hydrofluorocarbons (HFCs), Perfluorocarbons (PFCs) and Sulphur hexafluoride (SF6). The emissions of greenhouse gases are reported in carbon dioxide equivalents (see above).
GVM Gross Vehicle Mass
HFCs Hydrofluorocarbons, a group of greenhouse gases.
HPS High Pressure Sodium (lamps)

Greenhouse Gas Assessment Workbook for Road Projects
GREENHOUSE GAS ASSESSMENT WORKBOOK FOR ROAD PROJECTS V6.DOCX Page vii
km Standard abbreviation for kilometre. A unit of distance.
kW Standard abbreviation for kilowatt(s). A unit of power, equal to energy use at the rate of one kJ per second.
kWh Standard abbreviation for kilowatt hour. A unit of (normally electrical) energy, equal to power of 1 kW for 1 hour.
LED Light emitting diode (lamps)
m Standard abbreviation for metre. A unit of distance.
m2 Standard abbreviation for square metre. A unit of area.
m3 Standard abbreviation for cubic metre. A unit of volume.
Maintenance Maintenance is considered to be post construction and includes activities that are intermittently required to keep the road assets at the required standard. Maintenance can be major (i.e. rehabilitation), planned/routine or reactive.
Major activity Defined as design, construction, operation and maintenance
Materiality Materiality is a measure of the estimated effect that the presence or absence of an emission source or activity may have on the accuracy or validity of a greenhouse gas assessment.
MH Metal halide (lamps)
MJ Standard abbreviation for Mega-Joule(s).
N2O Nitrous oxide, a greenhouse gas.
No. Abbreviation for number
NZ New Zealand
Operation Operation is considered to be post construction and includes activities that are required on a continuous basis for the functioning of the road. This Workbook does not include road usage by vehicles in this definition.
Pavement The road surface and road base.
PFCs Perfluorocarbons, a group of greenhouse gases.
Post construction The period after road construction is completed.
Project scoping Development of the concept design and detailed business case. Tender documents would be issued at the completion of this phase if the project is to be delivered via a design and construct (D&C) contract.
Project development Development of preliminary and detailed design. Submission of tenders would occur at the completion of this phase if the project is to be delivered via a D&C contract.
Project delivery Project is awarded at the start of this phase if the project is to be delivered via a D&C contract. It includes construction of the road and project handover to the asset operator.
Proponent The entity that is proposing the road project. Usually the constructor or the operator of the road.
QH Quartz halogen (lamps)
Road furniture Road Furniture is a generic term for various road related assets that are intended to inform and protect the motorist, They include signs and markings, delineation devices, sign supports, signal poles and equipment, lighting poles, parking meters, various types of fencing and walls of different types and functions, all of which need to be safely accommodated within the roadside.
Road project life cycle The life cycle considered in the Workbook is limited to the major activities of: design, construction, operation and maintenance
Road structures Includes structures that may be included in a road project (e.g. bridge, tunnel, reinforced soil walls etc.)
Scope 1 emissions Emissions released into the atmosphere as a direct result of an activity, or series of activities (including ancillary activities) that constitutes the facility.
Scope 2 emissions Emissions released as a result of one or more activities that generate electricity, heating, cooling or steam that is consumed by the facility but that do no form part of the facility.

Greenhouse Gas Assessment Workbook for Road Projects
Page viii GREENHOUSE GAS ASSESSMENT WORKBOOK FOR ROAD PROJECTS V6.DOCX
Scope 3 emissions Emissions that occur outside the site boundary of a facility as a result of activities at a facility that are not Scope 2 emissions.
SF6 Sulfur hexafluoride, a greenhouse gas
Supporting Document The document that provides additional information considered in the development of the Greenhouse Gas Assessment Workbook for Road Projects
Surface roads Roads that only require pavement
t CO2-e Standard measurement unit for greenhouse gas emissions. Tonnes of carbon dioxide equivalents
TAGG Transport Authorities Greenhouse Group
UNFCCC United Nations Framework Convention on Climate Change
UOM Unit of measurement
W Standard abbreviation for Watt(s). A unit of power, equal to energy use at the rate of one J per second.
Workbook This document, the Greenhouse Gas Assessment Workbook for Road Projects
Below is a list of TAGG members who were involved in the development of this Workbook. Should you have any queries regarding the methodology presented in the Workbook or to provide your comments on the Workbook and/or Supporting Document they provide a point of contact.
This workbook is intended to be updated periodically as improved information becomes available. Section 7 of the Supporting Document for further details on what will drive the update and be taken into account in the updating of this workbook.
Name Agency Email Address
Vanessa Browne NZTA, NZ [email protected]
Anne Welsh, Andrew Larwood DPTI, SA [email protected]
Con Lambous RMS, NSW [email protected]
Louis Bettini Main Roads, WA [email protected]
Dick Shaw DIER, Tas [email protected]
Simon Renton VicRoads, Vic [email protected]

Greenhouse Gas Assessment Workbook for Road Projects
GREENHOUSE GAS ASSESSMENT WORKBOOK FOR ROAD PROJECTS V6.DOCX Page 1
1. Introduction Road traffic and transport authorities in Australian and New Zealand are committed to minimising greenhouse gas (GHG) emissions. To support this commitment, Australian state road authorities and NZ Transport Agency have formed a Transport Authorities Greenhouse Group (TAGG) to share information regarding estimating, reporting and minimising GHG emissions. The TAGG recognises that there needs to be a common approach to estimating the GHG emissions from road projects and as a result, it has developed this Workbook to provide road designers, builders, managers and operators a means of consistently estimating GHG emissions at the key stages of construction, operation and maintenance.
In developing the Workbook a ‘whole of life’ approach was taken and all major activities in the life cycle, from design through to operation and maintenance, were considered. Decommissioning of roads was excluded from the Workbook as this rarely occurs.
The Workbook outlines a process for estimating the GHG emissions for all of the major activities that were found to contribute significantly to the overall emissions arising from a road project. The operation of road infrastructure includes operation of lights, signals and ventilation systems. The maintenance of the infrastructure comprises activities which are categorised as reactive, planned/routine and/or major maintenance.
In addition to providing the means to estimate GHG emissions the Workbook will provide a better understanding of how GHG emissions can be reduced. The Workbook will also enable benchmarking and comparisons of projects (or options) on a consistent basis. Carbon Gauge is a tool referenced within this methodology,which has been developed to enable a comparison based on estimation with default quantity factors.
In considering the various purposes a Workbook such as this could be used for, the TAGG decided it would not include a process for estimating GHG emissions associated with road usage as each transport authority has its own preferred processes and traffic modelling techniques to estimate these emissions.
The TAGG methodology has been reviewed a number of times since its initial release and the road industry feedback has been positive. Some constructive recommendations for improvement have been provided and where possible these have been included in the current methodology. The Australian Road Research Board (ARRB) has also recommended in their 2012 Field Validation of Warm Mix Pavements report that the TAGG methodology be adopted as the national standard for greenhouse estimation in road construction.
Note: This Workbook is designed to enable a consistent methodology for the assessment of significant emission sources and estimation of greenhouse gas emissions. As such it deliberately does not cover activities and emission sources assessed as insignificant, and it is not designed for compliance reporting.
1.1 Overview of workbook
The Workbook includes the following sections:

Greenhouse Gas Assessment Workbook for Road Projects
Page 2 GREENHOUSE GAS ASSESSMENT WORKBOOK FOR ROAD PROJECTS V6.DOCX
n Chapter 1: Introduces the Workbook and the reasons for its development
n Chapter 2: Provides background information on GHG assessments, including the types of GHG emissions considered in this Workbook, the GHG assessment boundary and an explanation of GHG emission “scopes”
n Chapter 3: Outlines the process for estimating the GHG emissions for a road project
n Chapters 4-7: Provides the methodology and information required to estimate the GHG emissions associated with each life cycle major activity. The chapters are arranged in modules as follows:
4 Chapter 4: Module 1 – Design
4 Chapter 5: Module 2 – Construction
4 Chapter 6: Module 3 – Operation (not including traffic usage)
4 Chapter 7: Module 4 – Maintenance
Each Module includes a description of the significant emission sources in the relevant GHG assessment boundary, the activity data required for an assessment and default quantity factors.
n Appendices: Provide emission factors, conversion factors, checklists and supporting information
The Workbook is complimented by the Supporting Document for Greenhouse Gas Assessment Workbook for Road Projects (the Supporting Document). The Supporting Document provides information that relates to the development of the Workbook.

Greenhouse Gas Assessment Workbook for Road Projects
GREENHOUSE GAS ASSESSMENT WORKBOOK FOR ROAD PROJECTS V6.DOCX Page 3
2. 2Greenhouse gas assessments – background information
2.1 Greenhouse gases
Greenhouse gas emissions refer to the release of greenhouse gases (GHG) into the atmosphere. The Kyoto Protocol of the United Nations Framework Convention on Climate Change (UNFCCC) has limited the number of GHGs that are reportable. These are:
n Carbon dioxide (CO2)
n Methane (CH4)
n Nitrous oxide (N2O)
n Sulfur hexafluoride (SF6)
n Hydrofluorocarbons (HFCs)
n Perfluorocarbons (PFCs).
Whilst the Workbook methodology does include all of the Kyoto GHG, road projects will typically only result in emissions of carbon dioxide. Depending on the activities undertaken, there may also be emissions of methane, nitrous oxide and hydrofluorocarbons.
2.2 Carbon dioxide equivalence and global warming potential
Emissions estimated using this Workbook are in carbon dioxide equivalents.
Carbon dioxide equivalence, or CO2-e, is estimated by multiplying the amount of a GHG by its global warming potential (GWP). The GWP is a measure of how much a given mass of a GHG is estimated to contribute to global warming. It is a relative scale that compares the warming potential of a gas with the same mass of carbon dioxide.
Emission factors for all GHG emissions deemed typical for road projects have been provided in carbon dioxide equivalents. Any changes to the current estimate of the GWP of a particular GHG will be taken into account when updating this Workbook and the emission factors provided within. Emission factors used to estimate GHG emissions from road projects are provided in Appendix D.
2.3 Greenhouse gas assessment boundary
Prior to undertaking a GHG assessment the ‘boundary’ of the assessment must be defined. The boundary defines which emission sources and activities are included in the assessment and which are excluded.
An activity is any action that gives rise to a source of GHG emissions (e.g. construction of road pavement). An emission source is a cause of GHG emissions

Greenhouse Gas Assessment Workbook for Road Projects
Page 4 GREENHOUSE GAS ASSESSMENT WORKBOOK FOR ROAD PROJECTS V6.DOCX
(e.g. combustion of fuel in a vehicle). It is possible that one activity can result in several emission sources.
In the context of estimating GHG emissions for a road project, the assessment boundary is considered to include all of the emission sources that can be impacted by decisions made by designers, constructors, managers and/or operators of the road. That is, where a decision can be made that impacts the GHG emissions of a road project, then that emission source is considered to be within the GHG assessment boundary.
For example, a proponent (constructor or operator) can select either virgin materials or material with recycled content, and there will be a different GHG emissions profile depending on which material is chosen. Material selection is therefore considered under the influence of the proponent and the usage of materials is therefore included within the GHG assessment boundary.
Sections 5.1, 6.1 and 7.1 summarise the construction, operation and maintenance GHG assessment boundaries, including all the significant activities and emission sources. A comprehensive discussion of the construction, operation and maintenance GHG assessment boundaries for road projects is presented in Section 3.3 of the Supporting Document.
2.3.1 Emission scopes
To ensure consistency across multiple assessments, GHG emissions sources are usually categorised into various ‘scopes’. The most common definition of these scopes are presented below.
2.3.1.1 Scope 1 emissions
Direct GHG emissions are those that are produced by activities that are controlled by the proponent.
Road project examples include:
n The combustion of diesel fuel in an item of plant used in the construction or maintenance of a road
n The combustion of diesel fuel in a generator to produce electricity for use on site
n The combustion of petrol (gasoline) in site vehicles
n Clearing of vegetation (lost carbon sink)
n A diesel powered concrete batching plant.
2.3.1.2 Scope 2 emissions
Indirect GHG emissions are a result of activities associated with the road project, across its ‘whole of life’, that are not controlled by the proponent. Scope 2 emissions are indirect GHG emissions from the consumption of electricity, heating, cooling or steam that is produced offsite.
Road project examples include:

Greenhouse Gas Assessment Workbook for Road Projects
GREENHOUSE GAS ASSESSMENT WORKBOOK FOR ROAD PROJECTS V6.DOCX Page 5
n The consumption of electricity by street lights and traffic lights during the operation of the road
n The consumption of electricity by site offices
2.3.1.3 Scope 3 emissions
Indirect GHG emissions are a result of activities associated with the project, across its ‘whole of life’, that are not controlled by the proponent. Scope 3 emissions are all indirect GHG emissions that are not Scope 2 emissions.
Embodied emissions are all the emissions created over the entire lifecycle of a material from creation to disposal, but not including direct emissions from usage. Embodied emissions are therefore Scope 3 emissions.
Road project examples include:
n The offsite mining and production of quarry products used in the construction or maintenance of a road
n The offsite mining and production of materials (e.g. concrete, asphalt, steel) used in the construction or maintenance of a road
n Emissions from the extraction, production and transport of fuel burned at electricity generators and the emissions attributable to the electricity lost in delivery in the transmission and distribution network
n The breakdown of waste disposed of to a landfill
n Emissions from the combustion of fuel when transporting materials
n The embodied emissions of materials used to manufacture equipment utilised in the construction or maintenance of a road (e.g. tunnel boring machines).
Note: Whilst the transport of materials to site and unloading materials will result in a proportion of these emissions occurring onsite (i.e. a direct or Scope 1 emission) the majority of the emissions relating to the transport of materials occur offsite. To minimise the risk of double counting and simplify data collection the emissions associated with the transport of materials are classified as 100% Scope 3 emissions.
Emissions from traffic using a road post construction are Scope 3 emissions. However, these emissions are not included in the scope of this Workbook. In order to gain a complete view of the GHG emissions associated with a road project, appropriate data and calculation models should be used to estimate the road usage GHG emissions, which should be added to the total GHG emissions estimated using the Workbook. This will provide the total GHG emissions associated with a road’s construction, operation, maintenance and the vehicles that will use the road..
All Scope 1 and Scope 2 emissions are included within the GHG assessment boundary. The following Scope 3 emissions have also been included.
n Extraction, production and transport of purchased fuels used by a road project

Greenhouse Gas Assessment Workbook for Road Projects
Page 6 GREENHOUSE GAS ASSESSMENT WORKBOOK FOR ROAD PROJECTS V6.DOCX
n Mining, production and transport of purchased materials or goods used by a road project
n Disposal of waste generated in the production of purchased fuels, materials and goods associated with a road project
n Transport of project employees (including flights)
n Disposal of waste generated by the project.
Inclusion of each Scope 3 emission source is based on a materiality assessment, which is discussed in Section 2.3.2 of this Workbook, as well as an emission sources contribution to the project’s GHG risk exposure, its ability to be reduced and its importance to key stakeholders.
2.3.2 Materiality and revising the activities to be assessed
The GHG assessment boundary defines the emission sources which will be considered when undertaking a GHG assessment of a road project. However, some emission sources will contribute a very small amount to a project’s GHG emissions whilst others will contribute a large proportion of the total. Collecting data for emission sources can be time consuming and as the purpose of the Workbook is only to estimate GHG emissions for road projects it is therefore reasonable to omit insignificant emission sources from a GHG assessment. Emission sources are omitted based on their ‘materiality’. Materiality refers to the importance/significance of an emission and provides a threshold or cut-off point which emission source must reach if it is to have an impact on the overall GHG assessment.
If a particular emission source contributes less than 5% of the total GHG emissions of a major activity (i.e. construction, operation, maintenance), it has been considered to be not significant and subsequently has been excluded from the assessment boundary for that major activity. Similarly, design has been excluded from the assessment as it only generates a small quantity of the GHG emissions associated with the road projects life cycle (refer to Section 4).
In some instances an emission source may be significant on one project but not another – depending on the type of road project and its location. A materiality checklist is provided in Appendix A to assist in determining whether an emission source should be included within the assessment boundary.
NOTE: The assessment of materiality used to develop this Workbook has been based on ‘typical’ road projects using typical construction, operation and maintenance processes. If a project uses a process or material that is not considered ‘typical’ then certain activities or emission sources or materials that have been excluded from an assessment should be included.
For example: if a new, ‘non-typical’ material was used in the construction of a road (e.g. plastic pipe was used rather than concrete pipe) then the emissions associated with the production of the plastic pipe should be included in the assessment (GHG emissions to be estimated in the same way as for other materials) even though the use of plastic is not considered significant for a ‘typical’ road project.

Greenhouse Gas Assessment Workbook for Road Projects
GREENHOUSE GAS ASSESSMENT WORKBOOK FOR ROAD PROJECTS V6.DOCX Page 7
3. Estimating the ‘whole of life’ greenhouse gas emissions for a road project
3.1 When can I do an assessment?
Although this Workbook focuses on the GHG emissions from the construction, operation and maintenance of a road, the estimation of these emissions can be conducted at any time. Obviously as the project moves from concept through detailed design to construction more accurate information will become available for items such as material type and quantity and hence the accuracy of GHG emissions estimates will improve.
Decisions made in the early scoping or concept design stages of a project can greatly impact on the GHG emissions from the construction, operation and maintenance of a road. It is strongly recommended that an assessment is made during the design stage in order to understand the greenhouse implications of different options or materials to minimise emissions, and to aid in decision making.
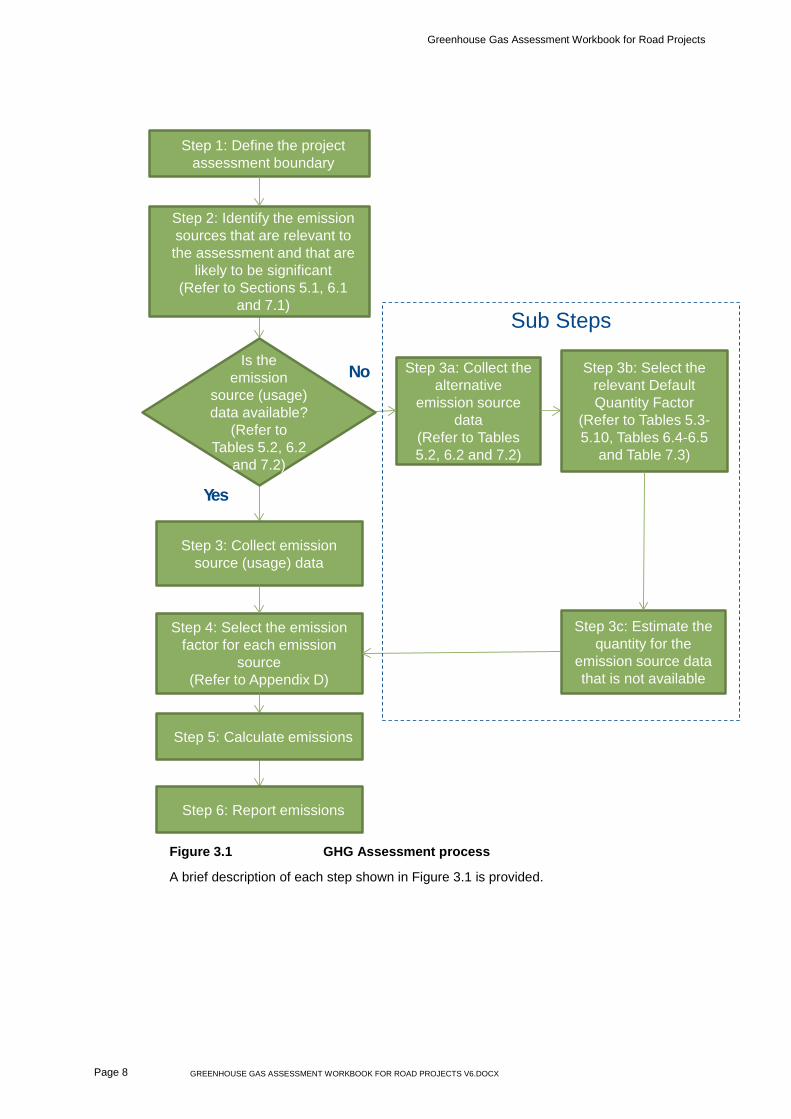
3.2 How do I undertake a GHG assessment?
Figure 3.1 below shows the major steps in the GHG assessment process for road projects. These steps should be applied to the construction, operation and maintenance major activities. The estimated GHG emissions for each major activity are then added together, to obtain the total GHG emissions associated with the road project.
These steps have been automated in an Excel based tool called Carbon Gauge, which is available from the Australian Road Agencies. Carbon Gauge is described in Section 8.
Greenhouse Gas Assessment Workbook for Road Projects
Page 8 GREENHOUSE GAS ASSESSMENT WORKBOOK FOR ROAD PROJECTS V6.DOCX
Step 4: Select the emission factor for each emission
source (Refer to Appendix D)
Step 3c: Estimate the quantity for the
emission source data that is not available
Step 3b: Select the relevant Default Quantity Factor
(Refer to Tables 5.3-5.10, Tables 6.4-6.5
and Table 7.3)
Step 3a: Collect the alternative
emission source data
(Refer to Tables 5.2, 6.2 and 7.2)
No
Yes
Step 2: Identify the emission sources that are relevant to the assessment and that are
likely to be significant (Refer to Sections 5.1, 6.1
and 7.1)
Is the emission
source (usage) data available?
(Refer to Tables 5.2, 6.2
and 7.2)
Step 5: Calculate emissions
Step 6: Report emissions
Step 1: Define the project assessment boundary
Step 3: Collect emission source (usage) data
Sub Steps
Figure 3.1 GHG Assessment process
A brief description of each step shown in Figure 3.1 is provided.

Greenhouse Gas Assessment Workbook for Road Projects
GREENHOUSE GAS ASSESSMENT WORKBOOK FOR ROAD PROJECTS V6.DOCX Page 9
STEP 1: Identify the project assessment boundary referring to the physical boundary of the project and Figures 5.1, 6.1 and 7.1 from the Workbook.
Identify the activities shown within the construction, operation and maintenance GHG assessment boundaries that will be occurring over the life cycle of the road project. Activities that are not undertaken can be excluded from your assessment.
STEP 2 Identify the emission sources associated with each activity undertaken within the project boundary.
Use the materiality checklist in Appendix A and tables 5.1, 6.1 and 7.1 to determine which emission sources should be included in the assessment and which emissions sources can be eliminate from the GHG assessment boundary.
Emission sources that are not significant on your project can be excluded from your assessment
STEP 3 Collect the usage data for each emission source. Refer to Tables 5.2, 6.2 and 7.2.
Record the usage data and the location of the data in the Emission Sources and Data checklist in Appendix A.
It may not be possible to obtain all of the required emission source data to complete the GHG calculations. If this is the case the alternative emission source data and default quantity factors should be used to estimate the activity data.
STEP 3a: Collect the alternative emission source data where usage data is not available. Refer to Tables 5.2, 6.2 and 7.2.
Record the alternative emission source data and the location of the data in the Emission Sources and Data checklist in Appendix A
STEP 3b: Select the appropriate default quantity factor for each emission source where alternative emission source data is being used. Refer to Tables 5.3-5.10, 6.4-6.5 and 7.3.
Record the default quantity factors in the Emission Sources and Data checklist in Appendix A
STEP 3c: Calculate the quantity (the emission source data) using the following formula:
Quantityi = Alternative Emission Source Datai x Default Quantity Factori

Greenhouse Gas Assessment Workbook for Road Projects
Page 10 GREENHOUSE GAS ASSESSMENT WORKBOOK FOR ROAD PROJECTS V6.DOCX
STEP 4: Select the appropriate emission factors for each emission source from Appendix D.
STEP 5: Calculate the GHG emissions for each emission source using the following formula
GHG emissionsi = Quantityi x EFi
Where:
n GHG emissionsi is the GHG emissions released from the emission source (i), measured in t CO2-e
4 e.g. GHG emissions released from the combustion of liquid diesel fuel
n Quantityi is the quantity of the emission source data, measured in the units of measure (UOM) outlined in the ‘Emission Source Data Required’ column of Table 5.2, 6.2 or 7.2 or as estimated using a default quantity factor (Refer to Step 3a-3c above)
4 e.g. quantity of liquid diesel fuel combusted, measured in kL
n EFi is the emission factor for each fuel/material used or waste generated, measured in t CO2-e/UOM
4 Where an emission factor has more than one scope of emissions (e.g. combustion of fuel is a Scope 1 and a Scope 3 emission source) then all scopes of emissions should be included in the assessment.
Total (sum) the emissions for each emission source to determine the total GHG emissions associated with the road project.
If required for reporting purposes, estimate the uncertainty of the emissions calculated using the following as a guide:
n GHG emissions calculated using actual emission source data: ± 5% of estimated emissions
n GHG emissions calculated using estimated emission source data: ± 10 % of estimated emissions
n GHG emissions calculated using alternative emission source data and default quantity factors: ± 30 % of estimated emissions
Refer to Section 2.2.1 of the Supporting Document for a discussion on the accuracy of the emission estimates.
Greenhouse Gas Assessment Workbook for Road Projects
GREENHOUSE GAS ASSESSMENT WORKBOOK FOR ROAD PROJECTS V6.DOCX Page 11
STEP 6:
Report the GHG assessment as required by the local road authority.
A GHG assessment report should include:
n A description of the project and the project assessment boundary
n The activities and emission sources included in the GHG assessment and any exclusions and the reason for the exclusion
n Total GHG emissions for each major activity (construction, operation, maintenance)
n GHG emissions for each emission source
n A breakdown of the GHG emissions by Scope 1, 2 and 3 emissions
n The uncertainty of the GHG emissions estimate and information on the quality of the data and any assumptions
n The report may also include an outline of any GHG reduction programs, a comparison of performance (e.g. performance against internal or external benchmarks) and a contact person.
Refer to Appendix B for a Project GHG Emissions Report Template
3.3 Benchmarking
The ability to benchmark projects is a key objective of this Workbook. Which projects are benchmarked is to be determined by each road authority.
NOTE: Generally, the most relevant activity measure for a road project is m2 of pavement. Using this parameter consistently enables projects to be compared in terms of t CO2-e/m2.
In order to enable meaningful benchmarking of road projects the following information should be recorded for each project (refer to Appendix B for a Project GHG Emissions Report Template):
n Description of the project
4 Project title
4 Project location and whether project is in an urban or rural area
4 Description of works (e.g. greenfield/brownfield, new road/road widening/duplication, road upgrade, intersection upgrade etc.)

Greenhouse Gas Assessment Workbook for Road Projects
Page 12 GREENHOUSE GAS ASSESSMENT WORKBOOK FOR ROAD PROJECTS V6.DOCX
n Value of road project ($m) and duration of the project (years)
n Pavement type and road length (km) and width (m)
n Vegetation removed (ha)
n Quantity of earthworks (e.g. volume of cut or fill [m3])
n Whether ground stabilisation is required
n Number and type of structures (e.g. bridges, interchanges)
n Number and length of tunnels.
Greenhouse Gas Assessment Workbook for Road Projects
GREENHOUSE GAS ASSESSMENT WORKBOOK FOR ROAD PROJECTS V6.DOCX Page 13
4. Module 1 – Design Design is considered to be the time between conceiving the road project and obtaining development approvals and funding or the issuing of construction drawings.
Decisions made in the early scoping or concept design stages of a project can greatly impact on the GHG emissions from the construction, operation and maintenance of a road. It is strongly recommended that an assessment(s) is made during the design stage(s) in order to understand how GHG emissions may be minimised and to aid in decision making.
Whilst the design of a road can greatly impact on its emissions the actual GHG emissions associated with design activities are likely to be very small and are therefore generally considered not significant. GHG emissions associated with design activities can generally be excluded from a GHG assessment of a road project
4.1 Exception – air travel
If an unusually large amount of air travel (e.g. > 100 overseas trips or > 1,500,000 km of flight), is undertaken during the design stage of a road project due to the proponent’s staff going on study tours or the designer flying in expertise from overseas or interstate, then these emissions should be included in the assessment.
In this instance the distance travelled in km and the relevant emission factor for airline travel taken from Appendix D, Table D.8 should be used.

Greenhouse Gas Assessment Workbook for Road Projects
Page 14 GREENHOUSE GAS ASSESSMENT WORKBOOK FOR ROAD PROJECTS V6.DOCX
5. Module 2 – Construction Construction is considered to be the time between obtaining development approvals and funding and handing over the asset to the relevant authority at the end of the defect liability period.
5.1 Construction GHG assessment boundary
Table 5-1 shows the activities and Scope 1, 2 and 3 emission sources found to be significant for construction of a road (refer to Section 4.1 of the Supporting Document for further details of the materiality assessment for construction). All of the activities and emission sources considered within the construction GHG assessment boundary are shown in Figure 3.1 of the Supporting Document.
NOTE 5.1: Items in Table 5-1 in black are considered significant in ‘typical’ road projects and should be included in a GHG assessment.
Those in orange might be significant – Refer to the Materiality Checklist in Appendix A for guidance on when these emission sources should be included in your GHG assessment.
Activities/emission sources shown on Figure 5.1 with a dashed outline are those that may be significant for some road projects but insignificant for others.
NOTE 5.2: Whilst the clearing of vegetation (which is a carbon sink) is not a true GHG emission the net impact is that less carbon dioxide is being removed from the atmosphere and the net effect is that an equivalent amount of carbon dioxide will remain as a result. Hence, clearing of vegetation is considered as a Scope 1 emission source in this Workbook. However, any offsets from revegetation are not currently considered viable due to the implementation costs. This will continue to be reviewed as requirements evolve.
The disposal of vegetation will result in GHG emissions, in addition to those related to the loss of a carbon sink. Where vegetation is reused or left to decompose naturally on site, the rate at which GHGs are emitted is very slow and considered negligible. However, if vegetation is disposed of to landfill or combusted the rate is much higher and these emissions should be included in your assessment.
NOTE 5.3: Where the GHG emissions relating to concrete are calculated based on the usage of individual concrete ingredients (cement, sand, water etc.) rather than on the usage of concrete, the GHG emissions relating to the usage of sand and water should be included in the GHG assessment. Sand and water can otherwise be excluded from a GHG assessment, as factors for concrete are inclusive of the constituents.

Greenhouse Gas Assessment Workbook for Road Projects
GREENHOUSE GAS ASSESSMENT WORKBOOK FOR ROAD PROJECTS V6.DOCX Page 15
Table 5-1 Emission sources to be included in GHG assessment of construction
Scope 1 Scope 2 Scope 3
Site vehicles and plant
Combustion of fuels in site vehicles
Production and distribution of fuels used in site vehicles
Combustion of fuels in general site plant and equipment (e.g. diesel water pumps)
Production and distribution of fuels used in general site plant and equipment (e.g. diesel water pumps)
Site Offices
Combustion of fuels in diesel generators
Production and distribution of fuels used in diesel generators
Demolition and Earthworks
Combustion of fuels in plant and equipment
Production and distribution of fuels used in plant and equipment
Vegetation removed (lost carbon sink) (see Note 5.2 above)
Offsite decomposition of cleared vegetation in landfill (see Note 5.2 above) Transport of cleared vegetation from site to end use/landfill
Electricity consumption by plant and equipment
Generation and distribution of electricity consumed by plant and equipment
Pavement, Structures, Drainage and Road Furniture
Combustion of fuels in plant and equipment including on-site batch plants
Production and distribution of fuels used in plant and equipment
Production of materials:
n Concrete
n Asphalt
n Cement
n Aggregate
n Steel
n Hot mix asphalt processing energy
n Bitumen
n Sand (see Note 5.3 above)
n Water (see Note 5.3 above)
n Lime
n Imported fill
Transport of materials from production gate to site

Greenhouse Gas Assessment Workbook for Road Projects
GREENHOUSE GAS ASSESSMENT WORKBOOK FOR ROAD PROJECTS V6.DOCX Page 16
ConstructionAssessment boundary
Note: A dashed outline indicates that the emission source/activity is not material for all road projects
Site Offices/ General Areas
Vegetation Removal (lost carbon sink) and Land
Clearing Equipment Emissions (Note 5.2)
Waste Treatment
Demolition and
Earthworks
On Site Fuel Use in Plant & Equipment
Off Site Decomposition of Vegetation in landfill
(Note 5.2)Transport of Vegetation
off site
Fuel Production and Distribution
Construction:Pavement,Structures, Drainage,
Road Furniture
Transport of ConstructionMaterials
Production of Construction Materials
AggregateAsphaltBitumenCement
ConcreteHot mix asphalt processing
energySteel
Sand (Note 3)Water (Note 3)
On Site Fuel for Plants and Equipment
Fuel Production and Distribution
Scope 1 Scope 2 Scope 3
Fuel Production and Distribution
On Site Fuel Use for Electricity Generation
Fuel Extraction for Electricity Generation and Electricity Transmission/
Distribution
On Site ElectricityConsumption by Plant &
Equipment
On Site Fuel for Site Vehicles
On Site Decomposition of Vegetation (Note 5.2)
Production of Excavation/ Tunnelling
Activity
Production of Construction Materials
LimeImported Fill
Transport of ConstructionMaterials
Figure 5.1 Construction GHG assessment boundary

Greenhouse Gas Assessment Workbook for Road Projects
GREENHOUSE GAS ASSESSMENT WORKBOOK FOR ROAD PROJECTS
V6.DOCX Page 17
5.1.1 Alternative processes or materials
The assessment of materiality undertaken in the development of this Workbook has been based on deemed typical road projects using deemed typical construction, operation and maintenance processes and materials. If a project uses an alternative process or material that is not ‘typical’ then the impact of that change should be captured in the GHG assessment by including the alternative emission source in the GHG assessment, using the process for similar emission sources. This is of particular importance if the project is looking to use ‘low emission’ materials in place of traditional materials.
For example, plastic is not typically used in the construction of roads in quantities sufficient to be considered significant and is therefore excluded from the list of materials to be included in a GHG assessment. However, if plastic pipe is used instead of concrete pipe for drainage then the emissions generated in making the plastic pipe should be included in the GHG assessment.
Should a road project result in a ‘non-typical’ GHG emission then guidance on accounting for these emissions should initially be sought by referring to:
· In Australia, the National Greenhouse Accounts (NGA) Factors Workbook (http://www.climatechange.gov.au/publications/greenhouse-acctg/national-greenhouse-factors.aspx)
· In New Zealand, the Guidance for Voluntary, Corporate Greenhouse Gas Reporting should be used. (http://www.mfe.govt.nz/publications/climate/guidance-greenhouse-gas-reporting-sept09/index.html)
Other sources of information, particularly those related to embodied emissions of materials not covered in this workbook (Scope 3 emissions) may be used but must be referenced when reporting. It is preferable that independent and/or third party verified sources are referenced.
5.2 Construction emission sources and required data
Table 5-2 presents all of the activities and emission sources within the construction GHG assessment boundary that are considered significant based on the materiality assessment (discussed in Section 4.2 of the Supporting Document). The data required for each emission source is also listed in Table 5-2.
Where the emission source (usage) data is not available (e.g. in the project scoping phase) the alternative emission source data and the associated default quantity factor(s) (refer to Section 5.3 below) may be used to estimate the emission source (usage) data.
NOTE: Items in Table 5-2 in black are considered significant in all ‘typical’ road projects and should be included in a GHG assessment whilst those in orange might be significant – Refer to the Materiality Checklist in Appendix A for guidance on when these emission sources should be included in a GHG assessment.

Greenhouse Gas Assessment Workbook for Road Projects
GREENHOUSE GAS ASSESSMENT WORKBOOK FOR ROAD PROJECTS V6.DOCX Page 18
Table 5-2 Data required to estimate GHG emissions from road construction
Activity Emission source Emission Source Data Required Alternative Emission Source Data Required
Site offices Refer to Table 5.3
Site offices Liquid fuel combustion – electricity generation (e.g. diesel generator)
Fuel type AND kL of fuel, for each fuel type
Fuel type AND construction period in months
Site vehicles and plant Refer to Tables 5.3, 5.4 and 5.5
Site vehicles Liquid fuel combustion – site and staff vehicles
Fuel type AND kL of fuel, for each fuel type
Fuel type AND Size of project in dollar value AND construction period in months OR Fuel type AND vehicle type AND distance travelled in km
Site plant and equipment
Liquid fuel combustion – site plant and equipment
Fuel type AND kL of fuel, for each fuel type
Fuel type AND type and size of plant AND construction period in months
Demolition and earthworks (including vegetation removal) Refer to Tables 5.6 and 5.7
Demolition Liquid fuel combustion – demolition equipment
Fuel type AND kL of fuel, for each fuel type
Number and type of buildings to be removed OR Equipment type(s) AND number of months operated AND load on equipment
Vegetation removal
Liquid fuel combustion – vegetation removal equipment e.g. graders, front end loaders
Fuel type AND kL of fuel, for each fuel type
Biomass class of vegetation removed (Refer to Table 5-6, Australian methodology) AND Area of vegetation removed in hectares OR Type of vegetation removed (Refer to Table 5-6, New Zealand methodology) AND Area of vegetation removed in hectares OR Equipment type(s) AND number of months operated AND load on equipment
Lost carbon sink from the removal of vegetation (Australian methodology)
Biomass class AND vegetation classes AND area in hectares of vegetation removed, for each vegetation class
Location AND Area of vegetation removed in hectares for each vegetation class (refer to Section 5.3.3.1 )
Lost carbon sink from the removal of vegetation (New Zealand methodology)
Vegetation type AND area of vegetation removed AND mm of rainfall
Location AND Annual rainfall in mm AND Area of vegetation removed in hectares (refer to Section 5.3.3.1 )
Greenhouse Gas Assessment Workbook for Road Projects
GREENHOUSE GAS ASSESSMENT WORKBOOK FOR ROAD PROJECTS V6.DOCX Page 19
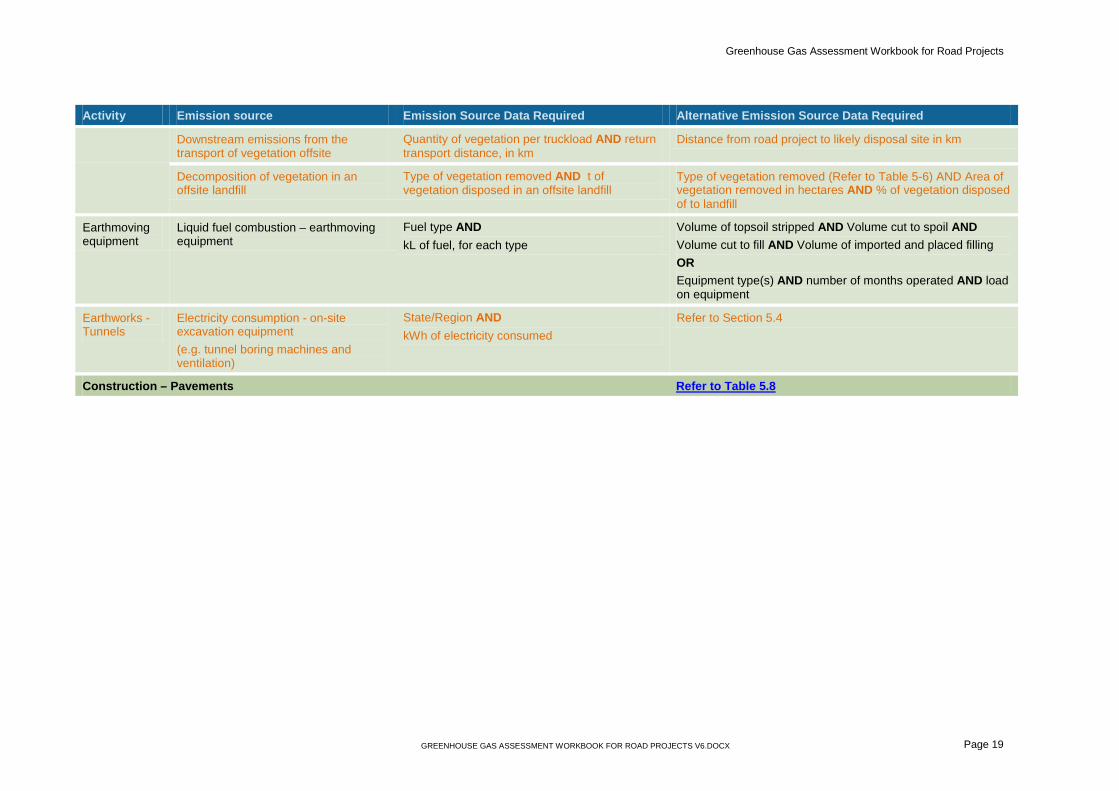
Activity Emission source Emission Source Data Required Alternative Emission Source Data Required
Downstream emissions from the transport of vegetation offsite
Quantity of vegetation per truckload AND return transport distance, in km
Distance from road project to likely disposal site in km
Decomposition of vegetation in an offsite landfill
Type of vegetation removed AND t of vegetation disposed in an offsite landfill
Type of vegetation removed (Refer to Table 5-6) AND Area of vegetation removed in hectares AND % of vegetation disposed of to landfill
Earthmoving equipment
Liquid fuel combustion – earthmoving equipment
Fuel type AND kL of fuel, for each type
Volume of topsoil stripped AND Volume cut to spoil AND Volume cut to fill AND Volume of imported and placed filling OR Equipment type(s) AND number of months operated AND load on equipment
Earthworks - Tunnels
Electricity consumption - on-site excavation equipment (e.g. tunnel boring machines and ventilation)
State/Region AND kWh of electricity consumed
Refer to Section 5.4
Construction – Pavements Refer to Table 5.8

Greenhouse Gas Assessment Workbook for Road Projects
GREENHOUSE GAS ASSESSMENT WORKBOOK FOR ROAD PROJECTS V6.DOCX Page 20
Activity Emission source Emission Source Data Required Alternative Emission Source Data Required
Road Pavements
Liquid fuel combustion – pavement construction equipment Upstream emissions from the production of road construction materials Upstream emissions from the transport of road construction materials
Fuel type AND kL of fuel, for each fuel type AND Concrete type(s) AND t concrete used OR cement type(s) AND t cement used, Steel type(s) AND t steel used, t aggregate used, t sand used, t fly ash used and t water used in making concrete AND Asphalt type(s) AND t asphalt used OR bitumen type(s) AND t bitumen used, t aggregate used and asphalt processing energy used in making asphalt AND Additional Bitumen type(s) AND t bitumen used AND Additional Aggregate type(s) AND t aggregate used AND Lime type(s) AND t lime used AND Quantity of material per truckload AND return transport distance, in km
Equipment type(s) AND number of months operated AND load on equipment OR Pavement type (Refer to Table 5-8) AND pavement area in m2
Pavement type (Refer to Table 5-8) AND pavement area in m2
AND distance from road project to likely source of material in km
Sealing Liquid fuel combustion – pavement sealing equipment Upstream emissions from the production of road sealing materials Upstream emissions from the transport of road sealing materials
Fuel type AND kL of fuel, for each type AND Asphalt type(s) AND t asphalt used OR bitumen type(s) AND t bitumen used, t aggregate used and asphalt processing energy used in making asphalt AND Quantity of material per truckload AND return transport distance, in km
Equipment type(s) AND number of months operated AND load on equipment OR Sealing type AND sealing area in m2 Sealing type AND sealing area in m2 AND distance from road project to likely source of material in km

Greenhouse Gas Assessment Workbook for Road Projects
GREENHOUSE GAS ASSESSMENT WORKBOOK FOR ROAD PROJECTS V6.DOCX Page 21
Activity Emission source Emission Source Data Required Alternative Emission Source Data Required
Other pavements (e.g. median and traffic islands, footpaths etc.)
Liquid fuel combustion – other pavement construction equipment Upstream emissions from the production of other pavement construction materials Upstream emissions from the transport of other pavement materials
Fuel type AND kL of fuel, for each type AND Concrete type(s) AND t concrete used OR cement type(s) AND t cement used, Steel type(s) AND t steel used, t aggregate used, t sand used, t fly ash used and t water used in making concrete AND Asphalt type(s) AND t asphalt used OR bitumen type(s) AND t bitumen used, t aggregate used and asphalt processing energy used in making asphalt AND Quantity of material per truckload AND return transport distance, in km
Equipment type(s) AND number of months operated AND load on equipment OR Other pavement type (Refer to Table 5-8) AND pavement area in m2 Other pavement type (Refer to Table 5-8)AND pavement area in m2 AND distance from road project to likely source of material in km
Stationary Plant and equipment
Liquid fuel combustion – stationary engines (e.g. batching plants, dewatering pumps)
Fuel type AND kL of fuel, for each fuel type
Fuel type AND Construction period in months (Refer to Table 5.5)
Construction – Structures Refer to Table 5.9
Bridges (including interchanges and overpasses)
Liquid fuel combustion – bridge construction Upstream emissions from the production of bridge construction materials Upstream emissions from the transport of bridge construction materials
Fuel type AND kL of fuel, for each type AND Concrete type(s) AND t concrete used OR cement type(s) AND t cement used, Steel type(s) AND t steel used, t aggregate used, t sand used, t fly ash used and t water used in making concrete AND Steel type(s) AND t steel used Quantity of material per truckload AND return transport distance, in km
Equipment type(s) AND number of months operated AND load on equipment OR Type of bridge AND bridge area in m2 Type of bridge AND bridge area in m2 AND distance from road project to likely source of material in km

Greenhouse Gas Assessment Workbook for Road Projects
GREENHOUSE GAS ASSESSMENT WORKBOOK FOR ROAD PROJECTS V6.DOCX Page 22
Activity Emission source Emission Source Data Required Alternative Emission Source Data Required
Reinforced soil walls
Liquid fuel combustion – reinforced soil wall construction Upstream emissions from the production of reinforced soil wall construction materials Upstream emissions from the transport of reinforced soil wall materials
Fuel type AND kL of fuel, for each type AND Concrete type(s) AND t concrete used OR cement type(s) AND t cement used, Steel type(s) AND t steel used, t aggregate used, t sand used, t fly ash used and t water used in making concrete AND Steel type(s) AND t steel used Quantity of material per truckload AND return transport distance, in km
Equipment type(s) AND number of months operated AND load on equipment OR Reinforced soil wall area, in m2 Reinforced soil wall area, in m2 AND distance from road project to likely source of material in km
Retaining walls
Liquid fuel combustion – retaining wall construction Upstream emissions from the production of retaining wall construction materials Upstream emissions from the transport of retaining wall construction materials
Fuel type AND kL of fuel, for each type AND Concrete type(s) AND t concrete used OR cement type(s) AND t cement used, Steel type(s) AND t steel used, t aggregate used, t sand used, t fly ash used and t water used in making concrete OR Timber type(s) AND t timber used OR Rock types AND t rock used AND Steel type(s) AND t steel used Quantity of material per truckload AND return transport distance, in km
Equipment type(s) AND number of months operated AND load on equipment OR Retaining wall distance, in m Retaining wall length, in m AND distance from road project to likely source of material in km

Greenhouse Gas Assessment Workbook for Road Projects
GREENHOUSE GAS ASSESSMENT WORKBOOK FOR ROAD PROJECTS V6.DOCX Page 23
Activity Emission source Emission Source Data Required Alternative Emission Source Data Required
Tunnels Liquid fuel combustion – tunnel construction Upstream emissions from the production of tunnel construction materials Upstream emissions from the generation and distribution of electricity Upstream emissions from the transport of tunnel construction materials
Fuel type AND kL of fuel, for each type AND Concrete type(s) AND t concrete used OR cement type(s) AND t cement used, Steel type(s) AND t steel used, t aggregate used, t sand used, t fly ash used and t water used in making concrete AND Steel type(s) AND t steel used AND Explosives type(s) AND t used State/region AND kWh of electricity consumed Quantity of material per truckload AND return transport distance, in km
Refer to Section 5.4
Construction – Drainage Refer to Table 5.10
Kerbing Liquid fuel combustion –construction of kerbing Upstream emissions from the production of kerbing materials Upstream emissions from the transport of kerbing materials
Fuel type AND kL of fuel, for each type AND Concrete type(s) AND t concrete used OR cement type(s) AND t cement used, Steel type(s) AND t steel used, t aggregate used, t sand used, t fly ash used and t water used in making concrete AND Steel type(s) AND t steel used AND Additional Aggregate type(s) AND t aggregate used Quantity of material per truckload AND return transport distance, in km
Equipment type(s) AND number of months operated AND load on equipment OR Kerbing type AND length, in m Kerbing type AND length, in m AND distance from road project to likely material source in km

Greenhouse Gas Assessment Workbook for Road Projects
GREENHOUSE GAS ASSESSMENT WORKBOOK FOR ROAD PROJECTS V6.DOCX Page 24
Activity Emission source Emission Source Data Required Alternative Emission Source Data Required
Culverts (pipes or box culverts for water drainage)
Liquid fuel combustion – laying of culverts Upstream emissions from the production of culvert materials Upstream emissions from the transport of culvert materials
Fuel type AND kL of fuel, for each type AND Concrete type(s) AND t concrete used OR cement type(s) AND t cement used, Steel type(s) AND t steel used, t aggregate used, t sand used, t fly ash used and t water used in making concrete AND Additional Aggregate type(s) AND t aggregate used Steel type(s) AND t steel used Plastic type(s) AND t plastic used Quantity of material per truckload AND return transport distance, in km
Equipment type(s) AND number of months operated AND load on equipment OR Culvert type AND length, in m Culvert type AND length, in m AND distance from road project to likely material source in km
Open, unlined drains
Liquid fuel combustion – open unlined drain formation
Fuel type AND kL of fuel, for each type
Equipment type(s) AND number of months operated AND load on equipment OR Length of open, unlined drains in m
Construction – Road Furniture Refer to Table 5.11
Road Safety Barriers
Liquid fuel combustion – road safety barrier installation Upstream emissions from the production of road safety barriers Upstream emissions from the transport of road safety barrier materials
Fuel type AND kL of fuel, for each type AND Concrete type(s) AND t concrete used OR cement type(s) AND t cement used, Steel type(s) AND t steel used, t aggregate used, t sand used, t fly ash used and t water used in making concrete AND Steel type(s) AND t steel used Quantity of material per truckload AND return transport distance, in km
Equipment type(s) AND number of months operated AND load on equipment OR Barrier type AND length, in m Barrier type AND length, in m AND distance from road project to likely material source in km
Greenhouse Gas Assessment Workbook for Road Projects
GREENHOUSE GAS ASSESSMENT WORKBOOK FOR ROAD PROJECTS V6.DOCX Page 25
Activity Emission source Emission Source Data Required Alternative Emission Source Data Required
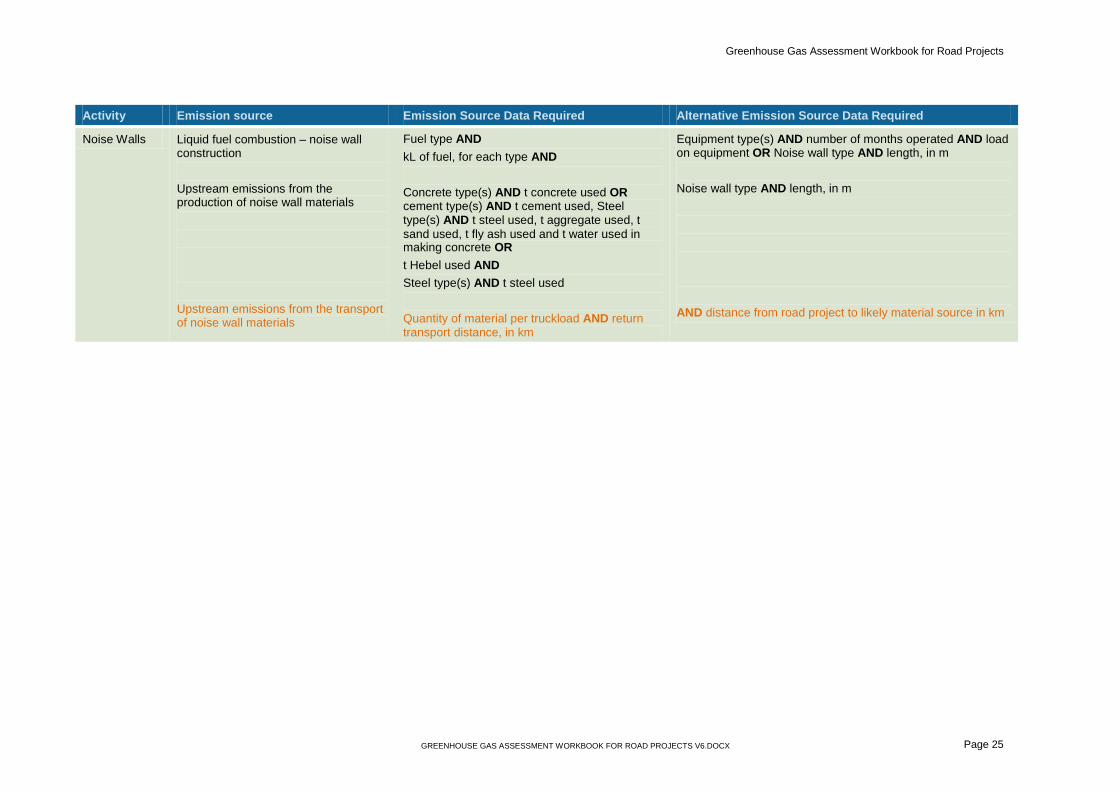
Noise Walls Liquid fuel combustion – noise wall construction Upstream emissions from the production of noise wall materials Upstream emissions from the transport of noise wall materials
Fuel type AND kL of fuel, for each type AND Concrete type(s) AND t concrete used OR cement type(s) AND t cement used, Steel type(s) AND t steel used, t aggregate used, t sand used, t fly ash used and t water used in making concrete OR t Hebel used AND Steel type(s) AND t steel used Quantity of material per truckload AND return transport distance, in km
Equipment type(s) AND number of months operated AND load on equipment OR Noise wall type AND length, in m Noise wall type AND length, in m AND distance from road project to likely material source in km

Greenhouse Gas Assessment Workbook for Road Projects
GREENHOUSE GAS ASSESSMENT WORKBOOK FOR ROAD PROJECTS V6.DOCX Page 26
5.3 Default quantity factors – road construction The Workbook provides an alternative method for determining activity data quantities. The alternative method uses an indicator of activity level and default quantity factors to estimate the activity data quantities. Default quantity factors (DQFs) can be used to estimate the usage of various components for various emission sources, should actual activity data not be available or readily accessible.
The default quantity factors have been developed using cost estimating first principles in most cases and are based on ‘typical’ construction, operation and maintenance processes and materials. If a project uses an alternative process or material then the default quantity factors should not be used. Refer to Section 5 of the Supporting Document for further details of the tools and methods used to determine the default quantity factors.
NOTE: The DQFs in the following tables should be used to estimate the quantities of fuel and materials used only when the actual usage data is not available.
The following section provides a list of the data sources and major assumptions used to develop the default quantity factors included in the Workbook. A brief introduction to the data sources is provided in Section 5.3 and 5.4 of the Supporting Document.
5.3.1 Site offices and plant
Table 5-3 provides default quantity factors for emission sources associated with site offices and vehicles whilst Table 5-4 provides default quantity factors for fuel usage for common site vehicles.
Table 5-3 Default quantity factors – Site offices and vehicles
Emission Source Unit of Measure (UOM)
Diesel (kL/UOM)
Petrol (kL/UOM)
Comments
Site Offices
Liquid fuel combustion – electricity generation (e.g. diesel generator)
Construction months
3.1 N/A Assumes 500 m2 of office space, equivalent of 2 star NABERS rating, operating 12 hours a day, Monday to Friday
Site vehicles

Greenhouse Gas Assessment Workbook for Road Projects
GREENHOUSE GAS ASSESSMENT WORKBOOK FOR ROAD PROJECTS V6.DOCX Page 27
Emission Source Unit of Measure (UOM)
Diesel (kL/UOM)
Petrol (kL/UOM)
Comments
Small project (<$2m) Construction months
0.65 1.02 2 Hilux utes, assumes all vehicles are diesel or all vehicles are petrol
Medium project ($2-10m) Construction months
1.31 2.05 4 Hilux utes, assumes all vehicles are diesel or all vehicles are petrol
Large project ($10-100m) Construction months
3.40 5.32 10 Hilux utes, assumes all vehicles are diesel or all vehicles are petrol
Source Data – Diesel Generators: McFarlane Generators Source Data – Site Vehicles: Cost estimator & Green Vehicle Guide, Department of Infrastructure and Transport (Commonwealth of Australia) If the likely project mileage is known for various vehicle types Table 5-4 maybe used in place of the default quantity factors in Table 5-3 above. It is recognised that there may be a mix of site vehicles running on both diesel and petrol, therefore Carbon Gauge allows as input the percentage of each type of vehicle.
Table 5-4 Default quantity factors - Vehicles
Vehicle Type Unit of Measure (UOM)
Diesel (kL/
UOM)
Petrol (kL/
UOM)
LPG (kL/ UOM)
Ethanol (10%) (kL/ UOM)
Comments
Hybrid km - 5.95x10⁻⁵ - - Hybrid fuel consumption ranged from 4.4L/100km (Toyota Prius) to 9.3L/100km (Lexus LS600hL).
Car km 0.114 x10⁻³
0.111 x10⁻³
0.136 x10⁻³
0.124 x10⁻³
Needs to be calculated separately for each fuel type.
Light Commercial ≤ 3.5 t gross vehicle mass [GVM])
km 0.122 x10⁻³
0.136 x10⁻³
0.151 x10⁻³
0.145 x10⁻³
Needs to be calculated separately for each fuel type.
Greenhouse Gas Assessment Workbook for Road Projects
GREENHOUSE GAS ASSESSMENT WORKBOOK FOR ROAD PROJECTS V6.DOCX Page 28
Vehicle Type Unit of Measure (UOM)
Diesel (kL/
UOM)
Petrol (kL/
UOM)
LPG (kL/ UOM)
Ethanol (10%) (kL/ UOM)
Comments
Medium Truck 3.5t≤GVM≤12t
km 0.280 x10⁻³
0.213 x10⁻³
0.288 x10⁻³
0.261 x10⁻³
Needs to be calculated separately for each fuel type.
Heavy Truck 12t≤GVM≤25t
km 0.560 x10⁻³
0.476 x10⁻³
0.792 x10⁻³
0.402 x10⁻³
Needs to be calculated separately for each fuel type.
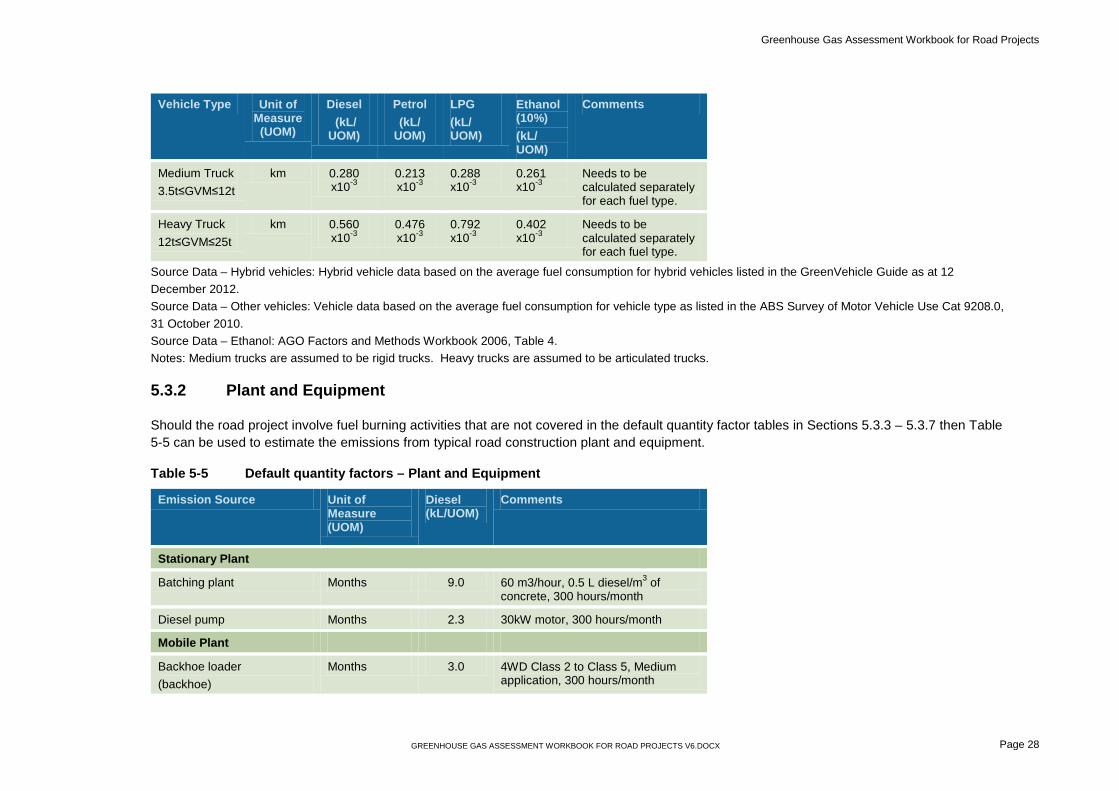
Source Data – Hybrid vehicles: Hybrid vehicle data based on the average fuel consumption for hybrid vehicles listed in the GreenVehicle Guide as at 12 December 2012. Source Data – Other vehicles: Vehicle data based on the average fuel consumption for vehicle type as listed in the ABS Survey of Motor Vehicle Use Cat 9208.0, 31 October 2010. Source Data – Ethanol: AGO Factors and Methods Workbook 2006, Table 4. Notes: Medium trucks are assumed to be rigid trucks. Heavy trucks are assumed to be articulated trucks.
5.3.2 Plant and Equipment
Should the road project involve fuel burning activities that are not covered in the default quantity factor tables in Sections 5.3.3 – 5.3.7 then Table 5-5 can be used to estimate the emissions from typical road construction plant and equipment.
Table 5-5 Default quantity factors – Plant and Equipment
Emission Source Unit of Measure (UOM)
Diesel (kL/UOM)
Comments
Stationary Plant
Batching plant Months 9.0 60 m3/hour, 0.5 L diesel/m3 of concrete, 300 hours/month
Diesel pump Months 2.3 30kW motor, 300 hours/month
Mobile Plant
Backhoe loader (backhoe)
Months 3.0 4WD Class 2 to Class 5, Medium application, 300 hours/month

Greenhouse Gas Assessment Workbook for Road Projects
GREENHOUSE GAS ASSESSMENT WORKBOOK FOR ROAD PROJECTS V6.DOCX Page 29
Emission Source Unit of Measure (UOM)
Diesel (kL/UOM)
Comments
Crane (Hydraulic) Months 7.9 50 t, Medium application, 300 hours/month
Dozer Months 5.7 Cat, Class D6, Medium application 300 hours/month
Excavator (digger, trackhoe)
Months 5.1 Crawler Class 100, Medium application, 300 hours/month
Grader (road grader, blade, maintainer, motor grader)
Months 5.1 Class 110, Medium application, 300 hours/month
Haul Truck 25 t Month 7.9 Cat. 25 Tonne Articulated, medium application, 300 hours/month.
Haul Truck 40 t Month 12.5 Cat. 40 Tonne Articulated, medium application, 300 hours/month.
Loader – skid steer (track type)
Months 1.6 Medium application, 300 hours/month
Loader – wheeled Months 4.5 Class 50WL, Medium application, 300 hours/month
Material handlers (excavator with grapple)
Months 3.0 Medium application, 300 hours/month
Material Transfer Vehicle Months 11.9 MTV Shuttle Buggy SB2500, 300 hours per month @ 67% loading
Paver Months 7.14 Roatec RP170 300 hours per month @ 70% loading
Roller, Steel Months 4.8 Medium Application, 300 hours/month
Portable Screening & Crushing Plant
Months 11.35 Medium Application, 300 hours/month
Vibrating Roller (asphalt, soil)
Months 4.8 Class VR35, Medium application, 300 hours/month

Greenhouse Gas Assessment Workbook for Road Projects
GREENHOUSE GAS ASSESSMENT WORKBOOK FOR ROAD PROJECTS V6.DOCX Page 30
Emission Source Unit of Measure (UOM)
Diesel (kL/UOM)
Comments
Scraper Months 14.5 Caterpillar TS220, 300 kW, Medium application, 300 hours/month
Stabiliser soil Months 17.1 450kW power, 2,440mm working width & 500mm working depth, Medium application, 300 hours/month
Tractor dozer Months 12.9 Class 300C (D9 size), Medium application, 300 hours/month
Water Pump Months 1.2 6” pump running continuously for dewatering
Source Data Stationary Plant: NPI EET Manual – Combustion Engines (2008), VicRoads and Pneucon Process Technology’s website (www.pneucon.net)
Source Data for Crane, Dozer, Haul Trucks, Portable Screening and Crushing Plant, derived from information contained in NCHRP Report 744 Fuel Usage Factors in Highway and Bridge Construction, TRRB.
Source Data Mobile Plant: RTA Construction GHG Emissions Inventory Tool, v. 1.5
n Low application – multiply medium application factor by 0.66
4 Light road maintenance. Finish grading. Plant and road mix work. Machine movement is mainly consisting of idle running or travelling unloaded.
n Medium application
4 Average earth moving, scraper hauling or easy pushing operations. Road mix work or scarifying.
n High application – multiply medium application factor by 1.4
4 Ripping, heavy pushing and operations continued without rest at full power. Heavy maintenance of hard packed roads with embedded rock.
5.3.3 Demolition and earthworks
Table 5-6 provides default quantity factors for emission sources associated with demolition and earthwork activities (including vegetation removal).

Greenhouse Gas Assessment Workbook for Road Projects
GREENHOUSE GAS ASSESSMENT WORKBOOK FOR ROAD PROJECTS V6.DOCX Page 31
Table 5-6 Default quantity factors – demolition and earthworks
Emission Source Unit of Measure (UOM)
Diesel (kL/UOM)
Vegetation Mass
(t/UOM)
Comments
Demolition
Liquid fuel combustion - Demolition of existing structures
Assumes demolition will be conducted using conventional plant (i.e. graders and dozers) Based on historical data
§ Houses No. 720 x10-3 - 150 m2 average
§ Small commercial No. 1,920 x10-3 - Up to 400m2, prorated from houses
§ Medium commercial No. 6,000 x10-3 - Up to 1,250m2, prorated from houses
§ Large commercial No. 16,800 x10-3 - Up to 3,500m2, prorated from houses
Vegetation removal
Liquid fuel combustion - Clearing and grubbing of vegetated areas (Australian methodology)
Assumes vegetation removal will be conducted using conventional plant (i.e. graders and dozers) For the GHG emissions relating to the loss of a carbon sink as a result of vegetation removal refer to Section 5.3.3.1
§ Class 1 ha 0.4 - Assumed to be equivalent to 0 - 50 (t dry matter/ha)
§ Class 2 ha 1 - Assumed to be equivalent to 50 - 100 (t dry matter/ha)
§ Class 3 ha 1.6 - Assumed to be equivalent to 100 - 150 (t dry matter/ha)

Greenhouse Gas Assessment Workbook for Road Projects
GREENHOUSE GAS ASSESSMENT WORKBOOK FOR ROAD PROJECTS V6.DOCX Page 32
Emission Source Unit of Measure (UOM)
Diesel (kL/UOM)
Vegetation Mass
(t/UOM)
Comments
§ Class 4 ha 2.2 - Assumed to be equivalent to 150 - 250 (t dry matter/ha)
§ Class 5 ha 2.8 - Assumed to be equivalent to 250 - 350 (t dry matter/ha)
§ Class 6 ha 3.4 - Assumed to be equivalent to 350 - 450 (t dry matter/ha)
§ Class 7 ha 4 - Assumed to be equivalent to > 450 (t dry matter/ha)
Liquid fuel combustion - Clearing and grubbing of vegetated areas (New Zealand methodology)
Assumes vegetation removal will be conducted using conventional plant (i.e. graders and dozers)
§ Grasslands ha 0.4 10 Average from all IPCC Climate Zones For the GHG emissions relating to the loss of a carbon sink as a result of vegetation removal refer to Section 5.3.3.1
§ Low shrubs ha 1 30 Assumed to be equivalent to low shrublands For the GHG emissions relating to the loss of a carbon sink as a result of vegetation removal refer to Section 5.3.3.1

Greenhouse Gas Assessment Workbook for Road Projects
GREENHOUSE GAS ASSESSMENT WORKBOOK FOR ROAD PROJECTS V6.DOCX Page 33
Emission Source Unit of Measure (UOM)
Diesel (kL/UOM)
Vegetation Mass
(t/UOM)
Comments
§ High shrubs and medium dense trees < 10m
ha 2.8 210 Assumed to be equivalent to Woodland For the GHG emissions relating to the loss of a carbon sink as a result of vegetation removal refer to Section 5.3.3.1
§ Dense, mature forest ha 4 400 Highly dependent upon size of trees, whether they can be burnt, pushed up or logged, accuracy on this item plus/minus 50% Assumed to be equivalent to Open Forest For the GHG emissions relating to the loss of a carbon sink as a result of vegetation removal refer to Section 5.3.3.1
Transport of cleared vegetation offsite
Refer to Table 5.4
Earthworks
Liquid fuel combustion – earthmoving equipment § Strip and respread
topsoil
m3 1.2 x10⁻³ Assumes earthworks will be conducted using conventional plant (i.e. graders and dozers) Includes scraper operation
§ Cut to spoil m3 4.0 x10⁻³ Includes box out for pavements

Greenhouse Gas Assessment Workbook for Road Projects
GREENHOUSE GAS ASSESSMENT WORKBOOK FOR ROAD PROJECTS V6.DOCX Page 34
Emission Source Unit of Measure (UOM)
Diesel (kL/UOM)
Vegetation Mass
(t/UOM)
Comments
§ Cut to fill m3 1.0 x10⁻³ Includes scraper, excavator/truck operation within 1 km. Includes fuel used for compaction.
§ Import and place filling
m3 3.5 x10⁻³ Assumes bulk operation in metro location. Does not include fuel used to ‘extract’ import fill (i.e. offsite emissions).
Source Data – Demolition: DTEI Greenhouse Gas Assessment Tool v4_0 Source Data – Vegetation Removal - Diesel: DTEI Greenhouse Gas Assessment Tool v4_0 Source Data -–Vegetation Removal – Vegetation Mass (Australian methodology): Vegetation emissions methodology for road construction workbook: workbook methodology, June 2012 Source Data – Vegetation Removal – Vegetation Mass (New Zealand methodology):Adapted from NCAS Technical Report No. 17, Tables 2.3, 2.5 and Table 3.8 Source Data – Vegetation Mass Grasslands (New Zealand Methodology): IPCC Guidelines for National Greenhouse Gas Inventories, Volume 4, Chapter 6 Grasslands, Table 6.4 Source Data – Earthworks: Cost estimator The New Zealand methodology is currently being reviewed and will be updated in a future release. For further information contact NZTA.
5.3.3.1 Vegetation removal - lost carbon sink
Australia
This methodology for estimating the greenhouse gas impacts associated with clearance takes into account the carbon that exists in the vegetation at the time of clearing and carbon that could have been sequestered in the future if the vegetation was not cleared. The methodology is considered a conservative estimation approach and assumed that:
n All carbon pools (i.e. woody, non-woody, debris and soil) are removed.
n All carbon removed is converted to carbon dioxide and released to the atmosphere.
n Sequestration from revegetation of the project site is not included.
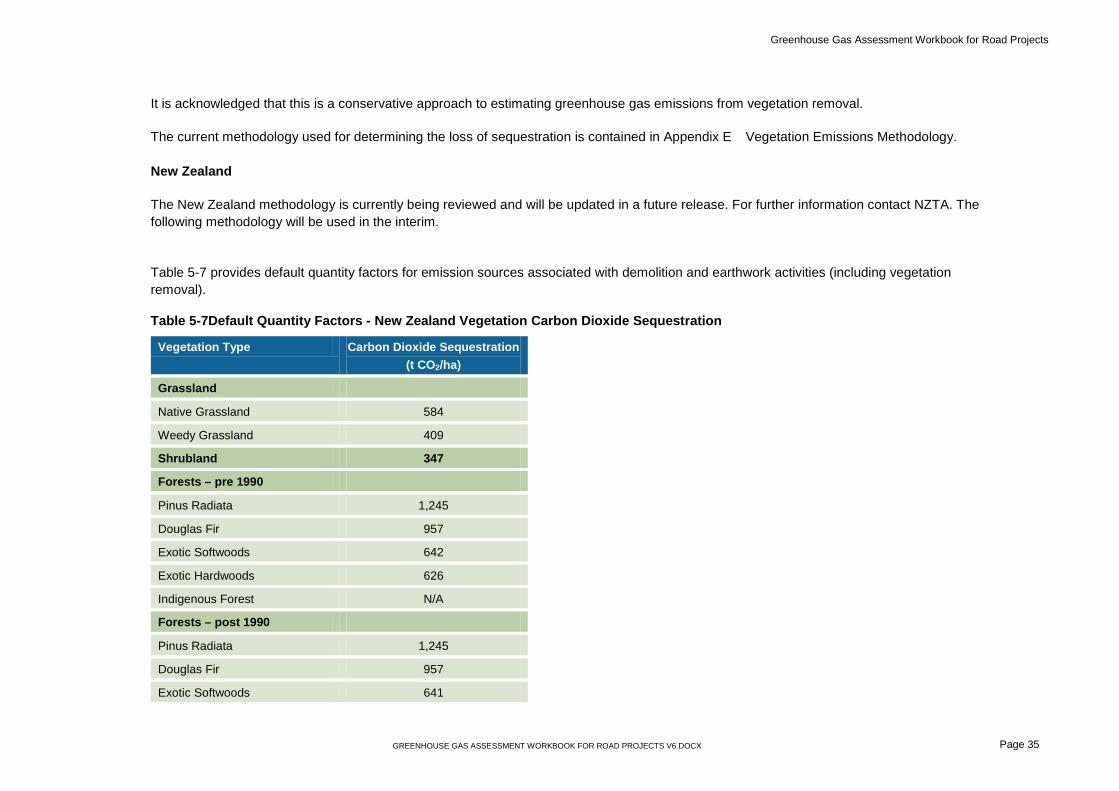
Greenhouse Gas Assessment Workbook for Road Projects
GREENHOUSE GAS ASSESSMENT WORKBOOK FOR ROAD PROJECTS V6.DOCX Page 35
It is acknowledged that this is a conservative approach to estimating greenhouse gas emissions from vegetation removal.
The current methodology used for determining the loss of sequestration is contained in Appendix E Vegetation Emissions Methodology.
New Zealand
The New Zealand methodology is currently being reviewed and will be updated in a future release. For further information contact NZTA. The following methodology will be used in the interim.
Table 5-7 provides default quantity factors for emission sources associated with demolition and earthwork activities (including vegetation removal).
Table 5-7Default Quantity Factors - New Zealand Vegetation Carbon Dioxide Sequestration
Vegetation Type Carbon Dioxide Sequestration (t CO2/ha)
Grassland
Native Grassland 584
Weedy Grassland 409
Shrubland 347
Forests – pre 1990
Pinus Radiata 1,245
Douglas Fir 957
Exotic Softwoods 642
Exotic Hardwoods 626
Indigenous Forest N/A
Forests – post 1990
Pinus Radiata 1,245
Douglas Fir 957
Exotic Softwoods 641

Greenhouse Gas Assessment Workbook for Road Projects
GREENHOUSE GAS ASSESSMENT WORKBOOK FOR ROAD PROJECTS V6.DOCX Page 36
Vegetation Type Carbon Dioxide Sequestration (t CO2/ha)
Exotic Hardwoods 618
Indigenous Forest 323

Greenhouse Gas Assessment Workbook for Road Projects
GREENHOUSE GAS ASSESSMENT WORKBOOK FOR ROAD PROJECTS V6.DOCX Page 37
5.3.4 Pavements
Table 5-8 provides default factors for emission sources associated with the construction of pavements.
Table 5-8 Default quantity factors – pavements
Emission Source Unit of Measure
Diesel (kL/UOM)
30 MPa Concrete (m3/UOM)
Steel (t/UOM)
Bitumen (t/UOM)
Aggregate (t/UOM)
Fly Ash (t/UOM)
Sand (t/UOM)
Cement (t/UOM)
Comments
Pavements – Flexible Grader based gang using average production rates , urban project
Full Depth Asphalt
m2 1.69 x10⁻³ - - 32.2 x10⁻³ 1.26 - - 5.58 x10⁻³ 280mm of Asphalt, 150mm of 2% cement treated aggregate, 150mm of aggregate basecourse. 5% bitumen content in Asphalt
Deep Strength Asphalt
m2 2.15 x10⁻³ - - 20.1 x10⁻³ 1.47 - - 20.5 x10⁻³ 175mm of Asphalt, 200mm of 4% cement treated aggregate, 150mm of 2% cement treated aggregate, 150mm of aggregate basecourse. 5% bitumen content
Warm Mix Asphalt
m2 1.58 x10⁻³ - - 22.4 x10⁻³ 1.13 - - 9.77 x10⁻³ 195mm of Asphalt, 175mm of 4% cement treated aggregate and150mm of aggregate basecourse
Granular + spray and seal (Equivalent to Chip Seal)
m2 1.82 x10⁻³ - - 2.0 x10⁻³ 1.15 - - - 500mm of aggregate, two coat sprayseal
Pavements - Rigid
Plain Concrete (PC) m2 1.44 x10⁻³ - - - 0.53 14.0 x10⁻³ 0.23 50.7 x10⁻³
270mm of base concrete (40MPa), 150mm of subbase concrete (LMC), 150mm 2% stablised SMZ, 150mm SMZ Lean mix concrete cement content is 220 kg/m3 25MPa concrete cement content is 300 kg/m3

Greenhouse Gas Assessment Workbook for Road Projects
GREENHOUSE GAS ASSESSMENT WORKBOOK FOR ROAD PROJECTS V6.DOCX Page 38
Emission Source Unit of Measure
Diesel (kL/UOM)
30 MPa Concrete (m3/UOM)
Steel (t/UOM)
Bitumen (t/UOM)
Aggregate (t/UOM)
Fly Ash (t/UOM)
Sand (t/UOM)
Cement (t/UOM)
Comments
Reinforced Concrete m2 1.44 x10⁻³ - 6.53 x10⁻³ - 0.53 14.0 x10⁻³ 0.23 45.0 x10⁻³
270mm of base concrete (40MPa), 150mm of subbase concrete (LMC), 150mm 2% stablised SMZ, 150mm SMZ Lean mix concrete cement content is 220 kg/m3 25MPa concrete cement content is 300 kg/m3 Steel is 1.5% of total weight
Sealing
Prime, AMC 00 m2 0.12 x10⁻³ - - 1.2 x10⁻³ - - - - Based on 1.2 litres/m2. Includes diesel rural multiplication factor of 6
Waterproofing layer m2 0.23 x10⁻³ - - 1.0 x10⁻³ 0.012 - - - Based on 0.9 L/m2 bitumen and 170m2/m3 for 7mm Includes diesel rural multiplication factor of 7
2 coat, spray seal m2 0.49 x10⁻³ - - 2.0 x10⁻³ 0.031 - - - Based on 0.9 l/m2 x 2 layers, aggregate @ 105 m2/m3 for 16mm and 170m2/m3 for 7mm . Includes diesel rural multiplication factor of 7
Other pavements
Median and traffic island infill
m2 3.8 x10⁻⁴ 0.34 6.90x10⁻³ 0.112 - - - 175mm thick with 150mm cap of concrete, Reinforcement assumed 2% of concrete weight
Concrete footpaths m2 1.0 x10⁻⁴ 0.075 3.45 x10⁻³ - 0.112 - - - Assumed 30MPa concrete. 75mm thick, not less than 50mm aggregate base, Reinforcement assumed 2% of concrete weight
Block paved footpaths m2 2.0 x10⁻³ 8.0 x10⁻⁵ - - 0.336 - - - 80mm ICPU, not less than 150mm aggregate base
Bike path - asphalt m2 7.3 x10⁻⁴ - - 4.0 x10⁻³ 0.412 - - - Pavement – 35mm HMA on prime on 150mm of crushed rock, minor earthworks to 0.5m, no steel edge strips, no kerbing, no lighting

Greenhouse Gas Assessment Workbook for Road Projects
GREENHOUSE GAS ASSESSMENT WORKBOOK FOR ROAD PROJECTS V6.DOCX Page 39
Emission Source Unit of Measure
Diesel (kL/UOM)
30 MPa Concrete (m3/UOM)
Steel (t/UOM)
Bitumen (t/UOM)
Aggregate (t/UOM)
Fly Ash (t/UOM)
Sand (t/UOM)
Cement (t/UOM)
Comments
Bike path - concrete m2 5.2 x10⁻⁴ 0.125 5.7 x10⁻³ - 0.224 - - 125mm thick, , not less than 100mm aggregate base, Reinforcement assumed 2% of concrete weight
Source Data – Pavements Flexible: RTA Pavements types document (refer Section 5.2 of Supporting Document), DTEI Greenhouse Gas Assessment Tool v4_0 Source Data – Pavements Rigid: RTA Pavements types document(refer Section 5.2 of Supporting Document), SA Water TS 1a PB Source Data – Sealing: DTEI Greenhouse Gas Assessment Tool v4_0 Source Data – Other Pavements: DTEI Greenhouse Gas Assessment Tool v4_0, VicRoads Drawings

Greenhouse Gas Assessment Workbook for Road Projects
GREENHOUSE GAS ASSESSMENT WORKBOOK FOR ROAD PROJECTS V6.DOCX Page 40
5.3.5 Road structures
Table 5-9 provides default factors for emission sources associated with the construction of road structures.
Table 5-9 Default quantity factors – road structures
Emission Source Unit of Measure
Diesel (kL/UOM)
40MPa Concrete (m3/UOM)
Steel (t/UOM)
Timber (m3/UOM)
Comments
Bridges
Bridge constructed using precast reinforced concrete beams
m2 0.038 1.52 0.25 - Based on 4 span, 4 lane,1,500mm deep reinforced concrete super T structure with piles. Suitable for spans up to 35m.
Bridge constructed using steel beams m2 0.038 1.2 0.44 - Based on 4 span 2 lane welded beam structure without piles
Reinforced Soil walls
Reinforced Soil Walls m2 0.048 0.2 0.02 - Includes reinforced earth block
Retaining walls
Concrete retaining walls m2 0.3 x10⁻³ 0.57 0.058 - Assumes 180mm thick reinforced concrete wall, 1.5-1.8m high
Timber retaining walls m2 0.9 x10⁻³ 0.17 0.028 0.02 Assumes 1.5-1.8m high
Rock retaining walls m2 4.0 x10⁻³ - - - Assumes gabion style, 1.5-1.8m high Assumed that the rock is taken from nature (i.e. not processed) and therefore has no associated quantity for aggregate.
Source Data – Bridges: DTEI Greenhouse Gas Assessment Tool v4_0 Source Data – Reinforced Soil Walls: DTEI Greenhouse Gas Assessment Tool v4_0 Source Data – Retaining Walls: Cost estimator

Greenhouse Gas Assessment Workbook for Road Projects
GREENHOUSE GAS ASSESSMENT WORKBOOK FOR ROAD PROJECTS V6.DOCX Page 41
5.3.6 Drainage
Table 5-10 provides default factors for emission sources associated with drainage.
Table 5-10 Default quantity factors – drainage
Emission Source Unit of Measure
Diesel (kL/UOM)
30 MPa Concrete (m3/UOM)
Steel (t/UOM)
Aggregate (t/UOM)
Comments
Kerbing All based on conventional construction methods using plant typical for this type of work
Mountable Kerb m 0.2 x10⁻³ 0.04 - - Unreinforced , mountable kerb
Semi-mountable Kerb m 0.3 x10⁻³ 0.06 - - Unreinforced , semi-mountable kerb
Upright kerb and Gutter (Channel)
m 0.4 x10⁻³ 0.08 - - Unreinforced , barrier kerb and gutter
Invert drain m 1.1 x10⁻³ 0.22 0.003 -
Culverts – pipes or box culverts for water drainage Based on standard class 2 pipes with imported backfilling
Small <450 RCP m 35.0 x10⁻³ 0.07 2.9 x10⁻³ 3.07 RCP=Reinforced Concrete Pipe, Assumes trench width is approximately 600mm wider than pipe diameter, cover = 1.0m and includes all imported bedding, surround and backfill materials. Steel is 1.8% of total weight
Medium 450 – 750 RCP m 45.0 x10⁻³ 0.11 4.55 x10⁻³ 4.39 Assumes trench width is approximately 600mm wider than pipe diameter, cover = 1.0m and includes all imported bedding, surround and backfill materials. Steel is 1.8% of total weight
Large 750 – 1200 RCP m 95.0 x10⁻³ 0.15 6.21 x10⁻³ 5.91 Assumes trench width is approximately 600mm wider than pipe diameter, cover = 1.0m and includes all imported bedding, surround and backfill materials. Steel is 1.8% of total weight
375 x 600 RCBC m 67.0 x10⁻³ 0.19 0.018 4.26 RCBC = reinforced concrete box culvert Assumes trench width is approximately 600mm wider than culvert width, cover = 1.0m and includes all imported bedding, surround and backfill materials. Steel is 1.8% of total weight

Greenhouse Gas Assessment Workbook for Road Projects
GREENHOUSE GAS ASSESSMENT WORKBOOK FOR ROAD PROJECTS V6.DOCX Page 42
Emission Source Unit of Measure
Diesel (kL/UOM)
30 MPa Concrete (m3/UOM)
Steel (t/UOM)
Aggregate (t/UOM)
Comments
600 x 1200 RCBC m 100.5 x10⁻³ 0.40 0.039 6.83 Assumes trench width is approximately 600mm wider than culvert width, cover = 1.0m and includes all imported bedding, surround and backfill materials. Steel is 1.8% of total weight
Open, unlined drains
Form open, unlined drains m 0.5 x10⁻³ - - - Assumes V drains cut with a grader
Source Data – Kerbing: DTEI Greenhouse Gas Assessment Tool v4_0 Source Data – Culverts: Cost estimator Source Data – Open, Unlined Drains: DTEI Greenhouse Gas Assessment Tool v4_0
5.3.7 Road furniture
Table 5.11 provides default factors for emission sources associated with the manufacture and installation of road furniture.
Table 5-11 Default quantity factors – road furniture
Emission Source Unit of Measure
Diesel (kL/UOM)
30 MPa Concrete (m3/UOM)
Steel (t/UOM)
Timber (t/UOM)
Comments
Road safety barriers
Wire rope barrier m 0.6 x10⁻³ 67.9 x10⁻³ 10.6 x10⁻³ Assumed to be 4 rope barrier, 1.2kg/m wire, steel posts (1,230mmx100mmx25mm) at 2.5m spacing with a concrete footing 300mm diameter by 600mm deep
W-beam barrier m 0.6 x10⁻³ - 23.3 x10⁻³ Assumed to be 5m panels of 2.7mm base metal thickness, steel posts 150mmx110mmx4.3mm at 2m spacing
F-type (New Jersey) barrier m 0.97 x10⁻³ 0.687 12.6 x10⁻³ Assumes 1.8% steel and 4m barrier weighs 2.8t
Noise walls
Reinforced concrete noise wall m 0.04 0.477 0.031 Assumed to be 3m high, 4.2m long steel posts HW 350, concrete footing 450mm in diameter by 1,500mm deep, precast concrete panels 150mm thick, 4m between posts

Greenhouse Gas Assessment Workbook for Road Projects
GREENHOUSE GAS ASSESSMENT WORKBOOK FOR ROAD PROJECTS V6.DOCX Page 43
Emission Source Unit of Measure
Diesel (kL/UOM)
30 MPa Concrete (m3/UOM)
Steel (t/UOM)
Timber (t/UOM)
Comments
Hebel noise wall m 0.04 0.286 0.031 Assumed to use 40% less concrete than reinforced concrete noise wall
Timber noise wall m 0.04 0.045 0.05 0.059 Assumed to be 3m high wall, 4.2m long steel posts HW 350, concrete footing 450mm in diameter by 1,500mm deep, plywood acoustic panels -. assumed 28mm thick, 2.4m between posts
Steel plate noise wall m 0.04 0.036 0.74 Assumed to be 3m high wall, 4.2m long steel posts HW 350, concrete footing 450mm in diameter by 1,500mm deep, 3mm thick steel plate. 3m between posts
Source Data – Road Safety Barriers: Ingal Civil Products Source Data – Noise Walls: Cost estimator & VicRoads As-Built drawing and schedules

Greenhouse Gas Assessment Workbook for Road Projects
Page 44 GREENHOUSE GAS ASSESSMENT WORKBOOK FOR ROAD PROJECTS V6.DOCX
5.4 Road projects that include tunnels
The construction methods and GHG emissions for tunnels are project specific. It is therefore not possible to develop meaningful default quantity factors for the construction of tunnels.
The commonly used tunnelling methods are:
n Cut and cover
n Driven
4 Tunnel boring machine
– Sacrificed
– Retrieved
4 Road header
In order to estimate the GHG emissions from constructing a tunnel the information shown in Table 5. -12 will need to be known, as a minimum.
Table 5. -12 Information required to estimate the GHG emissions from construction of tunnels
Information Required Activity measure
Length and cross section of the tunnel Indicates the quantity of spoil that will need to be removed
Geotechnical conditions Indicates the productivity of tunnelling and therefore the tunnelling duration
Volume of lining Usage of materials
Type of tunnelling equipment Electricity and fuel consumption
Lighting and ventilation requirements during construction
Electricity consumption
General road items required:
n Pavement
n Culverts
n Road safety barriers
n Signage etc.
Usage of materials

Greenhouse Gas Assessment Workbook for Road Projects
GREENHOUSE GAS ASSESSMENT WORKBOOK FOR ROAD PROJECTS V6.DOCX Page 45
Information Required Activity measure
Mechanical and Electrical equipment
n Fans (supply and extraction)
n Pumps
n Fire life safety systems
n Lights
Electricity consumption during operation Planned Maintenance requirements

Greenhouse Gas Assessment Workbook for Road Projects
Page 46 GREENHOUSE GAS ASSESSMENT WORKBOOK FOR ROAD PROJECTS V6.DOCX
6. Module 3 – Operation Operation is considered to be post construction and includes activities that are required on a continual basis for the functioning of the road.
This Workbook does not include road usage by vehicles in this definition.
6.1 Operation GHG assessment boundary
Table 6-1 shows the Scope 1, 2 and 3 emission sources included within the operation GHG assessment boundary.
NOTE: Items in Table 6-1 in orange might be significant – Refer to the Materiality Checklist in Appendix A for guidance on when these emission sources should be included in a GHG assessment.
As some roads, particularly rural roads, have no street lighting, traffic signals or intelligent transport systems (ITS) none of the operational emission sources are considered material for all road projects. Hence, all fields in Table 6-1 are orange.
Table 6-1 Emission sources to be included in GHG assessment of road operation
Scope 1 Scope 2 Scope 3
Street Lighting
Electricity consumption by street lights
Generation and distribution of electricity consumed by plant and equipment
Traffic Signals
Electricity consumption by traffic signals
Generation and distribution of electricity consumed by plant and equipment
Intelligent Transport Systems
Electricity consumption by signs, travel time boards and ramp metering
Generation and distribution of electricity consumed by plant and equipment
NOTE: The revegetation of road verges will result in carbon dioxide being sequestered during operation of the road. However, the quantity of carbon sequestered is not well correlated with climate conditions (e.g. annual rainfall) and hence revegetation has not been included in the Workbook or the GHG assessment boundary.
Figure 6.1 below shows the operation GHG assessment boundary and the activities and emission sources found to be significant (refer to Section 3.7 of the Supporting Document for further details of the materiality assessment for operation). All of the activities and emission sources considered within the operation GHG assessment boundary are shown in Figure 3.2 of the Supporting Document.
NOTE: Activities/emission sources with a dashed outline are those that may be significant for some road projects but insignificant for others.

Greenhouse Gas Assessment Workbook for Road Projects
GREENHOUSE GAS ASSESSMENT WORKBOOK FOR ROAD PROJECTS V6.DOCX Page 47
OperationAssessment boundary
Note: A dashed outline indicates that the emission source/activity is not material for all road projects
Utilities Repair/Maintenance
Infrastructure, Equipment and Capital
Goods
Electricity Generation and Distribution
On-site Electricity Consumption by lighting and ITS
Street Lighting
Traffic Signals
Intelligent TransportSystem
- travel time boards- variable message signs- variable speed signs- lane use signs- ramp metering & traffic controls
Scope 1 Scope 2 Scope 3Activity
Figure 6.1 Operation GHG assessment boundary

Greenhouse Gas Assessment Workbook for Road Projects
Page 48 GREENHOUSE GAS ASSESSMENT WORKBOOK FOR ROAD PROJECTS V6.DOCX
6.2 Operation emission sources and required data
Table 6-2 presents all of the activities and emission sources within the operation GHG assessment boundary that are considered significant. The data required for each emission source is also listed in Table 6-2.
Where the emission source (usage) data is not available (e.g. in the project scoping phase) the alternative emission source data and the associated default quantity factor(s) (refer to Section 6.3 below) may be used to estimate the emission source (usage) data.
NOTE: Items in Table 6-2 in orange might be significant – Refer to the Materiality Checklist in Appendix A for guidance on when these emission sources should be included in a GHG assessment.

Greenhouse Gas Assessment Workbook for Road Projects
GREENHOUSE GAS ASSESSMENT WORKBOOK FOR ROAD PROJECTS V6.DOCX Page 49
Table 6-2 Data required to estimate the GHG emissions associated with the operation of a road
Activity Emission Source Emission Source Data Required Alternative Emission Source Data Required
Street lighting Generation and distribution of electricity consumed by street lighting
Number, type and wattage of lamps AND Operating hours
Road type/application (see Table 6-4 below) AND length of road/application
Traffic signals Generation and distribution of electricity consumed by traffic signals
Number and type of signal pedestals AND Type and wattage of lamps (assumed operating 24 hours a day)
Type of intersection (see Table 6-5below)
Intelligent transport systems Generation and distribution of electricity consumed by intelligent transport systems
Number, type and wattage of travel time boards AND operating hours Number, type and wattage of variable message signs AND operating hours Number, type and wattage of variable speed signs AND operating hours Number, type and wattage of lane use signs AND operating hours Number, type and wattage of ramp metering and controls AND operating hours Number, type and wattage of control systems AND operating hours
Refer to Section 6.5
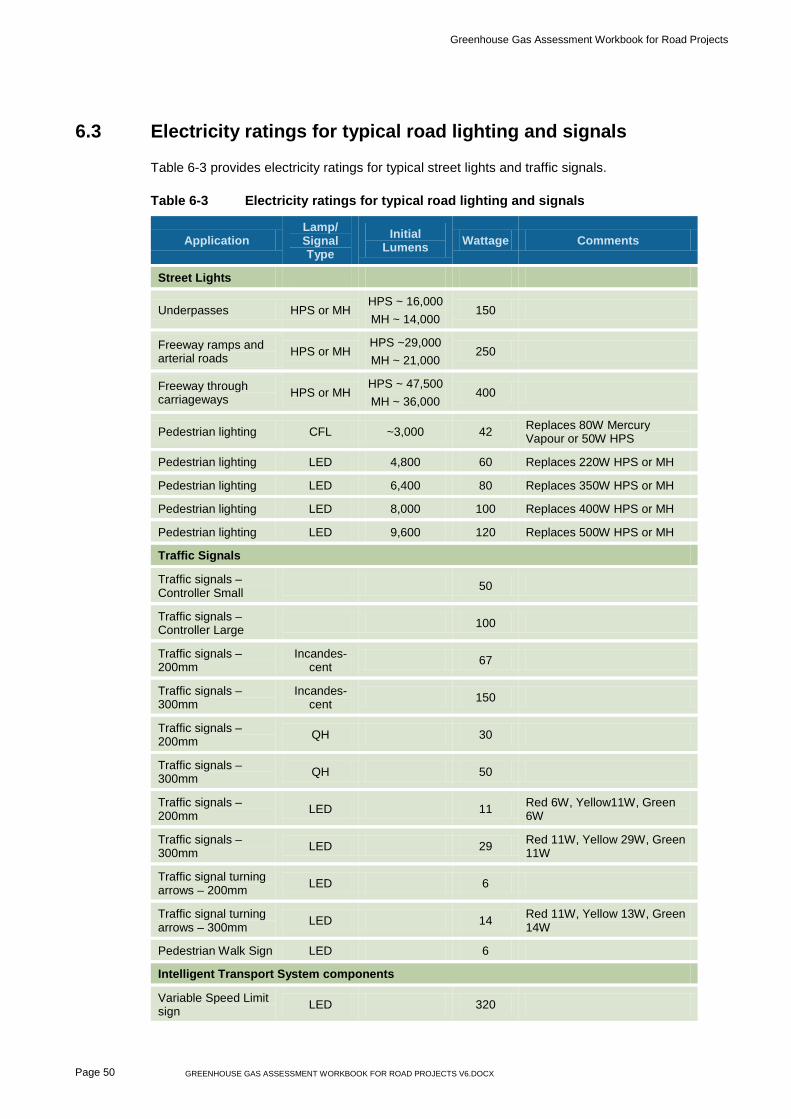
Greenhouse Gas Assessment Workbook for Road Projects
Page 50 GREENHOUSE GAS ASSESSMENT WORKBOOK FOR ROAD PROJECTS V6.DOCX
6.3 Electricity ratings for typical road lighting and signals
Table 6-3 provides electricity ratings for typical street lights and traffic signals.
Table 6-3 Electricity ratings for typical road lighting and signals
Application Lamp/ Signal Type
Initial Lumens Wattage Comments
Street Lights
Underpasses HPS or MH HPS ~ 16,000 MH ~ 14,000
150
Freeway ramps and arterial roads HPS or MH
HPS ~29,000 MH ~ 21,000
250
Freeway through carriageways HPS or MH
HPS ~ 47,500 MH ~ 36,000
400
Pedestrian lighting CFL ~3,000 42 Replaces 80W Mercury Vapour or 50W HPS
Pedestrian lighting LED 4,800 60 Replaces 220W HPS or MH
Pedestrian lighting LED 6,400 80 Replaces 350W HPS or MH
Pedestrian lighting LED 8,000 100 Replaces 400W HPS or MH
Pedestrian lighting LED 9,600 120 Replaces 500W HPS or MH
Traffic Signals
Traffic signals – Controller Small 50
Traffic signals – Controller Large 100
Traffic signals – 200mm
Incandes-cent 67
Traffic signals – 300mm
Incandes-cent 150
Traffic signals – 200mm QH 30
Traffic signals – 300mm QH 50
Traffic signals – 200mm LED 11 Red 6W, Yellow11W, Green
6W
Traffic signals – 300mm LED 29 Red 11W, Yellow 29W, Green
11W
Traffic signal turning arrows – 200mm LED 6
Traffic signal turning arrows – 300mm LED 14 Red 11W, Yellow 13W, Green
14W
Pedestrian Walk Sign LED 6
Intelligent Transport System components
Variable Speed Limit sign LED 320

Greenhouse Gas Assessment Workbook for Road Projects
GREENHOUSE GAS ASSESSMENT WORKBOOK FOR ROAD PROJECTS V6.DOCX Page 51
Application Lamp/ Signal Type
Initial Lumens Wattage Comments
Variable Message Sign LED 1,200
Camera 120
Ramp control lights 72
FRS Cabinets 150
Roadside Cabinets 200
Wireless distribution system 50
Source: LED Street Lights- http://www.ledlightingaustralia.net.au/LED-Street-Lighting-C16/ Source: Incandescent, QH & LED Traffic Lights - Aldridge Traffic Systems http://www.aldridgetraffic.com.au/traffic_signal_lanterns.html Source: Intelligent Transport System – VicRoads M1 information
6.4 Default quantity factors – operation
The Workbook provides an alternative method for determining emission source data quantities. The alternative method uses an indicator of activity level and default quantity factors to estimate the emission source data quantities. Default quantity factors can be used to estimate the usage of various components for various emission sources, should actual emission source data not be available or readily accessible.
The default quantity factors for operation have been developed using Australian and New Zealand road lighting standards and are based on ‘typical’ operational aspects. If a project uses an alternative equipment item or standard then the default quantity factors should not be used.
NOTE: The default quantity factors in the following tables should be used to estimate the quantities of electricity used, only when the actual usage data is not available.
Table 6-4 provides default factors for emission sources associated with the operation of street lights. Electricity usage is calculated for a 50 year period.
NOTE: The replacement of light globes is considered a minor maintenance activity and hence, the fuel usage associated with replacing light globes in not included in the default quantity factors above.
Table 6-4 Default quantity factors – street lights
Application Lamp Type
50 year electricity
consumption (kWh/m of
lights)
Comments
Freeway through carriageways
400W HPS or
MH 990
Assume 12 hours of operation per day, Category V3 road as per AS1158, spacing 89m, single outreach, lighting ONE side of road ONLY

Greenhouse Gas Assessment Workbook for Road Projects
Page 52 GREENHOUSE GAS ASSESSMENT WORKBOOK FOR ROAD PROJECTS V6.DOCX
Application Lamp Type
50 year electricity
consumption (kWh/m of
lights)
Comments
Freeway ramps and arterial roads
250W HPS or
MH 640
Assume 12 hours of operation per day, Category V3 road as per AS1158, spacing 86m, single outreach, lighting ONE side of road ONLY
Underpasses
- where lighting is required and soffit levels (clearances) are 10m or less
- also used to light slip lanes and municipal roads or where the use of 250W HPS is inefficient
150W HPS or
MH 600
Assume 12 hours of operation per day, Category V3 road as per AS1158, spacing 55m, single outreach, lighting ONE side of road ONLY
Source Data – AS 1158 & VicRoads Guidelines for Road Lighting Design
NOTE: The lighting design for tunnels is project specific. It depends on the entrance size, tunnel length and vision on approach. Dimming is also applied so that the light levels in the tunnel match those outside the tunnel. It is therefore not possible to develop meaningful default quantity factors for the lighting of tunnels
Table 6-5 provides default quantity factors for various types of intersections that utilise traffic signals. Electricity usage is for a 50 year period.
Table 6-5 Default quantity factors – Traffic signals for typical interchanges (LED)
Emission Source
No. Pede-stals
No. Turning Arrows
No. Pedestrian
walk signals
50 year electricity
consumption (kWh/
intersection)
Comments
Incandescent Traffic Signals
Major urban intersection - Divided Road
16 4 12 1,711,123 300mm vehicle lantern, 300mm turning lanterns, 200mm pedestrian lantern
Major intersection - Undivided Road
12 4 10 1,389,411 300mm vehicle lantern, 200mm pedestrian lantern
Freeway with divided road (full diamond interchange)
26 4 16 2,486,038 300mm vehicle lantern, 200mm pedestrian lantern
Quartz Halogen Traffic Signals
Major urban intersection - Divided Road
16 4 12 639,918 300mm vehicle lantern, 300mm turning lanterns, 200mm pedestrian lantern
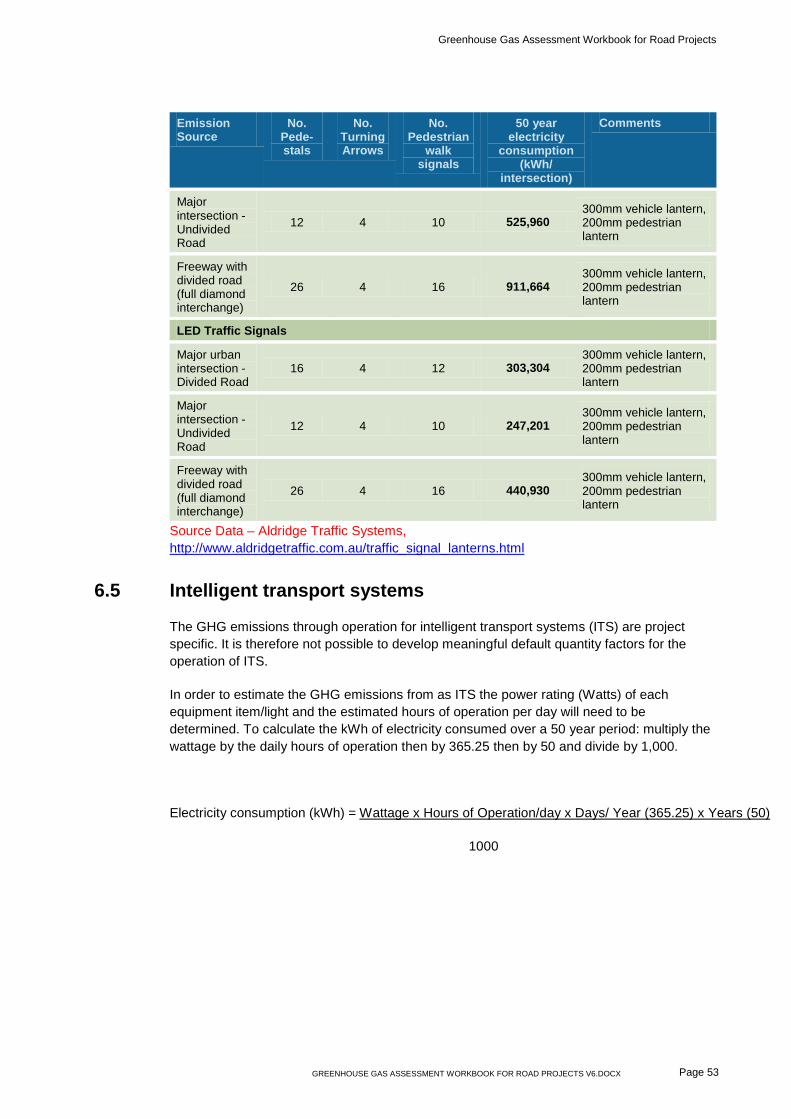
Greenhouse Gas Assessment Workbook for Road Projects
GREENHOUSE GAS ASSESSMENT WORKBOOK FOR ROAD PROJECTS V6.DOCX Page 53
Emission Source
No. Pede-stals
No. Turning Arrows
No. Pedestrian
walk signals
50 year electricity
consumption (kWh/
intersection)
Comments
Major intersection - Undivided Road
12 4 10 525,960 300mm vehicle lantern, 200mm pedestrian lantern
Freeway with divided road (full diamond interchange)
26 4 16 911,664 300mm vehicle lantern, 200mm pedestrian lantern
LED Traffic Signals
Major urban intersection - Divided Road
16 4 12 303,304 300mm vehicle lantern, 200mm pedestrian lantern
Major intersection - Undivided Road
12 4 10 247,201 300mm vehicle lantern, 200mm pedestrian lantern
Freeway with divided road (full diamond interchange)
26 4 16 440,930 300mm vehicle lantern, 200mm pedestrian lantern
Source Data – Aldridge Traffic Systems, http://www.aldridgetraffic.com.au/traffic_signal_lanterns.html
6.5 Intelligent transport systems
The GHG emissions through operation for intelligent transport systems (ITS) are project specific. It is therefore not possible to develop meaningful default quantity factors for the operation of ITS.
In order to estimate the GHG emissions from as ITS the power rating (Watts) of each equipment item/light and the estimated hours of operation per day will need to be determined. To calculate the kWh of electricity consumed over a 50 year period: multiply the wattage by the daily hours of operation then by 365.25 then by 50 and divide by 1,000.
Electricity consumption (kWh) = Wattage x Hours of Operation/day x Days/ Year (365.25) x Years (50)
1000

Greenhouse Gas Assessment Workbook for Road Projects
Page 54 GREENHOUSE GAS ASSESSMENT WORKBOOK FOR ROAD PROJECTS V6.DOCX
7. Module 4 – Maintenance Maintenance is considered to be post construction and includes activities that are intermittently required to keep the road assets at the required standard. Maintenance can be major (e.g. rehabilitation), planned/routine or reactive.
7.1 Maintenance GHG assessment boundary
Table 7-1 shows the Scope 1, 2 and 3 emission sources included within the maintenance GHG assessment boundary.
NOTE: Items in Table 7-1 in black are considered significant in ‘typical’ road projects and should be included in a GHG emissions assessment whilst those in orange might be significant – Refer to the Materiality Checklist in Appendix A for guidance on when these emission sources should be included in a GHG assessment.
Refer to the Supporting Document for a discussion on the materiality of road maintenance activities and the basis for excluding minor maintenance activities (i.e. planned/routine and reactive maintenance activities).
Figure 7.1 below shows the maintenance GHG assessment boundary and the activities and emission sources found to be significant (refer to Section 3.8 of the Supporting Document for further details of the materiality assessment for maintenance). All of the activities and emission sources considered within the maintenance GHG assessment boundary are shown in Figure 3.3 of the Supporting Document.
NOTE: Activities/emission sources with a dashed outline are those that may be significant for some road projects but insignificant for others.
Table 7-1 Emission sources to be included in GHG assessment of maintenance
Scope 1 Scope 2 Scope 3
Major Maintenance
Combustion of fuels in rehabilitation plant and equipment
Production and distribution of fuels used in rehabilitation plant and equipment
Production of materials used in major maintenance activities
Transport of materials used in major maintenance activities

Greenhouse Gas Assessment Workbook for Road Projects
GREENHOUSE GAS ASSESSMENT WORKBOOK FOR ROAD PROJECTS V6.DOCX Page 55
MaintenanceAssessment boundary
Note: A dashed outline indicates that the emission source/activity is not material for all road projects
Major Maintenance
Pavement
Transport of MaintenanceMaterials
Production of Maintenance Materials
AggregateAsphaltBitumentCement
ConcreteHot mix asphalt processing
energySteel
Sand (ingr.in concrete)Water (ingr.in concrete)
On Site Fuel for Plant and Equipment
Fuel Production and Distribution
Scope 1 Scope 2 Scope 3Activity
Production of Maintenance MaterialsSand (ingr.in concrete)Water (ingr.in concrete)
Transport of MaintenanceMaterials
Figure 7.1 Maintenance GHG assessment boundary
Greenhouse Gas Assessment Workbook for Road Projects
Page 56 GREENHOUSE GAS ASSESSMENT WORKBOOK FOR ROAD PROJECTS V6.DOCX
7.2 Maintenance emission sources and required data
Table 7-2 presents all of the activities and emission sources within the maintenance GHG assessment boundary that are considered significant. The data required for each emission source is also listed in Table 7-2.
Where the emission source (usage) data is not available (e.g. in the project scoping phase) the alternative emission source data and the associated default quantity factor(s) (refer to Section 7.3 below) may be used to estimate the emission source (usage) data.
NOTE: Items in Table 7-2 in black are considered significant in all ‘typical’ road projects and should be included in a GHG assessment whilst those in orange might be significant – Refer to the Materiality Checklist in Appendix A for guidance on when these emission sources should be included in a GHG assessment.
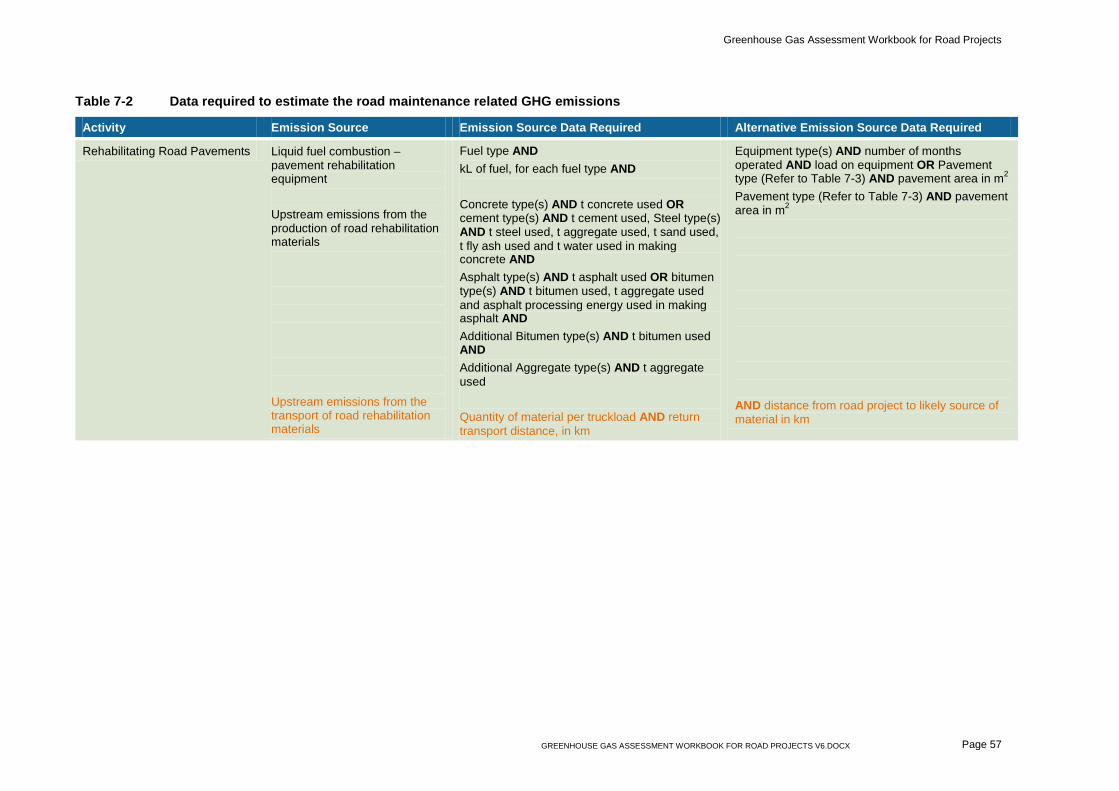
Greenhouse Gas Assessment Workbook for Road Projects
GREENHOUSE GAS ASSESSMENT WORKBOOK FOR ROAD PROJECTS V6.DOCX Page 57
Table 7-2 Data required to estimate the road maintenance related GHG emissions
Activity Emission Source Emission Source Data Required Alternative Emission Source Data Required
Rehabilitating Road Pavements Liquid fuel combustion – pavement rehabilitation equipment Upstream emissions from the production of road rehabilitation materials Upstream emissions from the transport of road rehabilitation materials
Fuel type AND kL of fuel, for each fuel type AND Concrete type(s) AND t concrete used OR cement type(s) AND t cement used, Steel type(s) AND t steel used, t aggregate used, t sand used, t fly ash used and t water used in making concrete AND Asphalt type(s) AND t asphalt used OR bitumen type(s) AND t bitumen used, t aggregate used and asphalt processing energy used in making asphalt AND Additional Bitumen type(s) AND t bitumen used AND Additional Aggregate type(s) AND t aggregate used Quantity of material per truckload AND return transport distance, in km
Equipment type(s) AND number of months operated AND load on equipment OR Pavement type (Refer to Table 7-3) AND pavement area in m2
Pavement type (Refer to Table 7-3) AND pavement area in m2
AND distance from road project to likely source of material in km
Greenhouse Gas Assessment Workbook for Road Projects
Page 58 GREENHOUSE GAS ASSESSMENT WORKBOOK FOR ROAD PROJECTS V6.DOCX
7.3 Default quantity factors – maintenance
The Workbook provides an alternative method for determining emission source data quantities. The alternative method uses an indicator of activity level and default quantity factors to estimate the emission source data quantities. Default quantity factors (DQFs) can be used to estimate the usage of various components for various emission sources, should actual usage data not be available or readily accessible.
The default quantity factors have been developed using cost estimating first principles in most cases and are based on ‘typical’ maintenance activities. If a project uses an alternative process or material then the default quantity factors should not be used.
NOTE: The default quantity factors in the following tables should be used to estimate the quantities of energy, fuel and materials used only when the actual usage data is not available.
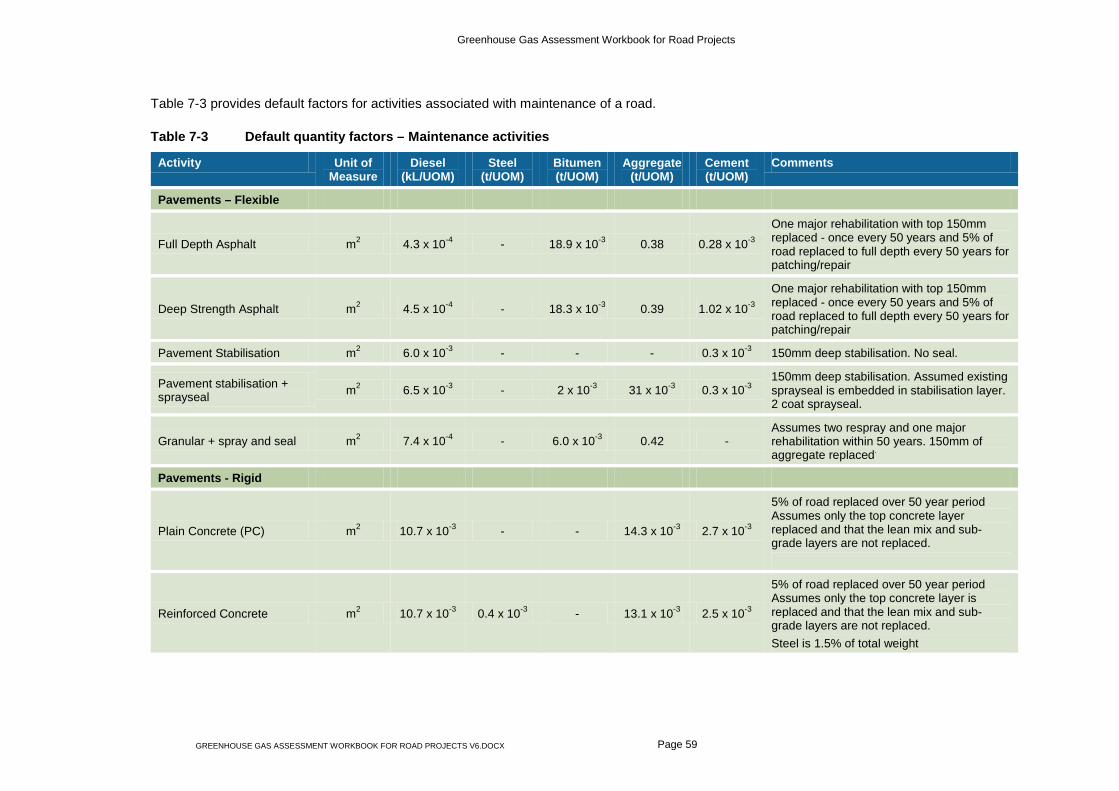
Greenhouse Gas Assessment Workbook for Road Projects
GREENHOUSE GAS ASSESSMENT WORKBOOK FOR ROAD PROJECTS V6.DOCX Page 59
Table 7-3 provides default factors for activities associated with maintenance of a road.
Table 7-3 Default quantity factors – Maintenance activities
Activity Unit of Measure
Diesel (kL/UOM)
Steel (t/UOM)
Bitumen (t/UOM)
Aggregate (t/UOM)
Cement (t/UOM)
Comments
Pavements – Flexible
Full Depth Asphalt m2 4.3 x 10⁻⁴ - 18.9 x 10⁻³ 0.38 0.28 x 10⁻³
One major rehabilitation with top 150mm replaced - once every 50 years and 5% of road replaced to full depth every 50 years for patching/repair
Deep Strength Asphalt m2 4.5 x 10⁻⁴ - 18.3 x 10⁻³ 0.39 1.02 x 10⁻³
One major rehabilitation with top 150mm replaced - once every 50 years and 5% of road replaced to full depth every 50 years for patching/repair
Pavement Stabilisation m2 6.0 x 10⁻³ - - - 0.3 x 10⁻³ 150mm deep stabilisation. No seal.
Pavement stabilisation + sprayseal m2 6.5 x 10⁻³ - 2 x 10⁻³ 31 x 10-3 0.3 x 10⁻³
150mm deep stabilisation. Assumed existing sprayseal is embedded in stabilisation layer. 2 coat sprayseal.
Granular + spray and seal m2 7.4 x 10⁻⁴ - 6.0 x 10⁻³ 0.42 - Assumes two respray and one major rehabilitation within 50 years. 150mm of aggregate replaced.
Pavements - Rigid
Plain Concrete (PC) m2 10.7 x 10⁻³ - - 14.3 x 10⁻³ 2.7 x 10⁻³
5% of road replaced over 50 year period Assumes only the top concrete layer replaced and that the lean mix and sub-grade layers are not replaced.
Reinforced Concrete m2 10.7 x 10⁻³ 0.4 x 10⁻³ - 13.1 x 10⁻³ 2.5 x 10⁻³
5% of road replaced over 50 year period Assumes only the top concrete layer is replaced and that the lean mix and sub-grade layers are not replaced. Steel is 1.5% of total weight
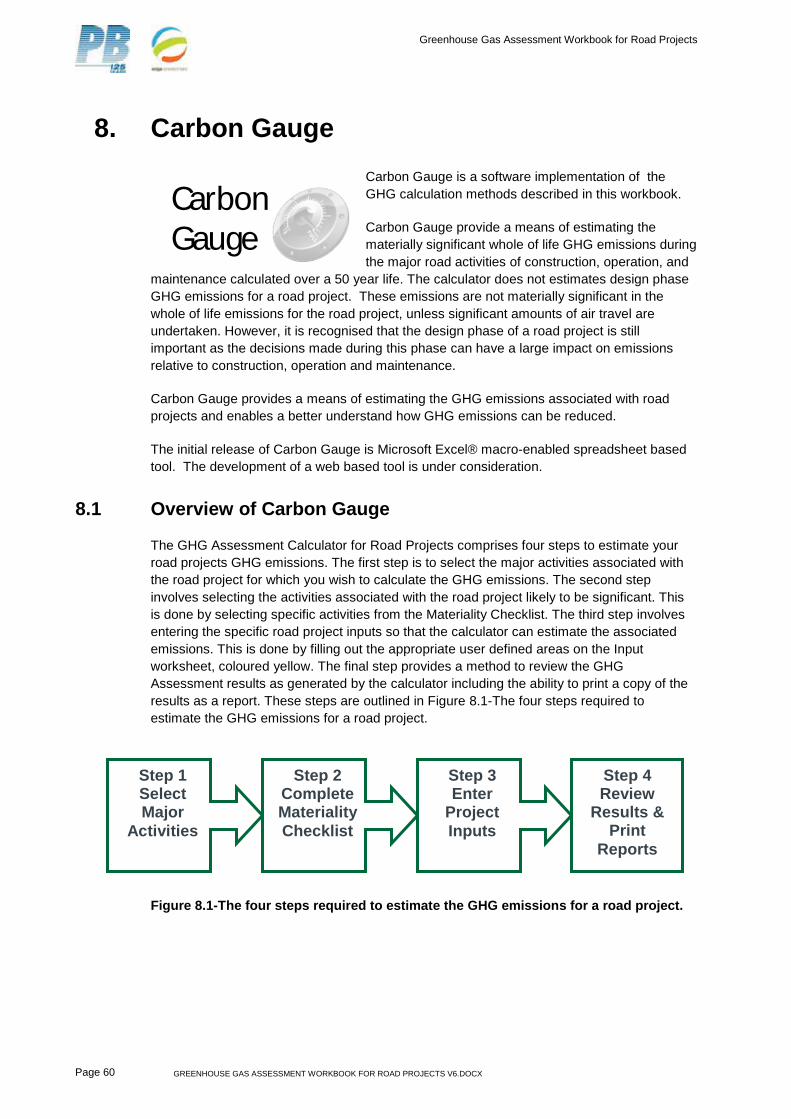
Greenhouse Gas Assessment Workbook for Road Projects
Page 60 GREENHOUSE GAS ASSESSMENT WORKBOOK FOR ROAD PROJECTS V6.DOCX
8. Carbon Gauge Carbon Gauge is a software implementation of the GHG calculation methods described in this workbook.
Carbon Gauge provide a means of estimating the materially significant whole of life GHG emissions during the major road activities of construction, operation, and
maintenance calculated over a 50 year life. The calculator does not estimates design phase GHG emissions for a road project. These emissions are not materially significant in the whole of life emissions for the road project, unless significant amounts of air travel are undertaken. However, it is recognised that the design phase of a road project is still important as the decisions made during this phase can have a large impact on emissions relative to construction, operation and maintenance.
Carbon Gauge provides a means of estimating the GHG emissions associated with road projects and enables a better understand how GHG emissions can be reduced.
The initial release of Carbon Gauge is Microsoft Excel® macro-enabled spreadsheet based tool. The development of a web based tool is under consideration.
8.1 Overview of Carbon Gauge
The GHG Assessment Calculator for Road Projects comprises four steps to estimate your road projects GHG emissions. The first step is to select the major activities associated with the road project for which you wish to calculate the GHG emissions. The second step involves selecting the activities associated with the road project likely to be significant. This is done by selecting specific activities from the Materiality Checklist. The third step involves entering the specific road project inputs so that the calculator can estimate the associated emissions. This is done by filling out the appropriate user defined areas on the Input worksheet, coloured yellow. The final step provides a method to review the GHG Assessment results as generated by the calculator including the ability to print a copy of the results as a report. These steps are outlined in Figure 8.1-The four steps required to estimate the GHG emissions for a road project.
Figure 8.1-The four steps required to estimate the GHG emissions for a road project.
Step 1 Select Major
Activities
Step 2 Complete Materiality Checklist
Step 3 Enter
Project Inputs
Step 4 Review
Results & Print
Reports
CarbonGauge

Greenhouse Gas Assessment Workbook for Road Projects
GREENHOUSE GAS ASSESSMENT WORKBOOK FOR ROAD PROJECTS V6.DOCX Page 61
8.2 The Carbon Gauge Menu
At the top of the Calculator Menu is a selection of options that allow you to either access help, view the About screen, exit or reset the form. This is shown in Figure 8.2 – Carbon Gauge Menu, along with descriptions of the button functions
8.3 Entering information into Carbon Gauge
The user can enter information in cells coloured Yellow. Data cannot be entered into any other cells in the calculator. Grey cells indicate information that is calculated by the GHG Assessment Calculator while Dark Grey cells indicated a cell is not available for input This is usually because the option for this component to be assessed has not been selected from the Materiality Checklist.
Figure 8.3 - Key for entering data input the calculator.
8.4 Overview of GHG Emissions
Table 8-1-The scope of GHG emissions estimated by the calculator. provides a summary explanation of the GHG emissions associated with a road project and estimated by the calculator. For a more detailed explanation of the GHG emissions associated with road projects see Section 2.3.1.
Scope 1 emissions Emissions released into the atmosphere as a direct result of an activity, or series of activities (including ancillary activities) that constitutes the facility.
Scope 2 emissions Emissions released as a result of one or more activities that generate electricity, heating, cooling or steam that is consumed by the facility but that do no form part of the facility.
Scope 3 emissions Emissions that occur outside the site boundary of a facility as a result of activities at a facility that are not Scope 2 emissions.
Table 8-1-The scope of GHG emissions estimated by the calculator.
Press this button to view the About screen showing version
number information and release notes
Press the Help button for information about the GHG Summary Report
Press this button to close the calculator; you will be prompted to save the workbook if not already saved.
Press the Reset Form button to clear all data from the form and reset to default state
Figure 8.2 – Carbon Gauge Menu

Greenhouse Gas Assessment Workbook for Road Projects
Page 62 GREENHOUSE GAS ASSESSMENT WORKBOOK FOR ROAD PROJECTS V6.DOCX

Appendix A Checklists


Appendix A Checklists
GREENHOUSE GAS ASSESSMENT WORKBOOK FOR ROAD PROJECTS V6.DOCX Page A.1
GHG assessment checklist
Check off each task as you complete it to ensure that your GHG emissions assessment is as comprehensive as possible.
TASK YES/NO/NA
1. Set the project assessment boundary
2. Identify the activities and emission sources applicable to the road project
3. Use the Materiality Checklist from Appendix A to determine which emission sources are significant and should be included in the GHG assessment for this road project
4. Collect activity (usage) data for each of the emission sources identified in Step 2.
5. Check that the data is in the correct Units Of Measurement (UOM)
6. If the data is not in the correct UOM, apply appropriate conversion factors.
7. If there is data missing for any of the emission sources listed, collect the alternative activity data listed in Table 5.2, 6.2 and 7.2 .
8. Choose the appropriate default quantity factors from Table 5.3-5.11, 6.4-6.5 and 7.3 for each emission source where the activity data is not available
9. Estimate quantities using the alternative activity data and the default quantity factors to fill the gaps in your activity data.
10. Select the emission factor for each emission source from Appendix D
11. Calculate the GHG emissions for each emission source using the formula in Section 3.2.
12. For loss of sequestration, utilise the process outlined in Appendix E
13. Sum all emissions together to obtain an estimate of the total GHG impact of your road project.
14. Record your assessment results, along with the date of the assessment and project details using the Example Reporting Template in Appendix B.

Greenhouse Gas Assessment Workbook for Road Projects
Page A 2 GREENHOUSE GAS ASSESSMENT WORKBOOK FOR ROAD PROJECTS V6.DOCX
Materiality checklist
Define your road project and review against the materiality checklist below to determine whether certain emission sources are likely to be significant.
Activity/Emission Source Yes No Emission source to be included in GHG Assessment
Construction
Will a diesel generator be used to provide power to the project site office for more than 12 months?
If yes, include fuel combusted in powering site offices
Will more than 120 buildings be required to be demolished per 1km of road?
If yes, include fuel combusted in demolishing buildings
Will more than 0.5 hectares of vegetation (5000 m2) be removed?
If yes, include vegetation removal
Will the project involve tunnelling? If yes, include electricity consumption and explosives used
Is the project located more than 50 km from the nearest material suppliers/quarry/city?
If yes, include the emissions associated with the transport of materials to site
Will the project utilise on-site batching plants or other continuously operating stationary plant and equipment for more than 6 months?
If yes, include fuel combusted in stationary engines
Will the project include road safety barriers along > 50% of the road length if barriers are used on both sides of a dual carriageway (i.e. 4 sets) or 100% of the road length if used on both side of a single carriageway (i.e. two sets)?
If yes, include the emissions from the construction and installation of road safety barriers
Will the project include noise walls along more than 50% of the road length (both sides)?
If yes, include the emissions from the construction and installation of noise walls
Operation
Will the project include lighting continuously along greater than:
15% of the road length (VIC) 20% of the road length (ACT, NSW, QLD,WA,NT) 25% of the road length (SA) 70% of the road length (TAS) 100% of the road length (NZ)?
If yes, include the emissions from the operation of street lighting
Will the project include traffic signals and/or interchanges using incandescent lights that are less than:
14.9 km apart (VIC) 11.5 km apart (ACT, NSW, QLD, NT) 8.0 km apart (SA, WA ) 3.1 km apart (TAS) 1.7 km apart (NZ)?
If yes, include the emissions from the operation of incandescent traffic signals
Will the project include traffic signals and/or interchanges using quartz halogen lights that are less than:
5.6 km apart (VIC) 4.5 km apart (ACT, NSW, QLD, NT) 3.5 km apart (SA, WA) 1.3 km apart (TAS) 0.6 km apart (NZ)?
If yes, include the emissions from the operation of quartz halogen traffic signals
Will the project include traffic signals and/or interchanges using LED lights that are less than:
2.7 km apart (VIC)
If yes, include the emissions from the operation of LED traffic signals

Appendix A Checklists
GREENHOUSE GAS ASSESSMENT WORKBOOK FOR ROAD PROJECTS V6.DOCX Page A.3
2.0 km apart (ACT, NSW, QLD) 1.8 km apart (SA, WA, NT) 0.6 km apart (TAS) 0.3 km apart (NZ)?
Will the project include emissions from vehicles using the road during its 50 year life?
If yes, include the emissions from vehicles using the road over the 50 year life of the road project.
NOTE: The above materiality checklist was developed based on a ‘typical’ GHG emission profile of 0.25 t CO2-e/m2 of pavement. Where items run the length of a road, a pavement width of 20m was assumed to establish the t CO2-e/m2 of pavement for an item. Where items are independent of road length a road length of 1km and pavement width of 20m was used to establish the t CO2-e/m2 of pavement for an item. This is being progressively examined in light of results determined to date, which look to be lower than this 0.25 t CO2-e/m2 figure. Exceptions are noted for vegetation, transportation and lighting as shown in Section 3.6 and 3.7 of the supporting document..

Appendix A
Checklists
GREENHOUSE GAS ASSESSMENT WORKBOOK FOR ROAD PROJECTS V6.DOCX Page A.4
Emission sources and data checklist - Construction
Use this checklist to record whether you have collected the required data or alternative data; and the corresponding data sources.
n Is the required data available? 4 YES Record the activity data, units of measurement and the source of the data 4 NO Identify appropriate alternative activity data and default quantity factors, estimate the quantity and record your data source
4 N/A Activity or emission source is not applicable to the road project or not significant
Activity Emission Source Emission Source Data Required Fuel/ Material Type Emission Source Data Unit of Measure Data source/location
Site offices – Refer to Table 5.3
Site offices Liquid fuel combustion – electricity generation
Fuel type AND kL of fuel, for each fuel type
Site vehicles and plant – Refer to Tables 5.3, 5.4 and 5.5
Site vehicles Liquid fuel combustion – site and staff vehicles
Fuel type AND kL of fuel, for each fuel type
Site plant & equipment
Liquid fuel combustion – site plant and equipment
Fuel type AND kL of fuel, for each fuel type
Demolition and earthworks – Refer to Tables 5.6, 5.7 and Appendix E
Demolition Liquid fuel combustion – demolition equipment
Fuel type AND kL of fuel, for each fuel type
Vegetation removal
Liquid fuel combustion – vegetation removal equipment e.g. graders, front end loaders
Fuel type AND kL of fuel, for each fuel type
Lost carbon sink from the removal of vegetation
AUS: Biomass Category from map AND Area of vegetation removed in hectares by vegetation category NZ: Vegetation type AND Area of vegetation removed in hectares
Downstream emissions from the transport of vegetation offsite
Quantity of vegetation per truckload AND return transport distance, in km
Decomposition of vegetation in an offsite landfill
Type of vegetation removed AND t of vegetation disposed in an offsite landfill
Earthmoving equipment
Liquid fuel combustion – earthmoving equipment
Fuel type AND kL of fuel, for each type
Earthworks - Tunnels
Electricity consumption - on-site excavation equipment (e.g. tunnel boring machines and ventilation)
State/Region AND kWh of electricity consumed

Appendix A
Checklists
GREENHOUSE GAS ASSESSMENT WORKBOOK FOR ROAD PROJECTS V6.DOCX Page A.5
Activity Emission Source Emission Source Data Required Fuel/ Material Type Emission Source Data Unit of Measure Data source/location
Pavements – Refer to Table 5.8
Road Pavements
Liquid fuel combustion – pavement construction equipment Upstream emissions from the production of road construction materials Upstream emissions from the transport of road construction materials
Fuel type AND kL of fuel, for each fuel type AND Concrete type(s) AND t concrete used OR cement type(s) AND t cement used, Steel type(s) AND t steel used, t aggregate used, t sand used, t fly ash used and t water used in making concrete AND Asphalt type(s) AND t asphalt used OR bitumen type(s) AND t bitumen used, t aggregate used and asphalt processing energy used in making asphalt AND Additional Bitumen type(s) AND t bitumen used AND Additional Aggregate type(s) AND t aggregate used AND Lime type(s) AND t lime used AND Quantity of material per truckload AND return transport distance, in km
Sealing Liquid fuel combustion – pavement sealing equipment Upstream emissions from the production of road sealing materials Upstream emissions from the transport of road sealing materials
Fuel type AND kL of fuel, for each fuel type AND Asphalt type(s) AND t asphalt used OR bitumen type(s) AND t bitumen used, t aggregate used and asphalt processing energy used in making asphalt AND Quantity of material per truckload AND return transport distance, in km
Other pavements (e.g. median and traffic islands, footpaths etc.)
Liquid fuel combustion – other pavement construction equipment Upstream emissions from the production of other pavement construction materials Upstream emissions from the transport of other pavement materials
Fuel type AND kL of fuel, for each fuel type AND Concrete type(s) AND t concrete used OR cement type(s) AND t cement used, Steel type(s) AND t steel used, t aggregate used, t sand used, t fly ash used and t water used in making concrete AND Asphalt type(s) AND t asphalt used OR bitumen type(s) AND t bitumen used, t aggregate used and asphalt processing energy used in making asphalt AND Quantity of material per truckload AND return transport distance, in km
Stationary Plant and equipment
Liquid fuel combustion – stationary engines (e.g. batching plants)
Fuel type AND kL of fuel, for each fuel type

Appendix A
Checklists
GREENHOUSE GAS ASSESSMENT WORKBOOK FOR ROAD PROJECTS V6.DOCX Page A.6
Activity Emission Source Emission Source Data Required Fuel/ Material Type Emission Source Data Unit of Measure Data source/location
Structures
Bridges (including inter-changes and overpasses)
Liquid fuel combustion – bridge construction Upstream emissions from the production of bridge construction materials Upstream emissions from the transport of bridge construction materials
Fuel type AND kL of fuel, for each fuel type AND Concrete type(s) AND t concrete used OR cement type(s) AND t cement used, Steel type(s) AND t steel used, t aggregate used, t sand used and t water used in making concrete AND Additional Aggregate type(s) AND t aggregate used AND Additional steel type(s) AND t steel used Quantity of material per truckload AND return transport distance, in km
Reinforced Soil walls
Liquid fuel combustion – reinforced soil wall construction Upstream emissions from the production of reinforced soil wall construction materials Upstream emissions from the transport of reinforced soil wall materials
Fuel type AND kL of fuel, for each fuel type AND Concrete type(s) AND t concrete used OR cement type(s) AND t cement used, Steel type(s) AND t steel used, t aggregate used, t sand used, t fly ash used and t water used in making concrete AND Steel type(s) AND t steel used Quantity of material per truckload AND return transport distance, in km
Retaining walls
Liquid fuel combustion – retaining wall construction Upstream emissions from the production of retaining wall construction materials Upstream emissions from the transport of retaining wall construction materials
Fuel type AND kL of fuel, for each type AND Concrete type(s) AND t concrete used OR cement type(s) AND t cement used, Steel type(s) AND t steel used, t aggregate used, t sand used, t fly ash used and t water used in making concrete OR Timber type(s) AND t timber used OR Rock types AND t rock used AND Steel type(s) AND t steel used Quantity of material per truckload AND return transport distance, in km
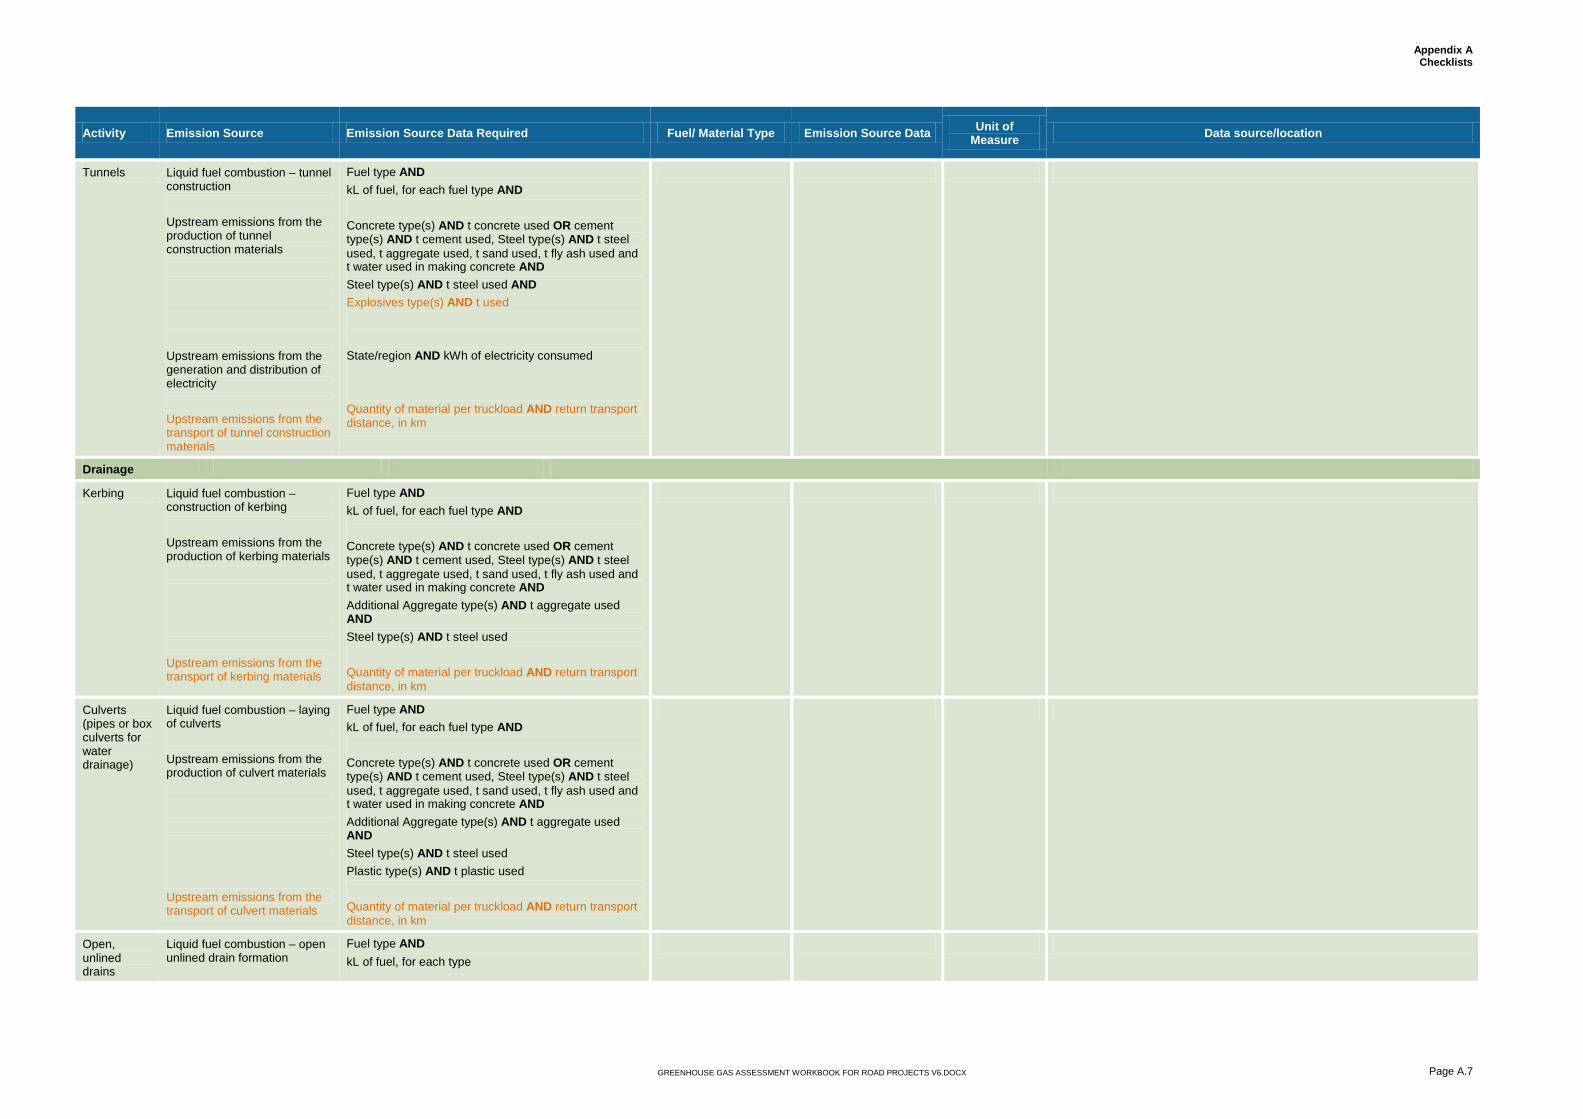
Appendix A
Checklists
GREENHOUSE GAS ASSESSMENT WORKBOOK FOR ROAD PROJECTS V6.DOCX Page A.7
Activity Emission Source Emission Source Data Required Fuel/ Material Type Emission Source Data Unit of Measure Data source/location
Tunnels Liquid fuel combustion – tunnel construction Upstream emissions from the production of tunnel construction materials Upstream emissions from the generation and distribution of electricity Upstream emissions from the transport of tunnel construction materials
Fuel type AND kL of fuel, for each fuel type AND Concrete type(s) AND t concrete used OR cement type(s) AND t cement used, Steel type(s) AND t steel used, t aggregate used, t sand used, t fly ash used and t water used in making concrete AND Steel type(s) AND t steel used AND Explosives type(s) AND t used State/region AND kWh of electricity consumed Quantity of material per truckload AND return transport distance, in km
Drainage
Kerbing Liquid fuel combustion –construction of kerbing Upstream emissions from the production of kerbing materials Upstream emissions from the transport of kerbing materials
Fuel type AND kL of fuel, for each fuel type AND Concrete type(s) AND t concrete used OR cement type(s) AND t cement used, Steel type(s) AND t steel used, t aggregate used, t sand used, t fly ash used and t water used in making concrete AND Additional Aggregate type(s) AND t aggregate used AND Steel type(s) AND t steel used Quantity of material per truckload AND return transport distance, in km
Culverts (pipes or box culverts for water drainage)
Liquid fuel combustion – laying of culverts Upstream emissions from the production of culvert materials Upstream emissions from the transport of culvert materials
Fuel type AND kL of fuel, for each fuel type AND Concrete type(s) AND t concrete used OR cement type(s) AND t cement used, Steel type(s) AND t steel used, t aggregate used, t sand used, t fly ash used and t water used in making concrete AND Additional Aggregate type(s) AND t aggregate used AND Steel type(s) AND t steel used Plastic type(s) AND t plastic used Quantity of material per truckload AND return transport distance, in km
Open, unlined drains
Liquid fuel combustion – open unlined drain formation
Fuel type AND kL of fuel, for each type

Appendix A
Checklists
GREENHOUSE GAS ASSESSMENT WORKBOOK FOR ROAD PROJECTS V6.DOCX Page A.8
Activity Emission Source Emission Source Data Required Fuel/ Material Type Emission Source Data Unit of Measure Data source/location
Road Furniture
Road safety barriers
Liquid fuel combustion – road safety barrier installation Upstream emissions from the production of road safety barriers Upstream emissions from the transport of road safety barrier materials
Fuel type AND kL of fuel, for each fuel type AND Concrete type(s) AND t concrete used OR cement type(s) AND t cement used, Steel type(s) AND t steel used, t aggregate used, t sand used, t fly ash used and t water used in making concrete AND Additional Steel type(s) AND t steel used Quantity of material per truckload AND return transport distance, in km
Noise Walls Liquid fuel combustion – noise wall construction Upstream emissions from the production of noise wall materials Upstream emissions from the transport of noise wall materials
Fuel type AND kL of fuel, for each type AND Concrete type(s) AND t concrete used OR cement type(s) AND t cement used, Steel type(s) AND t steel used, t aggregate used, t sand used, t fly ash used and t water used in making concrete OR t Hebel used AND Additional steel type(s) AND t steel used Quantity of material per truckload AND return transport distance, in km
GREENHOUSE GAS ASSESSMENT WORKBOOK FOR ROAD PROJECTS V6.DOCX Page B.9
Appendix B GHG emissions reporting templates


Appendix B
Reporting Template - Construction
GREENHOUSE GAS ASSESSMENT WORKBOOK FOR ROAD PROJECTS V6.DOCX Page B.1
Reporting Template
Use this template to record the results of the GHG assessment.
Construction - Pavements Scope 1 Scope 2 Scope 3 TotalFuel combustion - pavement constuction plant & equipmentMaterial usage - aggregateMaterial usage - concreteMaterial usage - cementMaterial usage - sand/gravelMaterial usage - steelMaterial usage - hot mix asphaltMaterial usage - bitumenMaterial usage - hot mix asphalt processing energyMaterial usage - limeTransport of materials to siteElectricity consumption (tunnels only)Other Other Total
Construction - Structures (e.g. bridges, interchanges etc) Scope 1 Scope 2 Scope 3 TotalFuel combustion - structures constuction plant & equipmentMaterial usage - aggregateMaterial usage - concreteMaterial usage - cementMaterial usage - sand/gravelMaterial usage - steelMaterial usage - hot mix asphaltMaterial usage - bitumenMaterial usage - hot mix asphalt processing energyMaterial usage - limeTransport of materials to siteOther Other Total
Construction - Drainage Scope 1 Scope 2 Scope 3 TotalFuel combustion - drainage constuction plant & equipmentMaterial usage - aggregateMaterial usage - concreteMaterial usage - cementMaterial usage - sand/gravelMaterial usage - steelMaterial usage - limeTransport of materials to siteOther Other Total
Construction - Road Furniture Scope 1 Scope 2 Scope 3 TotalFuel combustion - road furniture constuction plant & equipmentMaterial usage - aggregateMaterial usage - concreteMaterial usage - cementMaterial usage - sand/gravelMaterial usage - steelMaterial usage - timberMaterial usage - limeTransport of materials to siteOther Other Total
GHGe Summary by activity- Operation Scope 1 Scope 2 Scope 3 TotalStreet LightingTraffic SignalsIntelligent Transport System (ITS)Total
GHGe Summary by emission source - Operation Scope 1 Scope 2 Scope 3 TotalElectricity consumption - street lightingElectricity consumption - traffic signalsElectricity consumption - ITSOtherOtherTotal
GHGe Summary by activity- Maintenance Scope 1 Scope 2 Scope 3 TotalMajor MaintenanceOtherTotal
GHGe Summary by emission source - Maintenance Scope 1 Scope 2 Scope 3 TotalFuel combustion - plant & equipmentMaterial usage - aggregateMaterial usage - concreteMaterial usage - cementMaterial usage - sand/gravelMaterial usage - steelMaterial usage - hot mix asphaltMaterial usage - bitumenMaterial usage - hot mix asphalt processing energyOtherOtherOtherOtherTotal


GREENHOUSE GAS ASSESSMENT WORKBOOK FOR ROAD PROJECTS V6.DOCX Page C.1
Appendix C Conversion factors


Appendix C Conversion factors
GREENHOUSE GAS ASSESSMENT WORKBOOK FOR ROAD PROJECTS V6.DOCX Page B.1
Conversion factors Measurement Conversion factors
1 Watt = 1 Joule/Sec
3600 Watt-seconds = 1 Watt-hour (3600 seconds in one hour)
1 Watt-hour = 3600 Joules
1000 Watt-hours = 1Kilowatt hour (kWh)
1 kWh = 3.6 x 10⁶ Joules = 3.6 MJ
1 kWh = 3.6 x 10⁻³ GJ
1 GJ = 278 kWh
1 PJ = 278 x 106 kWh = 278 GWh
1 ha = 10,000 m2
1 m2 = 0.0001
(A) For conversion from first unit to second unit:
(B) Multiply quantity in first unit by conversion factor:
(C) To calculate quantity in second unit:
kWh to J kWh x 3.6 x 10⁶ Joules
J to kWh J x 1/3.6 x 10-6 kWh
kWh to MJ kWh x 3.6 MJ
MJ to kWh MJ x 0.278 kWh
kWh to GJ kWh x 3.6 x 10⁻³ GJ
GJ to kWh GJ x 278 kWh
kWh to PJ kWh x 3.6 x 10⁻⁹ PJ
PJ to kWh PJ x 278 x 106 kWh
Density Conversion factors Density (kg/m3)
Aggregate - Quarried 2,240
Aggregate - Recycled 1,920
Aluminium - General 2,700
Asphalt 2,300
Bitumen 1,000
Bricks 1,920
Cement - Portland 1,860
Cement General – 25% fly ash 1,860
Cement General – 50% fly ash 1,860
Cement General – 25% blast furnace slag 1,860
Cement General – 50% blast furnace slag 1,860
Clay tiles 1,900
Concrete - reinforced 2,300

Appendix C Conversion factors
GREENHOUSE GAS ASSESSMENT WORKBOOK FOR ROAD PROJECTS V6.DOCX Page B.2
Density Conversion factors Density (kg/m3)
Copper 8,600
Diesel 836
Fuel Oil 848
Glass 2,500
Kerosene 837
LPG 520
Petrol (gasoline) 669
Plastic - General 960
Plastic - Polyethylene 900
Plastic - PVC 1,380
Sand 2,240
Soil - common 1,460
Steel – general, section, sheet , wire, stainless 7,800
Steel – bar and rod 7,900
Timber - Softwood (e.g. pine) 510
Timber- Hardwood 800
Timber - Plywood 700
Source: UK, Bath Inventory, version 2.0 (2011)

GREENHOUSE GAS ASSESSMENT WORKBOOK FOR ROAD PROJECTS V6.DOCX Page D.1
Appendix D Emission factors

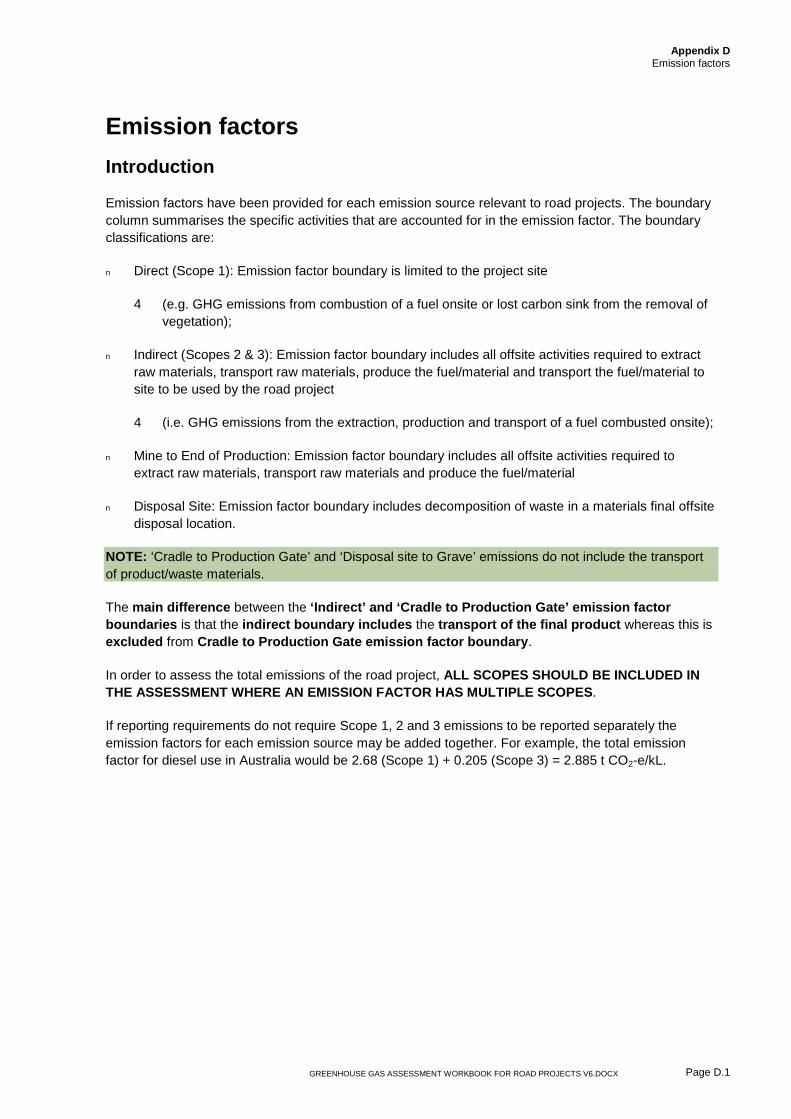
Appendix D
Emission factors
GREENHOUSE GAS ASSESSMENT WORKBOOK FOR ROAD PROJECTS V6.DOCX Page D.1
Emission factors Introduction
Emission factors have been provided for each emission source relevant to road projects. The boundary column summarises the specific activities that are accounted for in the emission factor. The boundary classifications are:
n Direct (Scope 1): Emission factor boundary is limited to the project site
4 (e.g. GHG emissions from combustion of a fuel onsite or lost carbon sink from the removal of vegetation);
n Indirect (Scopes 2 & 3): Emission factor boundary includes all offsite activities required to extract raw materials, transport raw materials, produce the fuel/material and transport the fuel/material to site to be used by the road project
4 (i.e. GHG emissions from the extraction, production and transport of a fuel combusted onsite);
n Mine to End of Production: Emission factor boundary includes all offsite activities required to extract raw materials, transport raw materials and produce the fuel/material
n Disposal Site: Emission factor boundary includes decomposition of waste in a materials final offsite disposal location.
NOTE: ‘Cradle to Production Gate’ and ‘Disposal site to Grave’ emissions do not include the transport of product/waste materials.
The main difference between the ‘Indirect’ and ‘Cradle to Production Gate’ emission factor boundaries is that the indirect boundary includes the transport of the final product whereas this is excluded from Cradle to Production Gate emission factor boundary.
In order to assess the total emissions of the road project, ALL SCOPES SHOULD BE INCLUDED IN THE ASSESSMENT WHERE AN EMISSION FACTOR HAS MULTIPLE SCOPES.
If reporting requirements do not require Scope 1, 2 and 3 emissions to be reported separately the emission factors for each emission source may be added together. For example, the total emission factor for diesel use in Australia would be 2.68 (Scope 1) + 0.205 (Scope 3) = 2.885 t CO2-e/kL.

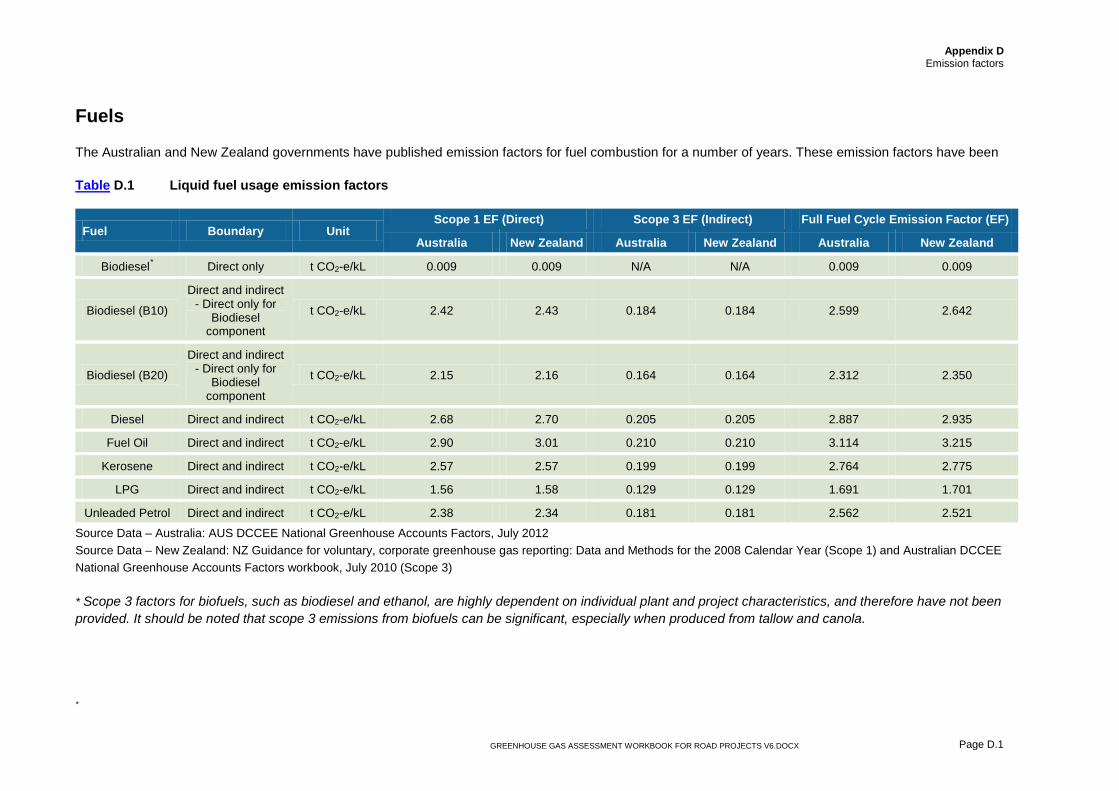
Appendix D
Emission factors
GREENHOUSE GAS ASSESSMENT WORKBOOK FOR ROAD PROJECTS V6.DOCX Page D.1
Fuels
The Australian and New Zealand governments have published emission factors for fuel combustion for a number of years. These emission factors have been
Table D.1 Liquid fuel usage emission factors
Fuel Boundary Unit Scope 1 EF (Direct) Scope 3 EF (Indirect) Full Fuel Cycle Emission Factor (EF)
Australia New Zealand Australia New Zealand Australia New Zealand
Biodiesel* Direct only t CO2-e/kL 0.009 0.009 N/A N/A 0.009 0.009
Biodiesel (B10)
Direct and indirect - Direct only for
Biodiesel component
t CO2-e/kL 2.42 2.43 0.184 0.184 2.599 2.642
Biodiesel (B20)
Direct and indirect - Direct only for
Biodiesel component
t CO2-e/kL 2.15 2.16 0.164 0.164 2.312 2.350
Diesel Direct and indirect t CO2-e/kL 2.68 2.70 0.205 0.205 2.887 2.935
Fuel Oil Direct and indirect t CO2-e/kL 2.90 3.01 0.210 0.210 3.114 3.215
Kerosene Direct and indirect t CO2-e/kL 2.57 2.57 0.199 0.199 2.764 2.775
LPG Direct and indirect t CO2-e/kL 1.56 1.58 0.129 0.129 1.691 1.701
Unleaded Petrol Direct and indirect t CO2-e/kL 2.38 2.34 0.181 0.181 2.562 2.521
Source Data – Australia: AUS DCCEE National Greenhouse Accounts Factors, July 2012 Source Data – New Zealand: NZ Guidance for voluntary, corporate greenhouse gas reporting: Data and Methods for the 2008 Calendar Year (Scope 1) and Australian DCCEE National Greenhouse Accounts Factors workbook, July 2010 (Scope 3) * Scope 3 factors for biofuels, such as biodiesel and ethanol, are highly dependent on individual plant and project characteristics, and therefore have not been provided. It should be noted that scope 3 emissions from biofuels can be significant, especially when produced from tallow and canola.
*

Appendix D
Emission factors
GREENHOUSE GAS ASSESSMENT WORKBOOK FOR ROAD PROJECTS V6.DOCX Page D.2
Table D.2 Gaseous fuel usage emission factors
Fuel Boundary Unit Emission Factor (EF)
ACT NSW VIC SA WA NT QLD TAS New Zealand
Metro
Natural gas – Scope 1
Direct t CO2-e/GJ 51.3 x10⁻³ 51.3 x10⁻³ 51.3 x10⁻³ 51.3 x10⁻³ 51.3 x10⁻³ 51.3 x10⁻³ 51.3 x10⁻³ 51.3 x10⁻³ 53.4 x10⁻³
Natural gas – Scope 3
Indirect t CO2-e/GJ 14.2 x10⁻³ 14.2 x10⁻³ 4 x10⁻³ 10.4 x10⁻³ 4 x10⁻³ N/A 8.6 x10⁻³ N/A 5.342 x10⁻³
Natural Gas - metro – Full Fuel Cycle
Direct and Indirect t CO2-e/GJ 65.5 x10⁻³ 65.5 x10⁻³ 55.3 x10⁻³ 61.7 x10⁻³ 55.3 x10⁻³ N/A 59.9 x10⁻³ N/A 58.74 x10⁻³
Non-Metro
Natural gas – Scope 1
Direct t CO2-e/GJ 51.3 x10⁻³ 51.3 x10⁻³ 51.3 x10⁻³ 51.3 x10⁻³ 51.3 x10⁻³ 51.3 x10⁻³ 51.3 x10⁻³ 51.3 x10⁻³ 53.4 x10⁻³
Natural gas– Scope 3
Indirect t CO2-e/GJ 15 x10-3 15 x10-3 4 x10⁻³ 10.2 x10⁻³ 3.9 x10⁻³ N/A 7.8 x10⁻³ N/A 5.342 x10⁻³
Natural Gas – non-metro – Full Fuel Cycle
Direct and Indirect t CO2-e/GJ 66.3 x10⁻³ 66.3 x10⁻³ 55.3 x10⁻³ 61.5 x10⁻³ 55.2 x10⁻³ N/A 59.1 x10⁻³ N/A 58.74 x10⁻³
Source Data – Australia: AUS DCCEE National Greenhouse Accounts Factors, July 2012 Source Data – New Zealand: NZ Guidance for voluntary, corporate greenhouse gas reporting: Data and Methods for the 2008 Calendar Year

Appendix D
Emission factors
GREENHOUSE GAS ASSESSMENT WORKBOOK FOR ROAD PROJECTS V6.DOCX Page D.3
Electricity
Emission factors for electricity consumption are published by both the Australian and New Zealand governments. These emission factors have been used where available.
Table D.3 Electricity Scope 2 and 3 emission factors
Electricity Boundary Unit Emission Factor (EF)
ACT NSW VIC SA WA NT QLD TAS New Zealand
Electricity – Scope 2
Indirect t CO2-e/kWh 0.88 x10⁻³ 0.88 x10⁻³ 1.19 x10⁻³ 0.65 x10⁻³ 0.82 x10⁻³ 0.71 x10⁻³ 0.86 x10⁻³ 0.26 x10⁻³ 0.137 x10⁻³
Electricity – Scope 3
Indirect t CO2-e/kWh 0.18 x10⁻³ 0.18 x10⁻³ 0.14 x10⁻³ 0.14 x10⁻³ 0.10 x10⁻³ 0.12 x10⁻³ 0.14 x10⁻³ 0.02 x10⁻³ 0.01 x10⁻³
Electricity – Full fuel cycle
Indirect t CO2-e/kWh 1.06 x10⁻³ 1.06 x10⁻³ 1.34 x10⁻³ 0.79 x10⁻³ 0.92 x10⁻³ 0.98 x10⁻³ 0.98 x10⁻³ 0.28 x10⁻³ 0.15 x10⁻³
Source Data – Australia: AUS DCCEE National Greenhouse Accounts Factors, July 2012 Source Data – New Zealand: NZ Guidance for voluntary, corporate greenhouse gas reporting: Data and Methods for the 2008 Calendar Year

Appendix D
Emission factors
GREENHOUSE GAS ASSESSMENT WORKBOOK FOR ROAD PROJECTS V6.DOCX Page D.4
Construction Materials
Table D.4 Construction Material emission factors
Material Boundary Unit Scope 3 Emission Factor (EF)
Australia New Zealand
Aggregate†
Aggregate (e.g. crushed rock) Mine to End of Production t CO2-e/t 0.005 0.002
Sand Mine to End of Production t CO2-e/t 0.003 0.007
Crushed Brick/Glass/Concrete Mine to End of Production t CO2-e/t 0.004 0.002
Recycled Asphalt Pavement (RAP) Mine to End of Production t CO2-e/t 0.009 0.009
Aluminium
Primary Aluminium Mine to End of Production t CO2-e/t 20.68 8.0
100% Recycled Aluminium Mine to End of Production t CO2-e/t 1.66 0.62
Asphalt & Bitumen
Hot Mix Asphalt (400 MJ/t) Mine to End of Production t CO2-e/t 0.058 0.015
Hot Mix Asphalt (400 MJ/t) 10% RAP Mine to End of Production t CO2-e/t 0.057 N/A
Hot Mix Asphalt (400 MJ/t) 20% RAP Mine to End of Production t CO2-e/t 0.056 N/A
Hot Mix Asphalt (400 MJ/t) 30% RAP Mine to End of Production t CO2-e/t 0.055 N/A
Hot Mix Asphalt (400 MJ/t) 40% RAP Mine to End of Production t CO2-e/t 0.054 N/A
Hot Mix Asphalt (400 MJ/t) 50% RAP Mine to End of Production t CO2-e/t 0.053 N/A
Warm Mix Asphalt (372 MJ/t) Mine to End of Production t CO2-e/t 0.054 0.01395
Warm Mix Asphalt (372 MJ/t) 10% RAP Mine to End of Production t CO2-e/t 0.053 N/A
Warm Mix Asphalt (372 MJ/t) 20% RAP Mine to End of Production t CO2-e/t 0.052 N/A
Warm Mix Asphalt (372 MJ/t) 30% RAP Mine to End of Production t CO2-e/t 0.051 N/A
† Emissions can be dominated by transport emissions - location and sourcing are key factors
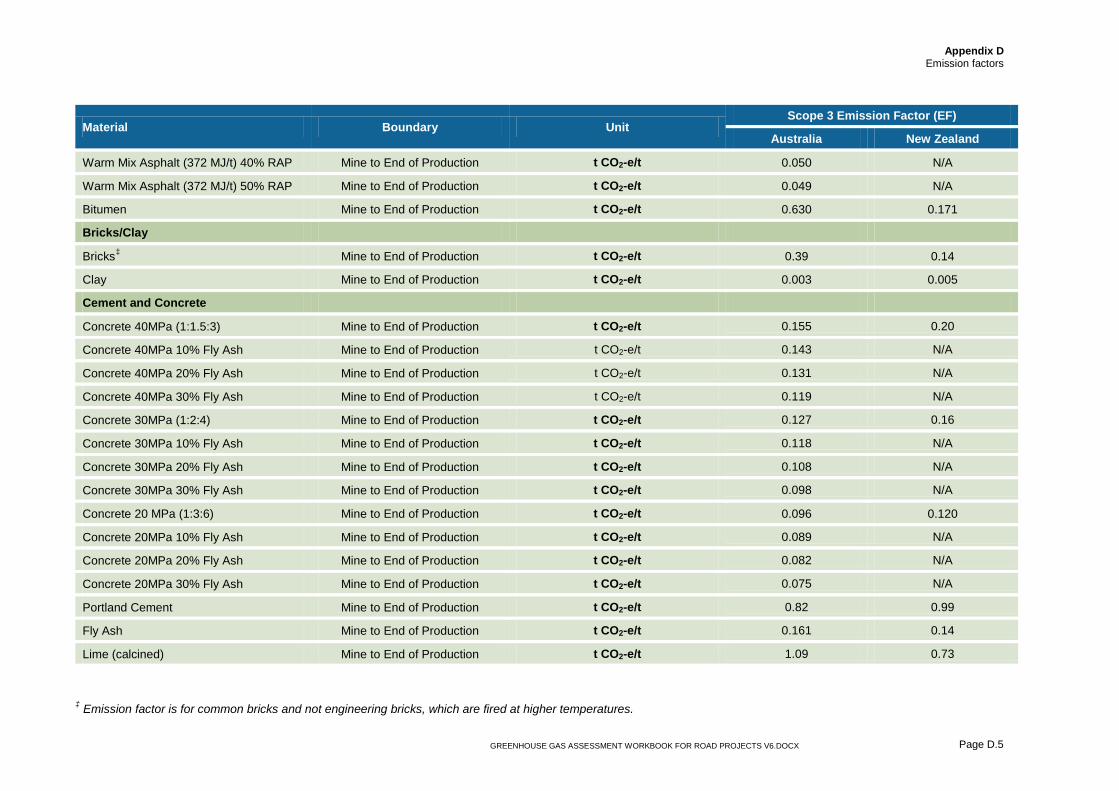
Appendix D
Emission factors
GREENHOUSE GAS ASSESSMENT WORKBOOK FOR ROAD PROJECTS V6.DOCX Page D.5
Material Boundary Unit Scope 3 Emission Factor (EF)
Australia New Zealand
Warm Mix Asphalt (372 MJ/t) 40% RAP Mine to End of Production t CO2-e/t 0.050 N/A
Warm Mix Asphalt (372 MJ/t) 50% RAP Mine to End of Production t CO2-e/t 0.049 N/A
Bitumen Mine to End of Production t CO2-e/t 0.630 0.171
Bricks/Clay
Bricks‡ Mine to End of Production t CO2-e/t 0.39 0.14
Clay Mine to End of Production t CO2-e/t 0.003 0.005
Cement and Concrete
Concrete 40MPa (1:1.5:3) Mine to End of Production t CO2-e/t 0.155 0.20
Concrete 40MPa 10% Fly Ash Mine to End of Production t CO2-e/t 0.143 N/A
Concrete 40MPa 20% Fly Ash Mine to End of Production t CO2-e/t 0.131 N/A
Concrete 40MPa 30% Fly Ash Mine to End of Production t CO2-e/t 0.119 N/A
Concrete 30MPa (1:2:4) Mine to End of Production t CO2-e/t 0.127 0.16
Concrete 30MPa 10% Fly Ash Mine to End of Production t CO2-e/t 0.118 N/A
Concrete 30MPa 20% Fly Ash Mine to End of Production t CO2-e/t 0.108 N/A
Concrete 30MPa 30% Fly Ash Mine to End of Production t CO2-e/t 0.098 N/A
Concrete 20 MPa (1:3:6) Mine to End of Production t CO2-e/t 0.096 0.120
Concrete 20MPa 10% Fly Ash Mine to End of Production t CO2-e/t 0.089 N/A
Concrete 20MPa 20% Fly Ash Mine to End of Production t CO2-e/t 0.082 N/A
Concrete 20MPa 30% Fly Ash Mine to End of Production t CO2-e/t 0.075 N/A
Portland Cement Mine to End of Production t CO2-e/t 0.82 0.99
Fly Ash Mine to End of Production t CO2-e/t 0.161 0.14
Lime (calcined) Mine to End of Production t CO2-e/t 1.09 0.73
‡ Emission factor is for common bricks and not engineering bricks, which are fired at higher temperatures.
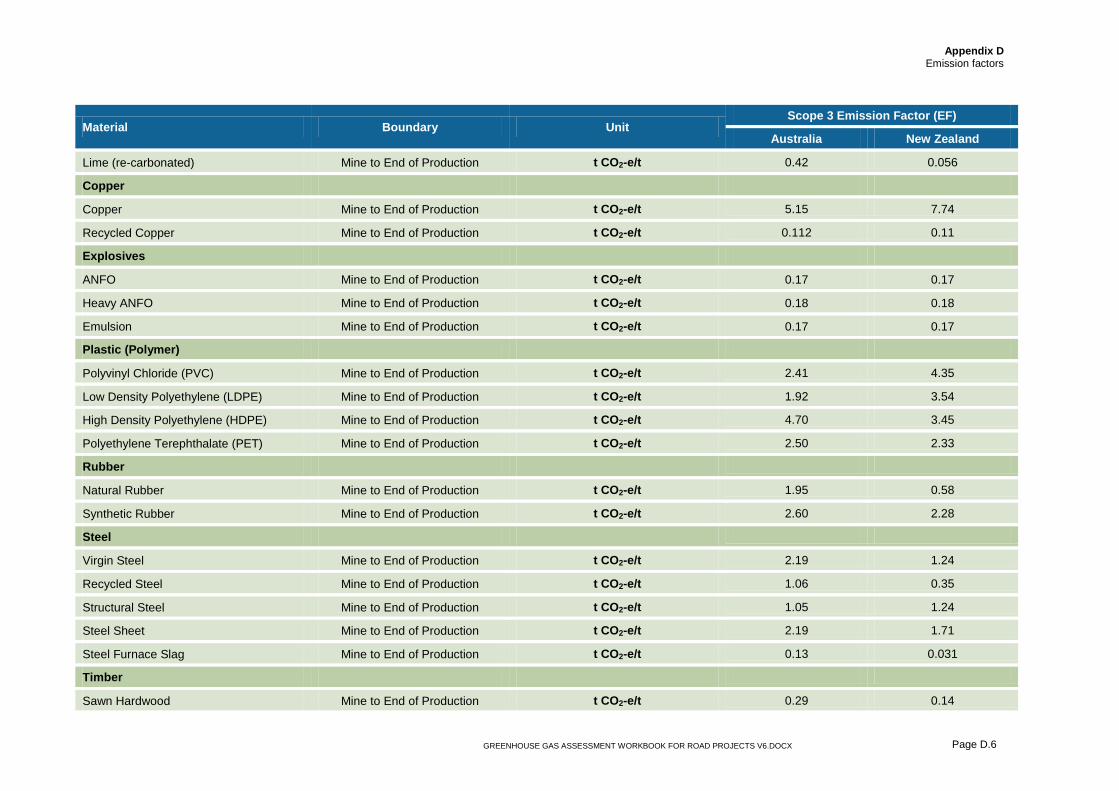
Appendix D
Emission factors
GREENHOUSE GAS ASSESSMENT WORKBOOK FOR ROAD PROJECTS V6.DOCX Page D.6
Material Boundary Unit Scope 3 Emission Factor (EF)
Australia New Zealand
Lime (re-carbonated) Mine to End of Production t CO2-e/t 0.42 0.056
Copper
Copper Mine to End of Production t CO2-e/t 5.15 7.74
Recycled Copper Mine to End of Production t CO2-e/t 0.112 0.11
Explosives
ANFO Mine to End of Production t CO2-e/t 0.17 0.17
Heavy ANFO Mine to End of Production t CO2-e/t 0.18 0.18
Emulsion Mine to End of Production t CO2-e/t 0.17 0.17
Plastic (Polymer)
Polyvinyl Chloride (PVC) Mine to End of Production t CO2-e/t 2.41 4.35
Low Density Polyethylene (LDPE) Mine to End of Production t CO2-e/t 1.92 3.54
High Density Polyethylene (HDPE) Mine to End of Production t CO2-e/t 4.70 3.45
Polyethylene Terephthalate (PET) Mine to End of Production t CO2-e/t 2.50 2.33
Rubber
Natural Rubber Mine to End of Production t CO2-e/t 1.95 0.58
Synthetic Rubber Mine to End of Production t CO2-e/t 2.60 2.28
Steel
Virgin Steel Mine to End of Production t CO2-e/t 2.19 1.24
Recycled Steel Mine to End of Production t CO2-e/t 1.06 0.35
Structural Steel Mine to End of Production t CO2-e/t 1.05 1.24
Steel Sheet Mine to End of Production t CO2-e/t 2.19 1.71
Steel Furnace Slag Mine to End of Production t CO2-e/t 0.13 0.031
Timber
Sawn Hardwood Mine to End of Production t CO2-e/t 0.29 0.14

Appendix D
Emission factors
GREENHOUSE GAS ASSESSMENT WORKBOOK FOR ROAD PROJECTS V6.DOCX Page D.7
Material Boundary Unit Scope 3 Emission Factor (EF)
Australia New Zealand
Structural Pine Mine to End of Production t CO2-e/t -0.81 -1.66
Plywood (Structural) Mine to End of Production t CO2-e/t 1.15 1.15
Plywood (Exterior, e.g. noise wall) Mine to End of Production t CO2-e/t 1.08 1.08
Source Data – Australia (excluding recycled copper and explosives): SimaPro and the Australian LCA Dataset, 2010 Data Source – Australia Aggregate. RMCG. Sustainable Aggregates – CO2 Emission Factor Study Source Data – Australia Recycled copper: “Embodied Energy and CO2 Coefficients for New Zealand Building Materials”, Alcorn, 2003 Source Data – Australia Explosives: AUS DCCEE National Greenhouse Accounts Factors workbook, July 2010 Source Data – New Zealand (excluding Rubber, Timber, Steel sheet and Steel furnace slag): “Embodied Energy and CO2 Coefficients for New Zealand Building Materials”, Alcorn, 2003 Source Data – New Zealand Rubber, Timber, Steel sheet and Steel furnace slag: Ecoinvent NZ, v 2.2 Source Data – Warm Mix Asphalt: Rippol, JO & Farre, CM 2008, 'Evaluation of greenhouse gas emissions from the production of hot asphalt mixtures', Eurasphalt and Eurobitume Congress, 4th 2008, Copenhagen, Denmark, Eurasphalt & Eurobitume Congress Secretatiat, Brussels, Belgium

Appendix D
Emission factors
GREENHOUSE GAS ASSESSMENT WORKBOOK FOR ROAD PROJECTS V6.DOCX Page D.8
Waste to landfill
The amount of GHG emissions released from the decomposition of waste in landfill is dependent on the amount of organic material within the waste and how readily this organic material breaks down.
Emission factors for waste disposed of to landfill are published by both the Australian and New Zealand governments. These emission factors have been used where available.
The Australian ‘Commercial and Industrial’ waste classification has been taken to be equivalent to the New Zealand ‘Office waste to landfill’ classification.
Table D.5 Waste to landfill emission factors
Waste Boundary Unit Emission Factor (EF)
Australian New Zealand
Office Waste to Landfill (Commercial and Industrial [C&I] Waste)
Disposal site t CO2-e/t 1.10 1.55
Paper and Cardboard Disposal site t CO2-e/t 2.50 2.52
Construction and Demolition (C&D) Waste Disposal site t CO2-e/t 0.20 0.20
Wood Waste Disposal site t CO2-e/t 1.20 1.89
Grassland Disposal site t CO2-e/t 1.20 0.95
Shrubs Disposal site t CO2-e/t 1.20 0.95
Source Data – Australia: AUS DCCEE National Greenhouse Accounts Factors, July 2012. Grassland and shrubs assumed to be equivalent to garden and green waste. Source Data – New Zealand (excluding C&D Waste): NZ Guidance for voluntary, corporate greenhouse gas reporting: Data and Methods for the 2008 Calendar Year Source Data – New Zealand C&D Waste: AUS DCCEE National Greenhouse Accounts Factors, July 2012
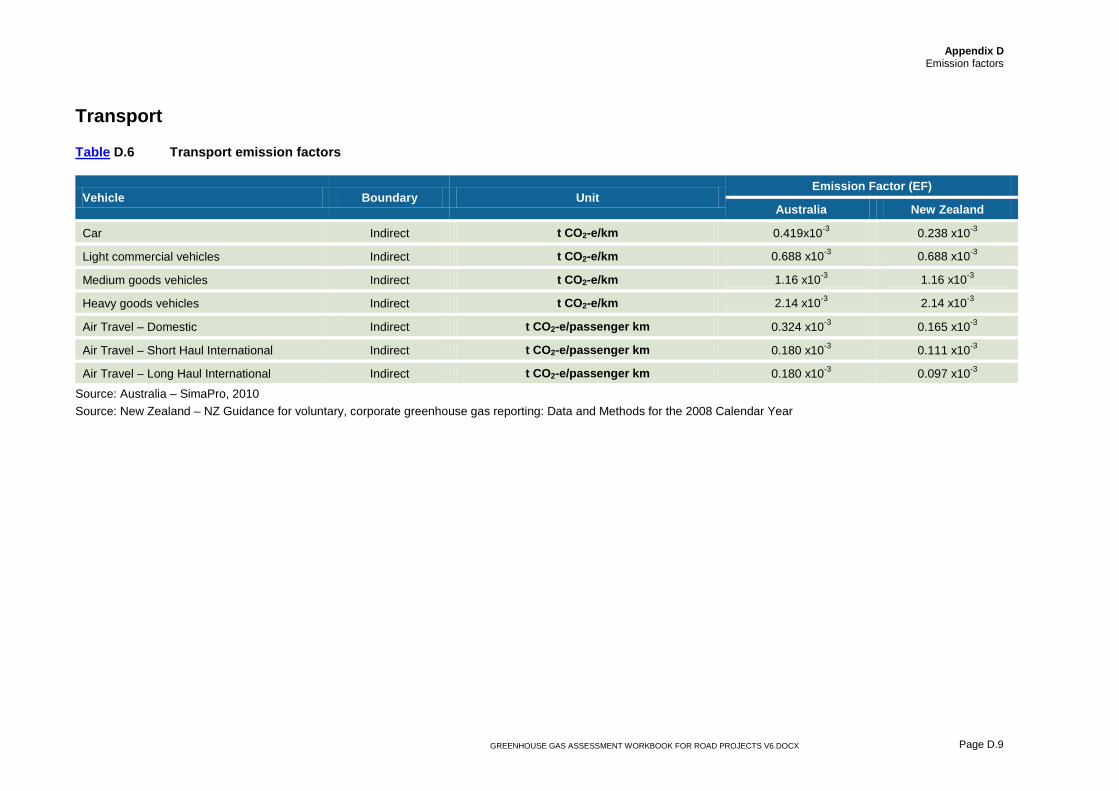
Appendix D
Emission factors
GREENHOUSE GAS ASSESSMENT WORKBOOK FOR ROAD PROJECTS V6.DOCX Page D.9
Transport
Table D.6 Transport emission factors
Vehicle Boundary Unit Emission Factor (EF)
Australia New Zealand
Car Indirect t CO2-e/km 0.419x10⁻³ 0.238 x10⁻³
Light commercial vehicles Indirect t CO2-e/km 0.688 x10⁻³ 0.688 x10⁻³
Medium goods vehicles Indirect t CO2-e/km 1.16 x10⁻³ 1.16 x10⁻³
Heavy goods vehicles Indirect t CO2-e/km 2.14 x10⁻³ 2.14 x10⁻³
Air Travel – Domestic Indirect t CO2-e/passenger km 0.324 x10⁻³ 0.165 x10⁻³
Air Travel – Short Haul International Indirect t CO2-e/passenger km 0.180 x10⁻³ 0.111 x10⁻³
Air Travel – Long Haul International Indirect t CO2-e/passenger km 0.180 x10⁻³ 0.097 x10⁻³
Source: Australia – SimaPro, 2010 Source: New Zealand – NZ Guidance for voluntary, corporate greenhouse gas reporting: Data and Methods for the 2008 Calendar Year


Appendix E Vegetation Emissions Methodology
GREENHOUSE GAS ASSESSMENT WORKBOOK FOR ROAD PROJECTS V6.DOCX
Appendix E Vegetation Emissions Methodology

Appendix E Appendix E
Vegetation Emissions Methodology
GREENHOUSE GAS ASSESSMENT WORKBOOK FOR ROAD PROJECTS V6
Roads and Maritime Services and
VicRoads
Report for Vegetation emissions methodology for
road construction workbook Workbook methodology
June 2012

Appendix E Vegetation Emissions Methodology
GREENHOUSE GAS ASSESSMENT WORKBOOK FOR ROAD PROJECTS V6.DOCX
This Vegetation emissions methodology for road construction workbook: workbook methodology (“Report”):
1. has been prepared by GHD Pty Ltd for Roads and Maritime Services (RMS)and VicRoads on behalf of Transport Authorities Greenhouse Group (TAGG);
2. may only be used and relied on by RMS and VicRoads;
3. must not be copied to, used by, or relied on by any person other than RMS and VicRoads without the prior written consent of GHD;
4. may only be used for the purpose of updating the TAGG Greenhouse Gas Assessment Workbook for Road Projects (and must not be used for any other purpose).
GHD and its servants, employees and officers otherwise expressly disclaim responsibility to any person other than RMS arising from or in connection with this Report.
To the maximum extent permitted by law, all implied warranties and conditions in relation to the services provided by GHD and the Report are excluded unless they are expressly stated to apply in this Report.
The services undertaken by GHD in connection with preparing this Report:
· were limited to those specifically detailed in section 1 of this Report;
· did not include [list all scope limitations or the relevant section(s) of the Report in which scope the limitations are expressed – for example, GHD undertaking any site visits or testing, GHD undertaking testing at some parts of the site; GHD undertaking particular types of testing/analysis that could have been undertaken].
The opinions, conclusions and any recommendations in this Report are based on assumptions made by GHD when undertaking services and preparing the Report (“Assumptions”), including (but not limited to) the assumptions outlined in GHD report Vegetation emissions methodology for road construction workbook: Supporting documentation, GHD Document number 21/21551/180969 Rev A.
GHD expressly disclaims responsibility for any error in, or omission from, this Report arising from or in connection with any of the Assumptions being incorrect.
Subject to the paragraphs in this section of the Report, the opinions, conclusions and any recommendations in this Report are based on conditions encountered and information reviewed at the time of preparation and may be relied on until 12 months, after which time, GHD expressly disclaims responsibility for any error in, or omission from, this Report arising from or in connection with those opinions, conclusions and any recommendations.

Appendix E
Vegetation Emissions Methodology
GREENHOUSE GAS ASSESSMENT WORKBOOK FOR ROAD PROJECTS V6.DOCX
1. Introduction Road traffic and transport authorities in Australian and New Zealand have formed a Transport Authorities Greenhouse Group (TAGG). A key action of the TAGG is to develop a common methodology for the estimation, reporting and minimisation of greenhouse gas emissions associated with road construction, operation and maintenance. In 2011, the TAGG released a workbook outlining a methodology for estimating greenhouse gas emissions associated with road design to road operation and maintenance.
The workbook contains a section (Section 5.3.3.1) describing the methodology for estimating the loss of carbon dioxide equivalent sequestration potential from the clearing of vegetation during road construction. The vegetation clearance methodology for Australia is currently determined by obtaining the mean average annual rainfall for the road project’s location and multiplying the rainfall by a default factor to estimate the emissions associated with vegetation clearing. Following its application, this methodology was identified as limited in its ability to be applied across Australia. Consequently, it was unable to provide reasonable estimates of greenhouse gas emissions associated with vegetation removal.
GHD was engaged by the Roads and Maritime Services (RMS) and VicRoads to update the methodology for estimating the loss of carbon sequestration potential from vegetation removal. The revised methodology employs vegetation data used by the Commonwealth Department of Climate Change and Energy Efficiency (DCCEE) to estimate greenhouse gas emissions for Australia’s international reporting requirements under the United Nations Framework Convention on Climate Change (UNFCCC) and the Kyoto Protocol.
A key project objective was to provide a user friendly methodology that does not require a user to apply complex modelling techniques to model vegetation emissions and still provides a reasonable estimate of the loss of greenhouse gas sequestration potential associated with vegetation removal.
The updated vegetation clearance section for Australia is outlined in Section 2 of this report. Section 2 may be copied directly into the existing TAGG workbook. Supporting documentation for the updated methodology is provided in GHD report Vegetation emissions methodology for road construction workbook: Supporting documentation, GHD Document number 21/21551/180969.

Appendix E Vegetation Emissions Methodology
GREENHOUSE GAS ASSESSMENT WORKBOOK FOR ROAD PROJECTS V6.DOCX
2. Vegetation clearing methodology
This methodology for estimating the greenhouse gas impacts associated with clearance takes into account the carbon that exists in the vegetation at the time of clearing and carbon that could have been sequestered in the future if the vegetation was not cleared. The methodology is considered a conservative estimation approach and assumed that:
» All carbon pools (i.e. woody, non-woody, debris and soil) are removed.
» All carbon removed is converted to carbon dioxide and released to the atmosphere.
» Sequestration from revegetation of the project site is not included.
It is acknowledged that this is a conservative approach to estimating greenhouse gas emissions from vegetation removal.
Steps for Estimating Greenhouse Gas Emissions Associated with Vegetation Clearance in Australia.
Step 1: Look up the Project Location and Determine the ‘Maxbio’ class
Find the approximate location of the proposed project on the maps located in Appendix A. Each map is colour coded showing the maximum potential biomass (or maxbio) class for all areas of Australia. The maxbio class is derived from the Australian Greenhouse Office and estimates the maximum tonnes dry vegetation matter per hectare for a specific location. If it is unclear which maxbio class the project is located in, select the higher class (higher maxbio range).
Step 2: Determine Vegetation Types and Hectares to be Cleared
Using Table identify the vegetation class (e.g. open forest, open woodlands) and the area in hectares for each vegetation type to be cleared. To assist in identifying the vegetation types, descriptions including photographs and distribution maps are provided by the Australian Natural Resources Atlas located at (http://www.anra.gov.au/topics/vegetation/pubs/native_vegetation/vegfsheet.html). It is acknowledged that there may be multiple vegetation groups impacted by a road infrastructure project.

Appendix E
Vegetation Emissions Methodology
GREENHOUSE GAS ASSESSMENT WORKBOOK FOR ROAD PROJECTS V6.DOCX
Table1 Vegetation Classes
Vegetation Class
Name Major Vegetation Groups (Including Hyperlinks)
A Rainforest and vine thicket Rainforest and Vine Thickets
B Eucalypt Tall Open Forest Eucalypt Tall Open Forest
C Open Forest Eucalypt Open Forest
Melaleuca Forest and Woodland
Eucalypt Low Open Forest
D Open Woodlands Acacia Forest and Woodland
Eucalypt Woodland
Eucalypt Open Woodland
Casuarina Forest and Woodland
Tropical Eucalypt Woodland/Grassland
Other Forests and Woodland
E Callitris Forest and Woodland
Callitris Forest and Woodland
F Mallee and Acacia Woodland and Shrubland
Mallee Woodland and Shrubland
Low Closed Forest and Closed Shrubland
Acacia Open Woodland
G Open Shrubland Acacia Shrubland
Other Shrubland
Unclassified Native Vegetation
H Heathlands Heathlands
Chenopod Shrub, Samphire Shrub and Forbland
I Grassland Tussock Grassland
Hummock Grassland
Other Grassland, Herbland, Sedgeland and Rushland

Appendix E Vegetation Emissions Methodology
GREENHOUSE GAS ASSESSMENT WORKBOOK FOR ROAD PROJECTS V6.DOCX
Step 3: Look Up the Vegetation Clearance Emission Factors
Use Table to look up the carbon dioxide equivalent emission factor for each vegetation class within the maxbio class (Step 1). If the emission factors selected is highlighted blue, then review the vegetation class for the project as it is rare that vegetation class to exist in that specific location.
Table 2 Emission Factors (t CO2-e/ha)
Potential maximum biomass class Vegetation Class 1 2 3 4 5 6 7
A 154 227 384 532 594 768 B 237 401 554 618 C 77 209 307 521 718 801 D 77 209 307 521 E 80 217 316 538 F 106 287 419 713 G 113 305 442 H 115 309 446 I 110 110 110 110 110 110 110
Step 4: Multiply the area of vegetation with the corresponding emission factor
Multiply the area of vegetation with the corresponding emission factor (derived from Table 2), and sum for all vegetation classes. Two worked examples are provided below.
Example 1: In this first example, a duplication of an existing road is proposed from Forbes to Parkes, in NSW.
When looking at Figure 1, within Attachment A, this location sits within Maximum Potential Biomass Class 2 (purple colour).
From a flora report it is known that there will need to be 10 hectares of vegetation class C removed, 5 hectares of vegetation class E removed and 7 hectares of vegetation class I removed.
This is calculated as follows:
10 Ha x 209 TCO2-e/ Ha (Veg class C) = 2090 T CO2-e
5 Ha x 217 TCO2-e/ Ha (Veg class E) = 1085 T CO2-e
7 Ha x 110 TCO2-e/ Ha (Veg class I) = 770 T CO2-e
This totals a carbon sequestration loss of 3945 T CO2-e.

Appendix E
Vegetation Emissions Methodology
GREENHOUSE GAS ASSESSMENT WORKBOOK FOR ROAD PROJECTS V6.DOCX
Example 2: In this second example, a duplication of an existing road is proposed from Scottsdale to Launceston, in Tasmania.
When looking at Figure 3, within Attachment A, this location sits within Maximum Potential Biomass Classes 2 (purple colour), 4 (darker green) and class 5 (lighter green). For this estimation process, it would all be assumed to be in class 5.
From a flora report it is known that there will need to be 7 hectares of vegetation class B removed, 10 hectares of vegetation class C removed and 25 hectares of vegetation class I removed.
The following represents the calculation.
7 Ha x 554 TCO2-e/ Ha (Veg class B) = 3878 T CO2-e
10 Ha x 718 TCO2-e/ Ha (Veg class C) = 7180 T CO2-e
25 Ha x 110 TCO2-e/ Ha (Veg class I) = 2750 T CO2-e
This totals a carbon sequestration loss of 13,808 T CO2-e.

Appendix E Vegetation Emissions Methodology
Attachment A Maximum Potential Biomass Classes
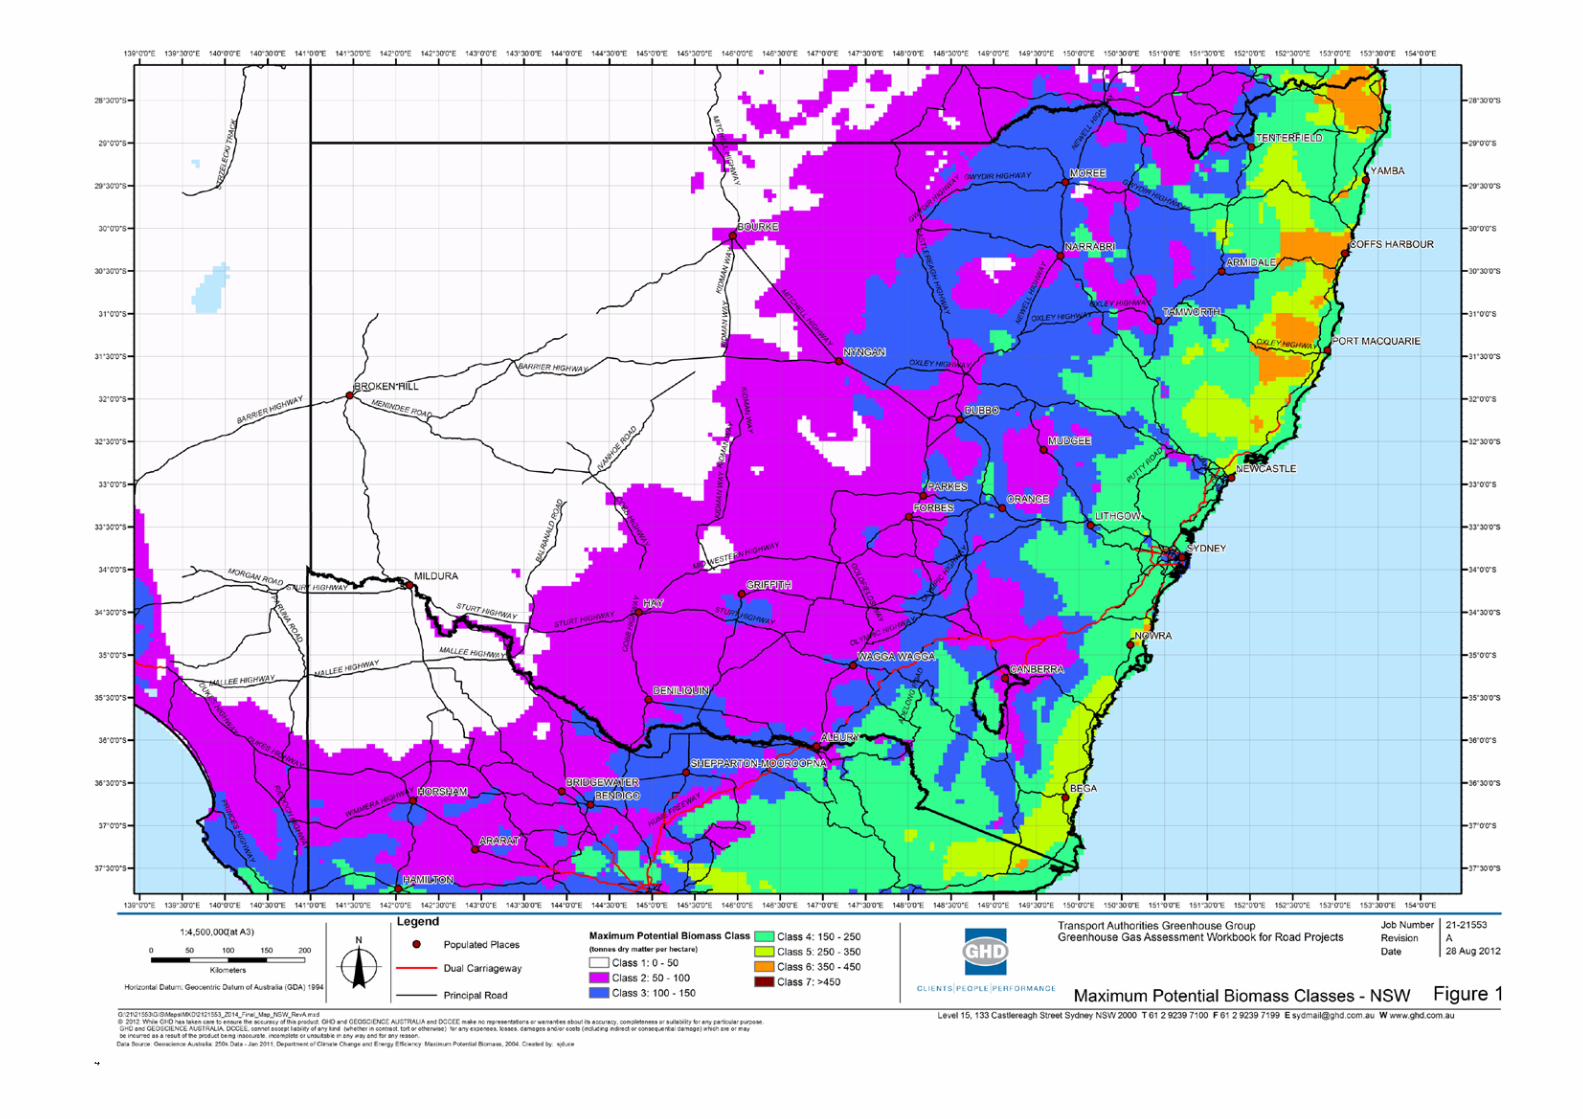
Appendix E
Vegetation Emissions Methodology
4
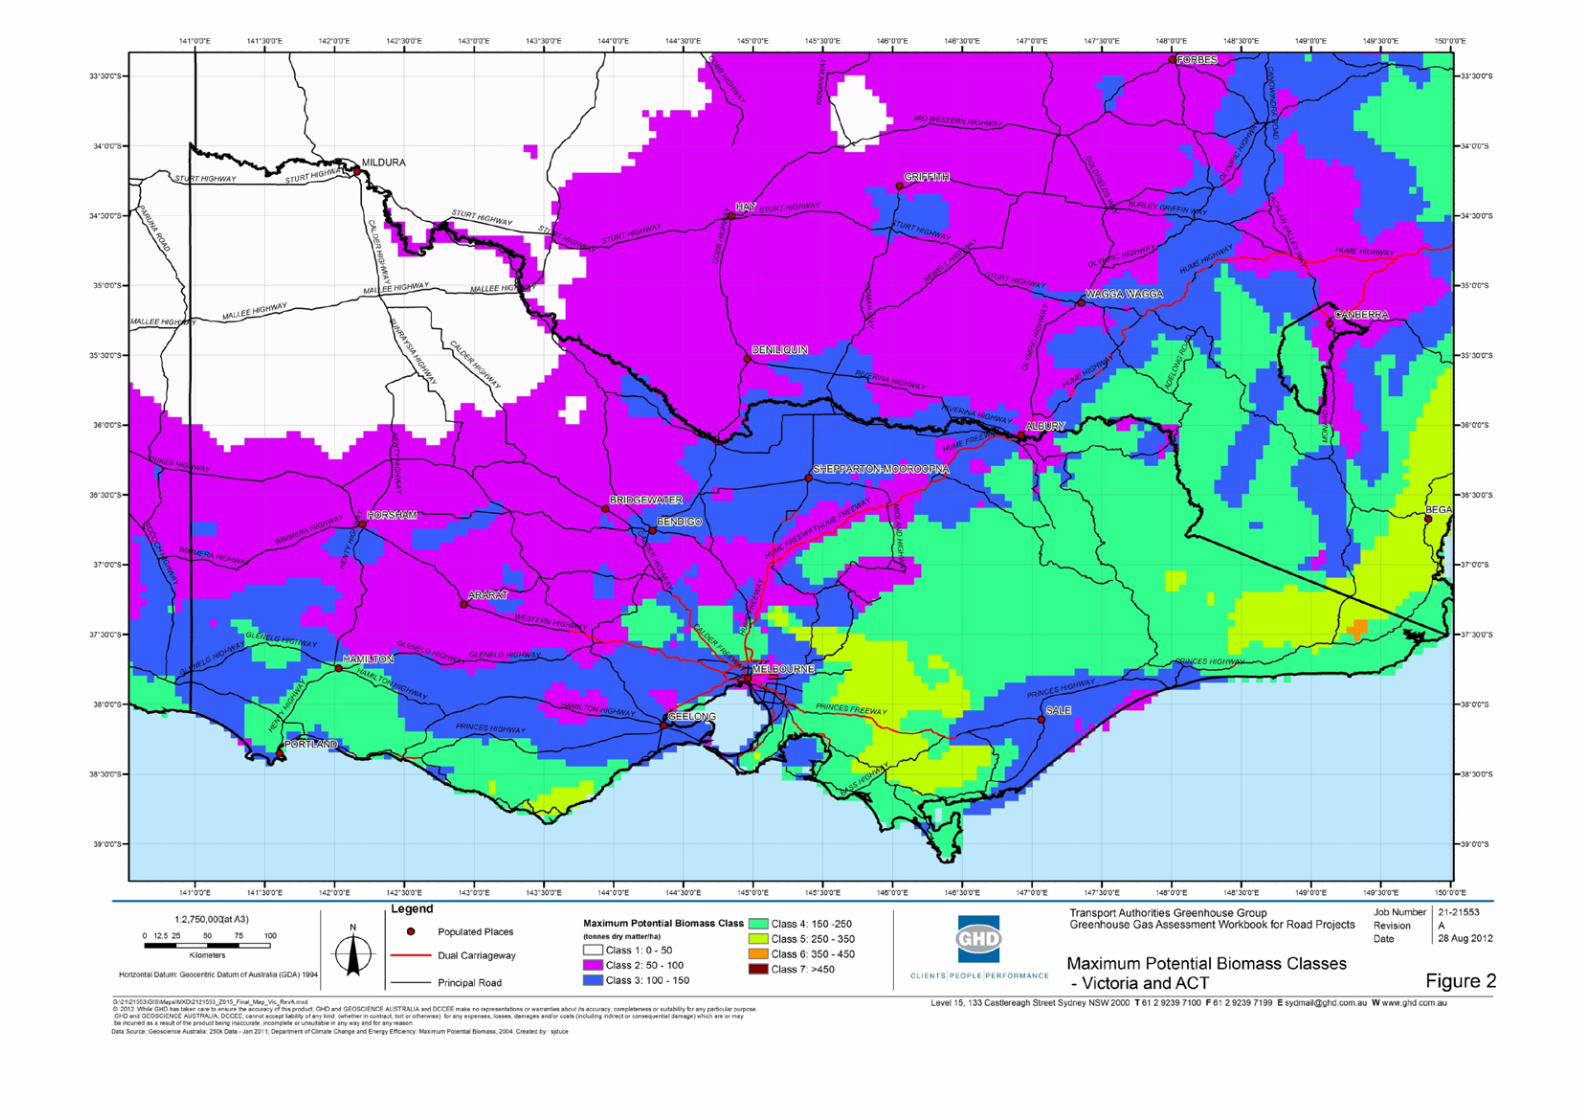
Appendix E Vegetation Emissions Methodology
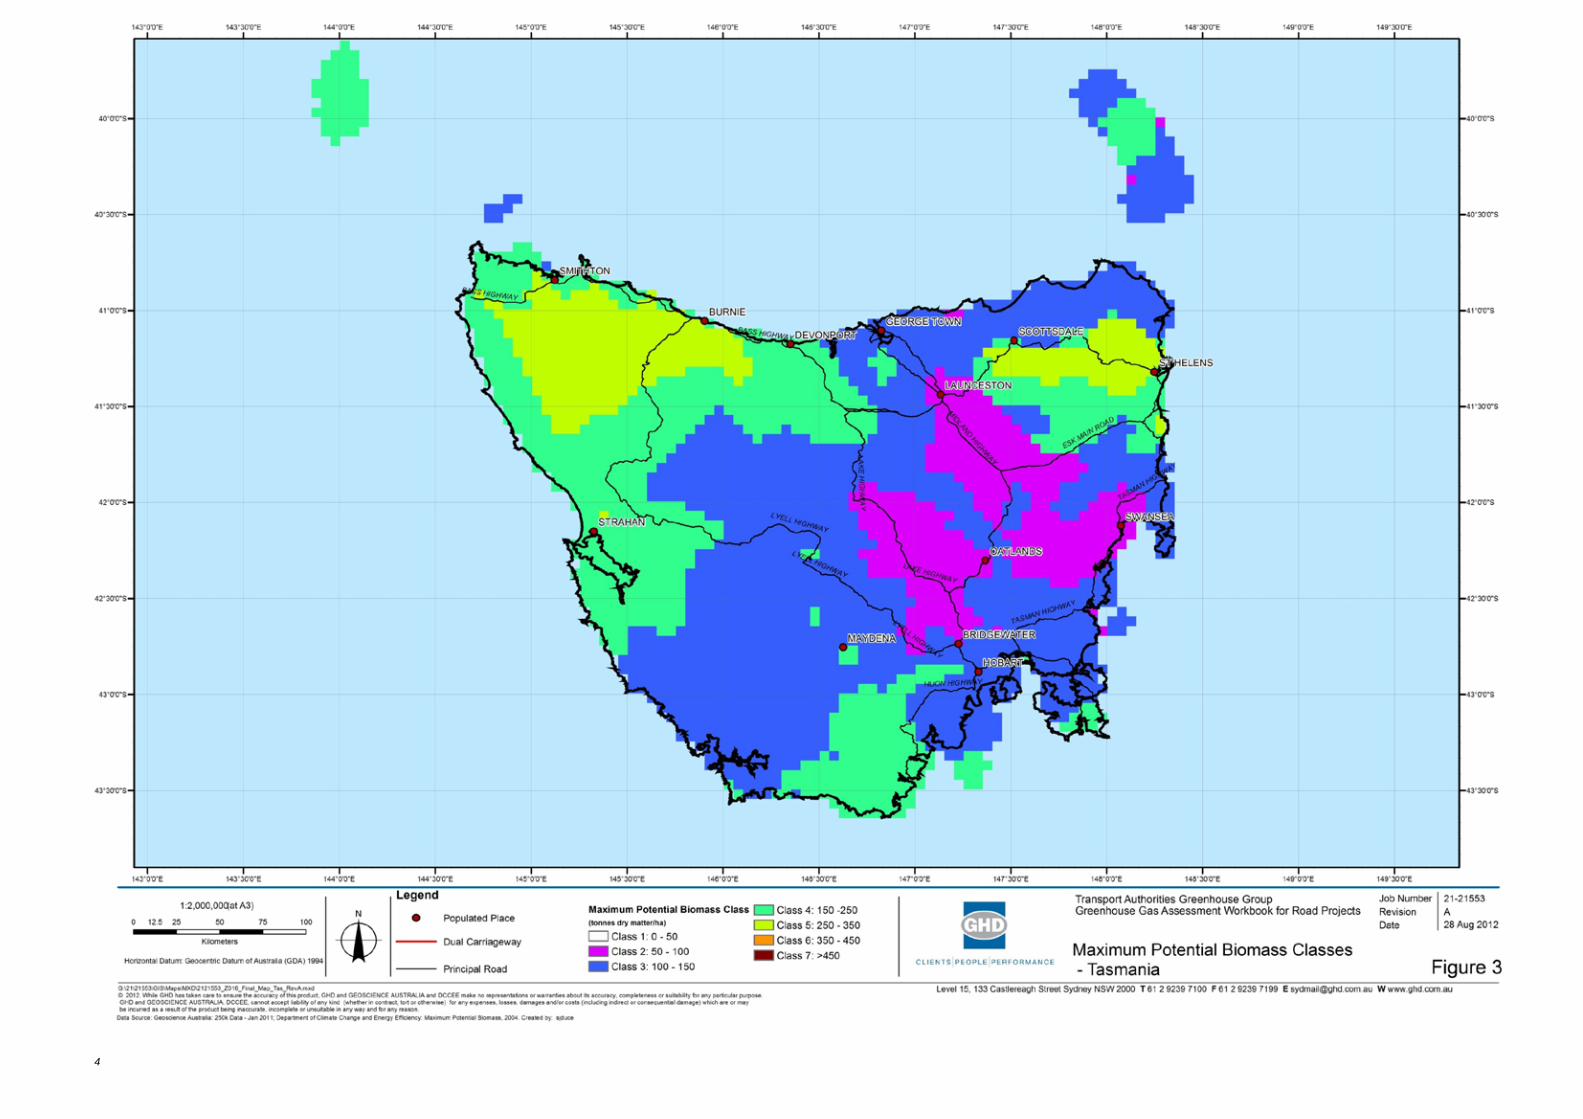
Appendix E
Vegetation Emissions Methodology
4

Appendix E Vegetation Emissions Methodology

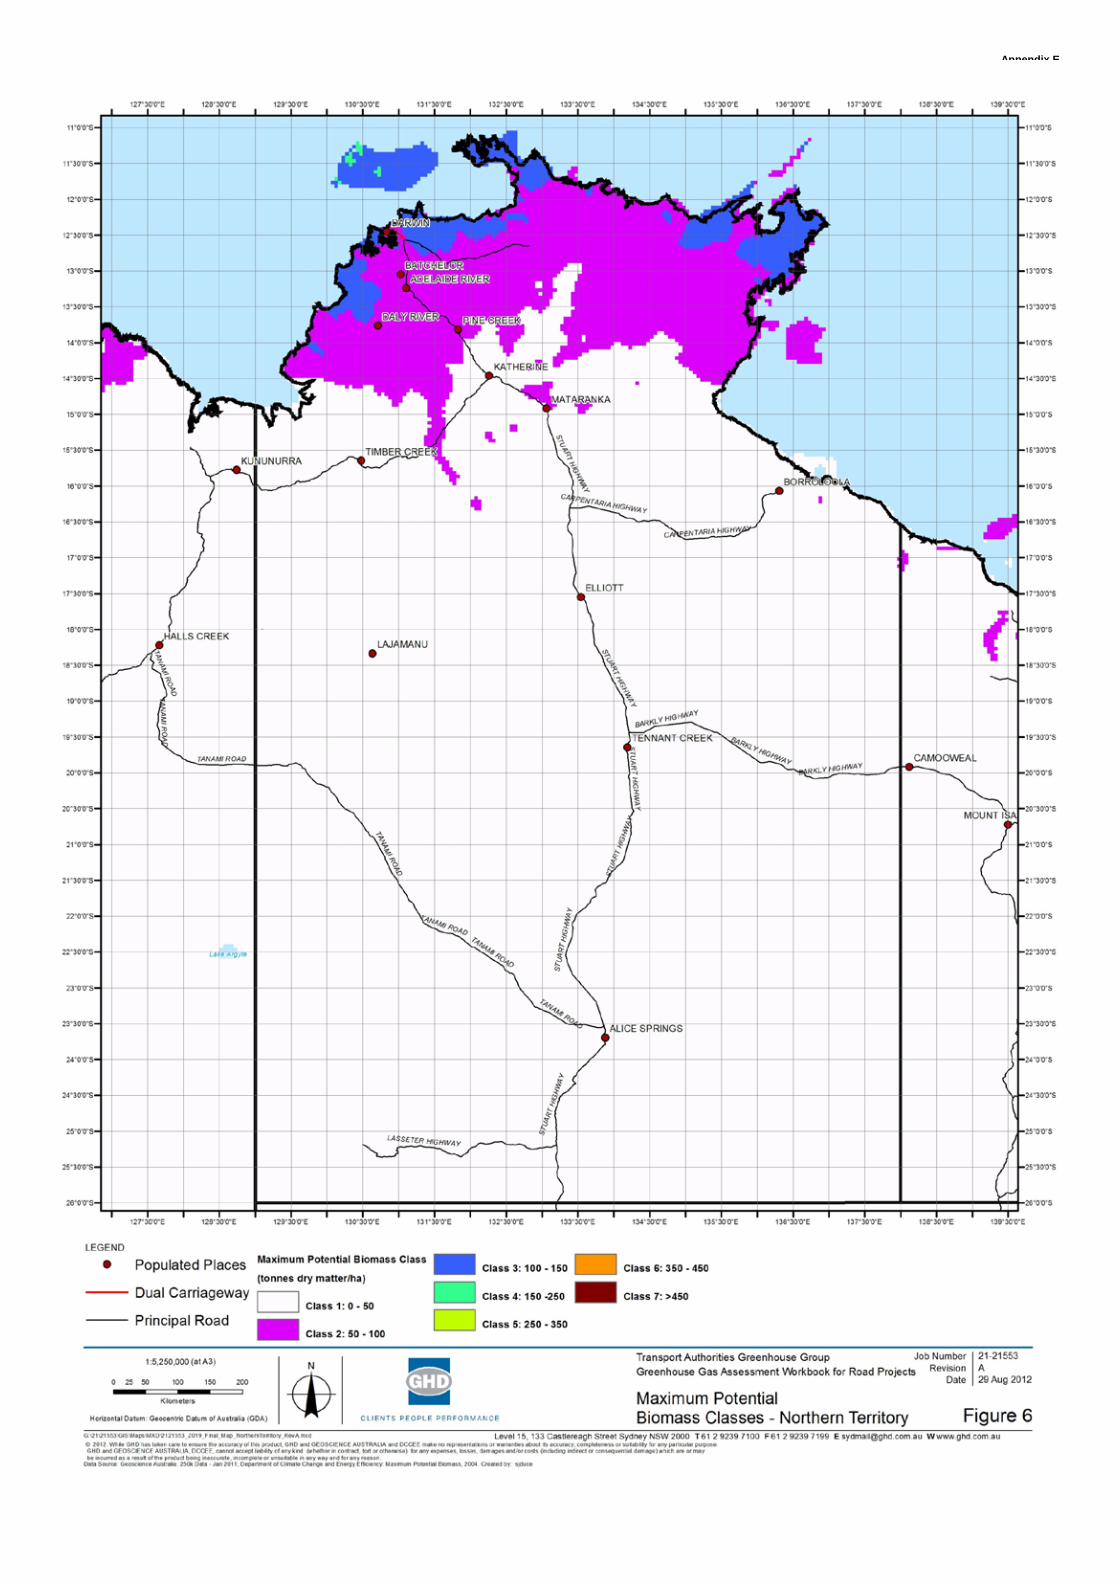
Appendix E Vegetation Emissions Methodology


Appendix E Vegetation Emissions Methodology
GHD
133 Castlereagh St Sydney NSW 2000 - T: 2 9239 7100 F: 2 9239 7199 E: [email protected]
© GHD 2012
This document is and shall remain the property of GHD. The document may only be used for the purpose for which it was commissioned and in accordance with the Terms of Engagement for the commission. Unauthorised use of this document in any form whatsoever is prohibited.
Document Status
Rev No. Author
Reviewer Approved for Issue
Name Signature Name Signature Date
A A Maddocks D Adshead
D Adshead
B S.Duce D Adshead
D Adshead