Greencape Wholesale High Conviction Fund
11
Greencape Wholesale High Conviction Fund Quarterly report - December 2016 Performance # Quarter % 1 year % 3 years % p.a. 5 years % p.a. 10 years % p.a. Inception % p.a. Fund return 3.23 7.84 6.08 11.77 7.19 8.85 Growth return 2.51 2.79 -2.79 4.77 0.91 2.66 Distribution return 0.71 5.04 8.87 7.01 6.27 6.20 S&P/ASX 200 Accumulation Index 5.18 11.80 6.59 11.84 4.53 5.73 Active return^ -1.96 -3.96 -0.52 -0.07 2.66 3.12 Past performance is not a reliable indicator of future performance. # Performance figures are calculated after fees have been deducted and assume distributions have been reinvested. No allowance is made for tax when calculating these figures. ^ Numbers may not add due to rounding Investment objective The Fund aims to outperform its benchmark over rolling three-year periods. Responsible entity Fidante Partners Limited Investment manager Greencape Capital Pty Ltd Investment strategy Greencape is an active, 'bottom-up' stock picker. Whilst Greencape does not target any specific investment style and will invest in stocks displaying 'value' and 'growth' characteristics, its focus on a company's qualitative attributes will generally lead to 'growth' oriented portfolios. This is an outcome of its bottom-up process. As such, Greencape's investment style may be classified as 'growth at a reasonable price'. Distribution frequency Quarterly Suggested minimum investment timeframe At least five years Asset allocation As at 31 December 2016 (%) Range (%) Security 97.92 85-100 Cash 2.08 0-15 Fund facts Inception date 11 September 2006 APIR code HOW0035AU Fees Entry fee Nil 2015-2016 ICR 0.91% Management fee 0.90% p.a. Performance fee 15% of the Fund's daily return (after fees and expenses and after adding back any distributions paid) above the Fund's Performance Benchmark (the daily return of S&P/ASX 200 Accumulation Index). Buy/sell spread +0.20% / -0.20%
Transcript of Greencape Wholesale High Conviction Fund

Greencape Wholesale High Conviction Fund
Quarterly report - December 2016
Performance # Quarter%
1 year%
3 years% p.a.
5 years% p.a.
10 years% p.a.
Inception% p.a.
Fund return 3.23 7.84 6.08 11.77 7.19 8.85
Growth return 2.51 2.79 -2.79 4.77 0.91 2.66
Distribution return 0.71 5.04 8.87 7.01 6.27 6.20
S&P/ASX 200 Accumulation Index 5.18 11.80 6.59 11.84 4.53 5.73
Active return^ -1.96 -3.96 -0.52 -0.07 2.66 3.12
Past performance is not a reliable indicator of future performance.
# Performance figures are calculated after fees have been deducted and assume distributions have been reinvested. No allowance is made for taxwhen calculating these figures.^ Numbers may not add due to rounding
Investment objective
The Fund aims to outperform its benchmark over rolling
three-year periods.
Responsible entity
Fidante Partners Limited
Investment manager
Greencape Capital Pty Ltd
Investment strategy
Greencape is an active, 'bottom-up' stock picker. Whilst
Greencape does not target any specific investment style
and will invest in stocks displaying 'value' and 'growth'
characteristics, its focus on a company's qualitative
attributes will generally lead to 'growth' oriented
portfolios. This is an outcome of its bottom-up process.
As such, Greencape's investment style may be classified
as 'growth at a reasonable price'.
Distribution frequency
Quarterly
Suggested minimum investment timeframe
At least five years
Asset allocation As at 31 December 2016 (%) Range(%)
Security 97.92 85-100
Cash 2.08 0-15
Fund facts
Inception date 11 September 2006
APIR code HOW0035AU
Fees
Entry fee Nil
2015-2016 ICR 0.91%
Management fee 0.90% p.a.
Performance fee 15% of the Fund's daily return (after fees andexpenses and after adding back anydistributions paid) above the Fund's
Performance Benchmark (the daily return ofS&P/ASX 200 Accumulation Index).
Buy/sell spread +0.20% / -0.20%
Greencape Wholesale High Conviction Fund - December 2016 - continued
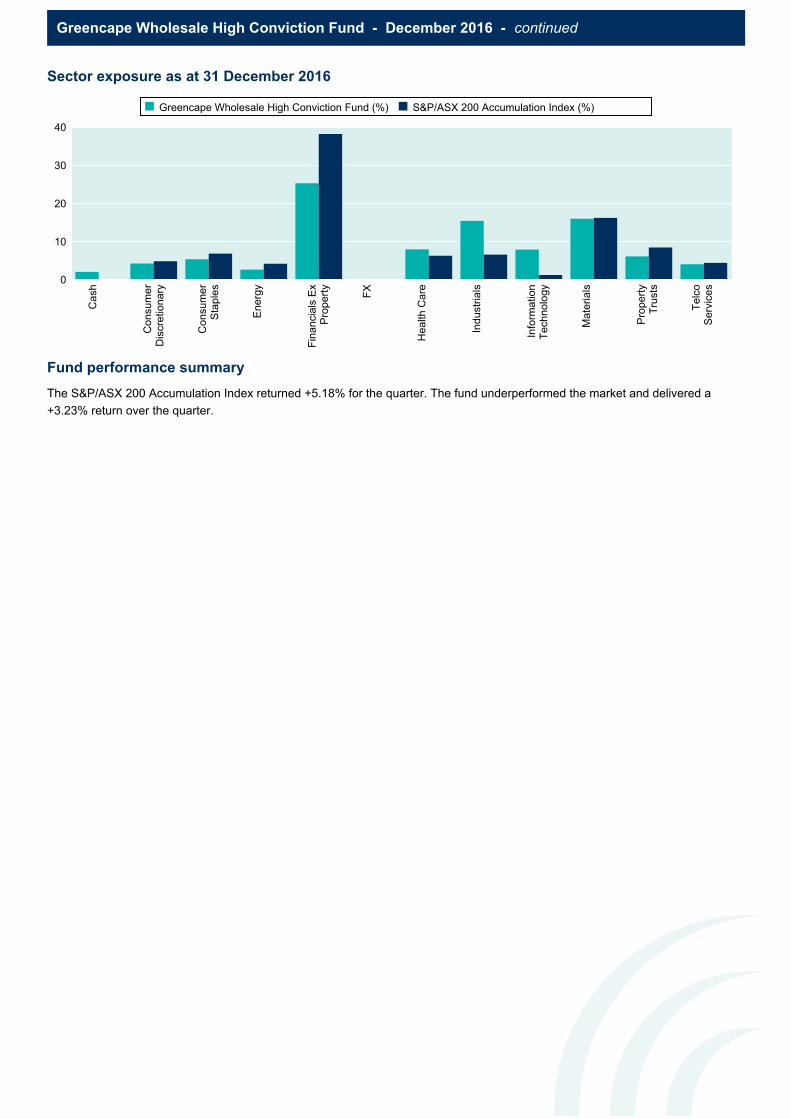
Sector exposure as at 31 December 2016C
ash
Co
nsu
me
rD
iscr
etio
na
ry
Co
nsu
me
rS
tap
les
En
erg
y
Fin
an
cia
ls E
xP
rop
ert
y
FX
He
alth
Ca
re
Ind
ust
ria
ls
Info
rma
tion
Te
chn
olo
gy
Ma
teri
als
Pro
pe
rty
Tru
sts
Te
lco
Se
rvic
es
Greencape Wholesale High Conviction Fund (%) S&P/ASX 200 Accumulation Index (%)
0
10
20
30
40
Fund performance summary
The S&P/ASX 200 Accumulation Index returned +5.18% for the quarter. The fund underperformed the market and delivered a
+3.23% return over the quarter.

Commentary - continued
Market overview
Global political events again commanded the market’s focus this quarter, with a surprising US election
result catching most off-guard. Bonds yields continued their rise from historic lows which saw a rotation out
of bond-like equities. November brought with it the annual Annual General Meeting (AGM) season, in
which a number of companies disappointed the market with their trading updates. The index finished the
calendar year strongly, buoyed by yet another Santa rally in December.
S&P/ASX 200 Index
As expected, the Reserve Bank of Australia (RBA) left rates unchanged for all three meetings during the
quarter. The futures market now implies expectations are for the RBA to keep rates on hold for the duration
of 2017. The major banks however decided to raise the variable rates on selected home loans independent
of the RBA, citing higher funding costs due to increased deposit rates. Australian third quarter Gross
Domestic Product (GDP) growth disappointed, registering at -0.5% against expectations of a 0.1% fall.
News flow out of the Federal Government was relatively quiet during the period, the highlight being the
Mid-Year Economic and Fiscal Outlook (MYEFO) in which the government forecasted a return to surplus in
2020/21. A number of market commentators predicted the MYEFO would be the catalyst for Australia to
lose its fabled AAA credit rating; however the budget update ultimately proved sufficient for the rating
agencies to leave the rating unchanged, albeit with a negative outlook.
S&P/ASX 200 Accumulation Index Calendar Year Returns Since 1996
Global markets reacted to polls, tweets and other headlines in the unconventional lead up to the US
"We risk becoming
victims of a
complacency that
fails to recognise
the hard work that
enabled our
economic success,
and the need for it
to continue if that
success is to be
enduring." Malcolm
Turnbull, Prime
Minister of
Australia,
18/11/2016
5100
5200
5300
5400
5500
5600
5700
30-Sep-16 30-Oct-16 29-Nov-16 29-Dec-16
-40.0%
-30.0%
-20.0%
-10.0%
0.0%
10.0%
20.0%
30.0%
40.0%
96 97 98 99 00 01 02 03 04 05 06 07 08 09 10 11 12 13 14 15 16

Commentary - continued
Global markets reacted to polls, tweets and other headlines in the unconventional lead up to the US Presidential election, which we discuss in more detail later. The US Federal Reserve (Fed) raised the
federal funds rate for the first time in 12 months by 25 basis points to 0.50%-0.75%, an outcome which
was fully priced in by the market, which now expects at least another 2 rate hikes in 2017. US GDP for the
third quarter was higher than initially announced, with the re-stated measure up 3.5% against initial
expectations of 2.9% growth. In Europe, the Italian referendum on constitutional reforms was
comprehensively voted down, causing the immediate resignation of Prime Minister Matteo Renzi.
Chinese capital outflows continued during the quarter, as the country’s FX reserves fell to USD $3 trillion,
which is the lowest level since 2011, and USD $1 trillion lower than the peak in 2014. The capital outflows
are in part due to the ongoing gradual currency devaluation being conducted by the People’s Bank of
China spooking some locals to expatriate their funds ahead of the risk of further currency falls. The
USDCNY spot rate rose 7% for the calendar year, the biggest yearly gain since 1994.
The Chinese Producer Price Index (PPI) climbed to its highest level in 5 years in December, pointing to
higher future inflation for countries that are heavily reliant on imported manufactured goods from China.
China PPI Since 2012
Source: Trading Economics
Locally, Resource stocks continued their extended period of outperformance, as Materials ended the
calendar year as the best performing sector, up more than 20% over the second best performer
(Utilities).The rally in underlying commodity prices has continued longer than most thought possible,
triggering a number of earnings upgrades during the quarter.
Dec 2016 Quarter Year ended Dec 2016
ASX200 Accumulation Index 5.2% 11.8%
Best performing sectors
Financials ex-Property Trusts 12.7% 7.3%
Utilities 9.2% 19.4%
Materials 7.9% 42.9%
Worst performing sectors
Healthcare -8.8% 1.9%
Telecommunications -4.3% -7.1%
Consumer Discretionary -2.0% 11.9%
Financials (dominated by the major banks) led the market during the period, as investors took the view that
“The nation of
China is
responsible for
almost half of
America’s trade
deficit. They haven’t
played by the rules
and I know it’s time
they’re going to
start.” Donald
Trump, President
Elect of the United
States, 08/12/2016
Commentary - continued
interest rates have bottomed, pointing to higher Net Interest Margins (NIM) being earned in the future.
Utilities gained on the back of Cheung Kong Infrastructure’s bid for Duet Group at a 27% premium to the
last close before the bid was announced.
This quarter we observed a large scale transition out of high multiple industrial ‘growth’ stocks into the
‘barbells’ of the market, being Banks and Resources. Following an extended period of significant
outperformance, Healthcare was one sector which was on the wrong side of that market transition, with
stocks such as CSL, Cochlear and Ramsay all falling victim to profit taking.
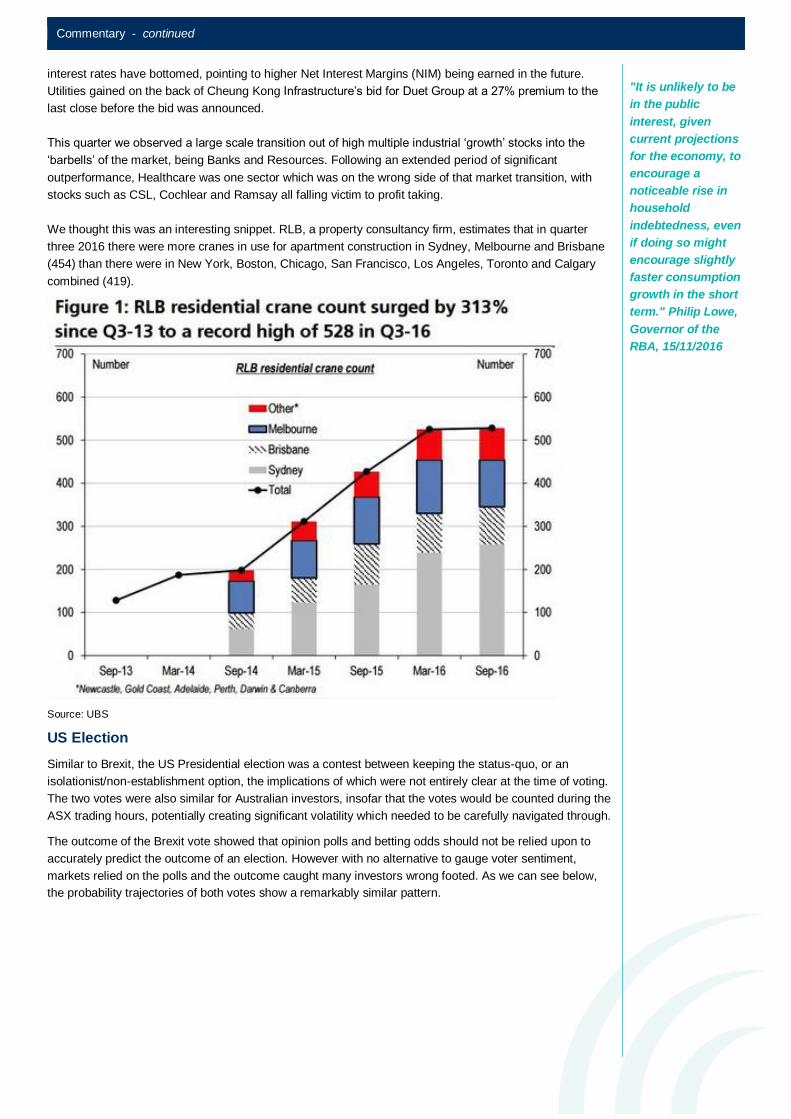
We thought this was an interesting snippet. RLB, a property consultancy firm, estimates that in quarter
three 2016 there were more cranes in use for apartment construction in Sydney, Melbourne and Brisbane
(454) than there were in New York, Boston, Chicago, San Francisco, Los Angeles, Toronto and Calgary
combined (419).
Source: UBS
US Election
Similar to Brexit, the US Presidential election was a contest between keeping the status-quo, or an
isolationist/non-establishment option, the implications of which were not entirely clear at the time of voting.
The two votes were also similar for Australian investors, insofar that the votes would be counted during the
ASX trading hours, potentially creating significant volatility which needed to be carefully navigated through.
The outcome of the Brexit vote showed that opinion polls and betting odds should not be relied upon to
accurately predict the outcome of an election. However with no alternative to gauge voter sentiment,
markets relied on the polls and the outcome caught many investors wrong footed. As we can see below,
the probability trajectories of both votes show a remarkably similar pattern.
"It is unlikely to be
in the public
interest, given
current projections
for the economy, to
encourage a
noticeable rise in
household
indebtedness, even
if doing so might
encourage slightly
faster consumption
growth in the short
term." Philip Lowe,
Governor of the
RBA, 15/11/2016

Commentary - continued
Brexit Vote Probabilities
Source: PredictWise
US Presidential Vote Probabilities
Source: Wall Street Journal
The ASX and U.S. futures markets traded progressively lower during the day as the Trump election victory
became increasingly likely, with ‘beta’ names (cyclical stocks with more market exposure) selling off
sharply as the market took a ‘risk-off’ stance. The market sentiment however took a 180 degree turn
following Donald Trump’s victory speech, which was seen as much more moderate (and even Presidential)
than many predicted he would give (and indeed was capable of). Instead of being seen as a dangerous
and protectionist leader, markets suddenly lauded Trump as a pro-business Republican, capable of
restoring robust economic growth. Commodities rallied particularly hard on the back of Trump’s $500bn
infrastructure plan to ‘rebuild’ America (with the exception of gold, which is seen as a safe-haven asset).
Since the election, we have found that monitoring Donald Trump’s twitter feed (@realDonaldTrump) has
become necessary given his ability to move markets 140 characters at a time. Some of the tweets sent out
by Trump could be seen as amusing, if only they weren’t being sent out by someone who was about to
become the leader of the free world.
An interesting trend we have observed since the election outcome has been the return of ‘animal spirits’ in
the US economy. Consumer confidence for example is at its highest level since 2001. According to
President Elect Trump, this was due to his influence.
“The world was
gloomy before I
won – there was no
hope. Now the
market is up nearly
10% and Christmas
spending is over a
trillion dollars!”
Donald Trump (via
Twitter), President
Elect of the United
States, 26/12/2016

Commentary - continued
Source: Investing.com
Source: Twitter
Related to consumer confidence increasing, inflation expectations and Treasury yields have also shot up
post the election outcome. We suspect a Trump administration will be required to issue a significant
amount of Treasuries to fund its planned infrastructure spend.
US 5 Year Bond Yield and Inflation Expectation
Source: Bloomberg
“The message from
history is so
blatantly obvious –
that free trade
causes mutual
prosperity while
protectionism
causes poverty –
that it seems
incredible that
anybody ever
thinks otherwise.”
Matt Ridley, The
Rational Optimist,
2010
0.80
1.00
1.20
1.40
1.60
1.80
2.00
2.20
5 YearInflationExpectation
5Y BondYield
Commentary - continued
Brink’s
During the quarter we increased our position in The Brink’s Company (Brink’s), having initiated the position
in the September 2016 quarter. Headquartered in the US, Brink’s is the largest global provider of secure
transportation of valuables and cash management services, generating revenue of US$3bn and operating
in 41 countries. Approximately half of Brink’s revenue is generated from ‘core’ services including the
secure transportation of cash in armoured trucks and from servicing automatic teller machines. The other
half of Brink’s revenue is generated from ‘high-value’ services including global transportation of valuables,
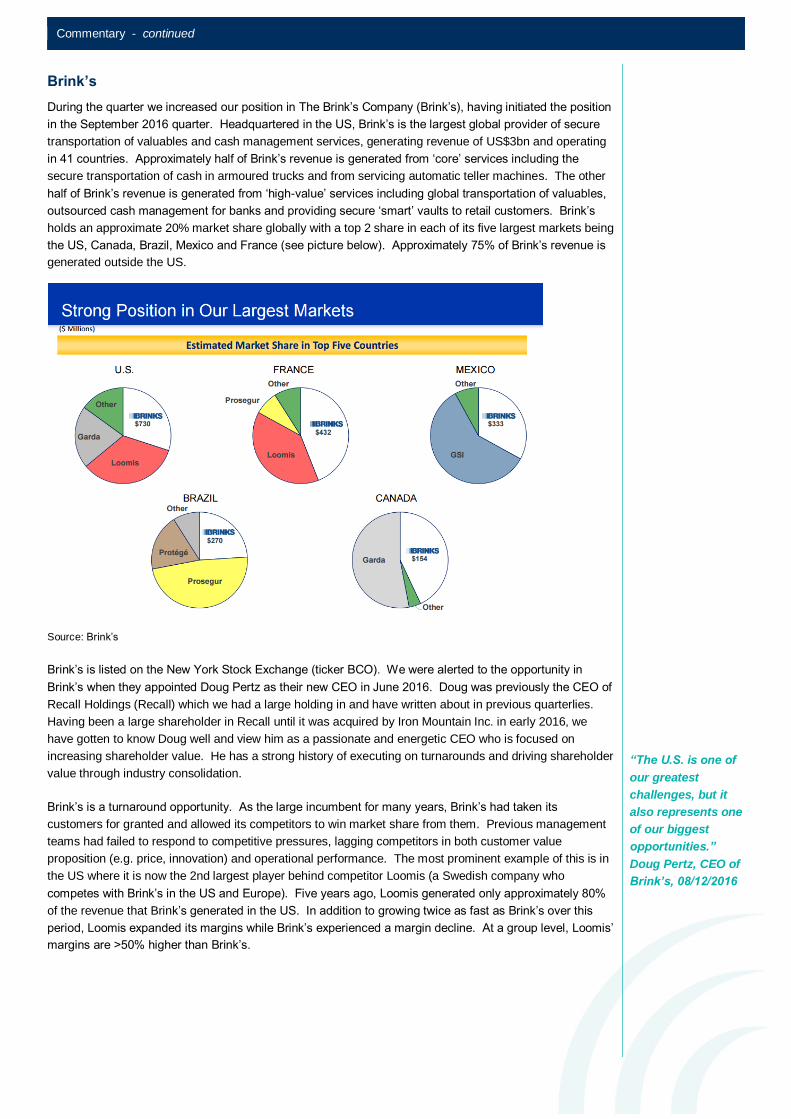
outsourced cash management for banks and providing secure ‘smart’ vaults to retail customers. Brink’s
holds an approximate 20% market share globally with a top 2 share in each of its five largest markets being
the US, Canada, Brazil, Mexico and France (see picture below). Approximately 75% of Brink’s revenue is
generated outside the US.
Source: Brink’s
Brink’s is listed on the New York Stock Exchange (ticker BCO). We were alerted to the opportunity in
Brink’s when they appointed Doug Pertz as their new CEO in June 2016. Doug was previously the CEO of
Recall Holdings (Recall) which we had a large holding in and have written about in previous quarterlies.
Having been a large shareholder in Recall until it was acquired by Iron Mountain Inc. in early 2016, we
have gotten to know Doug well and view him as a passionate and energetic CEO who is focused on
increasing shareholder value. He has a strong history of executing on turnarounds and driving shareholder
value through industry consolidation.
Brink’s is a turnaround opportunity. As the large incumbent for many years, Brink’s had taken its
customers for granted and allowed its competitors to win market share from them. Previous management
teams had failed to respond to competitive pressures, lagging competitors in both customer value
proposition (e.g. price, innovation) and operational performance. The most prominent example of this is in
the US where it is now the 2nd largest player behind competitor Loomis (a Swedish company who
competes with Brink’s in the US and Europe). Five years ago, Loomis generated only approximately 80%
of the revenue that Brink’s generated in the US. In addition to growing twice as fast as Brink’s over this
period, Loomis expanded its margins while Brink’s experienced a margin decline. At a group level, Loomis’
margins are >50% higher than Brink’s.
“The U.S. is one of
our greatest
challenges, but it
also represents one
of our biggest
opportunities.”
Doug Pertz, CEO of
Brink’s, 08/12/2016
Commentary - continued
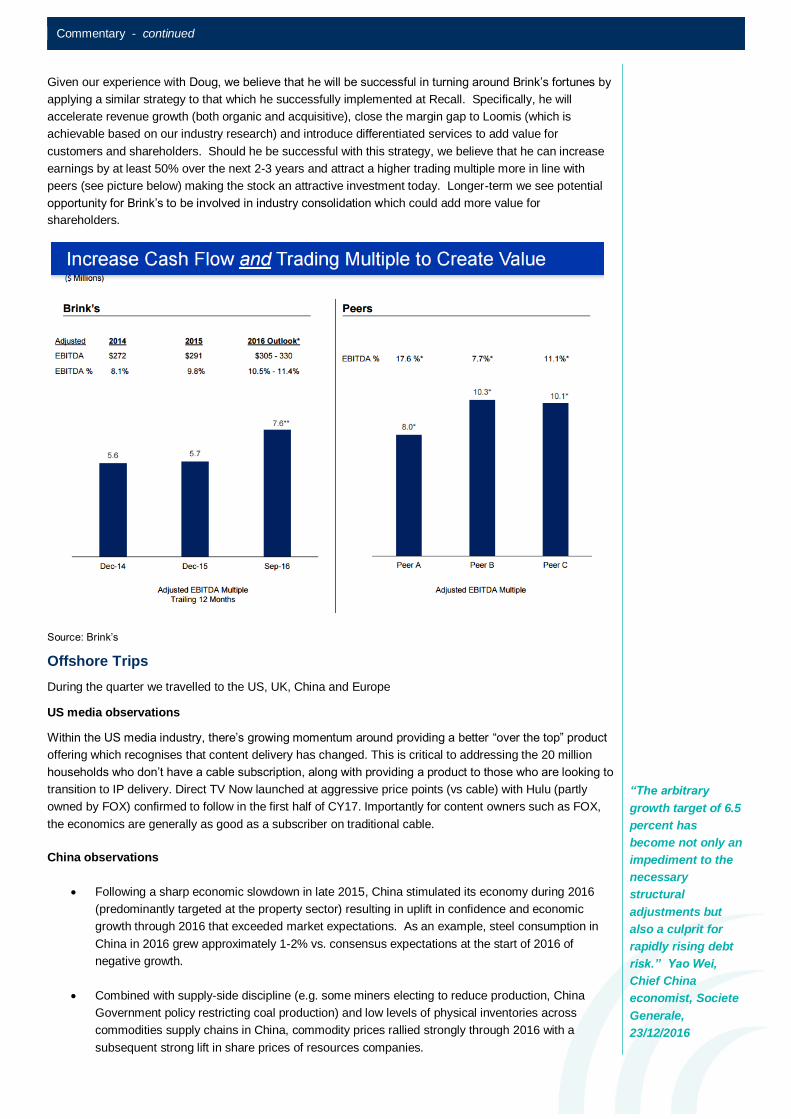
Given our experience with Doug, we believe that he will be successful in turning around Brink’s fortunes by
applying a similar strategy to that which he successfully implemented at Recall. Specifically, he will
accelerate revenue growth (both organic and acquisitive), close the margin gap to Loomis (which is
achievable based on our industry research) and introduce differentiated services to add value for
customers and shareholders. Should he be successful with this strategy, we believe that he can increase
earnings by at least 50% over the next 2-3 years and attract a higher trading multiple more in line with
peers (see picture below) making the stock an attractive investment today. Longer-term we see potential
opportunity for Brink’s to be involved in industry consolidation which could add more value for
shareholders.
Source: Brink’s
Offshore Trips
During the quarter we travelled to the US, UK, China and Europe
US media observations
Within the US media industry, there’s growing momentum around providing a better “over the top” product
offering which recognises that content delivery has changed. This is critical to addressing the 20 million
households who don’t have a cable subscription, along with providing a product to those who are looking to
transition to IP delivery. Direct TV Now launched at aggressive price points (vs cable) with Hulu (partly
owned by FOX) confirmed to follow in the first half of CY17. Importantly for content owners such as FOX,
the economics are generally as good as a subscriber on traditional cable.
China observations
Following a sharp economic slowdown in late 2015, China stimulated its economy during 2016
(predominantly targeted at the property sector) resulting in uplift in confidence and economic
growth through 2016 that exceeded market expectations. As an example, steel consumption in
China in 2016 grew approximately 1-2% vs. consensus expectations at the start of 2016 of
negative growth.
Combined with supply-side discipline (e.g. some miners electing to reduce production, China
Government policy restricting coal production) and low levels of physical inventories across
commodities supply chains in China, commodity prices rallied strongly through 2016 with a
subsequent strong lift in share prices of resources companies.
“The arbitrary
growth target of 6.5
percent has
become not only an
impediment to the
necessary
structural
adjustments but
also a culprit for
rapidly rising debt
risk.” Yao Wei,
Chief China
economist, Societe
Generale,
23/12/2016

Commentary - continued
On early indications, 2017 appears to be another year of demand and economic growth at-or-
above market expectations, as infrastructure stimulus should offset any slowdown in the property
industry which saw tightening measures introduced in the fourth quarter of 2016. However, unlike
2016, we expect to see the supply-side responding to the positive commodity price signals and
accelerate production growth, which should see supply chains restock and ultimately put
downwards pressure on commodity prices in the year ahead.
Outlook
We said last quarter we thought the uncertainty of the US election was being priced in by the market, and
now post a Trump victory, the uncertainty discount has unwound. The continued solid US macro data and
Trump commentary about tax cuts and large scale infrastructure spending has led to increased inflation
expectations, which is driving a large reflation rotation trade towards risk assets. We have been surprised
by the degree of animal spirits and bullishness driving the global market rally, but we observe it has been
partly fuelled by accelerating Chinese capital outflows and the US dollar carry trade also attracting money
from Europe, the UK and emerging markets.
Fundamentally we observe better US economic data and sentiment, flat Europe (still) and China hanging in
there (despite relentless capital outflows and credit growth). Australia remains patchy but business
sentiment has continued its improvement which we highlighted last quarter.
Looking forward to the next reporting period, we don't expect much in the way of upside risk despite
expectations being lowered during the AGM season. Given the strength of the recent equities rally we are
again erring on the side of caution as forecast Earnings Per Share growth acceleration doesn't seem likely
based on our contact with companies, and Price to Earnings multiple expansion will be difficult with early
signs of inflation becoming evident (mainly in the US). The recent sell off of some high quality stocks has
created some attractive stock picking opportunities. Greencape remains committed to applying our process
and adding to positions when our conviction warrants it.
“It's waiting that
helps you as an
investor, and a lot
of people just can't
stand to wait. If you
didn't get the
deferred-
gratification gene,
you've got to work
very hard to
overcome that.”
Charlie Munger,
Vice Chairman of
Berkshire
Hathaway, 2014

Greencape Wholesale High Conviction Fund - December 2016 - continued
More information
To find out more about investing with Greencape, please contact:
Fidante Partners Investor Services team on: 13 51 53
Visit the Greencape website: www.greencapecapital.com.au
Email Greencape at: [email protected]
Financial advisers
For more information, please contact:
Fidante Partners Adviser Services
Phone: +61 1800 195 853
Email: [email protected]
Institutional investors and asset consultants
For more information, please contact:
Roger Prezens
Institutional Business Development Manager
Fidante Partners
Phone: +61 3 9947 9419
Email: [email protected]
The Professional Planner/Zenith Fund Awards are determined using proprietary methodologies. Fund Awards and ratings are solely statements ofopinion and do not represent recommendations to purchase, hold, or sell any securities or make any other investment decisions. Ratings are subjectto change.
Standard & Poor’s Information Services (Australia) Pty Ltd (ABN: 17 096 167 556, Australian Financial Services Licence Number: 258 896)(Standard & Poor’s) Fund Awards are determined using proprietary methodologies. Fund Awards and ratings are solely statements of opinion anddo not represent recommendations to purchase, hold, or sell any securities or make any other investment decisions. Ratings are subject to change.For the latest ratings information please visit www.fundsinsights.com.au.
Unless otherwise specified, any information contained in this publication is current as at the date of this report and is provided by Fidante PartnersLimited ABN 94 002 835 592 AFSL 234 668 (Fidante Partners) the issuer of the Greencape Wholesale High Conviction Fund ARSN 121 326 225(Fund). Greencape Capital Pty Ltd ABN 98 120 328 529 AFSL 303 903 (Greencape) is the investment manager of the Fund. It should be regardedas general information only rather than advice. It has been prepared without taking account of any person's objectives, financial situation or needs.Because of that, each person should, before acting on any such information, consider its appropriateness, having regard to their objectives, financialsituation and needs. Each person should obtain the relevant Product Disclosure Statement (PDS) relating to the Fund and consider that PDS beforemaking any decision about the Fund. A copy of the PDS can be obtained from your financial adviser, our Investor Services team on 13 51 53, or ourwebsite www.fidante.com.au. If you acquire or hold the product, we and/or a Fidante Partners related company will receive fees and other benefitswhich are generally disclosed in the PDS or other disclosure document for the product. Neither Fidante Partners nor a Fidante Partners relatedcompany and our respective employees receive any specific remuneration for any advice provided to you. However, financial advisers (includingsome Fidante Partners related companies) may receive fees or commissions if they provide advice to you or arrange for you to invest in the Fund.Greencape, some or all Fidante Partners related companies and directors of those companies may benefit from fees, commissions and otherbenefits received by another group company.