“Green” Transportation Taxes and Fees: A Survey Of ...
142
“Green” Transportation Taxes and Fees: A Survey Of Californians MTI Report 08-05 MTI “Green” Transportation Taxes and Fees: A Survey Of Californians MTI Report 08-05
Transcript of “Green” Transportation Taxes and Fees: A Survey Of ...

“Green” Transportation Taxes and Fees: A Survey Of Californians
MTI Report 08-05
Funded by U.S. Department of Transportation and California Department of Transportation
MT
I“G
reen” Transportation T
axes and Fees: A Survey O
f Californians
MT
I Report 08-05June 2009

The Norman Y. Mineta International Institute for Surface Transportation Policy Studies (MTI) was established by Congress as part of the Intermodal Surface Transportation Efficiency Act of 1991. Reauthorized in 1998, MTI was selected by the U.S. Department of Transportation through a competitive process in 2002 as a national “Center of Excellence.” The Institute is funded by Con-gress through the United States Department of Transportation’s Research and Innovative Technology Administration, the Califor-nia Legislature through the Department of Transportation (Caltrans), and by private grants and donations.
The Institute receives oversight from an internationally respected Board of Trustees whose members represent all major surface transportation modes. MTI’s focus on policy and management resulted from a Board assessment of the industry’s unmet needs and led directly to the choice of the San José State University College of Business as the Institute’s home. The Board provides policy direction, assists with needs assessment, and connects the Institute and its programs with the international transportation community.
MTI’s transportation policy work is centered on three primary responsibilities:
MINETA TRANSPORTATION INSTITUTE
Research MTI works to provide policy-oriented research for all levels of government and the private sector to foster the development of optimum surface transportation systems. Research areas include: transportation security; planning and policy develop-ment; interrelationships among transportation, land use, and the environment; transportation finance; and collaborative labor-management relations. Certified Research Associates conduct the research. Certification requires an advanced degree, gener-ally a PhD, a record of academic publications, and professional references. Research projects culminate in a peer-reviewed publication, available both in hardcopy and on TransWeb, the MTI website (http://transweb.sjsu.edu).
Education The educational goal of the Institute is to provide graduate-level education to students seeking a career in the development and operation of surface transportation programs. MTI, through San José State University, offers an AACSB-accredited Master of Sci-ence in Transportation Management and a graduate Certificate in Transportation Management that serve to prepare the nation’s transportation managers for the 21st century. The master’s de-gree is the highest conferred by the California State University system. With the active assistance of the California Department
of Transportation, MTI delivers its classes over a state-of-the-art videoconference network throughout the state of California and via webcasting beyond, allowing working transportation professionals to pursue an advanced degree regardless of their location. To meet the needs of employ-ers seeking a diverse workforce, MTI’s education program promotes enrollment to under-represented groups.
Information and Technology Transfer MTI promotes the availability of completed research to professional organizations and journals and works to integrate the research findings into the graduate education program. In addition to publishing the studies, the Institute also sponsors symposia to disseminate research results to transportation professionals and encourages Research As-sociates to present their findings at conferences. The World in Motion, MTI’s quarterly newsletter, covers innovation in the Institute’s research and education programs. MTI’s extensive collection of transportation-related publications is integrated into San José State University’s world-class Martin Luther King, Jr. Library.
The contents of this report reflect the views of the authors, who are responsible for the facts and accuracy of the information presented here-in. This document is disseminated under the sponsorship of the U.S. Department of Transportation, University Transportation Centers Program and the California Department of Transportation, in the interest of information exchange. This report does not necessarily reflect the official views or policies of the U.S. government, State of California, or the Mineta Transportation Institute, who assume no liability for the contents or use thereof. This report does not constitute a standard specification, design standard, or regulation.
DISCLAIMER
MTI FOUNDER Hon. Norman Y. Mineta
MTI BOARD OF TRUSTEESHonorary Co-ChairHon. James Oberstar **
ChairHouse Transportation andInfrastructure CommitteeHouse of RepresentativesWashington, DC
Honorary Co-Chair
Hon. John L. Mica **
Ranking MemberHouse Transportation andInfrastructure CommitteeHouse of RepresentativesWashington, DC
David L.Turney *
Chair/President/CEODigital Recorders, Inc.Dallas, TX
William W. Millar ^
Vice Chair/PresidentAmerican Public TransportationAssociation (APTA)Washington, DC
Hon. Rod Diridon, Sr. #
Executive DirectorMineta Transportation InstituteSan Jose, CA
Ronald BarnesGeneral ManagerVeolia Transportation/EastValley RPTA
Mesa, AZ
Rebecca BrewsterPresident/COOAmerican TransportationResearch InstituteSmyrna, GA
Donald H. CamphPresidentCalifornia Institute for Technology ExchangeLos Angeles, CA
Anne P. CanbyPresidentSurface TransportationPolicy ProjectWashington, DC
Jane ChmielinskiPresidentDMJM Harris
New York, NY
William DoreyPresident/CEOGranite Construction, Inc.
Watsonville, CA
Mortimer DowneyChairmanPB Consult Inc.
Washington, DC
Nuria FernandezCommissionerCity of Chicago,Department of Aviation,
Chicago, IL
Steve HemingerExecutive DirectorMetropolitan TransportationCommissionOakland, CA
Hon. John Horsley #
Executive DirectorAmerican Association of StateHighway & TransportationOfficials (AASHTO)Washington, DC
Joseph BoardmanPresident/CEOAmtrak60 Massachusetts Ave., N.E.Washington, DC 20002
Will KemptonDirectorCalifornia Department of TransportationSacramento, CA
Brian MacleodSenior Vice PresidentGillig Corporation
Hayward, CA
Dr. Bruce MagidDeanCollege of BusinessSan José State UniversitySan José, CA
Stephanie PinsonPresident/COOGilbert Tweed Associates, Inc.New York, NY
Hans RatSecretary GeneralUnion Internationale desTransports PublicsBruxelles, Belgium
Vickie ShafferGeneral ManagerTri-State Transit AuthorityHuntington, WV
Paul Toliver #
PresidentNew Age IndustriesSeattle, WA
Michael S. Townes #
President/CEOTransportation DistrictCommission of Hampton Roads
Hampton, VA
Edward WytkindPresidentTransportation TradesDepartment, AFL-CIOWashington, DC
Hon. Rod Diridon, Sr.Executive Director
Karen E. Philbrick, Ph.D.Research Director
Peter Haas, Ph.D.Education Director
Donna MaurilloCommunications Director
Asha Weinstein Agrawal, Ph.D.National Transportation Finance Center
Brian Michael JenkinsNational Transportation Security Center
Asha Weinstein Agrawal, Ph.D.Urban and Regional Planning San José State University
Jan Botha, Ph.D.Civil & Environmental EngineeringSan José State University
Katherine Kao Cushing, Ph.D.Enviromental Science San José State University
Dave Czerwinski, Ph.D.Marketing and Decision ScienceSan José State University
Frances Edwards, Ph.D.Political ScienceSan José State University
Taeho Park, Ph.D.Organization and Management San José State University
Diana WuMartin Luther King, Jr. LibrarySan José State University
Directors Research Associates Policy Oversight Committee
** Honorary* Chair^ Vice Chair# Past Chair

MTI REPORT 08-05
"GREEN" TRANSPORTATION TAXES AND FEES:
A SURVEY OF CALIFORNIANS
June 2009
Asha Weinstein Agrawal, PhD, Jennifer Dill, PhD,
and Hilary Nixon, PhD
a publication of the
Mineta Transportation InstituteCollege of Business
San José State UniversitySan José, CA 95192-0219
Created by Congress in 1991

TECHNICAL REPORT DOCUMENTATION PAGE
1. Report No. 2. Government Accession No. 3. Recipient’s Catalog No.
4. Title and Subtitle 5. Report Date
6. Performing Organization Code
7. Authors 8. Performing Organization Report No.
9. Performing Organization Name and AddressMineta Transportation InstituteCollege of BusinessSan José State UniversitySan José, CA 95192-0219
10. Work Unit No.
11. Contract or Grant No.DTRT07-G-0054
12. Sponsoring Agency Name and Address 13. Type of Report and Period Covered
14. Sponsoring Agency Code
15. Supplementary Notes
16. Abstract
17. Keywords 18. Distribution StatementNo restriction. This document is available to the public through theNational Technical Information Service, Springfield, VA 22161
19. Security Classif. (of this report)Unclassified
20. Security Classif. (of this page)Unclassified
21. No. of Pages 22. Price$15.00
Form DOT F 1700.7 (8-72)
California Department of Transportation
Sacramento, CA 95815
U.S. Department of TransportationResearch and Innovative Technology
Administration1200 New Jersey Avenue SE, Rm. E33Washington, DC 20590-0001
June 2009
MTI 08-05
Asha Weinstein Agrawal, PhD, Jennifer Dill, PhD, and Hilary Nixon, PhD
This report explores public opinion on a new and promising concept―green transportation taxes and fees. Theseare taxes and fees set at variable rates, with higher rates for more polluting vehicles and lower rates for those thatpollute less. This approach to transportation taxes and fees adapts the traditional transportation finance system toachieve two critical public benefits at once: encouraging drivers to choose more environmentally-friendlytransportation options and raising revenue for needed transportation programs.
To test public support for green transportation taxes and fees, the authors conducted a random telephone survey of1,500 Californians that asked respondents their views on five hypothetical tax and fee options: a flat-rate and agreen vehicle registration fee, a flat-rate and a green mileage fee, and a “feebate” program for new vehicle purchasesunder which more-polluting vehicles would be charged a tax and less-polluting vehicles would receive a rebate.
The survey results show that the concept of green transportation taxes and fees strongly appeals to Californians.The survey tested this in two ways: by testing support for the three hypothetical green transportation tax and feepolicies, and also by comparing support levels for flat-rate versus green versions of two taxes. Majorities of therespondents supported all three green taxes and fees tested.
Another striking finding from the survey is that support for the green taxes and fees did not vary greatly bypopulation subgroups; a diverse range of Californians supported the green taxes and fees. An analysis comparingsupport for the green and flat-rate vehicle registration fee and feebate proposals confirmed that in every subgroup,more people within that subgroup supported the green than the flat version of the two taxes tested.
Environmental protection;Finance; State taxation;Registration fees; Revenues;Taxation; Taxes
128
CA-MTI-09-2701
"Green" Transportation Taxes and Fees: A Survey of Californians

by Mineta Transportation Institute
All rights reserved
To order this publication, please contact the following:Mineta Transportation Institute
College of BusinessSan José State UniversitySan José, CA 95192-0219
Tel (408) 924-7560Fax (408) 924-7565
E-mail: [email protected]://transweb.sjsu.edu
Copyright © 2009
Library of Congress Catalog Card Number: 2009931100

ACKNOWLEDGMENTS
The authors would like to acknowledge and thank the following people for their importantcontributions to this project.
Thank you to research assistants Vicki Sherman and Dennis Freeman, and well as to PhilTrounstine, director of the Survey Policy and Research Institute at San José State University,who managed the survey implementation and provided advice on the questionnaire design.EMH Opinion Sampling, Inc. conducted the telephone interviewing.
Finally, thanks are offered to Mineta Transportation Institute staff, including ResearchDirector Trixie Johnson, Communications Director Donna Maurillo, Research SupportManager Meg Fitts and Publications Assistant Sahil Rahimi. Publishing and editing serviceswere provided by Catherine Frazier.

Mineta Transportation Institute
i
TABLE OF CONTENTS
EXECUTIVE SUMMARY 1
INTRODUCTION 7
FINDINGS FROM THE LITERATURE 15
Transportation Finance Measures Linked to Environmental Outcomes: A Review of Public Opinion 15
Factors Correlated with Pro-Environment Behavior 19
SURVEY DESIGN AND ADMINISTRATION 23
SURVEY RESULTS 27
Survey Respondents 27
Support for the Green Transportation Taxes and Fees 30
Support for Green (Variable Rate) Versus Flat-Rate Transportation Taxes and Fees 46
CONCLUSIONS AND RECOMMENDATIONS 55
Summary of Key Findings 55
Policy Implications for Transportation Professionals and Policymakers 58
Recommendations for Future Research 59
APPENDIX A: SURVEY QUESTIONNAIRE AND TOP-LINE RESULTS 61
APPENDIX B: POLICY SUPPORT BY SOCIO-DEMOGRAPHIC CATEGORY 73
APPENDIX C: POLICY SUPPORT BY TRAVEL BEHAVIOR 79
APPENDIX D: POLICY SUPPORT BY TYPE OF VEHICLE RESPONDENT DRIVES MOST 85
APPENDIX E: POLICY SUPPORT BY OPINIONS ON AIR POLLUTION, TRAFFIC CONGESTION, AND TRANSPORTATION SYSTEM QUALITY 91
APPENDIX F: POLICY SUPPORT BY OPINIONS ON TRANSPORTATION REVENUES PRINCIPLES OF STRUCTURING VEHICLE REGISTRATION FEES 95

ii Table of Contents
Mineta Transportation Institute
APPENDIX G: POLICY SUPPORT BY KNOWLEDGE OF TRANSPORTATION ISSUES 99
APPENDIX H: POLICY SUPPORT BY OPINIONS ON ENVIRONMENTAL POLICY ISSUES 107
ENDNOTES 111
ABBREVIATIONS AND ACRONYMS 117
BIBLIOGRAPHY 119
ABOUT THE AUTHORS 125
PEER REVIEW 127
Mineta Transportation Institute
List of Tables iii
LIST OF TABLES
1. Findings from a sample on flat transportation taxes to improve the environment 17
2. Findings from surveys on variable environmental taxes or fees for transportation 18
3. Socio-demographic characteristics of survey respondents and of all Californians 28
4. Travel behavior information and data about the vehicle respondents drive most often 29
5. Statewide support levels for the five transportation tax and fee options 31
6. Support for the green fee policies, by socio-demographic categories and region 33
7. Support for the green fee policies, by travel behavior 35
8. Support for green fee policies, by type of vehicle respondent drives the most 37
9. Respondents’ opinion on air pollution, traffic congestion, and transportation system quality 38
10. Support for the green fee policies, by opinions on air pollution, traffic congestion, and transportation system quality 39
11. Respondents’ opinions on transportation revenues and principles of structuring vehicle registration fees 40
12. Support for the green fee policies, by opinions on transportation revenues and principles of structuring vehicle registration fees 41
13. Respondents’ knowledge about transportation finance and about the link between motor vehicle use and the environment 42
14. Support for the green fee policies, by knowledge of transportatoin and environmental issues 43
15. Respondents’ opinions on policy topics 44
16. Support for the green fee policies, by policy preference 46
17. Difference in support for the green vs. flat-rate registration and mileage fees by socio-demographic categories 48
18. Difference in support for the green vs. flat-rate registration and mileage fees, by travel behavior 49
19. Difference in support for the greeen vs. flat-rate registration and mileage fees, by type of vehicle respondent drives most 50
20. Difference in support for the green vs. flat-rate registration and mileage fees,by opinions on air pollution, traffic congestion, and transportation system quality 51
21. Difference in support for the green vs. flat-rate registration and mileage fees, by opinions on transportation revenues and principles of structuring vehicle registration fees 52
22. Difference in support for the green vs. flat-rate registration and mileage fees, by knowledge of transportation issues 53

iv List of Tables
Mineta Transportation Institute
23. Difference in support for the green vs. flat-rate registration and mileage fees, by opinion on environmental policy topics 54
24. Support for the flat-rate vehicle registration fee, by socio-demographic categories (detailed breakdown) 71
25. Support for the green vehicle registration fee, by socio-demographic categories(detailed breakdown) 72
26. Support for basic mileage fee, by socio-demographic categories (detailed breakdown) 73
27. Support for the green mileage fee, by socio-demographic categories (detailed breakdown) 74
28. Support for the feebate, by socio-demographic categories (detailed breakdown) 75
29. Support for the flat-rate vehicle registration fee, by travel behavior (detailed breakdown) 77
30. Support for the green vehicle registration fee, by travel behavior (detailed breakdown) 78
31. Support for the flat-rate mileage fee, by travel behavior (detailed breakdown) 79
32. Support for the green mileage fee, by travel behavior (detailed breakdown) 80
33. Support for the feebate, by travel behavior (detailed breakdown) 81
34. Support for the flat-rate vehicle registration fee, by type of vehicle respondent drives most (detailed breakdown) 83
35. Support for the green vehicle registration fee, by type of vehicle respondent drives most (detailed breakdown) 84
36. Support for the flat-rate mileage fee, by type of vehicle respondent drives most(detailed breakdown) 85
37. Support for the green mileage fee, by type of vehicle respondent drives most (detailed breakdown) 86
38. Support for the feebate, by type of vehicle respondent drives most (detailed breakdown) 87
39. Support for the flat-rate vehicle registration fee, by opinions on air pollution, traffic congestion, and transportation system quality (detailed breakdown) 89
40. Support for the green registration fee, by opinions on air pollution, traffic congestion and transportation system quality (detailed breakdown) 90
41. Support for the flat-mileage fee, by opinions on air pollution, traffic congestion, and transportation system quality (detailed breakdown) 91
42. Support for the green mileage fee, by opinions on air pollution, traffic congestion and transportation system quality (detailed breakdown) 92
43. Support for the feebate, by opinions on air pollution, traffic congestion, and transportation system quality (detailed breakdown) 93
44. Support for the flat-rate vehicle registration fee, by opinions on transportation revenues and principles of structuring vehicle registration fees (detailed breakdown) 95
Mineta Transportation Institute
List of Tables v
45. Support for the green vehicle registration fee, by opinions on transportation revenues and principles of structuring vehicle registration fees (detailed breakdown) 95
46. Support for flat-rate mileage fee, by opinions on transportation revenues andprinciples of structuring vehicle registration fees (detailed breakdown) 96
47. Support for the green mileage fee, by opinions on transportation revenues andprinciples of structuring vehicle registration fees (detailed breakdown) 96
48. Support for the feebate, by opinions on transportation revenues and principles of structuring vehicle registration fees (detailed breakdown) 97
49. Support for the flat-rate vehicle registration fee by knowledge of transportation issues (detailed breakdown) 99
50. Support for the green vehicle registration fee, by knowledge of transportation issues (detailed breakdown) 100
51. Support for the flat-mileage fee, by knowledge of transportation issues (detailed breakdown) 101
52. Support for the green mileage fee, by knowledge of transportation issues (detailed responses) 102
53. Support for the feebate, by knowledge of transportation issues 103
54. Support for the flat-rate registration fee, by opinions on environmental policy issues (detailed breakdown) 105
55. Support for the green vehicle registration fee, by opinions on environmental policy issues (detailed breakdown) 106
56. Support for the flat-mileage fee, by opinions on environmental issues (detailed breakdown) 107
57. Support for the green mileage fee, by opinions on environmental policy issues (detailed breakdown) 108
58. Support for the feebate, by knowledge of transportation issues (detailed breakdown) 109

vi List of Tables
Mineta Transportation Institute

Mineta Transportation Institute
1
EXECUTIVE SUMMARY
This report explores public opinion on a new and promising concept—green transportationtaxes and fees. These are taxes and fees set at variable rates, with higher rates for morepolluting vehicles and lower rates for those that pollute less. This approach to transportationtaxes and fees adapts the traditional transportation finance system, permitting it to achievetwo critical public benefits simultaneously: encouraging drivers to choose moreenvironmentally-friendly transportation options, and raising revenue for neededtransportation programs.
Growing concern with global warming, air pollution, and energy security, combined withCalifornia’s concern over shrinking transportation revenues, make this type of transportationfinance system a particularly exciting finance approach to evaluate at present. Thecombination of declining transportation revenues and growing needs opens a window forchange in the transportation finance system, as lawmakers explore different options to raiseadditional revenues for transportation purposes. While that window remains open, research isneeded to show whether or not green transportation taxes and fees are a politically feasibleoption.
To test public support for the concept, the authors conducted a random telephone survey of1,500 Californians, asking respondents about their support for three green transportation taxand fee options, as well as two fees that were not structured as green ones. The questionnairewas designed to shed light on two broad research questions:
1. How likely are California residents to support green transportation taxes and fees,defined as those that set lower rates for more environmentally-friendly vehicles and higherrates for less environmentally-unfriendly ones?
2. What are the socio-demographic, attitudinal, and knowledge factors that influencesupport for such taxes and fees?
The survey results show that the public does indeed support the concept, and this support heldacross most population subgroups.
Green Transportation Taxes and Fees—Why Now?
For decades California, like many states, has relied largely on state and federal fuel tax revenuesto fund its transportation system, supplemented with local and state sales tax and othergeneral fund revenues. This system no longer functions as well as it has in the past, becauselawmakers have been hesitant to raise fuel tax rates in recent decades to keep pace withestimates of need. Although the gas tax will remain the main source of state transportationrevenues for the foreseeable future, lawmakers are interested in finding ways to supplementthose revenues. Three converging trends point to green transportation taxes and fees as apromising approach to revising the current system:

2 Executive Summary
Mineta Transportation Institute
• A growing desire to encourage people to choose transportation behaviors and vehiclesthat will reduce air pollution and greenhouse gas emissions.
• A desire to identify new sources of transportation revenue that are politicallyacceptable, as well as technically desirable for other reasons.
• Increasing interest and acceptance of using market-based policies, such as tolls, toencourage socially desirable and economically efficient transportation choices.
Survey Design
To explore the two research questions presented above, the authors conducted a randomtelephone survey to test Californians’ support for the general concept of green transportationtaxes and fees. (The survey was not designed to determine the optimal dollar charge orimplementation structure for any particular tax and fee option.)
The core of the questionnaire asked respondents to indicate their level of support or oppositionto five different transportation taxes or fees that would raise funds for maintaining andimproving highways, mass transit, and local streets. Three of these were green options, whiletwo were more traditional flat-rate versions of the green taxes tested. By having both flat-rateand green versions of the two taxes, the survey could identify how support levels might varybetween the two options. The five options tested were:
• Feebate: Create a new tax and tax-rebate system on all new vehicles, based on howmuch they pollute. People buying a new vehicle that doesn’t pollute much wouldreceive a rebate of up to $1,000, while people purchasing a new vehicle that pollutes alot would pay a tax up to $2,000. People who buy a vehicle average-emissions vehicleswould not pay additional fees or receive a rebate.
• Flat vehicle registration fee increase: Increase the state’s vehicle registration feefrom its then-current rate of $31 per vehicle per year to $62 per year per vehicle.
• Green vehicle registration fee increase: Increase the vehicle registration fee to anaverage of $62 per vehicle per year, but vary the fee according how much the vehiclepollutes. Vehicles that pollute more would pay higher fees, and vehicles that polluteless would pay lower fees.
• Flat mileage fee: Eliminate the eighteen-cents-per-gallon state gas tax altogether andreplace it with a fee based on the number of miles driven. Each driver would pay a feeof one cent per mile for every mile driven within the state. For example, every onehundred miles driven would incur a fee of one dollar. Vehicles would be equipped withan electronic means to keep track of miles driven and the fee would be paid whendrivers buy gas.
• Green mileage fee: Create a variation on the mileage fee previously described, wherethe fee varies depending upon how much the vehicle pollutes. On average, vehicleswould pay one cent per mile, but vehicles that pollute the least would pay less, andconversely, vehicles that pollute the most would pay more per mile.

Mineta Transportation Institute
Executive Summary 3
A total of 1,500 California adults were interviewed by phone from January 20 to February 1,2008.1 Interviews were conducted in English and Spanish, and they lasted an average of 13minutes. The telephone numbers used were a computer-generated random sample, assuringthat both listed and unlisted phones were included. The overall margin of error for the surveyis +/- 2.5% at the 95% confidence level. Results were weighted slightly to correspond to 2000U.S. Census data for gender and region within the state.
Summary of Key Findings
The survey results show that the concept of green transportation taxes and fees stronglyappeals to Californians. The survey tested this in two ways: by testing support for threehypothetical green transportation tax and fee policies, and also by comparing support levels forflat-rate versus green versions of two hypothetical taxes.
Majorities of the respondents supported all three green taxes and fees tested. Even the greenmileage fee, the least popular option, had 50% support. In contrast, the green vehicleregistration fee and feebate policy both had support levels over 60%.
In addition, the survey found that respondents greatly preferred green transportation taxes andfees to flat-rate versions. For example, when respondents were asked if they would supportincreasing the vehicle registration fee from $31 to a flat rate of $62 for all vehicles, only 41%supported the increase. In contrast, almost two-thirds of respondents (63%) supported a greenversion of the fee, raised to an average rate of $62, with a higher rate for more pollutingvehicles and lower rates for less polluting vehicles. Comparing the two results shows thatconverting the fee increase from a flat-rate one to a green version boosts support by 22percentage points—from less-than-majority support to almost two-thirds support.Respondents also preferred a green mileage fee to a flat-rate version, with 50% support for theformer but only 28% support for the latter.
The finding that Californians clearly seem to prefer green tax or fee proposals to flat-rateversions implies that whether or not a specific green transportation tax or fee ultimately provespopular with the public, a green version is much more likely to be popular than the traditionalapproach of flat-rate taxes and fees.
Another key finding from the survey is that support for the green taxes and fees does not varygreatly by population subgroups. The authors categorized the survey respondents into 120subgroups—by socio-demographic characteristics, attitudes, travel behavior patterns, and soon—and in most subgroups, support for the green registration fee and feebate policy wasabove 50%.2 For the green vehicle registration fee, 87% of the subgroups had support levels of50% or higher, while for the feebate policy, 89% of the subgroups had support levels of 50%or higher. Even the green mileage fee, the least popular of the three green transportation taxesand fees tested, had a support level of at least 50% from half of the subgroups tested.
The analysis comparing support for the green and flat-rate vehicle registration fee and feebateproposals confirms that in every subgroup more people within that subgroup supported the

4 Executive Summary
Mineta Transportation Institute
green than the flat version of the two taxes tested. There was an increase in support of at least10 percentages points in 188 of the 193 comparisons between respondents’ support for a greenversus flat-rate transportation fee policy. For 74% of the 193 cases, the increases in supportwere 20 or more percentage points. Most differences were also statistically significant.
People in a few population subgroups stood out as the least supportive of the green taxes andfees, relative to the other subgroups in that category. Socio-demographic groupings did notprove influential here. Rather, some of the questions about vehicle ownership, attitudes, andknowledge revealed these low levels of support. The characteristics that proved importantwere as follows:
Vehicle characteristics. People are less supportive if they:
• Drive vehicles with a fuel efficiency below 18 miles per gallon (mpg).
• Drive pick-up trucks. (Drivers of SUVs, vans, and minivans were also somewhat lesssupportive than drivers of passenger cars, but the differences were mostly notstatistically significant.)
Opinions and attitudes. People are less supportive if they:
• Think that transportation congestion is not much of a problem or no problem forCalifornia.
• Think that smog and air pollution are not much of a problem or no problem forCalifornia.
• Disagree with the statement that “We must protect the environment even if it meanspaying higher prices for gasoline and electricity.”
• Think that people like themselves will have to make no changes in their lifestyle tosolve today’s environmental problems.
• Think that the U.S. should meet its growing energy needs by emphasizing gas, oil, andcoal supplies, rather than developing wind, hydro, and solar power.
• Prefer to pay lower taxes and have a state government that provides fewer services(instead of paying higher taxes and having a state government that provides moreservices).
Knowledge. People are less supportive if they:
• Think that exhaust from motor vehicles in California is definitely or probably not animportant source of the pollution that causes asthma and makes asthma attacks worse.
• Think that motor vehicles are definitely or probably not the single largest source ofgreenhouse gas emissions in California.
Finally, the survey also found that respondents would be more likely to support the greenvehicle registration fee increase if the revenues were dedicated to transportation programs thatwould reduce smog and greenhouse gases. Sixty-four percent of respondents said they wouldbe more likely to support the fee if the revenues were so used.

Mineta Transportation Institute
Executive Summary 5
Policy Implications for Transportation Professionals and Policymakers
The survey results suggest that the concept of green transportation taxes and fees is apromising avenue of exploration. Support levels will of course vary depending on the specificdetails of the tax or fee proposed, but the survey results suggest several findings and keyavenues for transportation professionals and policymakers to pursue:
1. A majority of California residents may approve at least some versions of greentransportation vehicle registration fees or feebate programs to raise new transportationrevenues.
2. California should investigate whether converting existing flat-rate transportation taxesand fees to green versions would change behavior to help support the state’s efforts toreduce greenhouse gas emissions.
3.To begin building public support for the concept of a mileage fee, present it with a greenrate structure.
4.To increase support for green transportation taxes and fees, educate the public about howmotor vehicle use contributes to both air pollution and global warming.
5. Public support for green transportation taxes and fees will rise if the revenues arededicated for programs that promote a healthy environment.

6 Executive Summary
Mineta Transportation Institute
Mineta Transportation Institute
7
INTRODUCTION
This report explores public opinion on a new and promising concept—green transportationtaxes and fees. These are taxes and fees set at variable rates, with higher rates for morepolluting vehicles and lower rates for those that pollute less. This approach to transportationtaxes and fees adapts the traditional transportation finance system to achieve two criticalpublic benefits at once: encouraging drivers to choose more environmentally-friendlytransportation options at the same time as raising revenue for needed transportation programs.
Growing concern with global warming, air pollution, and energy security, combined withnational concern over shrinking transportation revenues, make this type of transportationfinance system a particularly exciting finance approach to evaluate at present. Thecombination of declining transportation revenues and growing needs opens a window forchange in the transportation finance system, as lawmakers explore different options to raiseadditional revenues for transportation purposes. While that window remains open, research isneeded to show whether or not green transportation taxes and fees are a politically feasibleoption.
To date, states have rarely used or even seriously evaluated the potential for greentransportation taxes and fees, but in the last few years, interest in the concept has appeared atthe margins of main-stream policy debates. To test public support for the concept, the authorsconducted a random telephone survey of 1,500 Californians, asking them about their supportfor three green transportation tax and fee options, as well as two fees that were not structuredas green ones. The survey results show that the public does indeed support the concept. Thetime is right for transportation policy makers to follow their constituents and explore howgreen transportation taxes and fees could best be integrated into the current finance system.
Green Transportation Taxes and Fees–Why Now?Like many states, for decades California has relied largely on state and federal fuel tax revenuesto fund its transportation system, supplemented with local and state sales tax and othergeneral fund revenues. This system no longer functions as well as it has in the past, becauselawmakers have been hesitant to raise fuel tax rates in recent decades to keep revenues in pacewith estimates of need. Although the gas tax will remain the main source of statetransportation revenues for the foreseeable future, lawmakers are interested in finding ways tosupplement those revenues. Three converging trends point to green transportation taxes andfees as a promising approach to revising the current system:
• A growing desire to encourage people to choose transportation behaviors and vehiclesthat will reduce air pollution and greenhouse gas emissions.
• A desire to identify new sources of transportation revenue that are politicallyacceptable, as well as technically desirable for other reasons.
8 Introduction
Mineta Transportation Institute
• Increasing interest and acceptance of using market-based policies, such as tolls, toencourage socially desirable transportation choices.
Reducing the Impact of the Transportation System on the Environment
Worries about air pollution and global warming—not to mention public concern over energysecurity and rising fuel prices—have created an unprecedented level of public interest infinding ways to improve fuel efficiency, develop non-petroleum-based fuels, and reduceemissions. Much of the attention has focused on new vehicle and fuel technologies. To a morelimited extent, there is also growing interest in reducing travel demand by providing residentswith alternatives to solo driving, whether that be reliable and convenient transit service, orsafe walking and biking facilities. If green transportation taxes and fees were adopted, theycould encourage drivers to choose more fuel-efficient and lower polluting vehicles. The financesystem could thus be one part of the solution to the air quality and global warming problems.
The state’s residents have long been at least somewhat aware of the connection between motorvehicle use and environmental quality because of a long history of poor air quality in mosturban areas. Although by some measures air quality has improved markedly over the pastdecades as vehicle technologies have improved, the even-increasing number of miles driven peryear in the state has to some extent counteracted technology-related improvements and keptair quality problems in public view. Further, recent research has revealed new and more serioushealth risks associated with air pollution, especially fine particulate emissions, making evenlow levels of pollution worrisome.
In the last decade, the accumulating scientific evidence about global warming trends and thelikely impacts on human health, the environment and economy have become matters ofwidespread public discussion and concern. The resulting publicity has educated Californiansabout this additional problem linked to motor vehicle use. Al Gore’s 2006 film An InconvenientTruth, as well as the 2007 Nobel Peace Prize subsequently granted to Gore and the UnitedNation’s Intergovernmental Panel on Climate Change, brought the global warming threatsquarely into public view. Also, in recent years state policy makers have passed a series ofwidely publicized measures to reduce greenhouse gas emissions, further focusing publicinterest on climate change and the role played by motor vehicle use.
The Need for New Sources of Transportation Revenue
Now is a critical time to assess whether or not the public would support green taxes and feesfor transportation, because states from California to New Hampshire are in the process ofrevisiting their transportation finance systems. States face a growing challenge to fund theirtransportation systems as the traditional source of revenue—state and federal gas taxes—hasdeclined substantially in real (inflation-adjusted) terms.
Transportation professionals and elected officials are intensely interested finding new revenuesto both maintain and expand their transportation systems, for numerous reasons. Much of thenational highway system is reaching an age where major—and expensive—rehabilitation is

Mineta Transportation Institute
Introduction 9
needed. At the same time, expected population growth and development in new areas willcreate demand for new transportation infrastructure and services, whether to accommodatemore traffic in existing communities, or to lay out infrastructure in newly developed areas.There is also increasing interest in providing efficient transit service, to offer residents a soundalternative to driving, but in most communities that would require considerable revenue tosupport both capital projects and operations. A final factor raising costs is that constructioncosts have risen more rapidly than general inflation in recent years, a trend that may wellcontinue. (The American Association of State Highway and Transportation Officials[AASHTO] predicts a 70% increase in construction costs between 1993 and 2015.3)
Despite these many reasons that policymakers may wish to increase transportation systemexpenditures, available revenues are not keeping pace. For decades, state and federal fuel taxesserved as the main source of the transportation finance system. However, the buying powerfrom fuel tax receipts is falling far short of local and state spending desires, and this trend willlikely continue into the future, for two key reasons. One factor likely to reduce availablerevenues is that the fuel tax is currently levied as a pennies-per-gallon charge, so inflationquickly begins to eat away at the buying power of the revenues unless the rate is regularlyraised. In almost all states and at the federal level, the rate can be raised only through directaction by legislators, and elected officials have shown little enthusiasm for raising fuel tax ratesin the last decade.4 A second factor that makes fuel taxes unlikely to keep pace with futureneeds is that consumers are expected to shift toward more fuel efficient vehicles or vehiclesrunning on fuels other than gasoline or diesel. Unless significant changes are made to thecurrent fuel tax system, these trends would reduce receipts relative to use of the road system.
The combination of rising expenditure desires and shrinking fuel tax revenues leavestransportation professionals in a quandary. One approach to the problem may be to makeexpenditures more efficient, yet there is also widespread desire to find additional revenues. Infact, among transportation professionals and the transportation industry itself, there isnear-unanimous consensus that additional revenues are required. However, in most cases statelegislatures have recently been unwilling to raise fuel tax rates. Consequently, state and localpolicy makers have explored alternative sources of revenue, including sales taxes, tolling, anddevelopment fees. There is also mild interest in replacing fuel taxes with mileage-based fees,though the general consensus among finance experts is that a mileage fee will not beimplemented in the short or even, probably, the medium term.5
Choosing the right alternative finance mechanisms to pursue is tricky. For example, policymakers look for options that raise sufficient revenues, are inexpensive and simple toadminister, and are equitable to different population sub-groups. In addition to these goals,political acceptability is critical. Not only must legislators themselves be willing to supportnew finance approaches, they must be convinced that the public will support them as well. Asanother outcome of legislative reluctance to raise fees and taxes that generate transportationrevenues, elected officials in California have put many potential revenue measures before thevoters as ballot propositions. Thus, if green transportation taxes and fees are to be seriously
10 Introduction
Mineta Transportation Institute
considered in the current political climate, knowing how the public perceives them is anessential component of assessing their feasibility. And if they prove popular with the public,then green transportation taxes and fees will be of great interest to transportation professionalsand policy makers.
Green Transportation Finance and the Current Trend Toward Market-Based Policies to Improve the Transportation System
A final trend in transportation finance that meshes well with the green transportation financeconcept is the modest but growing interest among policy makers in choosing financemechanisms that provide users incentives to make socially optimal travel choices. One optionis to use pricing to encourage drivers to shift trips to off-peak hours as a way to reduce trafficcongestion. This option is often referred to as “congestion pricing” or “value pricing.” Greentransportation taxes and fees use market-based pricing to encourage another socially desirableoutcome: travel choices that have a lower impact on the environment, particularly emissions ofair pollutants.
In countries outside the U.S., there has been some history of charging higher fees for morepolluting or fuel-inefficient vehicles. For example, the Canadian province of Quebec chargeshigher vehicle registration fees based upon the size of the engine, and Ontario has a “tax forfuel conservation” that applies to new vehicles. A 2007 review of vehicle taxation in Europeancountries identified eight countries that base their vehicle registration fee rate at least in parton some measure of environmental impact, whether fuel economy or emissions.6
In England, a few local jurisdictions have begun to charge higher fees for resident parkingpermits for high-emission vehicles. For example, in Richmond-upon-Thames, high-emissioncars pay as much as three times the permit price as low-emission vehicles.7 Finally, a few citieshave considered high-profile congestion fees that vary according to vehicle emissions. In 2007,London officials announced plans to charge vehicles with the highest CO2 emissions a fee of£25 a day (about $50 U.S.) to enter the city’s congestion charging zone, compared to an £8 feefor other vehicles. However, this plan was put on hold in 2008 with the election of a newmayor. In January 2008, the city of Milan, Italy introduced a trial congestion-pricing programwhereby vehicles pay a fee to enter the congested area, and the fee varies from €2 to €10,depending on the vehicle’s pollution rating. Vehicles with the very lowest emissions rates,such as electric powered cars and scooters, pay no fee at all.8
In the U.S., the use of market-based policies to reduce consumption and indirectly addressenvironmental externalities has some history, though much of it relates to products andservices outside the transportation sector. For example, fees that vary based upon themagnitude of people’s environmental impacts have been implemented to address municipalsolid waste generation (for example, pay-by-the-bag collection charges, advanced disposal fees,and so on) and water management (for example, meter rate pricing). The advantage of thesemarket-based policies is that environmental improvements can be achieved at a lower societalcost than with traditional command-and-control approaches. In addition, they are in line with
Mineta Transportation Institute
Introduction 11
the “polluter-pays” principle; if fees are set at the appropriate level, individuals pay for theenvironmental harm they make based on their choices.
There has been considerable research in the United States on market-based pricing to managetraffic congestion and parking shortages, but little research or policy activity has looked atcharging different rates for different vehicles or other transportation services specifically toaccount for varying levels of environmental externalities. Moreover, there are only a fewexamples of such taxes or fees being adopted in the U.S. The federal “gas guzzler” tax on newcars is one example, though it is paid by the manufacturer and only applies to new cars, nottrucks or SUVs. More popular than taxes or fees have been tax credits or other financial benefitsto purchasers of hybrid vehicles. The federal government has offered tax credits to purchasersof some new hybrid vehicles, and some states have also offered tax credits. A few cities havewaived parking fees in city-owned facilities for all-electric vehicles.9
Since 2007, the California legislature has shown a few stirrings of interest regarding greentransportation finance measures that extend past measures to promote electric-hybrid vehicles.Several different bills have been introduced, though so far none have been passed into law. InFebruary 2007, Assemblymember Ira Ruskin introduced AB 493, a bill to create a feebatesystem for new car purchases whereby the fees and rebates would be set according to thevehicle’s carbon emissions. This bill died a year later. In February 2008, AssemblymemberMike Feuer introduced a bill to allowed the Los Angeles County Transportation Authority toimpose a separate vehicle registration fee, with the rate linked to the vehicle’s carbonemissions. In the same month, Assemblymember Feuer introduced a separate bill, AB 2388,that would have imposed additional statewide vehicle registration fees, with the fees varyingby both the vehicle’s weight and carbon emissions.
Overview of the Research Methods
This study was designed to shed light on two broad research questions:
1. How likely are California residents to support green transportation taxes and fees,defined as taxes and fees that set lower rates for more environmentally-friendly vehicles andhigher rates for less environmentally-unfriendly ones?
2.What are the socio-demographic, attitudinal, and knowledge factors that influencesupport for such taxes and fees?
To explore these two questions, the authors conducted a random telephone survey of 1,500Californians that tested their support for the general concept of green transportation taxes andfees. Neither the study nor the survey was not designed to determine the optimal dollar chargeor implementation structure for any particular tax and fee option.
The survey questionnaire was designed after a review of public opinion polls on the topic oftransportation finance and also the research literature available on the topics of (1) publicopinion about transportation finance, and (2) the factors that tend to correlate withpro-environmental behavior. This literature review generated ideas about what types of fee

12 Introduction
Mineta Transportation Institute
mechanisms had not yet been well-tested, how to identify general political views and policypositions likely to predict support for green finance policies, and options for specific ways toword questions.
The core of the questionnaire asked respondents to indicate their level of support or oppositionto five different transportation taxes or fees that would raise funds for maintaining andimproving highways, mass transit, and local streets. Three of these were green options, whiletwo were more traditional flat-rate versions of the green taxes tested. By having both flat-rateand green versions of the two taxes, the survey could identify how support levels might varybetween the two options. The five options tested were:
• Feebate: Create a new tax and tax-rebate system on all new vehicles, based on howmuch they pollute. People buying a new vehicle that doesn’t pollute much wouldreceive a rebate of up to $1,000, while people purchasing a new vehicle that pollutes alot would pay a tax up to $2,000. People who buy an average-emission vehicle wouldnot pay additional fees or receive a rebate.
• Flat vehicle registration fee increase: Increase the state's vehicle registration feefrom its then-current rate of $31 per vehicle per year to $62 per year per vehicle.
• Green vehicle registration fee increase: Increase the vehicle registration fee to anaverage of $62 per vehicle per year, but vary the fee according to the amount of thevehicle’s emissions. Vehicles that pollute more would pay higher fees, and loweremissions vehicles would pay lower fees.
• Flat mileage fee: Eliminate the eighteen-cents-per-gallon state gas tax altogether andreplace it with a fee based on the number of miles driven. Each driver would pay a feeof one cent per mile for every mile driven within the state. For example, every onehundred miles driven would incur a fee of one dollar. Vehicles would be equipped withan electronic means to keep track of miles driven and the fee would be paid whendrivers buy gas.
• Green mileage fee: Create a variation on the mileage fee previously described, wherethe fee varies depending upon how much the vehicle pollutes. On average, vehicleswould pay one cent per mile, but vehicles that pollute the least would pay less andvehicles that pollute the most would pay more per mile.
This selection of measures therefore covered three different transactions: (1) When a personpurchases a new vehicle; (2) when owners register their vehicle annually; and (3) when driverspurchase fuel. The resulting survey data was analyzed to identify those particular subgroups ofthe population who were more or less likely to support green transportation tax and feeoptions.

Mineta Transportation Institute
Introduction 13
Overview of Report Contents
The next chapter in this report, “Findings from the Literature,” discusses the existing surveydata on public opinion about green transportation finance, as well as the broader literature onthe factors likely to predict pro-environmental behavior. The chapters titled “Survey Designand Administration,” and “Survey Results,” describe the survey design and administration,and then the survey results. The final chapter, “Conclusions and Recommendations,”discusseskey policy implications that can be taken from the survey results. The report’s appendixespresent the survey questionnaire and top-line results, as well as a detailed set of tables showingsupport for the five policies among different socio-demographic, attitudinal, knowledge, andother subgroups of the population.

14 Introduction
Mineta Transportation Institute

Mineta Transportation Institute
15
FINDINGS FROM THE LITERATURE
The research project began with an extensive review of public polling results and literaturerelated to the two project research questions. This chapter is structured around literaturerelating to each of those questions. For the first research question, “How likely are Californiansto support green transportation taxes and fees?” the authors examined the literature on publicsupport for transportation taxes and fees that were in some way described to respondents ashaving a connection with environmental protection. To better understand the second question,“What are the socio-demographic, attitudinal, and knowledge factors that influence supportfor such taxes and fees?” the authors looked much more broadly at research investigating thedemographic, attitudinal, and knowledge factors correlated with pro-environment behavior ingeneral, especially willingness to pay for “green” products and services.
To identify relevant research and public opinion polls the authors relied on several searchstrategies. The first was a review of databases and catalogues to identify published, academicliterature related to public opinions on transportation finance, as well as public reaction toother “green” policies such as recycling or renewable electricity generation. The bibliographiesof these items often proved fruitful sources of additional information. Finally, extensiveinternet research identified various public opinion polls related to transportation finance thathad not been formally published or had appeared in non-academic sources. Cumulatively,these various methods produced well over a hundred reports and studies.
This review was used to map out the existing state of knowledge about public opinions onthese topics, as well as to generate ideas for developing the questionnaire used in the publicopinion poll later conducted.
TRANSPORTATION FINANCE MEASURES LINKED TO ENVIRONMENTAL OUTCOMES: A REVIEW OF PUBLIC OPINION
There has been a fairly wide range of polling on transportation finance topics in the lastdecade, though relatively few polls have asked about finance options with some environmentalconnection. Most common are polls asking respondents how they would respond to specifictransportation tax and fee proposals. These polls are most often conducted by interest groupsand government agencies that are either creating, or in the process of supporting or opposing,finance measures that have been put before the voters as local or state referendums. Supportersof such referendums often conduct public opinion polls while crafting ballot proposals. Later,once a proposition is on the ballot, further polling is often conducted by supporters,opponents, and the media.
The volume of such polling has increased in the last decades because states and localgovernments have moved away from relying on traditional sources such as the state and federalgas tax, instead proposing alternative funding sources as voter referendums. In California,

16 Findings from the Literature
Mineta Transportation Institute
there have been dozens of county-wide transportation sales tax measures, and these havegenerated the most polling.
However, these election-targeted polls are not the only source of public opinion data ontransportation finance topics. From time to time the media includes transportation financequestions in public opinion polls on current issues, and interest groups like the AutomobileClubs of America or environmental advocacy groups sometimes include transportation financequestions when polling their members or the general public. Within California, the PublicPolicy Institute of California regularly surveys the public on policy issues, and these pollssometimes include at least a question or two related to transportation finance options. Finally,there are also a handful of polls on transportation finance that have been conducted byacademic research organizations or nonpartisan research groups. Although these surveys aresometimes undertaken on behalf of a government agency funding the work, the studies are notdirectly linked to an active political campaign.
Many of the surveys, especially those undertaken as part of crafting or promoting a specificballot proposal, ask only about a particular transportation tax, such as a sales tax or regionalgas tax supplement. However, a few of the surveys, especially those undertaken by researchersor policy research organizations, examine a variety of options.10
The type of analysis conducted on the survey results varies considerably, but many of theavailable surveys often report only basic response frequencies, without looking at support bymany population subgroups. The political polls may break out results by geographic region orpolitical party, but often not by many other categories. Some polls, however, especially thoseby research groups, are more likely to look at a wider range of socio-demographic and otherpopulation groups.11A few of the polls also look at how support levels correlate with attitudesor knowledge about various policy issues, but this analysis is relatively sparse. Finally, a few ofthe published studies build regression models to predict support based on a range ofvariables.12
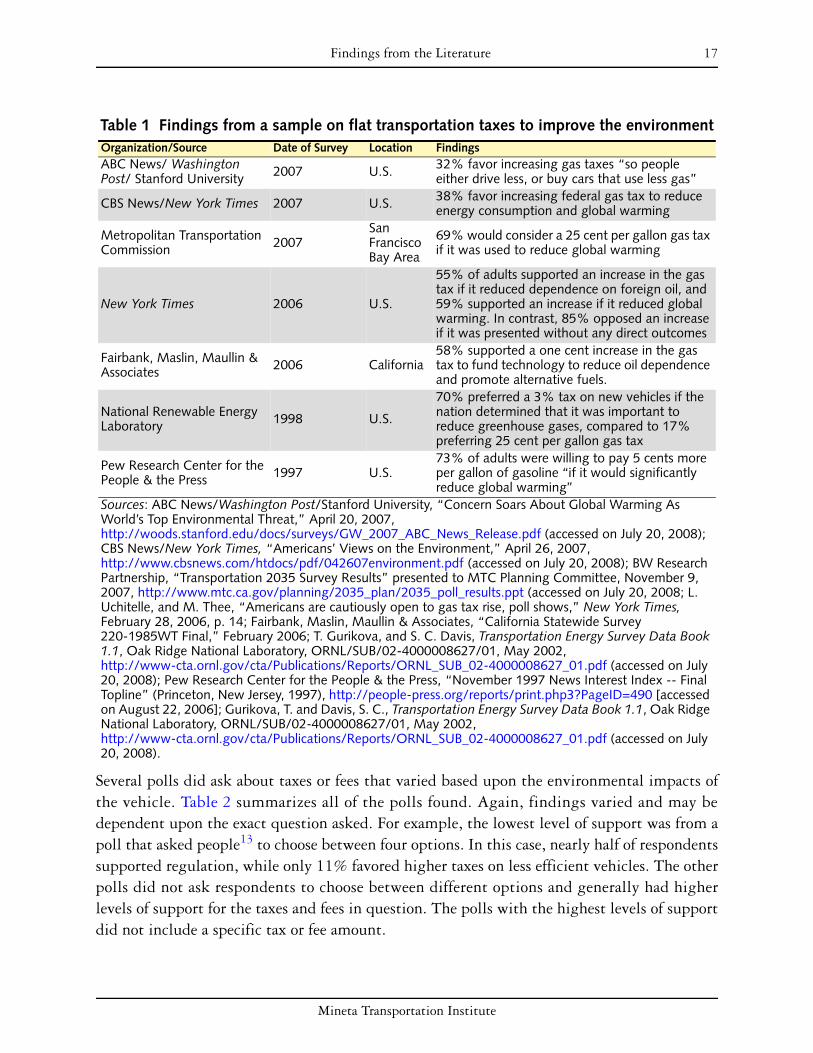
As mentioned above, relatively few of the public opinion polls testing public support fordifferent transportation measures mention to respondents how the finance options mightimpact environmental quality. However, there are some exceptions. Several polls broadly askedif respondents supported increasing a transportation-related tax in order to help address anenvironmental problem. A sample of these polls appears in Table 1. In these polls, the tax didnot vary based on the pollution level of the vehicle, in contrast to the “green” or environmentaltaxes addressed in this research. The findings from the polls vary significantly, as does thequestion wording and framing. Some polls found majority support for increasing gas orvehicle taxes to address global warming, though the most recent national poll the authorsfound, conducted in April 2007, found only 38% favored increasing the federal gas tax toaddress global warming.
Mineta Transportation Institute
Findings from the Literature 17
Several polls did ask about taxes or fees that varied based upon the environmental impacts ofthe vehicle. Table 2 summarizes all of the polls found. Again, findings varied and may bedependent upon the exact question asked. For example, the lowest level of support was from apoll that asked people13 to choose between four options. In this case, nearly half of respondentssupported regulation, while only 11% favored higher taxes on less efficient vehicles. The otherpolls did not ask respondents to choose between different options and generally had higherlevels of support for the taxes and fees in question. The polls with the highest levels of supportdid not include a specific tax or fee amount.
Table 1 Findings from a sample on flat transportation taxes to improve the environmentOrganization/Source Date of Survey Location FindingsABC News/ Washington Post/ Stanford University 2007 U.S. 32% favor increasing gas taxes “so people
either drive less, or buy cars that use less gas”
CBS News/New York Times 2007 U.S. 38% favor increasing federal gas tax to reduce energy consumption and global warming
Metropolitan Transportation Commission 2007
San Francisco Bay Area
69% would consider a 25 cent per gallon gas tax if it was used to reduce global warming
New York Times 2006 U.S.
55% of adults supported an increase in the gas tax if it reduced dependence on foreign oil, and 59% supported an increase if it reduced global warming. In contrast, 85% opposed an increase if it was presented without any direct outcomes
Fairbank, Maslin, Maullin & Associates 2006 California
58% supported a one cent increase in the gas tax to fund technology to reduce oil dependence and promote alternative fuels.
National Renewable Energy Laboratory 1998 U.S.
70% preferred a 3% tax on new vehicles if the nation determined that it was important to reduce greenhouse gases, compared to 17% preferring 25 cent per gallon gas tax
Pew Research Center for the People & the Press 1997 U.S.
73% of adults were willing to pay 5 cents more per gallon of gasoline ‘‘if it would significantly reduce global warming’’
Sources: ABC News/Washington Post/Stanford University, “Concern Soars About Global Warming As World’s Top Environmental Threat,” April 20, 2007, http://woods.stanford.edu/docs/surveys/GW_2007_ABC_News_Release.pdf (accessed on July 20, 2008); CBS News/New York Times, “Americans’ Views on the Environment,” April 26, 2007, http://www.cbsnews.com/htdocs/pdf/042607environment.pdf (accessed on July 20, 2008); BW Research Partnership, “Transportation 2035 Survey Results” presented to MTC Planning Committee, November 9, 2007, http://www.mtc.ca.gov/planning/2035_plan/2035_poll_results.ppt (accessed on July 20, 2008; L. Uchitelle, and M. Thee, “Americans are cautiously open to gas tax rise, poll shows,” New York Times, February 28, 2006, p. 14; Fairbank, Maslin, Maullin & Associates, “California Statewide Survey 220-1985WT Final,” February 2006; T. Gurikova, and S. C. Davis, Transportation Energy Survey Data Book 1.1, Oak Ridge National Laboratory, ORNL/SUB/02-4000008627/01, May 2002, http://www-cta.ornl.gov/cta/Publications/Reports/ORNL_SUB_02-4000008627_01.pdf (accessed on July 20, 2008); Pew Research Center for the People & the Press, “November 1997 News Interest Index -- Final Topline” (Princeton, New Jersey, 1997), http://people-press.org/reports/print.php3?PageID=490 [accessed on August 22, 2006]; Gurikova, T. and Davis, S. C., Transportation Energy Survey Data Book 1.1, Oak Ridge National Laboratory, ORNL/SUB/02-4000008627/01, May 2002, http://www-cta.ornl.gov/cta/Publications/Reports/ORNL_SUB_02-4000008627_01.pdf (accessed on July 20, 2008).

18 Findings from the Literature
Mineta Transportation Institute
Table 2 Findings from surveys on variable environmental taxes or fees for transportationOrganization/Source Date of Survey Location Findings
YouGov 2008 London, England
41% supported increasing the congestion charge to £25 for higher polluting cars.
Fairbank, Maslin, Maullin & Associates 2007 Los Angeles
County, CA
45% supported a fee of one cent per pound of CO2 emitted by a vehicle, averaging $22 per year instead of a one-half cent sales tax increase
Mineta Transportation Institute 2006 California 63% of likely voters supported the idea of annual vehicle
registration fees that are higher for more polluting vehicles
Fairbank, Maslin, Maullin & Associates 2006 California
62% supported charging a fee on new vehicles that emitted a large amount of global warming pollutants. 60% supported a “feebate” program (rebates for cleanest cars, fees for most polluting cars, ranging from $200 to $2500).
ABC News/Time Magazine/Washington Post
2005 United States
54% supported allowing single drivers in hybrid cars to use HOV lanes for free to encourage use of hybrids, compared to 36% supporting single drivers paying a toll to use the HOV lanes
Kockelman, Podgorski, et al. 2003 Texas
73% of Texas residents thought that charging higher tolls for larger, heavier, or higher polluting vehicles was a good idea
Washington State Department of Transportation
2004 Washington 42% of voters expressed support for a tax based on a car’s weight
Public Policy Institute of California (PPIC) 2003 California 81% favor tax breaks to encourage the purchase of hybrid
and electric vehicles
National Renewable Energy Laboratory 2001 United States
11% supported higher taxes on less efficient vehicles to reduce dependence on imported oil, given four choices. Greatest level of support (48%) for regulation to make vehicles more efficient. 6% supported higher fuel taxes.
Southern California Association of Governments (cited in Krupnick, et al.)
1996Southern California (five counties)
39% supported a mileage fee ranging from 1-5 cents per mile depending upon the vehicle emissions. Support increased to almost 50% when respondents were told that most revenues would be returned to taxpayers through reduced fees or coupons.
J. Moore Methods (cited in Krupnick, et al.) 1994
Southern California (four counties)
51% supported a fee based upon vehicle’s pollution level, with revenues used to help improve air quality

Mineta Transportation Institute
Findings from the Literature 19
FACTORS CORRELATED WITH PRO-ENVIRONMENT BEHAVIOR
Studies from the applied behavior and environmental psychology literatures that focus onpro-environmental behavior (PEB) were influential for our research. Several theories have beenproposed to explain the relationship between individual attitudes and values and PEB,including Ajzen’s Theory of Planned Behavior, Schwartz’s Norm-Activation Model, andDunlap and Van Liere’s New Environmental/Ecological Paradigm.14 These theories all stressthat individual environmental attitudes can help predict PEB to some extent.
Very few of the polls listed in Table 1 and Table 2 provided analyses that explain support forenvironmental taxes or fees in terms of respondent characteristics. In the handful of exceptions,more emphasis was placed on demographics than the environmental attitudes or valuesemphasized in the theories explaining PEB. The exceptions include Krupnick et al.’s study ofa mileage fee in Southern California that varied with emissions,15 Dill and Weinstein’s analysisof a variable registration fee in California,16 and the poll of Londoners regarding the highercongestion pricing for more polluting vehicles.17 The first two studies used multivariateanalysis to examine the relationships. All three studies found that support for greentransportation fees declined with the respondent’s age. The studies were not consistent withrespect to findings on gender, however, with one finding more support among women, onemore support among men, and one finding no difference. As for ethnicity, findings fromKrupnick, et al. and Dill and Weinstein suggest that Asians and Hispanics may beparticularly supportive of green transportation fees. Contrary to their hypothesis, Krupnick et
Sources: YouGov, “YouGov/Evening Standard Survey Results, Fieldwork: 20th – 25th March 2008,” http://i.thisislondon.co.uk/i/pix/2008/03/mayorsurvey.pdf (accessed on July 20, 2008); Fairbank, Maslin, Maullin & Associates, “Los Angeles County Transportation Ballot Measure Survey 2007”; Asha Weinstein, Jennifer Dill, Todd Goldman, John Hall, Franziska Holtzman, Joe Recker, and Eileen Goodwin, Transportation Financing Opportunities for the State of California (San Jose, CA: Mineta Transportation Institute, College of Business, San Jose State University, October 2006), http://transweb.sjsu.edu/mtiportal/research/publications/documents/06-01/TransportFinanceOpps5_020107.pdf (accessed on July 5, 2008); Fairbank, Maslin, Maullin & Associates, “California Statewide Survey 220-1985WT Final,” February 2006; ABC News/Time Magazine/Washington Post, “A Look Under the Hood of a Nation on Wheels: ABC News/Time Magazine/Washington Post Poll” (2005), http://abcnews.go.com/images/Politics/973a2Traffic.pdf (accessed on August 22, 2006); K.M. Kockelman, K.V. Podgorski, M. Bina, and S. Gadda, “Public Perceptions of Pricing Existing Roads and Other Transportation Policies: The Texas Perspective,” paper presented at the 85th Annual Meeting of the Transportation Research Board, Washington DC, January 2006; Washington State Department of Transportation, “2004 Focus Group Results” (2004), http://www.wsdot.wa.gov/Accountability/PublicOpinion (accessed on August 22, 2006); Mark Baldassare, “PPIC Statewide Survey: Special Survey on Californians and the Environment” (San Francisco: Public Policy Institute of California, July 2003), http://www.ppic.org/content/pubs/survey/S_703MBS.pdf (accessed on July 20, 2008); T. Gurikova, and S.C. Davis, Transportation Energy Survey Data Book 1.1, ORNL/SUB/02-4000008627/01, (Oak Ridge National Laboratory, May 2002), http://www-cta.ornl.gov/cta/Publications/Reports/ORNL_SUB_02-4000008627_01.pdf (accessed on July 20, 2008); Alan Krupnick, Winston Harrington, and Anna Alberini, “Public Support for Pollution Fee Policies for Motor Vehicles with Revenue Recycling: Survey Results,” Regional Science and Urban Economics 31, no. 4 (2001), 505-22; J. Moore Methods, Inc. Southern California Congestion Pricing Study, various survey versions, 1994, as cited in Krupnick, Harrington, and Alberini, ibid.

20 Findings from the Literature
Mineta Transportation Institute
al found higher support among people with less education. Dill and Weinstein found thatlower-income adults were more likely than other income groups to oppose a flat-rateregistration fee increase but support a green version of the fee increase.
None of these studies examined how knowledge of environmental issues influenced opinions.However, all three did look at political affiliation and/or attitudes in some manner. Notsurprising, all three studies found lower levels of support among conservatives or Republicans.Krupnick et al. found that support was positively correlated with how much air pollutionaffected the respondent and whether respondents felt drivers (in general) would change theirbehavior in response to the fee.18 Dill and Weinstein found that people who were transit usersand people who wanted to focus transportation spending on transit were particularlysupportive of the green fee option, even after controlling for income. The findings from thesetwo studies may indirectly reflect environmental values that were not specifically asked aboutin the survey. In addition, Dill and Weinstein found that people who thought taxes were toohigh opposed raising registration fees, but that their level of opposition diminished with thegreen option compared to a flat fee increase.19
Given the lack of literature examining factors related to PEB and support for greentransportation taxes and fees, it is useful to look to other transportation and consumerbehaviors. For decades, travel behavior research has examined the role of demographics,particularly income, on mode choice, including those modes which could be labeled PEB (forexample, transit, bicycling, and walking). More recently, several travel behavior studies havefound that attitudes are significantly correlated with the amount of driving or walking.20
Kitamura et al. found that people with pro-environment attitudes made a significantly smallershare of their trips by car.21 In a study of Australian college students, individual values andbeliefs about the environmental impact of motor vehicles were strong predictors of a travelmode shift to public transit.22 Similarly, Coogan, Karash, Adler, and Sallis found a significantrelationship between personal values and walking as a primary transportation mode choice.23
Very few studies look at both knowledge and attitudes. One that does is a survey ofSacramento, CA, area residents by Flamm, who examined the relationship between bothenvironmental knowledge and attitudes and travel and vehicle decisions.24 His key findingswere as follows:
1) environmental knowledge is directly related to household ownershipof more fuel efficient vehicles and inversely related to estimated annualhousehold fuel consumption, 2) environmental attitudes are directlyrelated to household ownership of more fuel efficient vehicles andinversely related to number of household vehicles, estimated annualhousehold miles driven, and estimated annual household fuelconsumption, 3) vehicle ownership and use affect environmentalattitudes to a small degree (though much less than attitudes affectvehicle ownership and use), but do not affect environmental knowledgeat all, 4) environmental knowledge and environmental attitudes are
Mineta Transportation Institute
Findings from the Literature 21
strongly related, and 5) people perceive barriers to making their vehicleownership and use more closely reflect their attitudes and knowledgeand can identify ways in which car manufacturers and elected officialsmight facilitate more environmentally responsible vehicle ownershipand use decisions.25
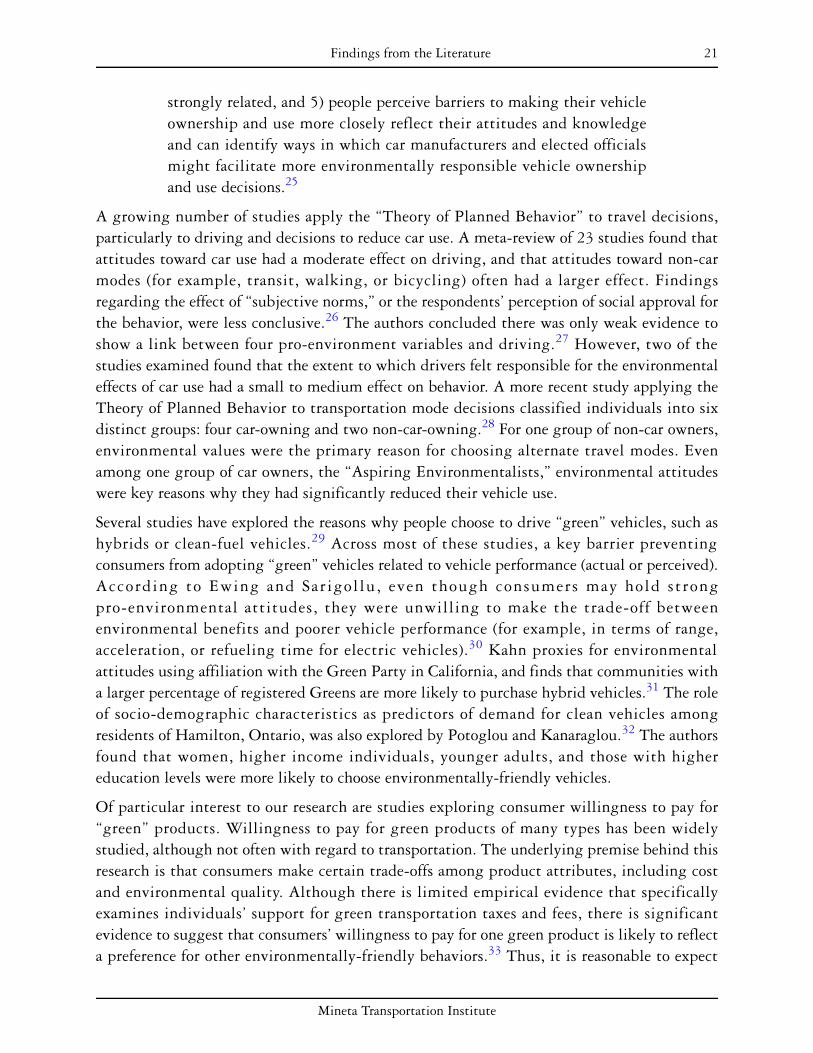
A growing number of studies apply the “Theory of Planned Behavior” to travel decisions,particularly to driving and decisions to reduce car use. A meta-review of 23 studies found thatattitudes toward car use had a moderate effect on driving, and that attitudes toward non-carmodes (for example, transit, walking, or bicycling) often had a larger effect. Findingsregarding the effect of “subjective norms,” or the respondents’ perception of social approval forthe behavior, were less conclusive.26 The authors concluded there was only weak evidence toshow a link between four pro-environment variables and driving.27 However, two of thestudies examined found that the extent to which drivers felt responsible for the environmentaleffects of car use had a small to medium effect on behavior. A more recent study applying theTheory of Planned Behavior to transportation mode decisions classified individuals into sixdistinct groups: four car-owning and two non-car-owning.28 For one group of non-car owners,environmental values were the primary reason for choosing alternate travel modes. Evenamong one group of car owners, the “Aspiring Environmentalists,” environmental attitudeswere key reasons why they had significantly reduced their vehicle use.
Several studies have explored the reasons why people choose to drive “green” vehicles, such ashybrids or clean-fuel vehicles.29 Across most of these studies, a key barrier preventingconsumers from adopting “green” vehicles related to vehicle performance (actual or perceived).According to Ewing and Sarigol lu, even though consumers may hold strongpro-environmental attitudes, they were unwilling to make the trade-off betweenenvironmental benefits and poorer vehicle performance (for example, in terms of range,acceleration, or refueling time for electric vehicles).30 Kahn proxies for environmentalattitudes using affiliation with the Green Party in California, and finds that communities witha larger percentage of registered Greens are more likely to purchase hybrid vehicles.31 The roleof socio-demographic characteristics as predictors of demand for clean vehicles amongresidents of Hamilton, Ontario, was also explored by Potoglou and Kanaraglou.32 The authorsfound that women, higher income individuals, younger adults, and those with highereducation levels were more likely to choose environmentally-friendly vehicles.
Of particular interest to our research are studies exploring consumer willingness to pay for“green” products. Willingness to pay for green products of many types has been widelystudied, although not often with regard to transportation. The underlying premise behind thisresearch is that consumers make certain trade-offs among product attributes, including costand environmental quality. Although there is limited empirical evidence that specificallyexamines individuals’ support for green transportation taxes and fees, there is significantevidence to suggest that consumers’ willingness to pay for one green product is likely to reflecta preference for other environmentally-friendly behaviors.33 Thus, it is reasonable to expect
22 Findings from the Literature
Mineta Transportation Institute
that the factors influencing willingness to pay for environmentally-friendly products such asgreen electricity or organic foods would be similar to the factors linked with support for greentransportation taxes. Laroche, Bergeron, and Barbaro-Forleo conducted an extensive literaturereview and identified five major factors that influence willingness to pay for green products:socio-demographic characteristics, environmental knowledge, environmental attitudes,individual values, and environmental behaviors. 34
Numerous studies have attempted to develop a typical green consumer profile, yet often theseprofiles conflict.35 In general, significant demographic predictors include age, education,income, and gender. For example, several studies find that older adults are less likely tosupport higher prices for green products.36 Some studies also find that education levels arepositively correlated with willingness to pay for green products. This relationship is notedacross a diverse range of products including green electricity programs,37 organic and locallyproduced food,38 environmentally friendly cars,39 and certified forest products.40 Similarly,income also tends to be positively correlated with willingness to pay.41 Finally, gender is oftenfound to influence willingness to pay, with women more likely to pay higher prices than men,particularly where there is a strong perception of the connection between the “green” productand health, such as with organic food.42
Although the majority of studies focus on demographic characteristics, these are often not themost important predictors of willingness to pay. Factors such as environmental attitudes,individual values, and knowledge about environmental issues are frequently more importantpredictors.43 For example, one study found that participation in green electricity programs inJapan was strongly influenced by environmental knowledge and, although financialconsiderations are the driving factors, knowledge was found to be a factor for willingness topay for a (green) fuel cell taxi in London.44 Interestingly, altruistic reasons were shown tooutweigh financial considerations in a study of corporate participation in green energyprograms.45 Similarly, research has found that consumer preferences for organic food arestrongly influenced by attitudes toward the environment and personal values.46
It may be that few studies include attitudes and knowledge because gathering such data ismore complex and adds to survey costs. However, it is likely that many of the correlationsfound between demographics and behavior are actually detecting a correlation betweendemographics and attitudes, which then influence behavior. Sorting out the relative influenceof knowledge, attitudes, and demographics in determining behavior or support for greentransportation finance options has important policy implications. For example, if knowledgeand attitudes are the most important factors, then there may be a role for public educationcampaigns as part of a strategy to build public support for green transportation taxes and fees.
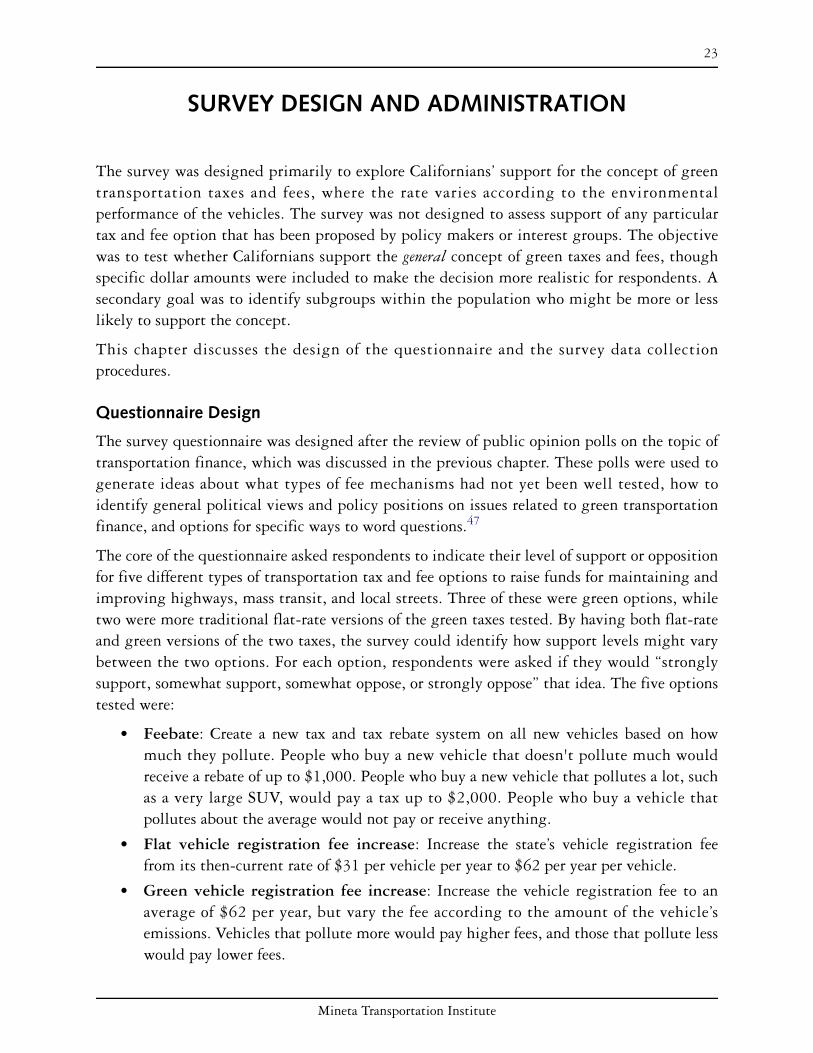
Mineta Transportation Institute
23
SURVEY DESIGN AND ADMINISTRATION
The survey was designed primarily to explore Californians’ support for the concept of greentransportation taxes and fees, where the rate varies according to the environmentalperformance of the vehicles. The survey was not designed to assess support of any particulartax and fee option that has been proposed by policy makers or interest groups. The objectivewas to test whether Californians support the general concept of green taxes and fees, thoughspecific dollar amounts were included to make the decision more realistic for respondents. Asecondary goal was to identify subgroups within the population who might be more or lesslikely to support the concept.
This chapter discusses the design of the questionnaire and the survey data collectionprocedures.
Questionnaire Design
The survey questionnaire was designed after the review of public opinion polls on the topic oftransportation finance, which was discussed in the previous chapter. These polls were used togenerate ideas about what types of fee mechanisms had not yet been well tested, how toidentify general political views and policy positions on issues related to green transportationfinance, and options for specific ways to word questions.47
The core of the questionnaire asked respondents to indicate their level of support or oppositionfor five different types of transportation tax and fee options to raise funds for maintaining andimproving highways, mass transit, and local streets. Three of these were green options, whiletwo were more traditional flat-rate versions of the green taxes tested. By having both flat-rateand green versions of the two taxes, the survey could identify how support levels might varybetween the two options. For each option, respondents were asked if they would “stronglysupport, somewhat support, somewhat oppose, or strongly oppose” that idea. The five optionstested were:
• Feebate: Create a new tax and tax rebate system on all new vehicles based on howmuch they pollute. People who buy a new vehicle that doesn't pollute much wouldreceive a rebate of up to $1,000. People who buy a new vehicle that pollutes a lot, suchas a very large SUV, would pay a tax up to $2,000. People who buy a vehicle thatpollutes about the average would not pay or receive anything.
• Flat vehicle registration fee increase: Increase the state’s vehicle registration feefrom its then-current rate of $31 per vehicle per year to $62 per year per vehicle.
• Green vehicle registration fee increase: Increase the vehicle registration fee to anaverage of $62 per year, but vary the fee according to the amount of the vehicle’semissions. Vehicles that pollute more would pay higher fees, and those that pollute lesswould pay lower fees.
24 Survey Design and Administration
Mineta Transportation Institute
• Flat mileage fee: Eliminate the eighteen-cents-per-gallon state gas tax altogether andreplace it with a fee based on the number of miles driven. Each driver would pay a feeof one cent per mile for every mile driven within the state. For example, every onehundred miles driven would pay a fee of one dollar. Vehicles would be equipped withan electronic means to keep track of miles driven and the fee would be paid whendrivers buy gas.
• Green mileage fee: Create a variation on the mileage fee previously described, wherethe fee varies depending upon how much the vehicle pollutes. On average, vehicleswould pay one cent per mile, but vehicles that pollute the least would pay less andvehicles that pollute the most would pay more per mile.
One additional question in this section of the survey probed whether or not respondents wouldbe more likely to support a green transportation fee if they knew the revenues would bededicated to programs promoting environmentally friendly transportation. Specifically, thesurvey asked if they would be more or less likely to support the vehicle registration fee increaseif the additional money raised “were dedicated for transportation projects that would helpreduce smog and greenhouse gases—projects like converting transit and school buses tocleaner fuels, or building new biking and walking paths.”
A second goal of the project was to identify the population subgroups particularly likely toeither support or oppose green transportation taxes and fees. From the phone numbers, theauthors were able to link the respondents to their region within the state. In addition, thequestionnaire asked respondents question about:
• Socio-demographic characteristics, such as age, gender, employment status,household income, and voter registration status.
• Basic travel behavior patterns, including how many miles per year they drive, andwhether they had walked, biked, or taken transit in the past week.
• Opinions about the importance of key policy issues in California related to thetransportation system and environmental issues.
• Knowledge about transportation finance and the interaction between vehicle use andthe environment.
The full text of the questionnaire is available in Appendix A.
Survey Implementation
A total of 1,500 California adults were interviewed by phone from January 20 to February 1,2008.48 Interviews were conducted in English and Spanish, and they lasted an average of 13minutes.
The telephone numbers used were a computer-generated random sample, assuring that bothlisted and unlisted phones were included. However, cell phone numbers were not purposelyincluded. This could result in the underrepresentation of younger adults in the sample, as theyare more likely not to have a land-line phone. Each number was called back up to six times to

Mineta Transportation Institute
Survey Design and Administration 25
increase the likelihood of completing interviews with eligible households. To counter thetendency of women and older people to answer the household telephone, a systematicscreening method was used at the household level; surveyors asked to speak to the youngestmale available, and then, if no male were available, to the youngest female in the householdwho was at least eighteen years old.
The overall margin of error for the survey is ± 2.5% at the 95% confidence level. Results wereweighted slightly to correspond to 2000 U.S. Census data for gender and region within thestate.

26 Survey Design and Administration
Mineta Transportation Institute
Mineta Transportation Institute
27
SURVEY RESULTS
SURVEY RESPONDENTS
To assess how well the survey respondents represent the California population, the authorscompared the sample’s demographic characteristics to those for the state’s population, usingdata from the 2006 American Community Survey (ACS) and the U.S. Census populationestimates for California counties (see Table 3).49 In general, this study’s sample population isquite similar to the overall California population, although there are some minor differences.Therefore the authors are confident that the survey results provide useful insight into theattitudes and opinions of Californians.
Women represented 55% of the survey’s respondents, compared to 50% of California adults.In addition, a higher percentage of the survey respondents were older adults than in the fullpopulation; 43% of respondents were over 55 years old, compared to just 27% from the 2006ACS. Only 38% of the survey sample were between the ages of 25 to 54 years old, compared to59% in the overall population. These results are not unexpected, as older adults may havemore time to participate in a phone survey than do working-age adults, and they are also lesslikely than younger adults to own a cell phone but no land line. Respondents were also morelikely to own their home (71% compared to 60% from the 2006 ACS) and have more formaleducation. Seventy-nine percent of the survey respondents had more than a high school degree,compared to only 57% of California adults aged 25 or older. Other demographic categories,including employment and income, as well as the geographic location of the respondents,showed very little difference between the study’s sample and the state’s population.
Table 4 presents a summary of information about the survey respondents’ travel behavior andalso some information they reported about the vehicle they drive the most often. Like mostCalifornians, the respondents relied on their cars for much of their travel. For example, 76%drive alone to work, and 41% drive over 7,500 miles a year. Respondents were asked todescribe the vehicle that they drive most often, and the majority described their vehicle as apassenger car (62%). Sixty-one percent drive vehicles that are from the 2000 model year ornewer, and 43% drive vehicles with a reported fuel efficiency of 23 miles per gallon or better.As for use of alternative modes of travel, 14% of respondents said they commute to workeither by transit, carpooling, biking, or walking, 34% said they had walked or biked fromhome in the past 7 days for some utilitarian purpose, and only 13% had taken transit in thepast 7 days.

28 Survey Results
Mineta Transportation Institute
Table 3 Socio-demographic characteristics of survey respondents and of all Californians
Socio-Demographic CategoryPercent of Survey Respondentsa
a. Percentages may not total to 100% due to rounding.
Percent of Californians (U.S. Census Data)
North/South b
b. Survey data for geographic location and gender are unweighted. Subsequent data analyses weightthese categories to correspond to the state’s population.
North 43 39South 57 61
Regionb
Bay Area 22 19Los Angeles 27 27Other Southern Calif. 24 28Central Valley 18 17Central Coast 5 6Rural CA 4 2
Genderb
Male 45 50Female 55 50
Age18-24 years 19 1425-54 years 38 5955+ years 43 27
Own/rent residenceOwn 71 60 c
c. ACS data is for the entire population, not restricted to adults only.
Rent 29 39Education level
High school or less 21 43 d
d. ACS data is based on adults 25 years and older.
More than high school 79 57 d
EmployedYes–full time 50 60 e
e. ACS data does not delineate between full and part-time employment, and data is for persons aged 16years and older.
Yes–part time 12No 38 40
Household incomeLess than $50,000 38 44$50,000–$100,000 34 31
Likely Voter?Yes 73 n.a.No 27 n.a.
Political affiliationDemocrat 47 n.a.Republican 33 n.a.Other 17 n.a.Don’t know 3 n.a.
Sources: U.S. Bureau of the Census, “Selected Social Characteristics in California: 2006,” results from the 2006 American Community Survey, http://factfinder.census.gov (accessed March 3, 2009); U.S. Bureau of the Census, Annual Estimates for the Population for Counties of California: April 1, 2000-July 1, 2007 (CO-EST2007-01-06), http://census.gov/popest/counties/tables/CO-EST2007-01-06.xls (accessed March 3, 2009).

Mineta Transportation Institute
Survey Results 29
Table 4 Travel behavior information and data about the vehicle respondents drive most often
Travel Behavior and Vehicle QuestionsPercent of Respondents
“How do you usually commute to work?” a(Question D8)
a. Asked only of respondents who worked.
Drive yourself 76Transit, carpool, bike, walk 14NA–work at home 10
“In the past seven days, have you taken any form of public transit, like a bus, light rail, subway, or commuter train?” (Question 9)
Yes 13No 87Don’t know <1
“In the past seven days, have you walked or biked from your home to get to work, shopping, eating out, or other errands?” (Question 10)
Yes 34No 66Don’t know <1
“About how many miles did you, personally, drive during the past 12 months in all motorized vehicles? Please exclude miles you drove as part of a job.” (Question 11)
1–3,000 263,001–7,500 217,501–12,500 2212,501+ 19NA–don’t drive 6Don’t know 7
“What is the model year of this vehicle?” (Question 13)2004–2008 322000–2003 291951–1999 36Don’t drive 2Don’t know 2
“What type of vehicle is it? Is this vehicle a . . .” (Question 14)Passenger car 62Van or minivan 8Sport utility vehicle 16Pickup truck/truck 13Other 1
“What is the approximate fuel efficiency of this vehicle? In other words, how many miles per gallon does the vehicle get?” (Question 16)
28–75 MPG 2323–27 MPG 2018–22 MPG 2813–17 MPG 12<13 MPG 4Don’t know 14
Note: The percentages within each category may not sum to 100%, due to rounding.

30 Survey Results
Mineta Transportation Institute
SUPPORT FOR THE GREEN TRANSPORTATION TAXES AND FEES
Table 5 presents statewide support levels for the five transportation tax and fee options testedin the survey. The green options proved popular, with majorities of the respondentssupporting all three green taxes and fees tested. For example, 66% percent of respondentssupported the feebate proposal, and only 30 percent opposed it.
The green taxes were also much more popular than the flat-rate taxes. In the two casesrespondents were asked their support for both a flat-rate and green version of the same tax,respondents were twenty or more percentage points likely to prefer the green versions. Forexample, the survey found that almost two-thirds of respondents (63%) supported a greenversion of raising the vehicle registration fee, but when respondents were asked if they wouldsupport increasing the vehicle registration fee from $31 to a flat rate of $62 for everyone, only41% supported the increase. Comparing the two results shows that converting the fee increasefrom a flat-rate one to a green version boosts support by 22 percentage points, or fromless-than-majority support to almost two-thirds support.
Californians once again showed their preference for green transportation tax options whenasked about two versions of a hypothetical mileage fee that would replace the state gas tax of18 cents. Respondents were told that the gas tax would be replaced with a fee of one cent forevery mile driven within the state. Vehicles would be equipped with an electronic means totrack the miles driven, and the mileage fee would be paid when the driver bought gas. Only28% of respondents favored this system when the fee was a flat rate for everyone, but supportjumped to 50% when respondents were asked if they would support a green version of themileage fee. In this green fee system, the fee rate would vary according to how much thevehicle pollutes, with less-polluting vehicles paying less per mile and more-polluting vehiclespaying more per mile. The lower levels of support for both of these options may be due, inpart, to respondents’ concerns over privacy, stemming from the need to “track” vehicle milesdriven.
An additional question in the survey asked respondents if they would be more or less likely tosupport the green vehicle registration fee increase if the revenues were dedicated totransportation programs that would reduce smog and greenhouse gases. Sixty-four percent ofrespondents said they would be more likely to support the fee, 20% said they would be lesslikely, and 10% said it would make no difference to them.

Mineta Transportation Institute
Survey Results 31
Support By Socio-Demographics, Travel Behavior, and Vehicle Choices
A main goal of the research project was to identify subgroups within the state population whoare particularly likely to support or oppose green transportation taxes and fees. This sectionpresents a series of tables showing the percent of people who said they supported each greentax or fee measure, or who said they didn’t know, broken down by different groups within thepopulation. “Support” was defined as those who said they strongly or somewhat supported themeasure. The report includes tables showing support for the three green transportation tax andfee policies based on respondents’ socio-demographic characteristics (Table 6), travel behavior(Table 7), vehicle ownership (Table 8), opinions on air pollution, traffic congestion, andtransportation system quality (Table 10), opinions on the adequacy of transportation revenuesand principles of structuring vehicle registration fees (Table 12), knowledge of transportationand environmental issues (Table 14), and opinions on environmental policy topics (Table 16).
Each table breaks the survey respondents into sub-groups (as an example, household incomecategories) and shows the percentage of respondents in each sub-group who support each of thethree green policies, as well as the percentage indicating they did not know if they supportedor opposed the policy. The authors used a statistical test, the “test of two proportions”explained below, to determine whether there was a statistically significant difference insupport between some of the sub-groups. In all cases, the authors assigned the first sub-grouplisted in its section of the table (for example, households earning less than $50,000 annually)as the “base” case. This base case was then compared the proportion of respondents in thissub-group who supported the green policies to the rest of the sub-groups within that category.Values identified with an * or ** indicate that the difference in support between the “base”case and that sub-group is significant at the α≤0.05 and α≤0.01 levels of significance,respectively. For some cases, the number of respondents in a sub-group who supported thepolicies was too small to run the significance test; these cases are presented with grey text.
The statistical test used in these analyses, the test of two proportions, assesses whether thedifferences among sub-groups are statistically significant. This statistical test compares twoproportions (or percentages) from two different samples to determine whether the difference
Table 5 Statewide support levels for the five transportation tax and fee options
Tax or FeeSupport Oppose Don’t
Know nStrongly Somewhat Overalla
a. Sum of those who said they “strongly” or “somewhat” supported the proposal.
Strongly Somewhat Overalla
Vehicle registration fee increase Flat 18 23 41 39 16 55 5 1494 Green 37 27 63 24 9 33 4 1493Mileage fee (to replace state gas tax) Flat 12 16 28 52 12 65 7 1496 Green 25 25 50 35 11 46 5 1491Feebate system 38 27 65 20 10 30 4 1489Note: Some percentages do not sum to 100% due to rounding.

32 Survey Results
Mineta Transportation Institute
between the proportions is statistically significant or not. For example, this test allowed theauthors to assess whether the percentage of respondents from Northern California who supportthe green vehicle registration fee is statistically different from the percentage of SouthernCalifornia respondents who support the same policy. The test statistic, in the form of a z-score,is calculated as follows:
where π1 and π2 are the proportions for each sample, p is the average proportion for the twosamples weighted by sample size, and n1 and n2 represent the individual sample sizes. The nullhypothesis is that there is no statistically significant difference between the two proportions,and the authors used a two-tailed test with both an α<0.01 level and an α<0.05 level ofsignificance to assess whether the results are statistically significant or not.
The first of this series of tables, Table 6, looks at support levels broken down by region withinthe state and basic socio-demographic categories of gender, age, homeowner status, education,employment status, household income, political party affiliation, as well as whether or not therespondent is a likely voter. Likely voters were identified as those respondents who arecurrently registered to vote, who know which political party they are registered in, andindicate that they vote occasionally or more often.
One noteworthy finding is that in only a handful of cases did any group have less thanmajority support for any of the three green tax and fee proposals. Also, there were surprisinglyfew statistically significant differences among the groups, comparing the responses withineach category (for example, income) to the “base” case used for the test, as described above. Forexample, there was no significant difference in support for any of the three taxes or fees basedon whether respondents were likely voters or not, household income, employment status,homeowner status, or whether respondents lived in the north or south of California.
However, a few differences did show up. For example, Republicans were from 15 to 19percentage points less likely to support the three green transportation tax and fee policies thanwere Democrats. This result was expected, as prior research suggests that political ideology isan important indicator of environmental concern. Conservatives are, in general, less likely toexpress concern for the environment or to engage in pro-environmental behavior.50
z =π1−π 2
p 1− p( ) 1n1
+1n2
⎛
⎝ ⎜
⎞
⎠ ⎟

Mineta Transportation Institute
Survey Results 33
Table 6 Support for the green fee policies, by socio-demographic categories and region
Demographic Category
Green Vehicle Registration Fee Green Mileage Fee Feebate
Support (%)
Don’t Know (%)
Support (%)
Don’t Know (%)
Support (%)
Don’t Know (%)
All respondents 63 4 50 5 66 4North/South North 67 4 50 4 69 4 South 61 4 50 5 64 5Region Bay Area 70 4 53 4 72 2 Los Angeles 65 4 51 5 66* 6 Other Southern Calif. 59* 4 50 4 62 4 Central Valley 60* 6 47 6 65 7 Central Coast 61 6 46 1 62 5 Rural CA 64 3 45 3 62 3Gender Male 60 3 45 4 64 3 Female 66 5 55** 5 67 5Age 18–24 years 70 3 57 3 66 4 25–54 years 66 4 49 4 68 3 55+ years 61* 4 50 4 65 6Own/rent residence Own 62 4 49 4 66 3 Rent 68 5 53 6 64 7Education level
High school or less 60 6 52 6 55 9More than high school 65 4 50 4 69** 3
Employed Yes–full time 65 3 49 3 68 2 Yes–part time 66 4 50 7 67 3 No 61 6 52 6 64 7Household income Less than $50,000 64 6 54 5 65 7 $50,000– $100,000 64 2 52 3 70 2 Over $100,000 66 2 46 3 68 3Likely voter? Yes 65 3 50 4 67 4 No 59 7 51 6 61 7Political affiliation Democrat 73 4 57 4 75 4 Republican 54* 3 42** 4 58** 3 Other 64* 2 44* 3 61** 4 Don’t know 46 19 36 19 68 11* p ≤ 0.05** p ≤ 0.01Notes: The test of two proportions was used to check if there was a statistically significant difference between “support” levels among sub-groups. (No test was run on the “don’t know” proportions). The first sub-group listed in each category is the “base” case for the test; it is compared to the proportion of respondents who supported the green policies in each of the other sub-groups within that category. For the“support” levels noted in italic type, too few respondents supported the policies to run the test of two proportions.

34 Survey Results
Mineta Transportation Institute
Breaking down residents into geographic regions revealed that Bay Area respondents were themost likely to support all three green taxes and fees, although in every region and for every taxthere was at least majority support, with only three exceptions. (The three exceptions weresupport by Central Valley, Central Coast, and rural California residents for the green mileagefee.) The difference in the percent of supporters between the Bay Area and the other regionswas not especially large, varying from just two percentage points in one case up to 11percentage points. In only a few cases were the differences statistically significant. Thedifference was statistically significant for the registration fee when comparing support levels inthe Bay Area to Southern California outside Los Angeles and to Central Valley residents. BayArea respondents were also statistically significantly more likely to support the feebate thanLos Angeles residents. The differences in support by region may reflect political differencesamong the regions, as the Bay Area has a considerably higher proportion of Democrats than doother regions of the state.
Women were moderately more likely to support all three policies, although the difference wasonly significant for the mileage fee proposal. Fifty-five percent of women favored this,compared to 45% of men. This result is also in line with previous findings that indicatewomen are more willing to pay more for green products than men and are thus likely to bemore supportive of a green transportation fee.51
Age played a similarly modest role, somewhat contrary to expectations. A priori, the authorsexpected younger respondents to be generally more supportive of the green policy options asthe literature review revealed a tendency for older adults to be less supportive of “green”products, but this was true only to a small extent.52 The oldest group, those 55 years or older,were indeed the least likely to support two of the proposals, but the difference between theoldest and youngest group was only significant for the green registration fee proposal (70%support for the youngest group and 61% for the oldest group). There were no real differencesin level of support by age for the feebate proposal.
As for education, only one significant difference was revealed between those who had attendedcollege compared to those who had not: those who had formal schooling beyond high schoolwere 14 percentage points more likely to support the feebate proposal. The weak link betweeneducation and support for the green taxes was surprising, since prior research looking at thecharacteristics of “green” consumers finds education to be a strong and consistent indicator ofpro-environmental behavior.53
As with socio-demographic factors, there were surprisingly few significant differences insupport levels when respondents were sorted into groups based on key travel behavior factorssuch as their usual commute mode, how many miles they drove in the last twelve months,whether they have cut back their driving in response to higher fuel prices, and whether or notthey have taken transit or biked or walked in the past seven days (see Table 7). Also, supportlevels were at 50% or above for almost every sub-group and every tax and fee proposal.

Mineta Transportation Institute
Survey Results 35
However, there were a few significant differences based on whether respondents had usedtransit or walked or biked, and how much they had cut back on driving in response to therecent rise in fuel prices. Thirteen percentage points fewer of the respondents who had nottaken transit in the past seven days supported the green registration fee increase (62% versus75%), though there was no significant difference in their support levels for the other two
Table 7 Support for the green fee policies, by travel behavior
Travel Behavior Categories
Green Registration Fee Increase Green Mileage Fee Feebate
Support(%)
Don’t Know (%)
Support (%)
Don’t Know (%)
Support (%)
Don’t Know (%)
All respondents 63 4 50 5 66 4“How do you usually commute to work?” (Question D8) Drive yourself 64 3 48 3 67 2
Use transit, carpool, bicycle or walk 73 5 55 7 69 5
NA–work at home 63 0 50 3 70 1“In the past seven days, have you taken any form of public transit, like a bus, light rail, subway, or commuter train?” (Question 9) Yes 75 4 55 8 71 6 No 62** 4 50 4 65 4 Don’t know 33 0 0 33 33 0“In the past seven days, have you walked or biked from your home to get to work, shopping, eating out, or other errands?” (Question 10) Yes 69 5 54 6 70 6 No 60** 4 48 4 63* 4 Don’t know 100 0 100 0 100 0“About how many miles did you, personally, drive during the past 12 months in all motorized vehicles? Please exclude miles you drove as part of a job.” (Question 11) 1–3,000 66 4 52 5 66 4
3,001–7,500 63 3 49 3 64 4 7,501–12,500 65 3 48 3 68 2 12,501+ 60 3 46 3 68 3 NA–don’t drive 61 13 59 10 53 18 Don’t know 63 6 53 9 63 8“As a result of the recent rise in gasoline prices, how much, if any, have you cut back on your driving? Have you cut back a lot, a little or not at all?” (Question 12) Cut back a lot 62 5 55 2 66 5 Cut back a little 69 4 51 6 71 3 Not at all 59 3 44* 3 63 3 NA–don’t drive 75 4 50 16 67 4 Don’t know 100 0 67 33 100 0* p ≤ 0.05** p ≤ 0.01Notes: The test of two proportions was used to check if there was a statistically significant difference between “support” levels among sub-groups. (No test was run on the “don’t know” proportions). The first sub-group listed in each category is the “base” case for the test; it is compared to the proportion of respondents who supported the green policies in each of the other sub-groups within that category. For the “support” levels noted in italic type, too few respondents supported the policies to run the test of two proportions.

36 Survey Results
Mineta Transportation Institute
green fees. Also, the group of respondents who had not walked or biked from home to getsomewhere in the past seven days were nine percentage points less likely to support the vehicleregistration fee increase and seven percentage points less likely to support the feebate system,though their support for the mileage fee was not significantly different. Finally, only 44% ofrespondents who said that they had not cut back their driving in response to higher gasolineprices were likely to support the green mileage fee, 11 percentage points less than the groupwho had cut back their driving a lot.
The survey asked respondents some questions about the vehicle they “drive the most.” Morestriking differences among subgroups showed up here than in the preceding tables. As shownin Table 8, vehicle model year had no significant impact on whether respondents said theywould support any of the three green fee policies. However, vehicle type had some impact.Respondents who said they drove pickup trucks or trucks were less likely than drivers ofpassenger cars to support both the green vehicle registration fee and the feebate system. Thepercentage of drivers of vans and SUVs who supported the green taxes and feed varied, rangingfrom two percentage points more supportive than passenger car drivers to 10 percentagepoints less supportive than passenger car drivers, although none of these differences werestatistically significant.
Vehicle fuel efficiency also had an impact on support levels. In general, support levels drop asfuel efficiency gets lower, varying by as much as 17 percentage points compared to the othersub-groups for which there were enough respondents to run the significance test. Therespondents with the least fuel efficient vehicles were even less likely to support the green feepolicies, though there were too few of them to test if the difference is statistically significant.Finally, drivers who said that gas mileage was a “not very” or “not at all important” factorwhen they purchased or leased the vehicle were less likely to support all three policies thanthose drivers who said gas mileage was a somewhat or very important factor. Here thedifferences ranged from 11 to 19 percentage points (and were statistically significant).
Support By Opinions and Knowledge About Policy Issues in California
The survey also looked at the extent to which respondents’ views on the green transportationtax and fee policies might vary according to their opinions and knowledge about policy issuesin California, especially policies related to transportation and environmental issues. Previousresearch related to both transportation and environmental behavior indicates that people’sattitudes toward the environment may correlate with their support for green policies. Inaddition, attitudes for one green behavior or product may carry over to views on other greenproducts and behaviors.54 Finally, knowledge can also be a key factor that influences people’sopinions and behavior.55 To test whether these expected relationships might hold with respectto support for green taxes and fees, the survey included questions to assess respondents’knowledge about how much motor vehicles contribute to global warming and air pollution, aswell as some basic facts about transportation finance in California.

Mineta Transportation Institute
Survey Results 37
Table 9 shows how respondents answered a series of four questions asking how much of aproblem they perceived air pollution, traffic congestion, and the “quality of the transportationsystem” to be. Virtually all respondents answered that pollution and traffic congestion are abig problem or somewhat of a problem for the state as a whole, but only about half said thatthe transportation system or air pollution are problems for them personally or for their
Table 8 Support for green fee policies, by type of vehicle respondent drives the most
Vehicle Type Categoriesa
a. These questions were introduced with the line, “Now I have a few questions about the vehicle you drivethe most.”
Green Registration Fee Increase Green Mileage Fees Feebate
Support (%)
Don’t Know (%)
Support (%)
Don’t Know (%)
Support (%)
Don’t Know (%)
All respondents 63 4 50 5 66 4“What is the model year of this vehicle?” (Question 13) 2004–2008 64 2 51 3 70 2 2000–2003 61 5 47 5 67 4 1951–1999 66 5 49 4 65 4 Don’t drive 61 4 52 9 44 4 Don’t know 52 4 54 11 52 11“What type of vehicle is it? Is this vehicle a . . .” (Question 14) ALTERNATE CATEGORIES Passenger car 67 4 53 4 70 3 Van or minivan 67 5 55 7 68 5 Sport utility vehicle 64 1 43 3 64 3 Pickup truck/truck 48** 3 39 4 57** 5 Other 27 0 9 9 46 9“What is the approximate fuel efficiency of this vehicle? In other words, how many miles per gallon does the vehicle get?” (Question 16) 28–75 MPG 75 3 55 4 75 3 23–27 MPG 63** 4 43* 6 67 2 18–22 MPG 63** 2 48 3 66* 2 13–17 MPG 49** 5 38* 2 63* 4 <13 MPG 46 6 33 2 40 6Don’t know 67 6 64 4 67 8“When you purchased or leased this vehicle, how much of a factor was gas mileage? Was it a very important factor, somewhat important, not very important, or not important at all?” (Question 17)
Very/somewhat important 70 3 53 3 71 3
Not very important/not important at all 51** 4 42** 4 58** 4
Don’t know 64 13 39 23 59 5* p ≤ 0.05 ** p ≤ 0.01Notes: The test of two proportions was used to check if there was a statistically significant difference between “support” levels among sub-groups. (No test was run on the “don’t know” proportions). The first sub-group listed in each category is the “base” case for the test; it is compared to the proportion of respondents who supported the green policies in each of the other sub-groups within that category. For the “support” levels noted in italic type, too few respondents supported the policies to run the test of two proportions.
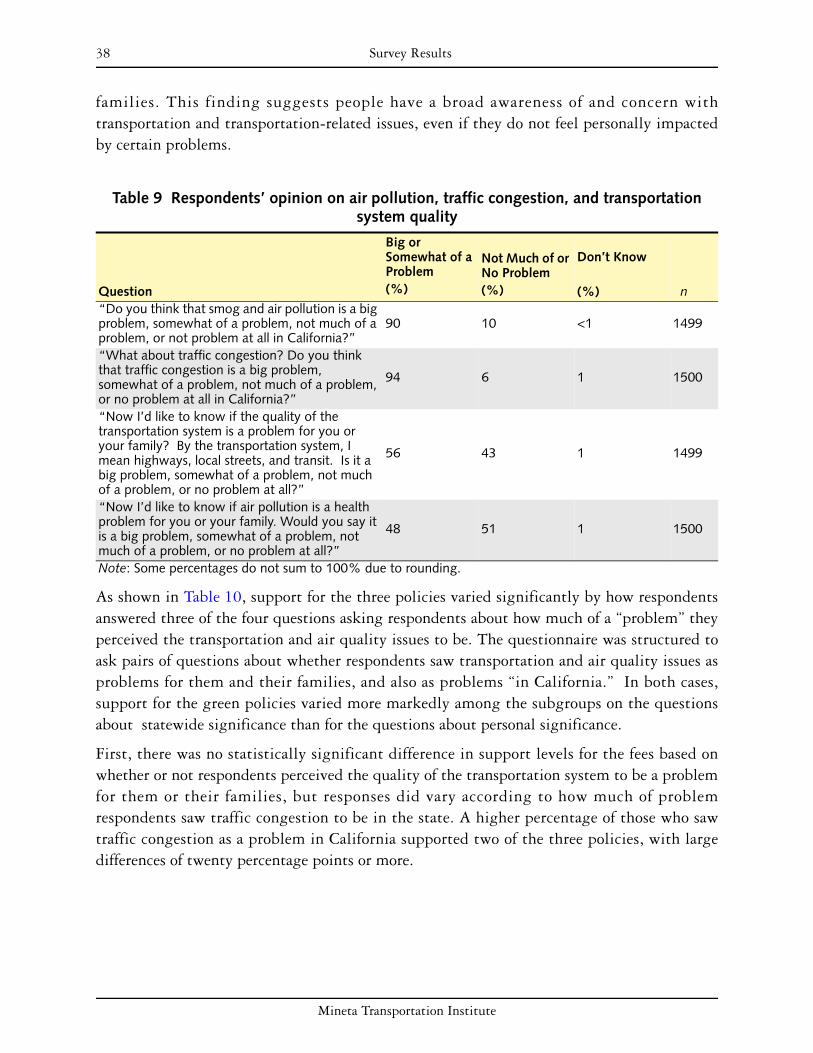
38 Survey Results
Mineta Transportation Institute
families. This finding suggests people have a broad awareness of and concern withtransportation and transportation-related issues, even if they do not feel personally impactedby certain problems.
As shown in Table 10, support for the three policies varied significantly by how respondentsanswered three of the four questions asking respondents about how much of a “problem” theyperceived the transportation and air quality issues to be. The questionnaire was structured toask pairs of questions about whether respondents saw transportation and air quality issues asproblems for them and their families, and also as problems “in California.” In both cases,support for the green policies varied more markedly among the subgroups on the questionsabout statewide significance than for the questions about personal significance.
First, there was no statistically significant difference in support levels for the fees based onwhether or not respondents perceived the quality of the transportation system to be a problemfor them or their families, but responses did vary according to how much of problemrespondents saw traffic congestion to be in the state. A higher percentage of those who sawtraffic congestion as a problem in California supported two of the three policies, with largedifferences of twenty percentage points or more.
Table 9 Respondents’ opinion on air pollution, traffic congestion, and transportation system quality
Question
Big or Somewhat of a Problem(%)
Not Much of or No Problem (%)
Don’t Know
(%) n“Do you think that smog and air pollution is a big problem, somewhat of a problem, not much of a problem, or not problem at all in California?”
90 10 <1 1499
“What about traffic congestion? Do you think that traffic congestion is a big problem, somewhat of a problem, not much of a problem, or no problem at all in California?”
94 6 1 1500
“Now I’d like to know if the quality of the transportation system is a problem for you or your family? By the transportation system, I mean highways, local streets, and transit. Is it a big problem, somewhat of a problem, not much of a problem, or no problem at all?”
56 43 1 1499
“Now I’d like to know if air pollution is a health problem for you or your family. Would you say it is a big problem, somewhat of a problem, not much of a problem, or no problem at all?”
48 51 1 1500
Note: Some percentages do not sum to 100% due to rounding.
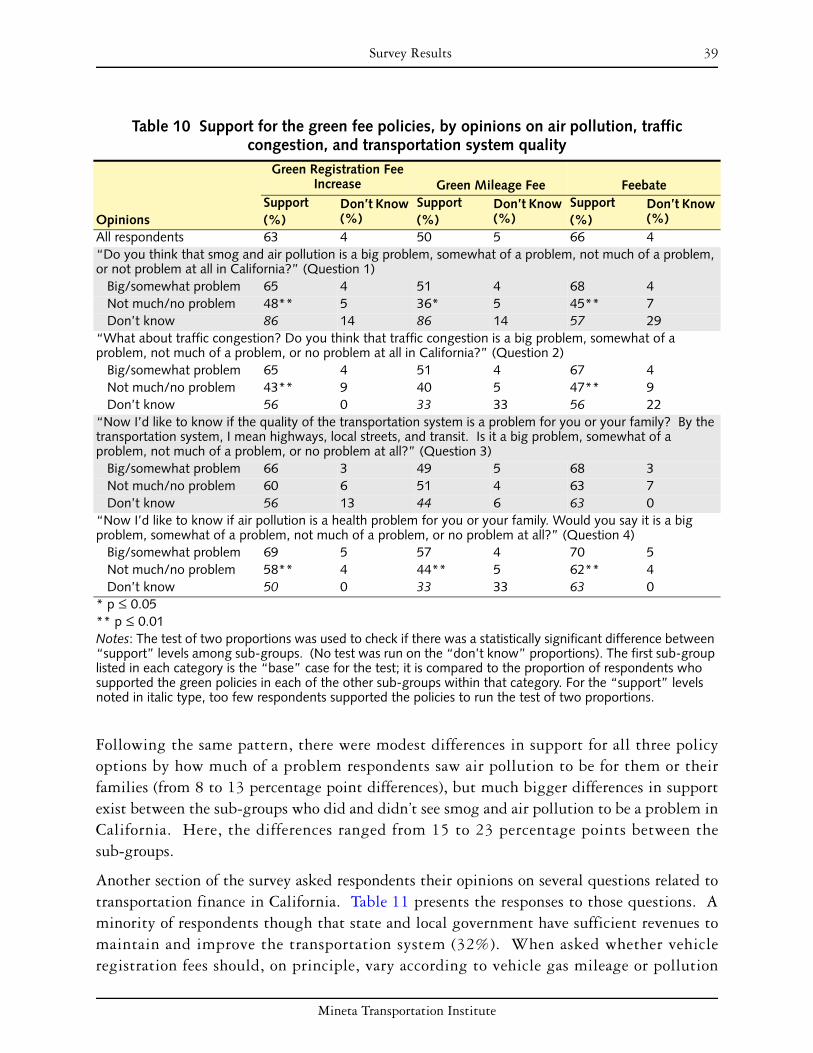
Mineta Transportation Institute
Survey Results 39
Following the same pattern, there were modest differences in support for all three policyoptions by how much of a problem respondents saw air pollution to be for them or theirfamilies (from 8 to 13 percentage point differences), but much bigger differences in supportexist between the sub-groups who did and didn’t see smog and air pollution to be a problem inCalifornia. Here, the differences ranged from 15 to 23 percentage points between thesub-groups.
Another section of the survey asked respondents their opinions on several questions related totransportation finance in California. Table 11 presents the responses to those questions. Aminority of respondents though that state and local government have sufficient revenues tomaintain and improve the transportation system (32%). When asked whether vehicleregistration fees should, on principle, vary according to vehicle gas mileage or pollution
Table 10 Support for the green fee policies, by opinions on air pollution, traffic congestion, and transportation system quality
Opinions
Green Registration Fee Increase Green Mileage Fee Feebate
Support (%)
Don’t Know (%)
Support (%)
Don’t Know (%)
Support (%)
Don’t Know (%)
All respondents 63 4 50 5 66 4“Do you think that smog and air pollution is a big problem, somewhat of a problem, not much of a problem, or not problem at all in California?” (Question 1) Big/somewhat problem 65 4 51 4 68 4 Not much/no problem 48** 5 36* 5 45** 7 Don’t know 86 14 86 14 57 29“What about traffic congestion? Do you think that traffic congestion is a big problem, somewhat of a problem, not much of a problem, or no problem at all in California?” (Question 2) Big/somewhat problem 65 4 51 4 67 4 Not much/no problem 43** 9 40 5 47** 9 Don’t know 56 0 33 33 56 22“Now I’d like to know if the quality of the transportation system is a problem for you or your family? By the transportation system, I mean highways, local streets, and transit. Is it a big problem, somewhat of a problem, not much of a problem, or no problem at all?” (Question 3) Big/somewhat problem 66 3 49 5 68 3 Not much/no problem 60 6 51 4 63 7 Don’t know 56 13 44 6 63 0“Now I’d like to know if air pollution is a health problem for you or your family. Would you say it is a big problem, somewhat of a problem, not much of a problem, or no problem at all?” (Question 4) Big/somewhat problem 69 5 57 4 70 5 Not much/no problem 58** 4 44** 5 62** 4 Don’t know 50 0 33 33 63 0* p ≤ 0.05** p ≤ 0.01Notes: The test of two proportions was used to check if there was a statistically significant difference between “support” levels among sub-groups. (No test was run on the “don’t know” proportions). The first sub-group listed in each category is the “base” case for the test; it is compared to the proportion of respondents who supported the green policies in each of the other sub-groups within that category. For the “support” levels noted in italic type, too few respondents supported the policies to run the test of two proportions.

40 Survey Results
Mineta Transportation Institute
emissions, 57% agreed with the principle of linking the fees to gas mileage, while 68% agreedwith the principle of linking the fees to emissions rates.
Table 12 shows the correlation between responses to these questions on transportation financeand support for the three green fee options. Respondents who thought the government hadadequate funds were less likely to support all three green transportation fee policies than thosewho thought government did not have adequate funds. The differences fell within a modestrange, from 11 to 14 percentage points. Majorities of the respondents who thoughtgovernment already had sufficient revenues nevertheless still supported the green vehicleregistration fee and feebate policies. As for the questions about linking vehicle registrationfees to fuel efficiency and emissions, these revealed unsurprisingly stark differences in supportfor the green transportation fee policies tested later in the survey, with the percentage pointdifferences in support between those who did and did not agree with the two statementsranging from 35 to 53 percentage points.
The survey also tested respondents’ knowledge of how transportation funds are raised inCalifornia, plus their understanding of the relationship between motor vehicle use and airpollution and global warming. Table 13 shows that majorities of respondents (55% to 74%)knew the correct answer to all but one question. The one question which the majority ofrespondents answered incorrectly related to the gas tax; only 20% of respondents knew thatstate and federal gas tax rates have not been raised in more than 10 years. Across all thesequestions, fairly high percentages of respondents answered “don’t know”—from 6% to a highof 31%.
Table 11 Respondents’ opinions on transportation revenues and principles of structuring vehicle registration fees
Question
Does Have/Yes (%)
Does Not Have/No (%)
Don’t Know (%) n
“Overall, do you think that state and local government does or does not have adequate funding to maintain and improve the transportation system?”
32 49 19 1494
“Generally speaking, should the fees that people pay to register their vehicles take into account the gasoline mileage those vehicles achieve? That is, should the fees be lower for vehicles that get more miles per gallon, and higher for vehicles that get fewer miles per gallon?”
57 34 9 1494
“As a general principle, should the fees that people pay to register their vehicles take into account the amount of pollution those vehicles emit? That is, should the fees be lower for vehicles that emit less air pollution, and higher for vehicles that emit more air pollution?”
68 27 6 1490
Note: Some percentages do not sum to 100% due to rounding.

Mineta Transportation Institute
Survey Results 41
Table 12 Support for the green fee policies, by opinions on transportation revenues and principles of structuring vehicle registration fees
Opinions
Green Registration Fee Increase Green Mileage Fee FeebateSupport (%)
Don’t Know (%)
Support (%)
Don’t Know (%)
Support (%)
Don’t Know (%)
All respondents 63 4 50 5 66 4“Overall, do you think that state and local government does or does not have adequate funding to maintain and improve the transportation system?” (Question 5) Does have 55 3 43 3 58 3 Does not have 69** 3 54** 4 71** 3 Don’t know 64* 8 51 10 63 11“Generally speaking, should the fees that people pay to register their vehicles take into account the gasoline mileage those vehicles achieve? That is, should the fees be lower for vehicles that get more miles per gallon, and higher for vehicles that get fewer miles per gallon?” (Question 6) Yes 80 3 65 4 79 4 No 37** 3 27** 3 45** 3 Don’t know 54** 13 47** 13 57** 15“As a general principle, should the fees that people pay to register their vehicles take into account the amount of pollution those vehicles emit? That is, should the fees be lower for vehicles that emit less air pollution, and higher for vehicles that emit more air pollution?” (Question 7) Yes 80 3 63 4 76 4 No 27** 4 21** 3 41** 4 Don’t know 40** 16 36** 16 56** 11* p ≤ 0.05** p ≤ 0.01Notes: The test of two proportions was used to check if there was a statistically significant difference between “support” levels among sub-groups. (No test was run on the “don’t know” proportions). The first sub-group listed in each category is the “base” case for the test; it is compared to the proportion of respondents who supported the green policies in each of the other sub-groups within that category.
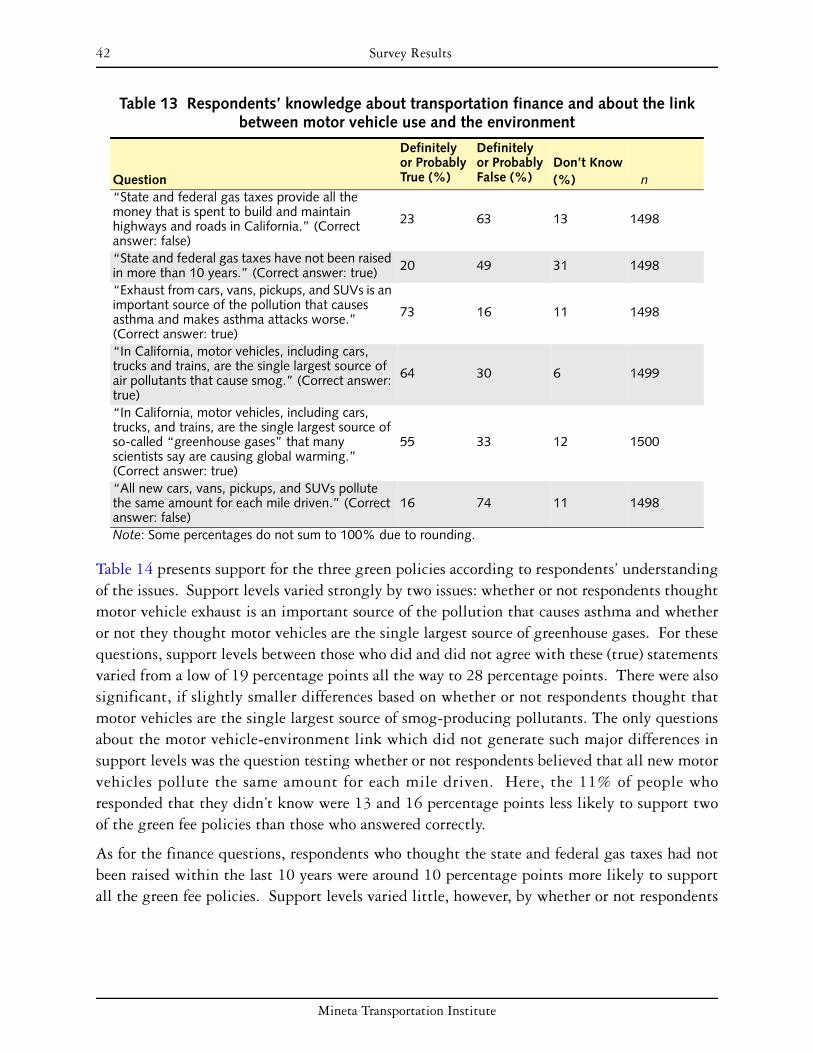
42 Survey Results
Mineta Transportation Institute
Table 14 presents support for the three green policies according to respondents’ understandingof the issues. Support levels varied strongly by two issues: whether or not respondents thoughtmotor vehicle exhaust is an important source of the pollution that causes asthma and whetheror not they thought motor vehicles are the single largest source of greenhouse gases. For thesequestions, support levels between those who did and did not agree with these (true) statementsvaried from a low of 19 percentage points all the way to 28 percentage points. There were alsosignificant, if slightly smaller differences based on whether or not respondents thought thatmotor vehicles are the single largest source of smog-producing pollutants. The only questionsabout the motor vehicle-environment link which did not generate such major differences insupport levels was the question testing whether or not respondents believed that all new motorvehicles pollute the same amount for each mile driven. Here, the 11% of people whoresponded that they didn’t know were 13 and 16 percentage points less likely to support twoof the green fee policies than those who answered correctly.
As for the finance questions, respondents who thought the state and federal gas taxes had notbeen raised within the last 10 years were around 10 percentage points more likely to supportall the green fee policies. Support levels varied little, however, by whether or not respondents
Table 13 Respondents’ knowledge about transportation finance and about the link between motor vehicle use and the environment
Question
Definitely or Probably True (%)
Definitely or Probably False (%)
Don’t Know(%) n
“State and federal gas taxes provide all the money that is spent to build and maintain highways and roads in California.” (Correct answer: false)
23 63 13 1498
“State and federal gas taxes have not been raised in more than 10 years.” (Correct answer: true) 20 49 31 1498
“Exhaust from cars, vans, pickups, and SUVs is an important source of the pollution that causes asthma and makes asthma attacks worse.” (Correct answer: true)
73 16 11 1498
“In California, motor vehicles, including cars, trucks and trains, are the single largest source of air pollutants that cause smog.” (Correct answer: true)
64 30 6 1499
“In California, motor vehicles, including cars, trucks, and trains, are the single largest source of so-called “greenhouse gases” that many scientists say are causing global warming.” (Correct answer: true)
55 33 12 1500
“All new cars, vans, pickups, and SUVs pollute the same amount for each mile driven.” (Correct answer: false)
16 74 11 1498
Note: Some percentages do not sum to 100% due to rounding.
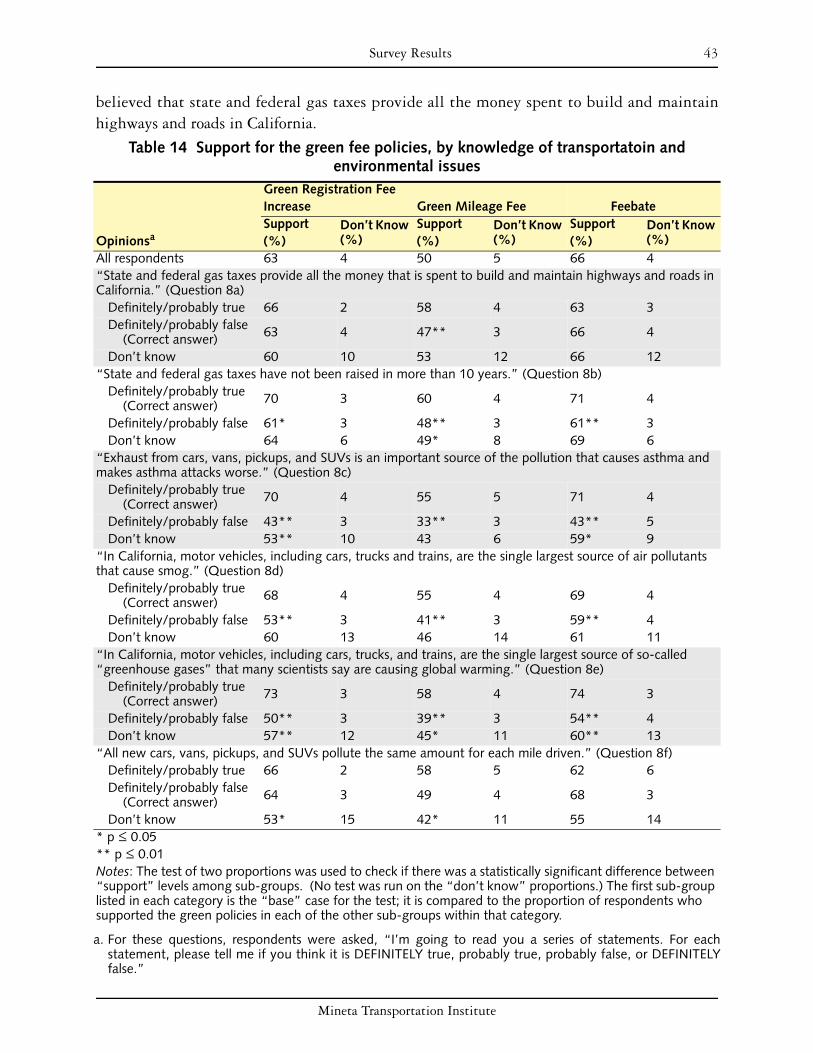
Mineta Transportation Institute
Survey Results 43
believed that state and federal gas taxes provide all the money spent to build and maintainhighways and roads in California.
Table 14 Support for the green fee policies, by knowledge of transportatoin and environmental issues
Opinionsa
a. For these questions, respondents were asked, “I’m going to read you a series of statements. For eachstatement, please tell me if you think it is DEFINITELY true, probably true, probably false, or DEFINITELYfalse.”
Green Registration Fee Increase Green Mileage Fee FeebateSupport (%)
Don’t Know (%)
Support (%)
Don’t Know (%)
Support (%)
Don’t Know (%)
All respondents 63 4 50 5 66 4“State and federal gas taxes provide all the money that is spent to build and maintain highways and roads in California.” (Question 8a)
Definitely/probably true 66 2 58 4 63 3Definitely/probably false
(Correct answer) 63 4 47** 3 66 4
Don’t know 60 10 53 12 66 12“State and federal gas taxes have not been raised in more than 10 years.” (Question 8b)
Definitely/probably true (Correct answer) 70 3 60 4 71 4
Definitely/probably false 61* 3 48** 3 61** 3Don’t know 64 6 49* 8 69 6
“Exhaust from cars, vans, pickups, and SUVs is an important source of the pollution that causes asthma and makes asthma attacks worse.” (Question 8c)
Definitely/probably true (Correct answer) 70 4 55 5 71 4
Definitely/probably false 43** 3 33** 3 43** 5Don’t know 53** 10 43 6 59* 9
“In California, motor vehicles, including cars, trucks and trains, are the single largest source of air pollutants that cause smog.” (Question 8d)
Definitely/probably true (Correct answer) 68 4 55 4 69 4
Definitely/probably false 53** 3 41** 3 59** 4Don’t know 60 13 46 14 61 11
“In California, motor vehicles, including cars, trucks, and trains, are the single largest source of so-called “greenhouse gases” that many scientists say are causing global warming.” (Question 8e)
Definitely/probably true (Correct answer) 73 3 58 4 74 3
Definitely/probably false 50** 3 39** 3 54** 4Don’t know 57** 12 45* 11 60** 13
“All new cars, vans, pickups, and SUVs pollute the same amount for each mile driven.” (Question 8f)Definitely/probably true 66 2 58 5 62 6Definitely/probably false
(Correct answer) 64 3 49 4 68 3
Don’t know 53* 15 42* 11 55 14* p ≤ 0.05** p ≤ 0.01Notes: The test of two proportions was used to check if there was a statistically significant difference between “support” levels among sub-groups. (No test was run on the “don’t know” proportions.) The first sub-group listed in each category is the “base” case for the test; it is compared to the proportion of respondents who supported the green policies in each of the other sub-groups within that category.
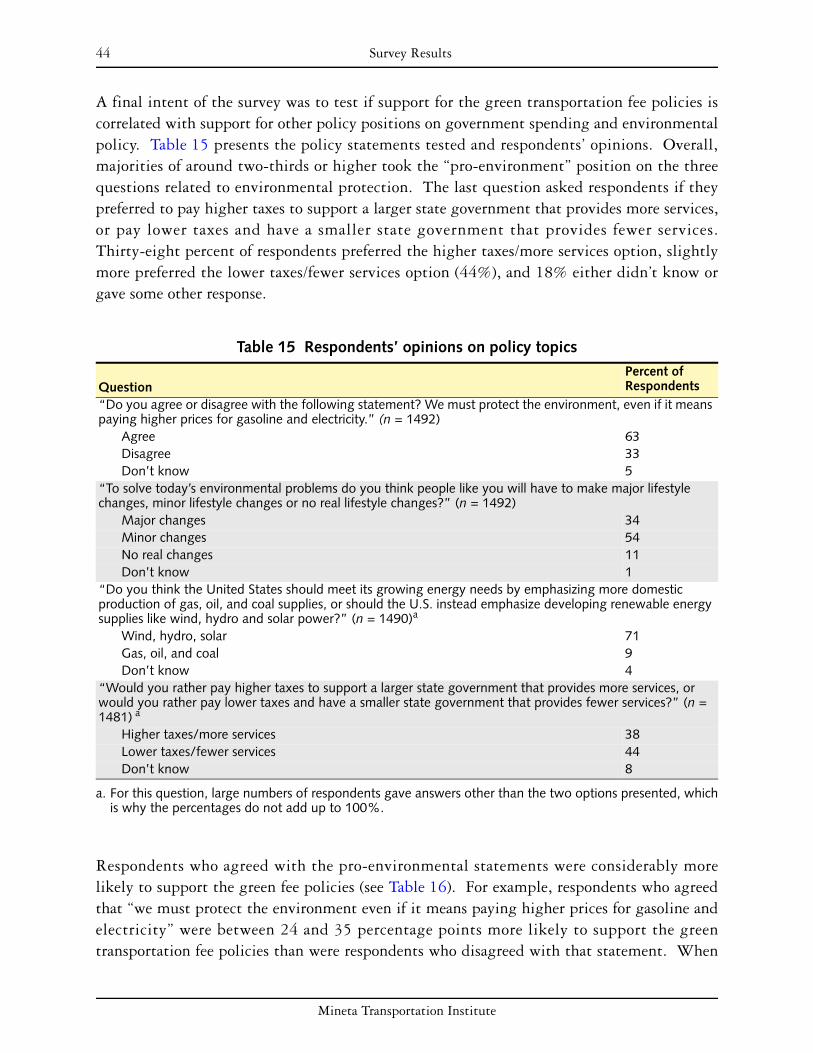
44 Survey Results
Mineta Transportation Institute
A final intent of the survey was to test if support for the green transportation fee policies iscorrelated with support for other policy positions on government spending and environmentalpolicy. Table 15 presents the policy statements tested and respondents’ opinions. Overall,majorities of around two-thirds or higher took the “pro-environment” position on the threequestions related to environmental protection. The last question asked respondents if theypreferred to pay higher taxes to support a larger state government that provides more services,or pay lower taxes and have a smaller state government that provides fewer services.Thirty-eight percent of respondents preferred the higher taxes/more services option, slightlymore preferred the lower taxes/fewer services option (44%), and 18% either didn’t know orgave some other response.
Respondents who agreed with the pro-environmental statements were considerably morelikely to support the green fee policies (see Table 16). For example, respondents who agreedthat “we must protect the environment even if it means paying higher prices for gasoline andelectricity” were between 24 and 35 percentage points more likely to support the greentransportation fee policies than were respondents who disagreed with that statement. When
Table 15 Respondents’ opinions on policy topics
QuestionPercent of Respondents
“Do you agree or disagree with the following statement? We must protect the environment, even if it means paying higher prices for gasoline and electricity.” (n = 1492)
Agree 63 Disagree 33 Don’t know 5
“To solve today’s environmental problems do you think people like you will have to make major lifestyle changes, minor lifestyle changes or no real lifestyle changes?” (n = 1492)
Major changes 34 Minor changes 54 No real changes 11 Don’t know 1
“Do you think the United States should meet its growing energy needs by emphasizing more domestic production of gas, oil, and coal supplies, or should the U.S. instead emphasize developing renewable energy supplies like wind, hydro and solar power?” (n = 1490)a
Wind, hydro, solar 71 Gas, oil, and coal 9 Don’t know 4
“Would you rather pay higher taxes to support a larger state government that provides more services, or would you rather pay lower taxes and have a smaller state government that provides fewer services?” (n = 1481) a
a. For this question, large numbers of respondents gave answers other than the two options presented, whichis why the percentages do not add up to 100%.
Higher taxes/more services 38 Lower taxes/fewer services 44 Don’t know 8

Mineta Transportation Institute
Survey Results 45
respondents were posed with a question that did not directly relate to the cost of driving, thequestion of whether the U.S. should emphasize renewable or conventional sources of energy,respondents who favored the renewable energy sources were from 16 to 27 percentage pointsmore likely to support the green transportation tax policies. Among those respondents whochose the responses that were unsupportive of environmental protection, support levels for thegreen transportation fee policies were often under 50%. These were some of the lowestsupport levels among any population sub-groups identified through the survey. The low levelsof support are in line with previous research that links support for one green activity withsupport for other environmentally-friendly behaviors.56 In addition, althoughsocio-demographic characteristics are often used to profile green consumers, the role ofattitudes and values have been suggested as more important predictors.57 The authors’findings also support this, as respondents who tended to be unsupportive of otherpro-environmental actions and policies were by far the least likely population subgroup tosupport the green transportation taxes and fees.
Finally, on the question about state taxes and government services, those respondents whopreferred a system of higher taxes and more state services were from 20 to 26 percentage pointsmore likely to support the three green transportation taxes and fees. However, even amongthose who preferred lower taxes and fewer state services, majorities still supported the greenvehicle registration fee and the feebate.
SUPPORT FOR GREEN (VARIABLE RATE) VERSUS FLAT-RATE TRANSPORTATION TAXES AND FEES
A key objective in the survey was to compare respondents’ support for flat versus greenversions of transportation taxes and fees (rather than to determine support for the specificpolicies tested). To test this point, respondents were asked about their support for both a flatversion and then a green version of two policies, the vehicle registration fee increase andreplacing the state gas tax with a mileage fee. The tables in this section show the difference insupport levels for the flat and green versions of these two taxes. For example, 63% of allrespondents supported the green vehicle registration fee increase, compared to just 41%supporting the flat increase—a difference of 22 percentage points. For the mileage fee, thedifference was almost as great—50% of all respondents supported the green version comparedto just 28% supporting the flat version, a 22 percentage point difference.
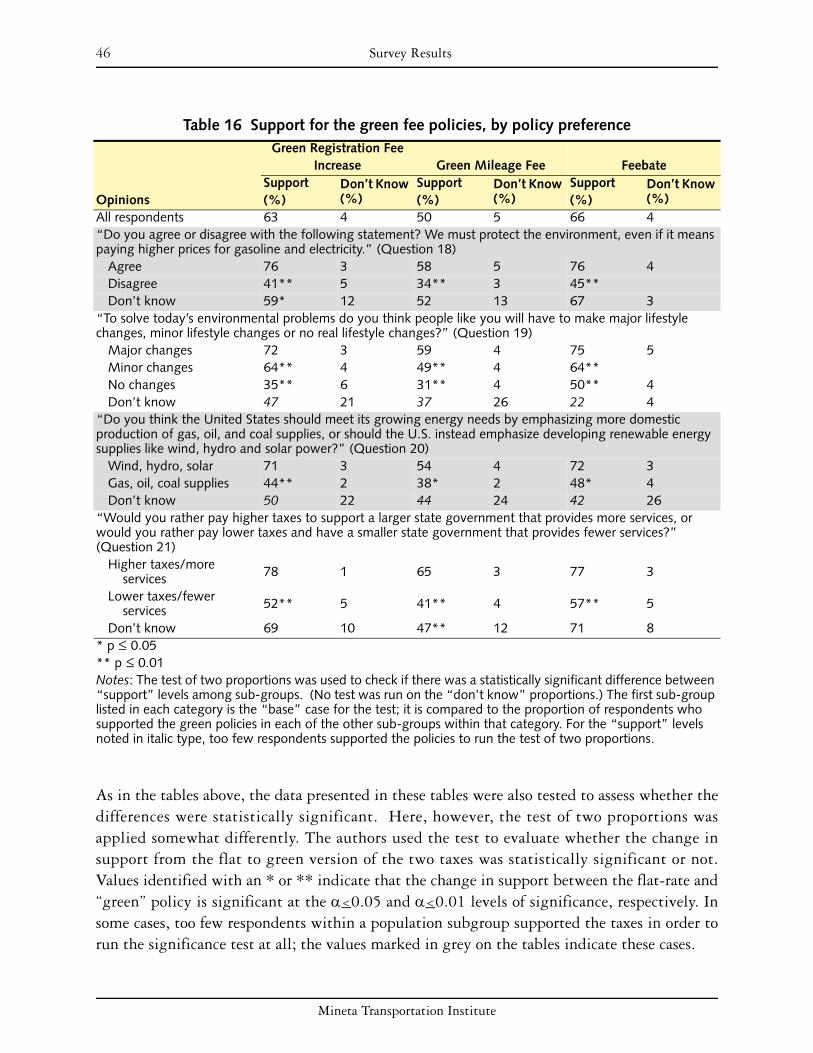
46 Survey Results
Mineta Transportation Institute
As in the tables above, the data presented in these tables were also tested to assess whether thedifferences were statistically significant. Here, however, the test of two proportions wasapplied somewhat differently. The authors used the test to evaluate whether the change insupport from the flat to green version of the two taxes was statistically significant or not.Values identified with an * or ** indicate that the change in support between the flat-rate and“green” policy is significant at the α<0.05 and α<0.01 levels of significance, respectively. Insome cases, too few respondents within a population subgroup supported the taxes in order torun the significance test at all; the values marked in grey on the tables indicate these cases.
Table 16 Support for the green fee policies, by policy preference
Opinions
Green Registration Fee Increase Green Mileage Fee Feebate
Support (%)
Don’t Know (%)
Support (%)
Don’t Know (%)
Support (%)
Don’t Know (%)
All respondents 63 4 50 5 66 4“Do you agree or disagree with the following statement? We must protect the environment, even if it means paying higher prices for gasoline and electricity.” (Question 18)
Agree 76 3 58 5 76 4Disagree 41** 5 34** 3 45**Don’t know 59* 12 52 13 67 3
“To solve today’s environmental problems do you think people like you will have to make major lifestyle changes, minor lifestyle changes or no real lifestyle changes?” (Question 19)
Major changes 72 3 59 4 75 5Minor changes 64** 4 49** 4 64**No changes 35** 6 31** 4 50** 4Don’t know 47 21 37 26 22 4
“Do you think the United States should meet its growing energy needs by emphasizing more domestic production of gas, oil, and coal supplies, or should the U.S. instead emphasize developing renewable energy supplies like wind, hydro and solar power?” (Question 20)
Wind, hydro, solar 71 3 54 4 72 3Gas, oil, coal supplies 44** 2 38* 2 48* 4Don’t know 50 22 44 24 42 26
“Would you rather pay higher taxes to support a larger state government that provides more services, or would you rather pay lower taxes and have a smaller state government that provides fewer services?” (Question 21)
Higher taxes/more services 78 1 65 3 77 3
Lower taxes/fewer services 52** 5 41** 4 57** 5
Don’t know 69 10 47** 12 71 8* p ≤ 0.05** p ≤ 0.01Notes: The test of two proportions was used to check if there was a statistically significant difference between “support” levels among sub-groups. (No test was run on the “don’t know” proportions.) The first sub-group listed in each category is the “base” case for the test; it is compared to the proportion of respondents who supported the green policies in each of the other sub-groups within that category. For the “support” levels noted in italic type, too few respondents supported the policies to run the test of two proportions.

Mineta Transportation Institute
Survey Results 47
The story told by this analysis is exceedingly simple: however the authors categorizedrespondents into subgroups, in every case more people within that subgroup supported thegreen than the flat version of the two taxes tested. Also, Table 17 through Table 23 show thatwithin almost every subgroup examined where there were enough responses to do statisticaltesting, support levels were at least 10 percentage points higher for the green versions of thetwo transportation fees. In fact, there was an increase in support of at least 10 percentagepoints in 190 of 195 comparisons between subgroups’ support for a green versus flat-ratetransportation fee policy. For 75% of the 195 cases, the increases in support were 20 or morepercentage points. Most differences were also statistically significant.
Only three subgroups of respondents stood out as relatively unsupportive of the vehicleregistration fee and green mileage fee and among whom there was not an increase in support ofat least 10 percentage points for the green versus flat-rate proposals. These were therespondents who thought that:
• People like them would not have to make lifestyle changes to solve today’senvironmental problems. (These respondents were six percentage points more likely tosupport the green mileage fee than the flat-rate version. This difference was notstatistically significant.)
• Vehicle registration fee rates should not, on principle, take gasoline mileage intoaccount. (These respondents were six percentage points more likely to support thegreen mileage fee than the flat-rate version. This difference was not statisticallysignificant.)
• Vehicle registration fees should not, on principle, take pollution emissions intoaccount. (These respondents were three percentage points more likely to support thegreen vehicle registration fee than the flat-rate version and one percentage point morelikely to support the green mileage fee than the flat-rate version. Neither differencewas statistically significant.)

48 Survey Results
Mineta Transportation Institute
Table 17 Difference in support for the green vs. flat-rate registration and mileage fees by socio-demographic categories
Demographic Category
Percentage Point Difference in Support for the Vehicle Registration Feesa
a. Green fee support minus flat-rate fee support.
Percentage Point Difference in Support for the Mileage Feesa
All 22 22North/South
North 21** 22** South 24** 22**
Region Bay Area 18** 25** Los Angeles 23** 20** Other Southern California 26** 24** Central Valley 22** 17* Central Coast 22* 23 Rural CA 28 22
Gender Male 19** 19** Female 26** 25**
Age 18–24 years 27** 21** 25–54 years 24** 23** 55+ years 22** 24**
Own/rent residence Own 22** 24** Rent 24** 18**
Education level High school or less 31** 13* More than high school 21** 25**
Employed Yes–full time 21** 23** Yes–part time 22** 23** No 26** 20**
Household income Less than $50,000 31** 19** $50,000–$100,000 21** 28** Over $100,000 16** 20**
Likely voter? Yes 22** 24** No 26** 18**
Political affiliation Democrat 25** 26** Republican 20** 20** Other 16* 21*
Don’t know 22 12* p ≤ 0.05** p ≤ 0.01Notes: The test of two proportions was used to evaluate whether the change in support from the flat to green version of the two taxes was statistically significant or not. For the “support” levels noted in italic type, too few respondents supported the policies to run the test of two proportions.

Mineta Transportation Institute
Survey Results 49
Table 18 Difference in support for the green vs. flat-rate registration and mileage fees, by travel behavior
Demographic Category
Percentage Point Difference in Support for the Vehicle Registration Feesa
a. Green fee support minus flat-rate fee support.
Percentage Point Difference in Support for the Mileage Feesa
“How do you usually commute to work?” (Question D8) Drive yourself 22** 24** Transit, carpool, bike, walk 22** 20** NA–work at home 15 19“In the past seven days, have you taken any form of public transit, like a bus, light rail, subway, or commuter train?” (Question 9) Yes 23** 22** No 23** 23** Don’t know 33 -33“In the past seven days, have you walked or biked from your home to get to work, shopping, eating out, or other errands?” (Question 10) Yes 25** 23** No 21** 21** Don’t know 0 0“About how many miles did you, personally, drive during the past 12 months in all motorized vehicles? Please exclude miles you drove as part of a job.” (Question 11) 1–3,000 28** 24**
3,001–7,500 22** 22** 7,501–12,500 20** 19** 12,501+ 18** 24** NA–don’t drive 23* 18 Don’t know 31** 22*“As a result of the recent rise in gasoline prices, how much, if any, have you cut back on your driving? Have you cut back a lot, a little or not at all?” (Question 12) Cut back a lot 30** 22** Cut back a little 26** 25** Not at all 15** 19** NA–don’t drive 37 17 Don’t know 67 0* p ≤ 0.05** p ≤ 0.01Notes: The test of two proportions was used to evaluate whether the change in support from the flat to green version of the two taxes was statistically significant or not. For the “support” levels noted in italic type, too few respondents supported the policies to run the test of two proportions.

50 Survey Results
Mineta Transportation Institute
Table 19 Difference in support for the greeen vs. flat-rate registration and mileage fees, by type of vehicle respondent drives most
Vehicle Type Categories
Percentage Point Difference in Support for the Vehicle Reg. Feesa
a. Green fee support minus flat-rate fee support.
Percentage Point Difference in Support for the Mileage Feesa
“What is the model year of this vehicle?” (Question 13) 2004–2008 21** 24** 2000–2003 20** 21** 1951–1999 26** 21** Don’t drive 31 17* Don’t know 19 4“What type of vehicle is it? Is this vehicle a . . .” (Question 14) Passenger car 25** 26** Van or minivan 30** 22* Sport utility vehicle 20** 18* Pickup truck/truck 15 13 Other -9 0“What is the approximate fuel efficiency of this vehicle? In other words, how many miles per gallon does the vehicle get?” (Question 16) 28–75 MPG 27** 32** 23–27 MPG 22** 18* 18–22 MPG 23** 22** 13–17 MPG 13 15 <13 MPG 3 6Don’t know 31** 24**“When you purchased or leased this vehicle, how much of a factor was gas mileage? Was it a very important factor, somewhat important, not very important, or not important at all?” (Question 17)
Very/somewhat important 26** 26**Not very important/Not important at all 15** 15**Don’t know 25 9
* p ≤ 0.05** p ≤ 0.01Notes: The test of two proportions was used to evaluate whether the change in support from the flat to green version of the two taxes was statistically significant or not. For the “support” levels noted in italic type, too few respondents supported the policies to run the test of two proportions.
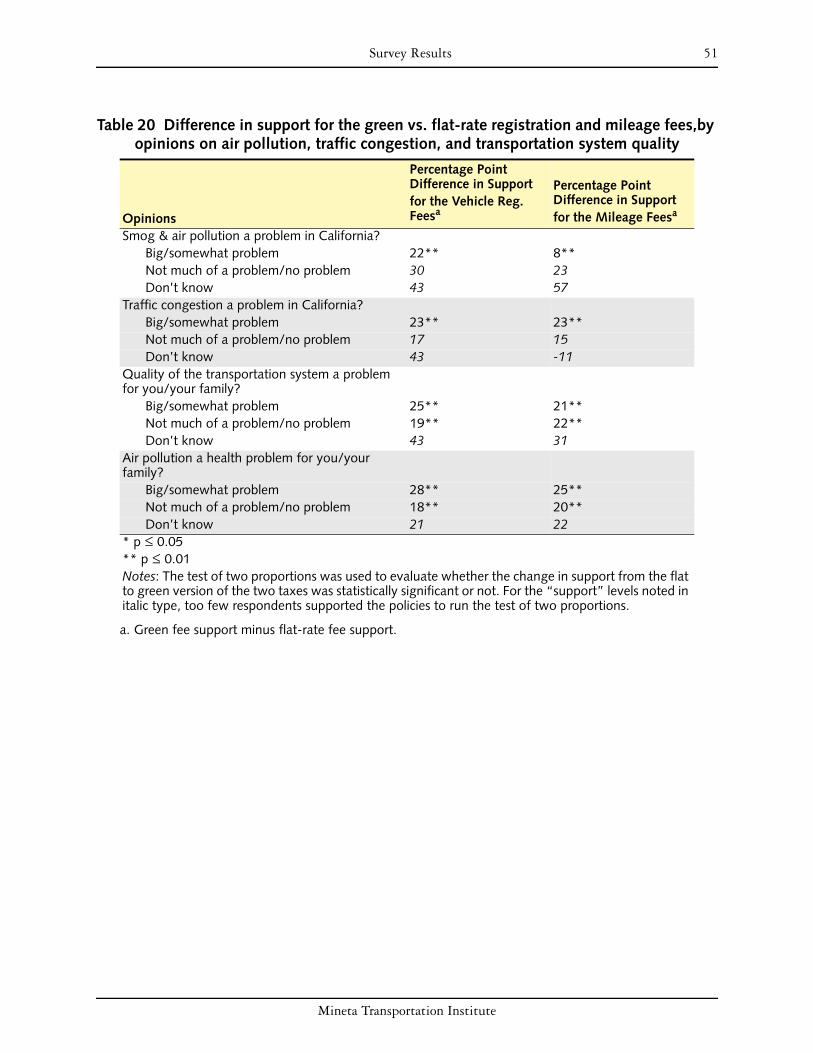
Mineta Transportation Institute
Survey Results 51
Table 20 Difference in support for the green vs. flat-rate registration and mileage fees,by opinions on air pollution, traffic congestion, and transportation system quality
Opinions
Percentage Point Difference in Support for the Vehicle Reg. Feesa
a. Green fee support minus flat-rate fee support.
Percentage Point Difference in Support for the Mileage Feesa
Smog & air pollution a problem in California? Big/somewhat problem 22** 8** Not much of a problem/no problem 30 23 Don’t know 43 57
Traffic congestion a problem in California? Big/somewhat problem 23** 23** Not much of a problem/no problem 17 15 Don’t know 43 -11
Quality of the transportation system a problem for you/your family?
Big/somewhat problem 25** 21** Not much of a problem/no problem 19** 22** Don’t know 43 31
Air pollution a health problem for you/your family?
Big/somewhat problem 28** 25** Not much of a problem/no problem 18** 20** Don’t know 21 22
* p ≤ 0.05** p ≤ 0.01Notes: The test of two proportions was used to evaluate whether the change in support from the flat to green version of the two taxes was statistically significant or not. For the “support” levels noted in italic type, too few respondents supported the policies to run the test of two proportions.

52 Survey Results
Mineta Transportation Institute
Table 21 Difference in support for the green vs. flat-rate registration and mileage fees,by opinions on transportation revenues and principles of structuring vehicle registration fees
Opinions
Percentage Point Difference in Support for the Vehicle Registration Feesa
a. Green fee support minus flat-rate fee support.
Percentage Point Difference in Support for the Mileage Feea
State/local government has adequate funding for the transportation system? Yes 25** 16** No 20** 24** Don’t know 27** 26**
Should vehicle registration fee rates take gasoline mileage into account? Yes 29** 32** No 10 6 Don’t know 27** 23*
Should vehicle registration fee rates take pollution emissions into account? Yes 32** 31** No 3 1 Don’t know 16 14
* p ≤ 0.05** p ≤ 0.01Notes: The test of two proportions was used to evaluate whether the change in support from the flat to green version of the two taxes was statistically significant or not. For the “support” levels noted in italic type, too few respondents supported the policies to run the test of two proportions.

Mineta Transportation Institute
Survey Results 53
Table 22 Difference in support for the green vs. flat-rate registration and mileage fees, by knowledge of transportation issues
Opinions
Percentage Point Difference in Support for the Vehicle Registration Feesa
a. Green fee support minus flat-rate fee support.
Percentage Point Difference in Support for the Mileage Feea
“State and federal gas taxes provide all the money that is spent to build and maintain highways and roads in California.” (Question 8a)
Definitely/probably true 28** 22** Definitely/probably false (correct answer) 22** 12* Don’t know 18** 22**
“State and federal gas taxes have not been raised in more than 10 years.” (Question 8b) Definitely/probably true (correct answer) 19** 25** Definitely/probably false 25** 19** Don’t know 23** 24**
“Exhaust from cars, vans, pickups, and SUVs is an important source of the pollution that causes asthma and makes asthma attacks worse.” (Question 8c)
Definitely/probably true (correct answer) 24** 24** Definitely/probably false 16* 13 Don’t know 25** 18
“In California, motor vehicles, including cars, trucks and trains, are the single largest source of air pollutants that cause smog.” (Question 8d)
Definitely/probably true (correct answer) 25** 24** Definitely/probably false 17** 17** Don’t know 27 25
“In California, motor vehicles, including cars, trucks, and trains, are the single largest source of so-called “greenhouse gases” that many scientists say are causing global warming.” (Question 8e)
Definitely/probably true (correct answer) 26** 25** Definitely/probably false 17** 18** Don’t know 22** 21*
“All new cars, vans, pickups, and SUVs pollute the same amount for each mile driven.” (Question 8f)
Definitely/probably true 31** 20** Definitely/probably false (correct answer) 21** 22** Don’t know 21 18
* p ≤ 0.05** p ≤ 0.01Notes: The test of two proportions was used to evaluate whether the change in support from the flat to green version of the two taxes was statistically significant or not. For the “support” levels noted in italic type, too few respondents supported the policies to run the test of two proportions.

54 Survey Results
Mineta Transportation Institute
Table 23 Difference in support for the green vs. flat-rate registration and mileage fees, by opinion on environmental policy topics
Opinions
Percentage Point Difference in Support for the Vehicle Registration Feesa
Percentage Point Difference in Support for the Mileage Feea
“Do you agree or disagree with the following statement? We must protect the environment, even if it means paying higher prices for gasoline and electricity.” (Question 18)
Agree 23** 26** Disagree 21** 13* Don’t know 37 27
“To solve today's environmental problems do you think people like you will have to make major lifestyle changes, minor lifestyle changes or no real lifestyle changes?” (Question 19)
Major changes 28** 27** Minor changes 22** 22** No changes 12 6 Don’t know 25 9
“Do you think the United States should meet its growing energy needs by emphasizing more domestic production of gas, oil, and coal supplies, or should the U.S. instead emphasize developing renewable energy supplies like wind, hydro and solar power?” (Question 20)
Gas, oil, coal supplies 17 12 Wind, hydro, solar 26** 24** Don’t know 18 12
“Would you rather pay higher taxes to support a larger state government that provides more services, or would you rather pay lower taxes and have a smaller state government that provides fewer services?” (Question 21)
Higher taxes/more services 23** 27** Lower taxes/fewer services 22** 19** Don’t know 34** 21
* p ≤ 0.05** p ≤ 0.01Notes: The test of two proportions was used to evaluate whether the change in support from the flat to green version of the two taxes was statistically significant or not. For the “support” levels noted in italic type, too few respondents supported the policies to run the test of two proportions.
a. Green fee support minus flat-rate fee support.
Mineta Transportation Institute
55
CONCLUSIONS AND RECOMMENDATIONS
This chapter summarizes the key findings from the survey and suggests some policyimplications that flow from those findings. In addition, this chapter concludes with briefrecommendations for next steps to take in creating effective, fair, and politically feasible greentransportation tax and fee policies.
SUMMARY OF KEY FINDINGS
The results of this survey show that the concept of green transportation taxes and fees stronglyappeals to Californians. The survey tested this in two ways: by testing support for threehypothetical green transportation tax and fee policies, and also by comparing support levels forflat-rate versus green versions of two hypothetical taxes.
The specific taxes and fees tested in the survey were described in the survey as follows:
• Feebate: Create a new tax and tax rebate system on all new vehicles based on how muchthey pollute. People who buy a new vehicle that doesn't pollute much would receive arebate of up to $1,000. People who buy a new vehicle that pollutes a lot, such as a verylarge SUV, would pay a tax up to $2,000. People who buy a vehicle that pollutes aboutthe average would not pay or receive anything. Flat vehicle registration fee increase:Increase the state’s vehicle registration fee from its then-current rate of $31 per vehicleper year to $62 per year per vehicle.
• Green vehicle registration fee increase: Increase the vehicle registration fee to anaverage of $62 per year, but vary the fee according to the amount of the vehicle’semissions. Higher emissions vehicles would pay higher fees, and lower emissionsvehicles would pay lower fees.
• Flat mileage fee: Eliminate the eighteen-cents-per-gallon state gas tax altogether andreplace it with a fee based on the number of miles driven. Each driver would pay a feeof one cent per mile for every mile driven within the state. For example, every onehundred miles driven would pay a fee of one dollar. Vehicles would be equipped withan electronic means to keep track of miles driven and the fee would be paid whendrivers buy gas.
• Green mileage fee: Create a variation on the mileage fee previously described, wherethe fee varies depending upon how much the vehicle pollutes. On average, vehicleswould pay one cent per mile, but vehicles that pollute the least would pay less, andconversely, vehicles that pollute the most would pay more per mile.
Majorities of the respondents supported all three green taxes and fees tested. Even the greenmileage fee, the least popular option, had 50% support. The green vehicle registration fee andfeebate policy, by contrast, both had support levels over 60%.
56 Conclusions and Recommendations
Mineta Transportation Institute
In addition, the survey found that respondents greatly preferred green transportation taxes andfees to flat-rate versions. For example, the survey found that almost two-thirds of respondents(63%) supported a green version of raising the vehicle registration fee from the current rate of$31 to an average rate of $62, with the rate higher for more polluting vehicles and lower forless polluting vehicles. However, when respondents were asked if they would supportincreasing the vehicle registration fee from $31 to a flat rate of $62 for everyone, only 41%supported the increase. Comparing the two results shows that converting the fee increase froma flat-rate one to a green version boosts support by 22 percentage points—fromless-than-majority support to almost two-thirds support. Respondents also preferred a greenmileage fee to a flat-rate version, with 50% support for the former but only 28% support forthe latter.
The finding that Californians clearly seem to prefer green to a flat-rate transportation tax or feeproposal implies that whether or not a specific green transportation tax or fee ultimatelyproves popular with the public, a green version is likely to be much more popular than thetraditional approach of flat-rate taxes and fees.
Another striking finding from the survey is that support for the green taxes and fees does notvary greatly by population subgroups. The authors categorized the survey respondents into120 subgroupings—by socio-demographic characteristics, attitudes, travel behavior patterns,etc.—and in most subgroupings, support for the green registration fee and feebate policy wasabove 50%.58 For the green vehicle registration fee, 87% of the subgroups had support levelsof 50% or higher, while for the feebate policy, 89% of the subgroups had support levels of50% or higher. Even the green mileage fee, the least popular of the three green transportationtaxes and fees tested, had a support level of at least 50% from half of the subgroups tested.
The analysis comparing support for the green and flat-rate vehicle registration fee and feebateproposals confirms that in every subgroup more people within that subgroup supported thegreen than the flat version of the two taxes tested. There was an increase in support of at least10 percentage points in 188 of the 193 comparisons between respondents’ support for a greenversus flat-rate transportation fee policy. For 74% of the 193 cases, the increases in supportwere 20 or more percentage points. Most differences were also statistically significant.
People in a few population subgroups stood out as the least supportive of the green taxes andfees, relative to the other subgroups in that category. Socio-demographic groupings did notprove influential here. Rather, some of the questions about vehicle ownership, attitudes, andknowledge revealed these low levels of support. The characteristics that proved importantwere as follows:
Vehicle-type the respondent drives the most. People are less supportive if they:
• Drive vehicles with a fuel efficiency below 18 miles per gallon (mpg).
• Drive pick-up trucks. (Drivers of SUVs, vans, and minivans were also somewhat lesssupportive than drivers of passenger cars, but the differences were mostly notstatistically significant.)

Mineta Transportation Institute
Conclusions and Recommendations 57
Opinions and attitudes. People are less supportive if they:
• Think that transportation congestion is not much of a problem or no problem forCalifornia.
• Think that smog and air pollution are not much of a problem or no problem forCalifornia.
• Think that the fees people pay to register their vehicle should not take into account thegasoline mileage those vehicles achieve
• Think that the fees people pay to register their vehicle should not take into account thevehicle’s air pollution emissions.
• Disagree with the statement that “We must protect the environment even if it meanspaying higher prices for gasoline and electricity.”
• Think that people like themselves will have to make no changes in their lifestyle tosolve today’s environmental problems.
• Think that the U.S. should meet its growing energy needs by emphasizing gas, oil, andcoal supplies, rather than developing wind, hydro, and solar power.
• Prefer to pay lower taxes and have a state government that provides fewer services(instead of paying higher taxes and having a state government that provides moreservices).
Knowledge. People are less supportive if they:
• Think that exhaust from motor vehicles in California is definitely or probably not animportant source of the pollution that causes asthma and makes asthma attacks worse.
• Think that motor vehicles are definitely or probably not the single largest source ofgreenhouse gas emissions in California.
People in a much smaller number of subgroups were (1) relatively unsupportive of both thegreen vehicle registration fee and the feebate and (2) relatively unlikely to prefer a greenversion to a flat-rate version of the vehicle registration fee and mileage fee. (Among thesegroups, the support level for the green taxes compared to the flat-rate versions went up lessthan 10 percentage points). These subgroups were those respondents who thought that:
• The fees people pay to register their vehicle should not take into account the gasolinemileage those vehicles achieve
• The fees people pay to register their vehicle should not take into account the vehicle’sair pollution emissions.
• People like themselves would have to make no lifestyle changes to solve today’senvironmental problems.
Finally, the survey also found that respondents would be more likely to support the greenvehicle registration fee increase if the revenues were dedicated to transportation programs thatwould reduce smog and greenhouse gases. Sixty-four percent of respondents said they wouldbe more likely to support the fee if the revenues were so used.

58 Conclusions and Recommendations
Mineta Transportation Institute
POLICY IMPLICATIONS FOR TRANSPORTATION PROFESSIONALS AND POLICYMAKERS
The survey results suggest that the concept of green transportation taxes and fees is apromising avenue to explore. Support levels will of course vary depending on the specificdetails of the tax or fee proposed, but the survey results suggest several key avenues fortransportation professionals and policymakers to pursue.
1. A majority of California residents may approve at least some versions of greentransportation vehicle registration fees or feebate programs to raise newtransportation revenues.
The survey showed that healthy majorities of Californians are likely to support greenregistration fees and a feebate policy. In addition, even the generally unpopular concept of amileage fee got 50% support when it was presented with a green fee rate structure. Althoughdeveloping public support for any transportation tax or fee increase is challenging, Californiaresidents may be supportive of well-crafted green ones. In addition, they will likely be moresupportive of a green one than of a flat-rate one.
2. California should investigate whether converting existing flat-rate transportationtaxes and fees to green versions would change behavior to help support the State’sefforts to reduce greenhouse gas emissions.
Opposition to raising new revenues does not preclude the state from reaping the environmentalbenefits that could come from introducing green transportation taxes and fees. If set correctly,such taxes and fees would encourage residents to drive lower-emission and more fuel efficientvehicles, or to drive a bit less. Policy makers could restructure the existing vehicle registrationand vehicle license fees to incorporate a green rate structure. Other possibilities include tolls,vehicle sales taxes, and parking fees/permits. Further research would be needed to identify howhigh the fees would need to be in order to encourage some motorists to shift their travelbehavior.
3. To begin building public support for the concept of a mileage fee, present it with agreen rate structure.
Many transportation finance experts believe that states and the federal government willeventually have to replace existing gas and diesel taxes with some sort of mileage fee. Thisshift will likely become necessary as the vehicle fleet evolves such that a large fraction ofvehicles do not run on gas or diesel, or as a larger proportion of vehicles have very high fuelefficiencies and thus pay relatively little in fuel taxes. However, research to date has shown thatthe public lacks any enthusiasm for mileage fees. Also, some finance experts have beenconcerned that replacing the fuel tax with a mileage tax would eliminate the fuel tax’sadvantage of encouraging drivers to buy more fuel efficient vehicles. The results of this surveysuggest that one very promising way to develop more support for a mileage fee is to create agreen rate structure. Widespread public support may yet be in the distant future, but greeningproposal for a mileage fee is a promising approach to take as one step to building that support.
Mineta Transportation Institute
Conclusions and Recommendations 59
4. To increase support for green transportation taxes and fees, educate the publicabout how motor vehicle use contributes to both air pollution and global warming.
The survey tested the link between respondents’ knowledge about how motor vehicle useimpacts air pollution and global warming. Those respondents who did not know that motorvehicle use is the largest source of smog-forming air pollutants and greenhouse gas emissionsin the state were less likely to support the green tax and fee options. Policymakers who wish toincrease public support for green taxes and fees should work to educate the public about theimpact of motor vehicle use on the environmental. Such education is desirable for manyreasons, among which it will likely increase support for green transportation taxes and fees.
5. Public support for green transportation taxes and fees will rise if the revenues arededicated for programs that promote a healthy environment.
The survey asked respondents if they would be more or less likely to support the green vehicleregistration fee increase if the revenues were dedicated to transportation programs that wouldreduce smog and greenhouse gases. Sixty-four percent of respondents said they would be morelikely to support the fee if the revenues were so used.
The survey’s finding that the more people will accept higher transportation taxes and feeswhen these are dedicated for environmental programs is confirmed by several of the other pollsthat have tested the issue (see Table 1). For example, a 2007 poll by the Bay Area’sMetropolitan Transportation Commission found that 46% of respondents said they wouldsupport a 25 cent/gallon increase in the cost of gas if the money “would be used to limit orreduce global warming,” and another 23% said they would possibly support such a priceincrease. These numbers are quite high, compared to other polls asking about support for gastax increases that did not dedicate the revenues to such a purpose.
RECOMMENDATIONS FOR FUTURE RESEARCH
The next stage of this research will be to conduct a multivariate analysis to explore therelationship between socio-demographic, attitudinal, and knowledge factors and support forthe green transportation taxes and fees. Although this report’s bivariate analysis has providedinsight into the opinions of various population subgroups, it cannot parse out the joint impactof several explanatory variables. In order to effectively determine which factors are trulysignificant predictors of support for our proposed green transportation taxes and fees, it isimportant to conduct this type of in-depth analysis.
There are also several steps that should be taken to develop the best specific structure for oneor more green transportation taxes and fees. Important policy details to be determined includedeciding how vehicle performance (emissions or fuel economy) would be fairly and efficientlydetermined for the entire fleet of vehicles, as well as the range of rates to charge. To make thebest decisions on these implementation details, it will be necessary to consider a wide range ofcriteria, including the likely total revenues raised, administrative ease of collecting the tax, theequity implications for different subgroups within the population, and the likely effectiveness

60 Conclusions and Recommendations
Mineta Transportation Institute
of the tax or fee at encouraging residents to make more environmentally-friendly travelchoices. Also, such research should seek to identify the particular characteristics of greentransportation taxes and fees that make them more or less acceptable to the public at large andrelevant interest groups.

Mineta Transportation Institute
61
APPENDIX A SURVEY QUESTIONNAIRE AND TOP-LINE RESULTS
1. We are interested in your opinions about some policy issues in California. Do you thinkthat smog and air pollution is a big problem, somewhat of a problem, not much of aproblem, or no problem at all in California?
2. What about traffic congestion? Do you think that traffic congestion is a big problem,somewhat of a problem, not much of a problem, or no problem at all in California?
3. Now I’d like to know if the quality of the transportation system is a problem FOR YOUOR YOUR FAMILY? By the transportation system, I mean highways, local streets, andtransit. Is it a big problem, somewhat of a problem, not much of a problem, or no problemat all?
4. Now I’d like to know if air pollution is a health problem FOR YOU OR YOUR FAMILY.Would you say it is a big problem, somewhat of a problem, not much of a problem, or noproblem at all?
56% A big problem34% Somewhat of a problem7% Not much of a problem4% No problem at all1% Don’t know
76% A big problem18% Somewhat of a problem3% Not much of a problem3% No problem at all1% Don’t know
25% A big problem31% Somewhat of a problem21% Not much of a problem22% No problem at all1% Don’t know
23% A big problem26% Somewhat of a problem20% Not much of a problem31% No problem at all1% Don’t know

62 Appendix A Survey Questionnaire and Top-Line Results
Mineta Transportation Institute
5. Overall, do you think that state and local government does or does not have adequatefunding to maintain and improve the transportation system?
6. Generally speaking, should the fees that people pay to register their vehicles take intoaccount the gasoline mileage those vehicles achieve? That is, should the fees be lower forvehicles that get more miles per gallon, and higher for vehicles that get fewer miles pergallon?
7. As a general principle, should the fees that people pay to register their vehicles take intoaccount the amount of pollution those vehicles emit? That is, should the fees be lower forvehicles that emit less air pollution, and higher for vehicles that emit more air pollution?
8. Next, I’m going to read you a series of statements. For each statement, please tell me if youthink it is DEFNITELY true, probably true, probably false, or DEFINITELY false.[Accept but do not offer “don’t know.”]
a. State and federal gas taxes provide all the money that is spent to build and maintainhighways and roads in California.
b. State and federal gas tax rates have not been raised in more than 10 years.
c. Exhaust from cars, vans, pickups, and SUVs is an important source of the pollutionthat causes asthma and makes asthma attacks worse.
32% Does49% Does not19% Don’t know
57% Yes, fees should take fuel efficiency into account34% No, fees should not take fuel efficiency into account9% Don’t know
68% Yes, fees should take pollution into account27% No, fees should not take pollution into account6% Don’t know
6% Definitely true34% Probably true7% Probably false4% Definitely false [correct answer]1% Don’t know
5% Definitely true [correct answer]34% Probably true7% Probably false4% Definitely false1% Don’t know
32% Definitely true [correct answer]41% Probably true11% Probably false5% Definitely false11% Don’t know

Mineta Transportation Institute
Appendix A Survey Questionnaire and Top-Line Results 63
d. In California, motor vehicles, including cars, trucks and trains, are the single largestsource of air pollutants that cause smog.
e. In California, motor vehicles, including cars, trucks, and trains, are the single largestsource of so-called “greenhouse gases” that many scientists say are causing globalwarming.
f. All NEW cars, vans, pickups, and SUVs pollute the same amount FOR EACH MILEDRIVEN.
Now I have some questions about your daily travel.
9. In the PAST SEVEN DAYS, have you taken any form of public transit, like a bus, lightrail, subway, or commuter train?
10. In the PAST SEVEN DAYS, have you walked or biked FROM YOUR HOME to get towork, shopping, eating out, or other errands?
26% Definitely true [correct answer]38% Probably true20% Probably false10% Definitely false6% Don’t know
19% Definitely true [correct answer]36% Probably true21% Probably false12% Definitely false12% Don’t know
5% Definitely true 10% Probably true28% Probably false46% Definitely false [correct answer]11% Don’t know
13% Yes87% No<1% Don’t know
34% Yes66% No<1% Don’t know
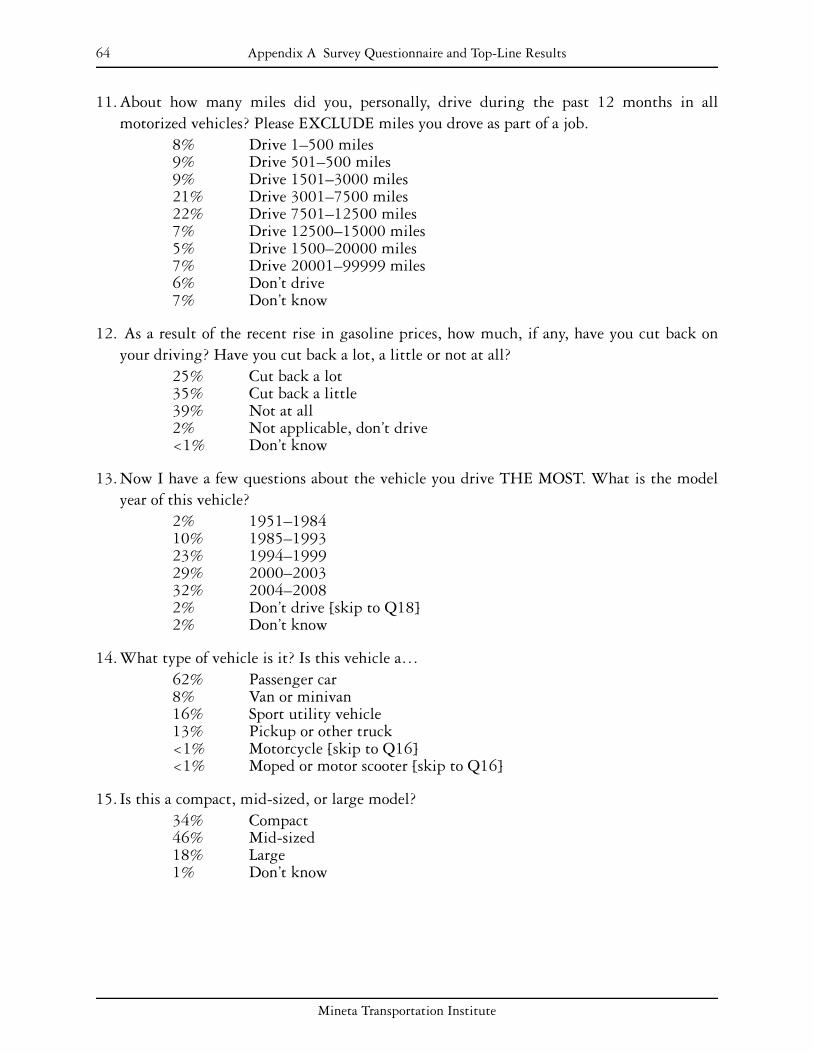
64 Appendix A Survey Questionnaire and Top-Line Results
Mineta Transportation Institute
11. About how many miles did you, personally, drive during the past 12 months in allmotorized vehicles? Please EXCLUDE miles you drove as part of a job.
12. As a result of the recent rise in gasoline prices, how much, if any, have you cut back onyour driving? Have you cut back a lot, a little or not at all?
13. Now I have a few questions about the vehicle you drive THE MOST. What is the modelyear of this vehicle?
14. What type of vehicle is it? Is this vehicle a…
15. Is this a compact, mid-sized, or large model?
8% Drive 1–500 miles9% Drive 501–500 miles9% Drive 1501–3000 miles21% Drive 3001–7500 miles22% Drive 7501–12500 miles7% Drive 12500–15000 miles5% Drive 1500–20000 miles7% Drive 20001–99999 miles6% Don’t drive7% Don’t know
25% Cut back a lot35% Cut back a little39% Not at all2% Not applicable, don’t drive<1% Don’t know
2% 1951–198410% 1985–199323% 1994–199929% 2000–200332% 2004–20082% Don’t drive [skip to Q18]2% Don’t know
62% Passenger car8% Van or minivan16% Sport utility vehicle13% Pickup or other truck<1% Motorcycle [skip to Q16]<1% Moped or motor scooter [skip to Q16]
34% Compact46% Mid-sized18% Large1% Don’t know

Mineta Transportation Institute
Appendix A Survey Questionnaire and Top-Line Results 65
16. What is the approximate fuel efficiency of this vehicle? In other words, how many milesper gallon does the vehicle get?
17. When you purchased or leased this vehicle, how much of a factor was gas mileage? Was ita very important factor, somewhat important, not very important, or not important at all?
Now I have some questions about your opinions on some policy issues.
18. Do you agree or disagree with the following statement? We must protect theenvironment, even if it means paying higher prices for gasoline and electricity.
19. To solve today’s environmental problems do you think people like you will have to makemajor lifestyle changes, minor lifestyle changes or no real lifestyle changes?
20. Do you think the United States should meet its growing energy needs by emphasizingmore DOMESTIC production of gas, oil, and coal supplies, OR should the U.S. insteademphasize developing renewable energy supplies like wind, hydro and solar power?
4% <13 mpg12% 13–17 mpg28% 18–22 mpg20% 23–27 mpg23% 28–75 mpg14% Don’t know
29% Very important factor37% Somewhat important factor13% Not very important factor20% Not important at all2% Don’t know
63% Agree33% Disagree5% Don’t know
34% Major change54% Minor change11% No change1% Don’t know
9% Emphasize gas, oil, and coal supplies71% Emphasize wind, hydro, and solar power14% Both1% Neither2% Other4% Don’t know

66 Appendix A Survey Questionnaire and Top-Line Results
Mineta Transportation Institute
21. Would you rather pay higher taxes to support a larger state government that provides moreservices, OR would you rather pay lower taxes and have a smaller state government thatprovides fewer services?
There are many different ways to raise funds for maintaining and improving highways, masstransit, and local streets. I'd like to ask your thoughts about some of these. [rotate questions22-24]
22. One idea (another idea) to raise funds for transportation is to increase the state's vehicleREGISTRATION fee from its current rate of $31 per vehicle per year to $62 per year pervehicle. Would you strongly support, somewhat support, somewhat oppose, or stronglyoppose that idea?
23. An alternative would be to increase the vehicle registration fee to an AVERAGE of $62 peryear, but vary the fee according to how much the vehicle pollutes. Vehicles that pollutemore would pay higher fees, and those that pollute less would pay lower fees. Would youstrongly support, somewhat support, somewhat oppose, or strongly oppose that idea?
24. What if the additional money raised from the variable registration fee just described werededicated for transportation projects that would help reduce smog and greenhousegases—projects like converting transit and school buses to cleaner fuels, or building newbiking and walking paths? Would this make you more or less likely to support raisingregistration fees based on how much a vehicle pollutes?
38% Higher taxes and more state services44% Lower taxes and fewer state services3% Both7% Neither8% Don’t know
18% Strongly support23% Somewhat support16% Somewhat oppose39% Strongly oppose5% Don’t know
37% Strongly support27% Somewhat support9% Somewhat oppose24% Strongly oppose4% Don’t know
64% More likely20% Less likely10% No difference5% Don’t know

Mineta Transportation Institute
Appendix A Survey Questionnaire and Top-Line Results 67
25. One idea (another idea) is create a new tax and tax REBATE system on all new vehiclesbase on how much they pollute. People who buy a new vehicle that doesn't pollute muchwould receive a rebate of up to $1,000. People who buy a new vehicle that pollutes a lot,such as a very large SUV, would pay a tax up to $2,000. People who buy a vehicle thatpollutes about the average would not pay or receive anything. Would you stronglysupport, somewhat support, somewhat oppose, or strongly oppose that idea?
26. One idea (another idea) is to eliminate the eighteen-cents-per-gallon state gas taxaltogether and replace it with a fee based on the number of miles you drive. Each driverwould pay a fee of one cent per mile for every mile driven within the state. For example,every one hundred miles driven would pay a fee of one dollar. Vehicles would be equippedwith an electronic means to keep track of miles driven and the fee would be paid whendrivers buy gas. Would you strongly support, somewhat support, somewhat oppose, orstrongly oppose that idea?
27. A variation on the mileage fee just described is to have the fee vary depending upon howmuch the vehicle pollutes. On average, vehicles would pay one cent per mile, but vehiclesthat pollute the least would pay less and vehicles that pollute the most would pay more permile. Would you strongly support, somewhat support, somewhat oppose, or stronglyoppose that idea?
D1. What is your gender?
38% Strongly support27% Somewhat support10% Somewhat oppose20% Strongly oppose1% Don’t know
12% Strongly support16% Somewhat support12% Somewhat oppose52% Strongly oppose7% Don’t know
25% Strongly support25% Somewhat support11% Somewhat oppose35% Strongly oppose5% Don’t know
55% Female45% Male

68 Appendix A Survey Questionnaire and Top-Line Results
Mineta Transportation Institute
D2. What race or ethnicity do you consider yourself?
D3. What is your age?
D4. Do you own or rent your current residence?
D5. What is your education level?
D6. Are you employed?
D7. Is that full-time or part-time?
D8. How do you usually commute to work?
68% White, Caucasian or European18% Hispanic, Latino, Mexican-American6% Asian, Pacific Islander, East Indian6% Black, African American2% Other, including Native American and multiple race
19% 18 to 24 years38% 25 to 54 years43% 55 years +
71% Own29% Rent
5% Less than high school degree16% High school graduate27% Some college26% College graduate (four year)4% Some graduate school22% Graduate school
62% Yes16% No [skip to D8]22% Retired [skip to D8]
81% Full-time19% Part-time
76% Drive yourself5% Transit5% Carpool2% Bicycle3% Walk10% Work at home, do not commute

Mineta Transportation Institute
Appendix A Survey Questionnaire and Top-Line Results 69
D9. As you know, many people are so busy these days they can’t find time to register to vote,or they move around so often they don’t get a chance to re-register. Are you now registered tovote in your precinct, or haven’t you been able to register for one reason or another?
D10. In what party are you registered to vote? (If respondent says “independent” ask: Do youmean you’re registered in the American Independent Party or do you mean you’re registeredbut you declined to state a party?)
D11. How often would you say you vote: all of the time, most of the time, occasionally,seldom, or never?
D12. Finally, and of course confidentially, please stop me when I mention a range thatdescribes your household income.
83% Yes, registered14% No, not registered [skip to D12]
3% I’m not a U.S. citizen/I’m registered to vote in a country outside the U.S. [skip to D12]
1% Don’t know [skip to D12]
47% Democrat33% Republican 13% Independent (i.e. decline to state)1% Libertarian<1% Peace & Freedom1% Green Party1% Other3% Don’t know
73% All of the time20% Most of the time5% Occasionally1% Seldom1% Never<1% Don’t know
11% Less than $20,00014% More than $20,000 but less than $35,00012% More than $35,000 but less than $50,00018% More than $50,000 but less than $75,00016% More than $75,000 but less than $100,00015% More than $100,000 but less than $150,00014% More than $150,000

70 Appendix A Survey Questionnaire and Top-Line Results
Mineta Transportation Institute
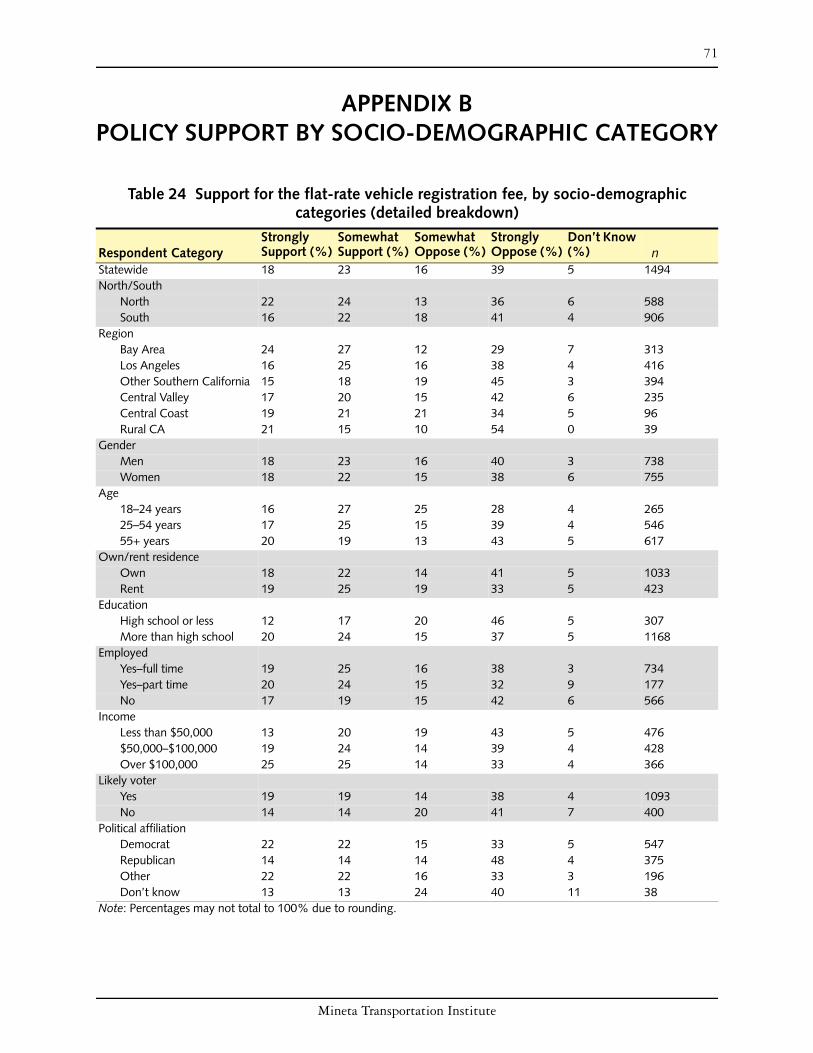
Mineta Transportation Institute
71
APPENDIX B POLICY SUPPORT BY SOCIO-DEMOGRAPHIC CATEGORY
Table 24 Support for the flat-rate vehicle registration fee, by socio-demographic categories (detailed breakdown)
Respondent CategoryStrongly Support (%)
Somewhat Support (%)
Somewhat Oppose (%)
Strongly Oppose (%)
Don’t Know (%) n
Statewide 18 23 16 39 5 1494North/South
North 22 24 13 36 6 588 South 16 22 18 41 4 906
Region Bay Area 24 27 12 29 7 313 Los Angeles 16 25 16 38 4 416 Other Southern California 15 18 19 45 3 394 Central Valley 17 20 15 42 6 235 Central Coast 19 21 21 34 5 96 Rural CA 21 15 10 54 0 39
Gender Men 18 23 16 40 3 738 Women 18 22 15 38 6 755
Age 18–24 years 16 27 25 28 4 265 25–54 years 17 25 15 39 4 546 55+ years 20 19 13 43 5 617
Own/rent residence Own 18 22 14 41 5 1033 Rent 19 25 19 33 5 423
Education High school or less 12 17 20 46 5 307 More than high school 20 24 15 37 5 1168
Employed Yes–full time 19 25 16 38 3 734 Yes–part time 20 24 15 32 9 177 No 17 19 15 42 6 566
Income Less than $50,000 13 20 19 43 5 476
$50,000–$100,000 19 24 14 39 4 428 Over $100,000 25 25 14 33 4 366
Likely voter Yes 19 19 14 38 4 1093 No 14 14 20 41 7 400
Political affiliation Democrat 22 22 15 33 5 547 Republican 14 14 14 48 4 375 Other 22 22 16 33 3 196 Don’t know 13 13 24 40 11 38
Note: Percentages may not total to 100% due to rounding.
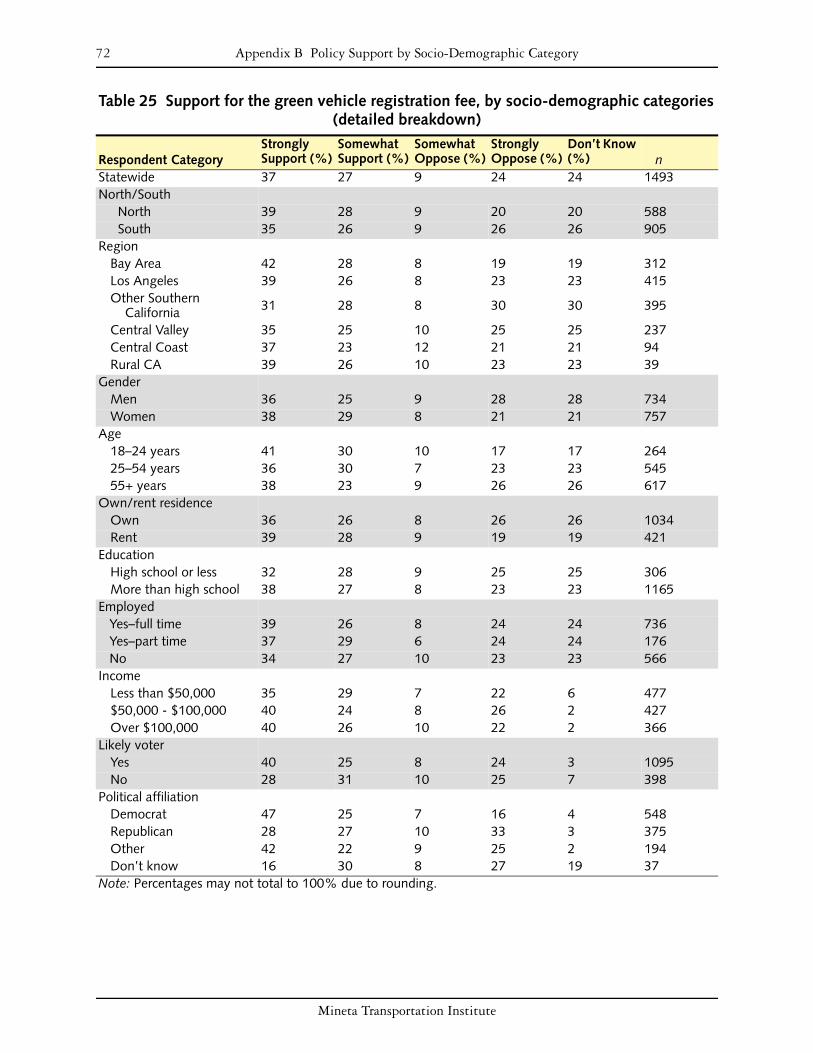
72 Appendix B Policy Support by Socio-Demographic Category
Mineta Transportation Institute
Table 25 Support for the green vehicle registration fee, by socio-demographic categories (detailed breakdown)
Respondent CategoryStrongly Support (%)
Somewhat Support (%)
Somewhat Oppose (%)
Strongly Oppose (%)
Don’t Know (%) n
Statewide 37 27 9 24 24 1493North/South
North 39 28 9 20 20 588South 35 26 9 26 26 905
RegionBay Area 42 28 8 19 19 312Los Angeles 39 26 8 23 23 415Other Southern
California 31 28 8 30 30 395
Central Valley 35 25 10 25 25 237Central Coast 37 23 12 21 21 94Rural CA 39 26 10 23 23 39
GenderMen 36 25 9 28 28 734Women 38 29 8 21 21 757
Age18–24 years 41 30 10 17 17 26425–54 years 36 30 7 23 23 54555+ years 38 23 9 26 26 617
Own/rent residenceOwn 36 26 8 26 26 1034Rent 39 28 9 19 19 421
EducationHigh school or less 32 28 9 25 25 306More than high school 38 27 8 23 23 1165
Employed Yes–full time 39 26 8 24 24 736 Yes–part time 37 29 6 24 24 176 No 34 27 10 23 23 566Income
Less than $50,000 35 29 7 22 6 477$50,000 - $100,000 40 24 8 26 2 427Over $100,000 40 26 10 22 2 366
Likely voterYes 40 25 8 24 3 1095No 28 31 10 25 7 398
Political affiliationDemocrat 47 25 7 16 4 548Republican 28 27 10 33 3 375Other 42 22 9 25 2 194Don’t know 16 30 8 27 19 37
Note: Percentages may not total to 100% due to rounding.

Mineta Transportation Institute
Appendix B Policy Support by Socio-Demographic Category 73
Table 26 Support for basic mileage fee, by socio-demographic categories (detailed breakdown
Respondent CategoryStrongly Support (%)
Somewhat Support (%)
Somewhat Oppose (%)
Strongly Oppose (%)
Don’t Know (%) n
Statewide 12 16 12 52 7 1496North/South
North 11 17 12 53 7 589South 14 15 13 52 7 908
RegionBay Area 11 17 12 52 8 314Los Angeles 14 17 12 49 8 417Other Southern
California 13 13 14 55 6 396
Central Valley 10 19 12 52 7 237Central Coast 13 10 11 55 12 93Rural CA 10 113 8 68 3 40
GenderMen 12 15 13 57 4 736Women 13 17 12 48 10 759
Age18–24 years 11 25 19 40 5 26425–54 years 13 13 15 55 5 54655+ years 12 14 9 55 10 620
Own/rent residenceOwn 11 14 11 56 7 1035Rent 15 19 14 43 9 423
EducationHigh school or less 21 18 13 41 8 308More than high school 10 15 12 55 7 1169
EmployedYes–full time 11 15 14 56 5 737Yes–part time 10 17 13 49 11 175No 15 17 11 49 9 567
IncomeLess than $50,000 17 17 12 45 9 477$50,000–$100,000 8 16 13 57 6 427Over $100,000 12 14 12 57 5 367
Likely voterYes 12 15 12 55 7 1095No 14 19 14 45 8 402
Political affiliationDemocrat 15 17 12 49 8 546Republican 9 13 9 63 6 376Other 9 14 18 55 5 194Don’t know 19 5 5 46 24 37
Note: Percentages may not total to 100% due to rounding.

74 Appendix B Policy Support by Socio-Demographic Category
Mineta Transportation Institute
Table 27 Support for the green mileage fee, by socio-demographic categories (detailed breakdown)
Respondent CategoryStrongly Support (%)
Somewhat Support (%)
Somewhat Oppose (%)
Strongly Oppose (%)
Don’t Know (%) n
Statewide 25 25 11 35 5 1491North/South
North 24 26 11 35 4 588South 26 24 11 35 5 903
RegionBay Area 28 25 11 32 4 313Los Angeles 28 23 10 35 5 417Other Southern
California 23 27 11 35 4 393
Central Valley 21 26 10 37 6 235Central Coast 28 19 17 35 1 94Rural CA 15 30 13 40 3 40
GenderMen 23 22 11 41 4 735Women 28 28 11 28 5 756
Age18–24 years 25 31 16 24 3 26425–54 years 26 24 10 36 4 54655+ years 26 24 9 36 4 616
Own/rent residenceOwn 25 24 10 37 4 1033Rent 27 26 12 29 6 423
EducationHigh school or less 30 22 12 30 4 304More than high school 24 26 11 36 6 1167
EmployedYes–full time 26 24 11 37 6 736Yes–part time 22 28 13 30 4 176No 26 26 10 33 3 565
IncomeLess than $50,000 28 26 11 30 5 472$50,000–$100,000 25 27 9 37 3 427Over $100,000 24 23 11 39 3 367
Likely voterYes 26 24 10 36 4 1090No 25 27 12 31 6 400
Political affiliationDemocrat 33 24 11 27 4 544Republican 16 27 10 44 4 375Other 25 19 9 44 3 194Don’t know 19 17 17 28 19 36
Note: Percentages may not total to 100% due to rounding.

Mineta Transportation Institute
Appendix B Policy Support by Socio-Demographic Category 75
Table 28 Support for the feebate, by socio-demographic categories (detailed breakdown)
Respondent CategoryStrongly Support (%)
Somewhat Support (%)
Somewhat Oppose (%)
Strongly Oppose (%)
Don’t Know (%) n
Statewide 38 27 10 20 4 1489North/South
North 41 28 10 18 4 587South 37 27 10 21 5 902
RegionBay Area 48 24 9 16 2 311Los Angeles 41 24 10 19 6 414Other Southern
California 31 30 11 24 4 392
Central Valley 33 33 9 19 7 237Central Coast 37 25 12 22 5 96Rural CA 39 23 13 23 3 39
GenderMen 37 27 11 22 3 734Women 39 28 9 18 5 754
Age18–24 years 34 31 14 16 4 26525–54 years 39 28 11 19 3 54555+ years 39 25 7 23 6 617
Own/rent residenceOwn 40 27 9 22 3 1031Rent 36 29 12 16 7 423
EducationHigh school or less 30 25 13 23 9 306More than high school 41 28 9 19 3 1163
EmployedYes–full time 40 28 11 20 2 735Yes–part time 44 23 10 19 3 176No 35 28 9 20 7 562
IncomeLess than $50,000 37 28 11 18 7 474$50,000–$100,000 42 29 8 20 2 427Over $100,000 41 27 8 21 3 368
Likely voterYes 40 27 9 20 4 1089No 33 28 13 20 7 400
Political affiliationDemocrat 47 28 8 13 4 543Republican 31 27 10 29 3 373Other 39 22 12 23 4 194Don’t know 28 39 6 17 11 36
Note: Percentages may not total to 100% due to rounding.

76 Appendix B Policy Support by Socio-Demographic Category
Mineta Transportation Institute

Mineta Transportation Institute
77
APPENDIX C POLICY SUPPORT BY TRAVEL BEHAVIOR
Table 29 Support for the flat-rate vehicle registration fee, by travel behavior (detailed breakdown)
Travel Behavior CategoriesStrongly Support (%)
Somewhat Support (%)
Somewhat Oppose (%)
Strongly Oppose (%)
Don’t Know (%) n
All respondents 18 23 16 39 5 1494“How do you usually commute to work?” (Question D8)
Drive yourself 18 24 16 39 3 688Transit, carpool, bike,
walk 22 29 15 27 8 130
NA–work at home 21 26 12 37 3 89“In the past seven days, have you taken any form of public transit, like a bus, light rail, subway, or commuter train?” (Question 9)
Yes 27 25 14 28 7 193No 17 22 16 41 4 1296Don’t know 0 0 0 67 33 3
“In the past seven days, have you walked or biked from your home to get to work, shopping, eating out, or other errands?” (Question 10)
Yes 22 22 16 34 7 505No 16 23 16 42 4 984Don’t know 0 100 0 0 0 1
“About how many miles did you, personally, drive during the past 12 months in all motorized vehicles? Please exclude miles you drove as part of a job.” (Question 11)
1–3,000 15 23 15 41 6 3863,001–7,500 20 20 18 38 3 3137,501–12,500 17 27 14 38 3 32112,501+ 21 22 13 40 4 276NA–don’t drive 20 19 18 30 14 96Don’t know 14 18 20 43 5 100
“As a result of the recent rise in gasoline prices, how much, if any, have you cut back on your driving? Have you cut back a lot, a little or not at all?” (Question 12)
Cut back a lot 13 19 13 50 5 345Cut back a little 16 28 19 34 4 484Not at all 22 22 15 38 3 541NA–don’t drive 33 4 8 46 8 24Don’t know 33 0 0 33 33 3
Note: Percentages may not total to 100% due to rounding.

78 Appendix C Policy Support by Travel Behavior
Mineta Transportation Institute
Table 30 Support for the green vehicle registration fee, by travel behavior (detailed breakdown)
Travel Behavior CategoriesStrongly
Support (%)Somewhat
Support (%)Somewhat
Oppose (%)Strongly
Oppose (%)Don’t Know(%) n
All respondents 37 27 9 24 4 1493“How do you usually commute to work?” (Question D8)
Drive yourself 37 27 8 25 3 689Transit, carpool, bike,
walk 49 24 5 17 5 130
NA–work at home 36 27 11 25 0 88“In the past seven days, have you taken any form of public transit, like a bus, light rail, subway, or commuter train?” (Question 9)
Yes 47 28 6 16 4 193No 35 27 9 25 4 1294Don’t know 33 0 0 67 0 3
“In the past seven days, have you walked or biked from your home to get to work, shopping, eating out, or other errands?” (Question 10) Yes 43 27 8 18 5 504 No 34 27 9 27 4 987 Don’t know 100 0 0 0 0 1“About how many miles did you, personally, drive during the past 12 months in all motorized vehicles? Please exclude miles you drove as part of a job.” (Question 11) 1–3,000 39 26 9 21 4 386
3,001–7,500 39 24 8 26 3 312 7,501–12,500 36 29 8 24 3 321 12,501+ 36 24 6 31 3 274 NA–don’t drive 33 28 14 13 13 94 Don’t know 32 32 8 23 6 101“As a result of the recent rise in gasoline prices, how much, if any, have you cut back on your driving? Have you cut back a lot, a little or not at all?” (Question 12) Cut back a lot 35 27 8 25 5 346 Cut back a little 36 32 8 20 4 486 Not at all 38 22 8 30 3 538 NA–don’t drive 52 24 4 16 4 25 Don’t know 100 0 0 0 0 3Note: Percentages may not total to 100% due to rounding.

Mineta Transportation Institute
Appendix C Policy Support by Travel Behavior 79
Table 31 Support for the flat-rate mileage fee, by travel behavior (detailed breakdown)
Travel Behavior CategoriesStrongly Support (%)
Somewhat Support (%)
Somewhat Oppose (%)
Strongly Oppose (%)
Don’t Know(%) n
All respondents 12 16 12 52 7 1496“How do you usually commute to work?” (Question D8)
Drive yourself 9 15 14 57 6 690Transit, carpool, bike,
walk 18 18 15 44 6 131
NA–work at home 16 16 11 50 8 90“In the past seven days, have you taken any form of public transit, like a bus, light rail, subway, or commuter train?” (Question 9)
Yes 17 17 12 47 8 194No 12 16 12 53 7 1298Don’t know 33 0 0 33 33 3
“In the past seven days, have you walked or biked from your home to get to work, shopping, eating out, or other errands?” (Question 10)
Yes 14 17 15 46 8 503No 12 15 11 55 7 987Don’t know 100 0 0 0 0 1
“About how many miles did you, personally, drive during the past 12 months in all motorized vehicles? Please exclude miles you drove as part of a job.” (Question 11)
1–3,000 13 15 14 51 8 3843,001–7,500 12 15 11 57 5 3127,501–12,500 12 18 11 53 7 32212,501+ 10 12 12 61 6 275NA–don’t drive 20 21 16 28 16 96Don’t know 14 18 14 44 11 102
“As a result of the recent rise in gasoline prices, how much, if any, have you cut back on your driving? Have you cut back a lot, a little or not at all?” (Question 12)
Cut back a lot 15 18 7 53 7 346Cut back a little 12 14 18 51 6 484Not at all 10 15 11 58 7 542NA–don’t drive 21 13 8 42 17 24Don’t know 0 67 0 0 33 3
Note: Percentages may not total to 100% due to rounding.

80 Appendix C Policy Support by Travel Behavior
Mineta Transportation Institute
Table 32 Support for the green mileage fee, by travel behavior (detailed breakdown)
Travel Behavior CategoriesStrongly
Support (%)Somewhat
Support (%)Somewhat
Oppose (%)Strongly
Oppose (%)Don’t Know(%) n
All respondents 25 25 11 35 5 1491“How do you usually commute to work?” (Question D8)
Drive yourself 24 24 12 37 3 688Transit, carpool, bike,
walk 32 23 11 28 7 132
NA–work at home 21 29 10 37 3 90“In the past seven days, have you taken any form of public transit, like a bus, light rail, subway, or commuter train?” (Question 9)
Yes 31 25 10 27 8 192No 25 25 11 36 4 1291Don’t know 0 0 0 67 33 3
“In the past seven days, have you walked or biked from your home to get to work, shopping, eating out, or other errands?” (Question 10)
Yes 30 25 11 29 6 502No 23 25 11 38 4 985Don’t know 100 0 0 0 0 1
“About how many miles did you, personally, drive during the past 12 months in all motorized vehicles? Please exclude miles you drove as part of a job.” (Question 11)
1–3,000 26 26 12 31 5 3833,001–7,500 29 20 8 40 3 3117,501–12,500 22 26 10 39 3 32212,501+ 22 25 10 41 3 274NA–don’t drive 32 27 14 17 10 96Don’t know 26 28 16 23 9 102
“As a result of the recent rise in gasoline prices, how much, if any, have you cut back on your driving? Have you cut back a lot, a little or not at all?” (Question 12)
Cut back a lot 28 27 10 33 2 344Cut back a little 25 26 14 30 6 483Not at all 22 23 8 45 3 538NA–don’t drive 40 12 12 20 16 25Don’t know 67 0 0 0 33 3
Note: Percentages may not total to 100% due to rounding.

Mineta Transportation Institute
Appendix C Policy Support by Travel Behavior 81
Table 33 Support for the feebate, by travel behavior (detailed breakdown)
Travel Behavior CategoriesStrongly Support (%)
Somewhat Support (%)
Somewhat Oppose (%)
Strongly Oppose (%)
Don’t Know (%) n
All respondents 38 27 10 20 4 1489“How do you usually commute to work?” (Question D8)
Drive yourself 40 27 11 20 2 687Transit, carpool, bike,
walk 45 24 12 15 5 131
NA–work at home 40 30 5 24 1 89“In the past seven days, have you taken any form of public transit, like a bus, light rail, subway, or commuter train?” (Question 9)
Yes 47 24 10 14 6 195No 37 28 10 21 4 1290Don’t know 0 33 0 67 0 3
“In the past seven days, have you walked or biked from your home to get to work, shopping, eating out, or other errands?” (Question 10)
Yes 42 27 10 15 6 505No 36 27 10 23 4 981Don’t know 100 0 0 0 0 1
“About how many miles did you, personally, drive during the past 12 months in all motorized vehicles? Please exclude miles you drove as part of a job.” (Question 11)
1–3,000 39 27 12 18 4 3843,001–7,500 42 23 10 22 4 3117,501–12,500 39 29 9 21 2 32112,501+ 39 30 7 22 3 275NA–don’t drive 31 22 14 15 18 94Don’t know 31 33 9 19 8 98
“As a result of the recent rise in gasoline prices, how much, if any, have you cut back on your driving? Have you cut back a lot, a little or not at all?” (Question 12)
Cut back a lot 39 27 8 22 5 343Cut back a little 39 32 11 15 3 485Not at all 38 25 9 25 3 536NA–don’t drive 50 17 8 21 4 24Don’t know 100 0 0 0 0 3
Note: Percentages may not total to 100% due to rounding.

82 Appendix C Policy Support by Travel Behavior
Mineta Transportation Institute

Mineta Transportation Institute
83
APPENDIX D POLICY SUPPORT BY TYPE OF VEHICLE RESPONDENT
DRIVES MOST
Table 34 Support for the flat-rate vehicle registration fee, by type of vehicle respondent drives most (detailed breakdown)
Vehicle Type Categories
Strongly Support (%)
Somewhat Support(%)
Somewhat Oppose(%)
Strongly Oppose(%)
Don’t Know(%) n
All respondents 18 23 16 39 5 1494“What is the model year of this vehicle?” (Question 13)
2004–2005 19 24 16 37 4 4492000–2003 16 25 13 42 4 4021951–1999 18 21 17 39 4 500Don’t drive 26 4 17 48 4 23Don’t know 15 15 19 52 0 27
“What type of vehicle is it? Is this vehicle a...”Passenger car 9 23 16 37 5 837Van or Minivan 12 25 14 41 8 111Sport utility vehicle 21 23 16 37 2 219Pickup truck/truck 13 20 14 51 2 170Other 0 36 9 46 9 11
“What is the approximate fuel efficiency of this vehicle? In other words, how many miles per gallon does it get?”
28–75 MPG 24 24 13 35 5 30723–27 MPG 14 27 18 37 4 26318–22 MPG 18 22 15 41 4 38213–17 MPG 15 22 15 45 4 166<13 MPG 15 27 17 42 0 48Don’t know 9 32 14 27 18 22
"When you purchased or leased this vehicle, how much of a factor was gas mileage? Was it a very important factor, somewhat important, not very important, or not important at all?"
Very important 20 22 13 41 5 396 Somewhat important 18 27 17 34 4 492 Not very important 18 26 17 36 4 172 Not important at all 15 16 15 51 32 65 Don't know 9 32 14 27 18 22
Note: Percentages may not total to 100% due to rounding.

84 Appendix D Policy Support by Type of Vehicle Respondent Drives Most
Mineta Transportation Institute
Table 35 Support for the green vehicle registration fee, by type of vehicle respondent drives most (detailed breakdown)
Vehicle Type Categories
Strongly Support
(%)
Somewhat Support
(%)
Somewhat Oppose
(%)
Strongly Oppose
(%)Don’t Know(%) n
All respondents 37 27 9 244 4 1493"What is the model year of this vehicle?” (Question 13)
2004–2008 36 28 10 24 2 4502000–2003 36 25 8 27 5 4001951–1999 39 27 6 24 5 497Don’t drive 35 26 17 17 4 23Don’t know 30 22 4 41 4 27
"What type of vehicle is it? Is this vehicle a ..."Passenger car 41 26 7 22 4 835Van or minivan 35 32 11 18 5 111Sport utility vehicle 33 31 8 27 1 218Pickup truck/truck 26 22 12 37 3 170Other 0 27 9 64 0 11
"What is the approximate fuel efficiency of this vehicle? In other words, how many miles per gallon does the vehicle get?"
28–75 MPG 49 26 5 17 3 30423–27 MPG 39 24 9 24 4 26218–22 MPG 39 23 8 27 2 38213–17 MPG 20 28 10 37 5 167<13 MPG 15 31 17 31 6 48Don't know 32 35 8 20 6 185
"When you purchased or leased this vehicle, how much of a factor was gas mileage? Was it a very important factor, somewhat important, not very important, or not important at all?"
Very important 51 24 6 17 4 395Somewhat important 37 30 9 21 3 490Not very important 26 31 8 29 6 172Not important at all 25 22 9 40 3 265Don't know 30 30 4 22 13 23
Note: Percentages may not total to 100% due to rounding.

Mineta Transportation Institute
Appendix D Policy Support by Type of Vehicle Respondent Drives Most 85
Table 36 Support for the flat-rate mileage fee, by type of vehicle respondent drives most (detailed breakdown)
Vehicle Type CategoriesStrongly Support (%)
Somewhat Support (%)
Somewhat Oppose (%)
Strongly Oppose (%)
Don’t Know(%) n
All respondents 12 16 12 52 7 1496"What is the model year of this vehicle?” (Question 13)
2004–008 11 16 14 54 5 450 2000–2003 11 15 11 55 9 4011951–1999 12 16 11 55 6 499Don't drive 35 13 13 26 13 23Don't know 15 15 11 52 7 27
"What type of vehicle is it? Is this vehicle a ..."Passenger car 11 15 12 54 7 839Van or minivan 11 22 10 49 8 112Sport utility vehicle 13 13 16 54 4 220Pickup truck/truck 10 16 8 59 7 169Other 9 0 0 91 0 11
"What is the approximate fuel efficiency of this vehicle? In other words, how many miles per gallon does the vehicle get?"
28–75 MPG 9 14 16 55 6 30523–27 MPG 13 13 12 57 6 26318–22 MPG 9 17 9 59 6 38213–17 MPG 11 13 10 60 7 167<13 MPG 11 17 9 57 6 47Don’t know 18 22 14 35 11 185
"When you purchased or leased this vehicle, how much of a factor was gas mileage? Was it a very important factor, somewhat important, not very important, or not important at all?"
Very important 13 15 12 53 7 396Somewhat important 9 16 12 56 7 493Not very important 12 17 12 53 6 171Not important at all 13 14 11 56 6 265Don't know 14 14 9 55 9 22
Note: Percentages may not total to 100% due to rounding.

86 Appendix D Policy Support by Type of Vehicle Respondent Drives Most
Mineta Transportation Institute
Table 37 Support for the green mileage fee, by type of vehicle respondent drives most (detailed breakdown)
Vehicle Type Categories
Strongly Support (%)
Somewhat Support(%)
Somewhat Oppose(%)
Strongly Oppose(%)
Don’t Know(%) n
All respondents 25 25 11 35 5 1491"What is the model year of this vehicle?” (Question 13)
2004–2008 39 31 10 19 2 449 2000–2003 38 29 8 22 4 4001951–1999 40 26 10 20 4 495Don't drive 39 4 22 30 4 23Don't know 41 11 7 30 11 27
"What type of vehicle is it? Is this vehicle a ..." Passenger car 41 29 8 19 3 833 Van or minivan 38 30 15 12 5 111 Sport utility vehicle 35 29 9 24 3 219 Pickup truck/truck 33 24 13 26 5 170 Other 27 18 9 36 9 11
"What is the approximate fuel efficiency of this vehicle? In other words, how many miles per gallon does the vehicle get?"
28–5 MPG 45 29 5 17 3 30623–27 MPG 42 25 10 21 2 26118–22 MPG 38 28 12 21 2 38413–17 MPG 35 29 10 23 4 164 <13 MPG 18 22 16 37 6 49 Don't know 34 33 10 15 8 182
"When you purchased or leased this vehicle, how much of a factor was gas mileage? Was it a very important factor, somewhat important, not very important, or not important at all?"
Very important 48 24 9 15 4 395 Somewhat important 37 34 8 19 2 493 Not very important 38 27 14 18 4 172 Not important at all 28 25 10 31 5 264 Don't know 32 27 9 27 5 22
Note: Percentages may not total to 100% due to rounding.

Mineta Transportation Institute
Appendix D Policy Support by Type of Vehicle Respondent Drives Most 87
Table 38 Support for the feebate, by type of vehicle respondent drives most (detailed breakdown)
Vehicle Type CategoriesStrongly Support (%)
Somewhat Support (%)
Somewhat Oppose (%)
Strongly Oppose (%)
Don’t Know(%) n
All respondents 38 27 10 20 4 1489“What is the model year of this vehicle?” (Question 13)
2004–2008 39 31 10 19 2 4492000 –2003 38 29 8 22 4 4001994–1999 38 28 12 18 4 3251951–1993 42 20 7 25 6 170Don’t drive 39 4 22 30 4 23Don’t know 41 11 7 30 11 27
“What type of vehicle is it? Is this vehicle a ...”Passenger car 41 29 8 19 3 833Van or minivan 38 30 15 12 5 111Sport utility vehicle 35 29 9 24 3 219Pickup truck/truck 33 24 13 26 5 170Other 27 18 9 36 9 11
“What is the approximate fuel efficiency of this vehicle? In other words, how many miles per gallon does the vehicle get?” 28–75 MPG 45 29 5 17 3 306 23–27 MPG 42 25 10 21 2 261 18–22 MPG 38 28 12 21 2 384 13–17 MPG 35 29 10 23 4 164 <13 MPG 18 22 16 37 6 49 Don’t know 34 33 10 15 8 182“When you purchased or leased this vehicle, how much of a factor was gas mileage? Was it a very important factor, somewhat important, not very important, or not important at all?”
Very important 48 24 9 15 4 395Somewhat important 37 34 8 19 2 493Not very important 38 27 14 18 4 172Not important at all 28 25 10 31 5 264Don’t know 32 27 9 27 5 22
Note: Percentages may not total to 100% due to rounding.

88 Appendix D Policy Support by Type of Vehicle Respondent Drives Most
Mineta Transportation Institute

Mineta Transportation Institute
89
APPENDIX E POLICY SUPPORT BY OPINIONS ON AIR POLLUTION,
TRAFFIC CONGESTION, AND TRANSPORTATION SYSTEM QUALITY
Table 39 Support for the flat-rate vehicle registration fee, by opinions on air pollution, traffic congestion, and transportation system quality (detailed breakdown)
OpinionsStrongly Support (%)
Somewhat Support (%)
Somewhat Oppose (%)
Strongly Oppose (%)
Don’t Know (%) n
All respondents 18 23 16 39 5 1494Smog & air pollution a problem in California? Big problem 20 22 15 37 6 828 Somewhat of a problem 18 27 17 36 3 509 Not much of a problem 6 14 14 63 2 98 No problem at all 6 8 20 60 6 50 Don’t know 29 14 14 14 29 7Traffic congestion a problem in California? Big problem 19 23 14 38 5 1134 Somewhat of a problem 17 21 21 39 3 264 Not much of a problem 9 17 21 49 4 47 No problem at all 7 22 15 49 7 41 Don’t know 0 13 13 63 13 8Quality of the transportation system a problem for you/your family? Big problem 16 23 12 45 5 367 Somewhat of a problem 21 22 18 35 4 463 Not much of a problem 17 30 19 30 4 312 No problem at all 18 17 14 46 5 335 Don’t know 0 13 19 56 13 16Air pollution a health problem for you/your family? Big problem 18 21 14 42 5 342 Somewhat of a problem 19 24 17 36 4 382 Not much of a problem 18 26 18 33 5 305 No problem at all 17 20 15 43 5 459 Don’t know 0 29 14 43 14 7Note: Percentages may not total to 100% due to rounding.
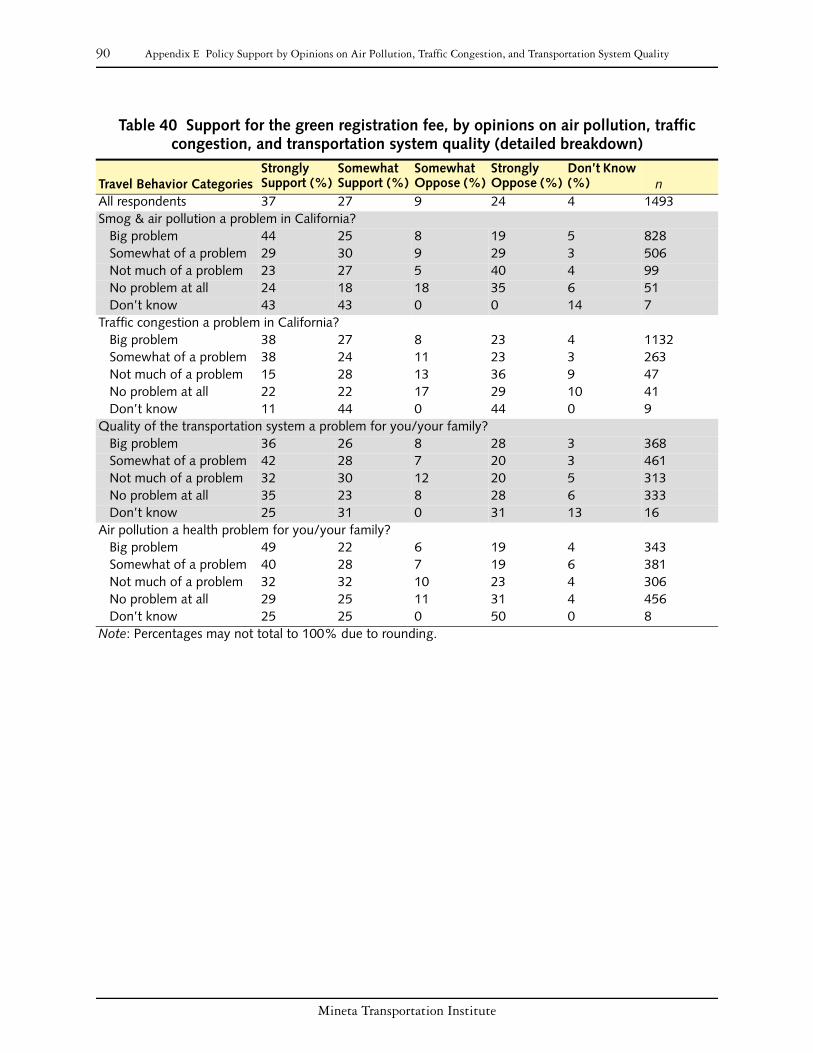
90 Appendix E Policy Support by Opinions on Air Pollution, Traffic Congestion, and Transportation System Quality
Mineta Transportation Institute
Table 40 Support for the green registration fee, by opinions on air pollution, traffic
congestion, and transportation system quality (detailed breakdown)
Travel Behavior CategoriesStrongly Support (%)
Somewhat Support (%)
Somewhat Oppose (%)
Strongly Oppose (%)
Don’t Know (%) n
All respondents 37 27 9 24 4 1493Smog & air pollution a problem in California? Big problem 44 25 8 19 5 828 Somewhat of a problem 29 30 9 29 3 506 Not much of a problem 23 27 5 40 4 99 No problem at all 24 18 18 35 6 51 Don’t know 43 43 0 0 14 7Traffic congestion a problem in California? Big problem 38 27 8 23 4 1132 Somewhat of a problem 38 24 11 23 3 263 Not much of a problem 15 28 13 36 9 47 No problem at all 22 22 17 29 10 41 Don’t know 11 44 0 44 0 9Quality of the transportation system a problem for you/your family?
Big problem 36 26 8 28 3 368 Somewhat of a problem 42 28 7 20 3 461 Not much of a problem 32 30 12 20 5 313 No problem at all 35 23 8 28 6 333 Don’t know 25 31 0 31 13 16Air pollution a health problem for you/your family? Big problem 49 22 6 19 4 343 Somewhat of a problem 40 28 7 19 6 381 Not much of a problem 32 32 10 23 4 306 No problem at all 29 25 11 31 4 456 Don’t know 25 25 0 50 0 8Note: Percentages may not total to 100% due to rounding.

Mineta Transportation Institute
Appendix E Policy Support by Opinions on Air Pollution, Traffic Congestion, and Transportation System Quality 91
Table 41 Support for the flat-mileage fee, by opinions on air pollution, traffic congestion, and transportation system quality (detailed breakdown)
Travel Behavior CategoriesStrongly
Support (%)Somewhat
Support (%)Somewhat
Oppose (%)Strongly
Oppose (%)Don’t Know(%) n
All respondents 12 16 12 52 7 1496Smog & air pollution a problem in California? Big problem 14 15 13 50 8 828 Somewhat of a problem 9 16 13 55 7 509 Not much of a problem 13 18 7 60 2 99 No problem at all 8 14 8 59 12 51 Don’t know 14 14 0 14 57 7Traffic congestion a problem in California? Big problem 13 15 12 54 7 1134 Somewhat of a problem 10 20 17 45 8 264 Not much of a problem 13 15 10 52 10 48 No problem at all 12 10 5 66 7 41 Don’t know 33 11 11 22 22 9Quality of the transportation system a problem for you/your family? Big problem 11 14 10 58 8 368 Somewhat of a problem 14 16 13 50 7 464 Not much of a problem 9 17 16 50 8 313 No problem at all 16 16 10 50 7 336 Don’t know 0 13 6 69 13 16Air pollution a health problem for you/your family? Big problem 16 16 11 50 8 341 Somewhat of a problem 14 19 12 49 7 384 Not much of a problem 9 17 18 48 8 305 No problem at all 11 12 11 60 6 459 Don’t know 11 0 11 33 44 9Note: Percentages may not total to 100% due to rounding.
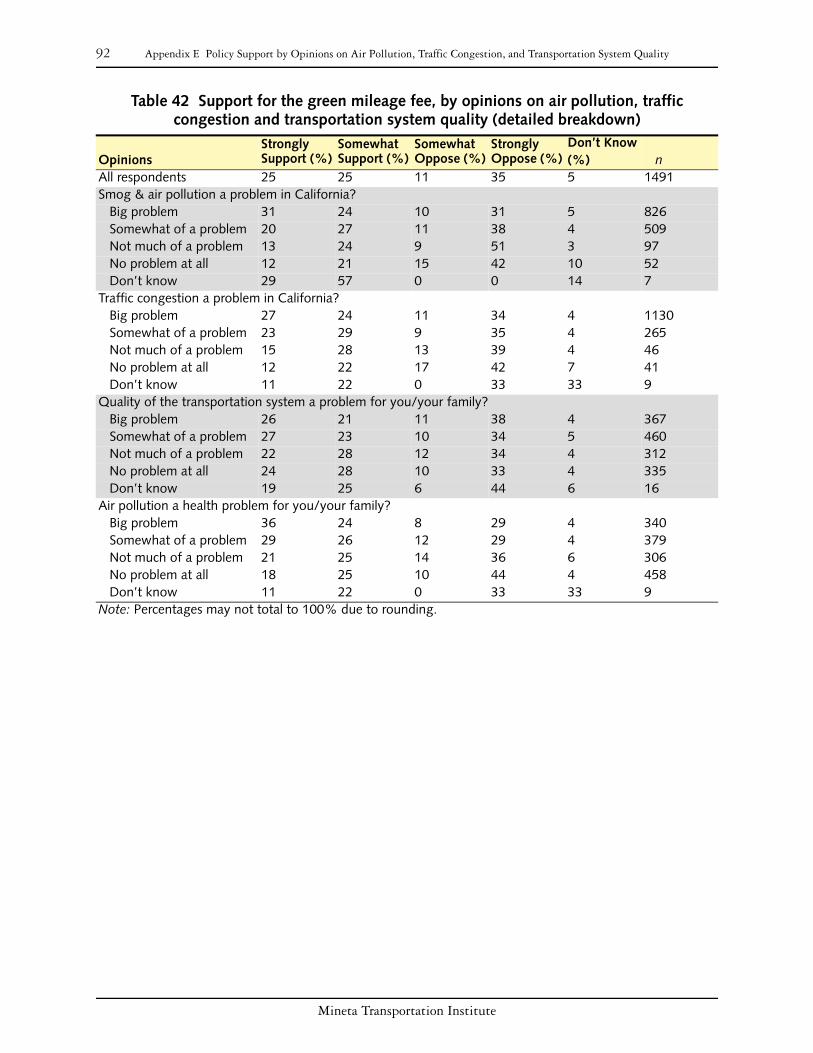
92 Appendix E Policy Support by Opinions on Air Pollution, Traffic Congestion, and Transportation System Quality
Mineta Transportation Institute
Table 42 Support for the green mileage fee, by opinions on air pollution, traffic congestion and transportation system quality (detailed breakdown)
OpinionsStrongly Support (%)
Somewhat Support (%)
Somewhat Oppose (%)
Strongly Oppose (%)
Don’t Know(%) n
All respondents 25 25 11 35 5 1491Smog & air pollution a problem in California? Big problem 31 24 10 31 5 826 Somewhat of a problem 20 27 11 38 4 509 Not much of a problem 13 24 9 51 3 97 No problem at all 12 21 15 42 10 52 Don’t know 29 57 0 0 14 7Traffic congestion a problem in California? Big problem 27 24 11 34 4 1130 Somewhat of a problem 23 29 9 35 4 265 Not much of a problem 15 28 13 39 4 46 No problem at all 12 22 17 42 7 41 Don’t know 11 22 0 33 33 9Quality of the transportation system a problem for you/your family? Big problem 26 21 11 38 4 367 Somewhat of a problem 27 23 10 34 5 460 Not much of a problem 22 28 12 34 4 312 No problem at all 24 28 10 33 4 335 Don’t know 19 25 6 44 6 16Air pollution a health problem for you/your family? Big problem 36 24 8 29 4 340 Somewhat of a problem 29 26 12 29 4 379 Not much of a problem 21 25 14 36 6 306 No problem at all 18 25 10 44 4 458 Don’t know 11 22 0 33 33 9Note: Percentages may not total to 100% due to rounding.

Mineta Transportation Institute
Appendix E Policy Support by Opinions on Air Pollution, Traffic Congestion, and Transportation System Quality 93
Table 43 Support for the feebate, by opinions on air pollution, traffic congestion, and transportation system quality (detailed breakdown)
OpinionsStrongly Support (%)
Somewhat Support (%)
Somewhat Oppose (%)
Strongly Oppose (%)
Don’t Know (%) n
All respondents 38 27 10 20 4 1489Smog & air pollution a problem in California? Big problem 46 25 8 17 4 826 Somewhat of a problem 31 33 12 22 4 508 Not much of a problem 26 24 14 31 6 98 No problem at all 16 18 12 45 8 49 Don’t know 57 0 14 0 29 7Traffic congestion a problem in California? Big problem 40 28 10 19 4 1129 Somewhat of a problem 36 27 10 23 5 263 Not much of a problem 26 22 15 28 9 46 No problem at all 22 24 10 34 10 41 Don’t know 33 22 0 22 22 9Quality of the transportation system a problem for you/your family? Big problem 40 27 8 22 3 367 Somewhat of a problem 41 27 11 18 3 462 Not much of a problem 31 33 13 18 6 311 No problem at all 39 24 8 22 7 331 Don’t know 38 25 19 19 0 16Air pollution a health problem for you/your family? Big problem 45 25 10 17 4 341 Somewhat of a problem 40 30 11 15 5 379 Not much of a problem 37 30 11 20 3 305 No problem at all 33 25 9 27 6 456 Don’t know 50 13 0 38 0 8Note: Percentages may not total to 100% due to rounding.

94 Appendix E Policy Support by Opinions on Air Pollution, Traffic Congestion, and Transportation System Quality
Mineta Transportation Institute

Mineta Transportation Institute
95
APPENDIX F POLICY SUPPORT BY OPINIONS ON TRANSPORTATION
REVENUES PRINCIPLES OF STRUCTURING VEHICLE REGISTRATION FEES
Table 44 Support for the flat-rate vehicle registration fee, by opinions on transportation revenues and principles of structuring vehicle registration fees (detailed breakdown)
OpinionsStrongly Support (%)
Somewhat Support (%)
Somewhat Oppose (%)
Strongly Oppose (%)
Don’t Know (%) n
All respondents 18 23 16 39 5 1494State/local government has adequate funding for the transportation system?
Yes 11 19 17 51 3 475No 24 25 15 32 4 733Don’t know 15 22 17 37 9 279
Should vehicle registration fee rates take gasoline mileage into account?Yes 24 27 15 29 5 847No 9 18 15 56 2 503Don’t know 18 10 21 41 11 137
Should vehicle registration fee rates take pollution emissions into account?Yes 22 26 16 30 5 1005No 9 16 14 61 1 393Don’t know 10 14 15 45 16 87
Note: Percentages may not total to 100% due to rounding.
Table 45 Support for the green vehicle registration fee, by opinions on transportation revenues and principles of structuring vehicle registration fees (detailed breakdown)
Travel Behavior CategoriesStrongly Support (%)
Somewhat Support (%)
Somewhat Oppose (%)
Strongly Oppose (%)
Don’t Know (%) n
All respondents 37 27 9 24 4 1493State/local government has adequate funding for the transportation system?
Yes 30 25 9 33 3 473No 42 27 9 19 3 733Don’t know 36 28 8 21 8 280
Should vehicle registration fee rates take gasoline mileage into account?Yes 51 29 7 9 3 846No 15 22 10 50 3 505Don’t know 27 28 10 23 13 137
Should vehicle registration fee rates take pollution emissions into account?Yes 49 31 7 9 3 1004No 11 16 12 58 4 391Don’t know 15 25 10 33 16 87
Note: Percentages may not total to 100% due to rounding.

96 Appendix F Policy Support by Opinions on Transportation Revenues Principles of Structuring Vehicle Registration Fees
Mineta Transportation Institute
Table 46 Support for flat-rate mileage fee, by opinions on transportation revenues and principles of structuring vehicle registration fees (detailed breakdown)
OpinionsStrongly Support (%)
Somewhat Support (%)
Somewhat Oppose (%)
Strongly Oppose (%)
Don’t Know (%) n
All respondents 12 16 12 52 7 1496State/local government has adequate funding for the transportation system?
Yes 11 17 11 57 5 474No 14 16 12 51 6 735Don’t know 11 14 16 45 15 282
Should vehicle registration fee rates take gasoline mileage into account?Yes 15 18 15 45 8 849No 9 12 8 67 5 503Don’t know 7 17 15 46 15 137
Should vehicle registration fee rates take pollution emissions into account?Yes 14 17 15 46 8 1006No 8 12 7 68 4 393Don’t know 8 14 12 55 12 87
Note: Percentages may not total to 100% due to rounding.
Table 47 Support for the green mileage fee, by opinions on transportation revenues and principles of structuring vehicle registration fees (detailed breakdown)
OpinionsStrongly Support (%)
Somewhat Support (%)
Somewhat Oppose (%)
Strongly Oppose (%)
Don’t Know (%) n
All respondents 25 25 11 35 5 1491State/local government has adequate funding for the transportation system?
Yes 21 22 9 45 3 472No 30 25 10 32 4 730Don’t know 21 30 14 26 10 281
Should vehicle registration fee rates take gasoline mileage into account?Yes 34 31 9 22 4 847No 11 16 12 58 3 500Don’t know 24 24 13 27 13 136
Should vehicle registration fee rates take pollution emissions into account?Yes 34 29 10 23 4 1004No 9 13 12 64 3 391Don’t know 7 29 13 35 16 86
Note: Percentages may not total to 100% due to rounding.
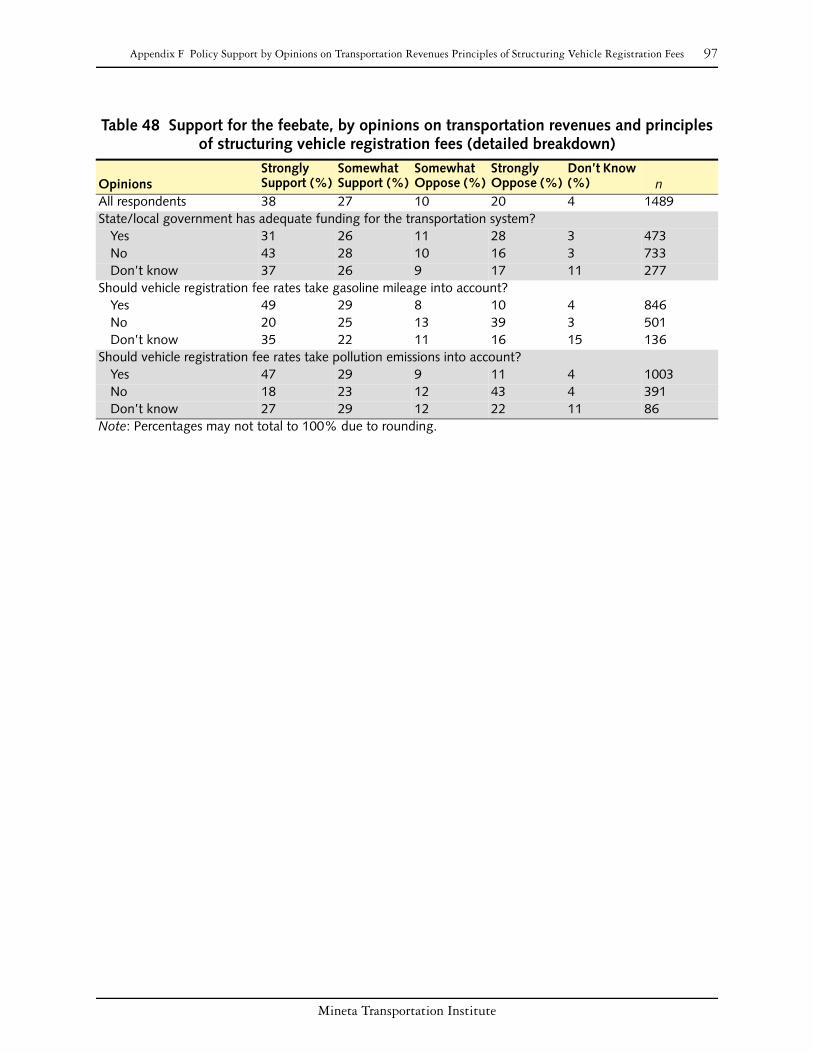
Mineta Transportation Institute
Appendix F Policy Support by Opinions on Transportation Revenues Principles of Structuring Vehicle Registration Fees 97
Table 48 Support for the feebate, by opinions on transportation revenues and principles of structuring vehicle registration fees (detailed breakdown)
Opinions Strongly Support (%)
Somewhat Support (%)
Somewhat Oppose (%)
Strongly Oppose (%)
Don’t Know (%) n
All respondents 38 27 10 20 4 1489State/local government has adequate funding for the transportation system?
Yes 31 26 11 28 3 473No 43 28 10 16 3 733Don’t know 37 26 9 17 11 277
Should vehicle registration fee rates take gasoline mileage into account?Yes 49 29 8 10 4 846No 20 25 13 39 3 501Don’t know 35 22 11 16 15 136
Should vehicle registration fee rates take pollution emissions into account?Yes 47 29 9 11 4 1003No 18 23 12 43 4 391Don’t know 27 29 12 22 11 86
Note: Percentages may not total to 100% due to rounding.
98 Appendix F Policy Support by Opinions on Transportation Revenues Principles of Structuring Vehicle Registration Fees
Mineta Transportation Institute

Mineta Transportation Institute
99
APPENDIX G POLICY SUPPORT BY KNOWLEDGE OF
TRANSPORTATION ISSUES
Table 49 Support for the flat-rate vehicle registration fee by knowledge of transportation issues (detailed breakdown)
OpinionsStrongly Support (%)
Somewhat Support (%)
Somewhat Oppose (%)
Strongly Oppose (%)
Don’t Know (%) n
All respondents 18 23 16 39 5 1494“State and federal gas taxes provide all the money that is spent to build and maintain highways and roads in California.” (Question 8a)
Definitely true 23 14 19 39 5 93Probably true 16 23 21 38 3 257Probably false 19 26 15 34 5 483Definitely false* 17 19 14 46 4 465Don’t know 18 24 14 37 7 197
“State and federal gas taxes have not been raised in more than 10 years.” (Question 8b)Definitely true* 27 29 8 35 1 77Probably true 23 26 20 24 7 219Probably false 17 26 18 35 3 352Definitely false 13 17 14 54 2 385Don’t know 19 22 15 37 8 461
“Exhaust from cars, vans, pickups, and SUVs is an important source of the pollution that causes asthma and makes asthma attacks worse.” (Question 8c)
Definitely true* 24 24 13 34 6 477Probably true 18 26 18 34 4 616Probably false 12 15 20 50 3 164Definitely false 10 13 6 67 4 78Don’t know 11 17 18 48 6 158
“In California, motor vehicles, including cars, trucks and trains, are the single largest source of air pollutants that cause smog.” (Question 8d)
Definitely true* 20 23 15 38 5 389Probably true 19 25 17 34 5 562Probably false 16 23 18 40 3 303Definitely false 17 14 11 56 3 151Don’t know 13 21 14 40 14 88
“In California, motor vehicles, including cars, trucks, and trains, are the single largest source of so-called ‘greenhouse gases’ that many scientists say are causing global warming.” (Question 8e)
Definitely true* 22 28 13 32 5 279Probably true 19 25 19 32 5 539Probably false 16 20 16 44 4 307Definitely false 15 12 13 58 2 194
“All new cars, vans, pickups, and SUVs pollute the same amount for each mile driven.” (Question 8f)Definitely true 15 19 13 47 6 79Probably true 17 19 20 42 3 156Probably false 17 25 18 37 4 419Definitely false* 22 23 14 38 4 679Don’t know 9 23 14 43 12 157
Note: Percentages may not total to 100% due to rounding.* Correct answer to the question.

100 Appendix G Policy Support by Knowledge of Transportation Issues
Mineta Transportation Institute
Table 50 Support for the green vehicle registration fee, by knowledge of transportation issues (detailed breakdown)
Travel Behavior Categories
Strongly Support (%)
Somewhat Support (%)
Somewhat Oppose (%)
Strongly Oppose (%)
Don’t Know (%) n
Opinions 37 27 9 24 4 1493“State and federal gas taxes provide all the money that is spent to build and maintain highways and roads in California.” (Question 8a)
Definitely true 44 22 12 21 2 92Probably true 36 30 11 21 2 257Probably false 40 29 10 18 3 483Definitely false* 34 23 7 32 4 462Don’t know 33 27 4 26 10 197
“State and federal gas taxes have not been raised in more than 10 years.” (Question 8b)Definitely true* 49 21 8 20 3 76Probably true 40 30 11 16 3 217Probably false 36 28 8 24 3 350Definitely false 33 25 7 32 4 386Don’t know 37 27 9 22 6 461
“Exhaust from cars, vans, pickups, and SUVs is an important source of the pollution that causes asthma and makes asthma attacks worse.” (Question 8c)
Definitely true* 50 24 6 17 3 477Probably true 34 32 11 19 4 615Probably false 22 25 9 40 4 161Definitely false 20 15 8 56 1 79Don’t know 31 22 6 31 10 158
“In California, motor vehicles, including cars, trucks and trains, are the single largest source of air pollutants that cause smog.” (Question 8d)
Definitely true* 45 26 6 19 5 390Probably true 36 30 9 21 4 562Probably false 35 24 11 27 2 300Definitely false 23 17 11 45 3 150Don’t know 30 30 6 21 13 90
“In California, motor vehicles, including cars, trucks, and trains, are the single largest source of so-called ‘greenhouse gases’ that many scientists say are causing global warming.” (Question 8e)
Definitely true* 49 25 6 15 4 278Probably true 41 31 7 18 3 539Probably false 28 27 12 29 4 307Definitely false 27 14 9 49 1 192Don’t know 28 29 9 22 12 177
“All new cars, vans, pickups, and SUVs pollute the same amount for each mile driven.” (Question 8f)Definitely true 33 23 9 34 1 82Probably true 37 34 8 18 3 156Probably false 35 30 11 21 3 418Definitely false* 41 23 8 25 3 676
Note: Percentages may not total to 100% due to rounding.* Correct answer to the question.
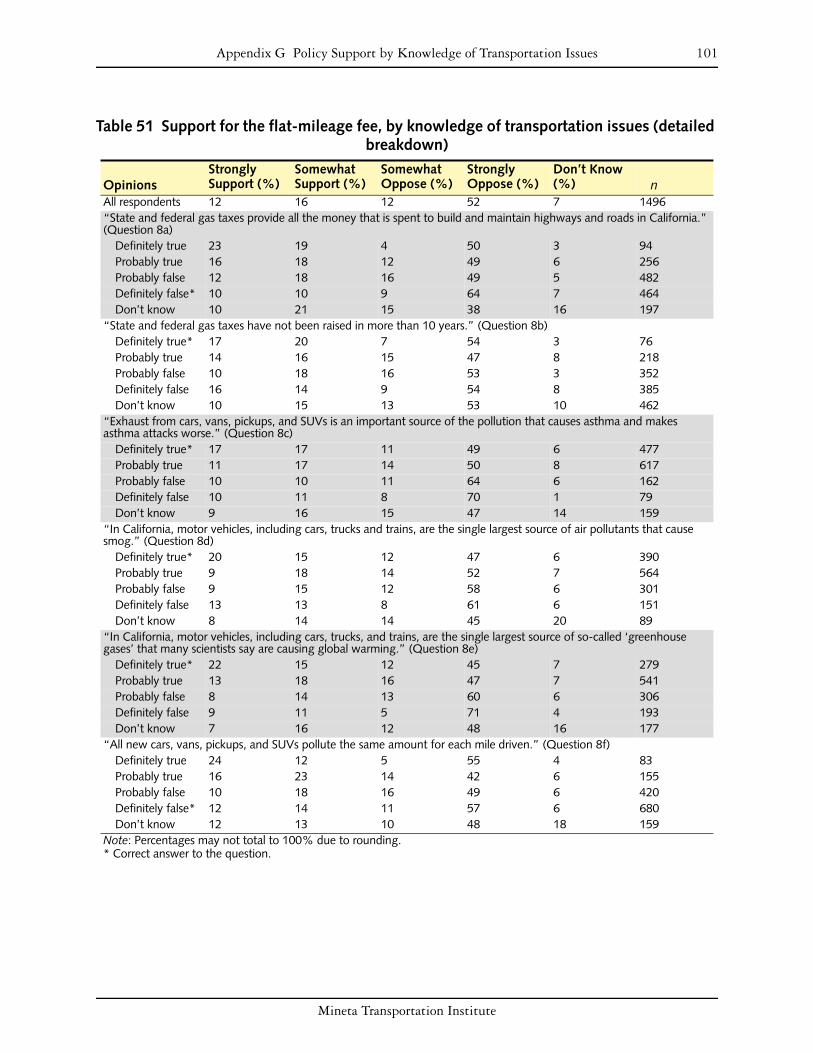
Mineta Transportation Institute
Appendix G Policy Support by Knowledge of Transportation Issues 101
Table 51 Support for the flat-mileage fee, by knowledge of transportation issues (detailed breakdown)
OpinionsStrongly Support (%)
Somewhat Support (%)
Somewhat Oppose (%)
Strongly Oppose (%)
Don’t Know (%) n
All respondents 12 16 12 52 7 1496“State and federal gas taxes provide all the money that is spent to build and maintain highways and roads in California.” (Question 8a)
Definitely true 23 19 4 50 3 94Probably true 16 18 12 49 6 256Probably false 12 18 16 49 5 482Definitely false* 10 10 9 64 7 464Don’t know 10 21 15 38 16 197
“State and federal gas taxes have not been raised in more than 10 years.” (Question 8b)Definitely true* 17 20 7 54 3 76Probably true 14 16 15 47 8 218Probably false 10 18 16 53 3 352Definitely false 16 14 9 54 8 385Don’t know 10 15 13 53 10 462
“Exhaust from cars, vans, pickups, and SUVs is an important source of the pollution that causes asthma and makes asthma attacks worse.” (Question 8c)
Definitely true* 17 17 11 49 6 477Probably true 11 17 14 50 8 617Probably false 10 10 11 64 6 162Definitely false 10 11 8 70 1 79Don’t know 9 16 15 47 14 159
“In California, motor vehicles, including cars, trucks and trains, are the single largest source of air pollutants that cause smog.” (Question 8d)
Definitely true* 20 15 12 47 6 390Probably true 9 18 14 52 7 564Probably false 9 15 12 58 6 301Definitely false 13 13 8 61 6 151Don’t know 8 14 14 45 20 89
“In California, motor vehicles, including cars, trucks, and trains, are the single largest source of so-called ‘greenhouse gases’ that many scientists say are causing global warming.” (Question 8e)
Definitely true* 22 15 12 45 7 279Probably true 13 18 16 47 7 541Probably false 8 14 13 60 6 306Definitely false 9 11 5 71 4 193Don’t know 7 16 12 48 16 177
“All new cars, vans, pickups, and SUVs pollute the same amount for each mile driven.” (Question 8f)Definitely true 24 12 5 55 4 83Probably true 16 23 14 42 6 155Probably false 10 18 16 49 6 420Definitely false* 12 14 11 57 6 680Don’t know 12 13 10 48 18 159
Note: Percentages may not total to 100% due to rounding.* Correct answer to the question.

102 Appendix G Policy Support by Knowledge of Transportation Issues
Mineta Transportation Institute
Table 52 Support for the green mileage fee, by knowledge of transportation issues (detailed responses)
OpinionsStrongly Support (%)
Somewhat Support (%)
Somewhat Oppose (%)
Strongly Oppose (%)
Don’t Know (%) n
All respondents 25 25 11 35 5 1491“State and federal gas taxes provide all the money that is spent to build and maintain highways and roads in California.” (Question 8a)
Definitely true 38 20 11 29 2 93Probably true 30 27 10 28 4 256Probably false 24 30 12 31 3 483Definitely false* 23 16 11 47 3 462Don’t know 23 30 8 27 12 196
“State and federal gas taxes have not been raised in more than 10 years.” (Question 8b)Definitely true* 40 15 11 32 4 76Probably true 29 29 7 31 4 218Probably false 22 28 12 36 2 352Definitely false 23 22 12 39 3 384Don’t know 26 24 10 33 8 460
“Exhaust from cars, vans, pickups, and SUVs is an important source of the pollution that causes asthma and makes asthma attacks worse.” (Question 8c)
Definitely true* 38 22 9 28 3 476Probably true 21 30 12 31 6 617Probably false 16 17 12 53 2 162Definitely false 16 16 5 57 7 77Don’t know 19 24 13 38 6 159
“In California, motor vehicles, including cars, trucks and trains, are the single largest source of air pollutants that cause smog.” (Question 8d)
Definitely true* 35 24 9 28 4 388Probably true 23 29 11 33 5 561Probably false 22 22 13 40 2 301Definitely false 15 19 9 52 5 151
“In California, motor vehicles, including cars, trucks, and trains, are the single largest source of so-called ‘greenhouse gases’ that many scientists say are causing global warming.” (Question 8e)
Definitely true* 40 22 9 25 4 277Probably true 26 29 12 28 4 537Probably false 18 25 13 42 2 304Definitely false 18 15 7 58 3 193Don’t know 19 26 10 34 11 176
“All new cars, vans, pickups, and SUVs pollute the same amount for each mile driven.” (Question 8f)Definitely true 34 20 11 31 4 80Probably true 27 34 7 28 5 154Probably false 24 30 14 29 4 417Definitely false* 26 21 9 40 4 680Don’t know 22 20 13 34 11 156
Note: Percentages may not total to 100% due to rounding.* Correct answer to the question.

Mineta Transportation Institute
Appendix G Policy Support by Knowledge of Transportation Issues 103
Table 53 Support for the feebate, by knowledge of transportation issues
OpinionsStrongly Support (%)
Somewhat Support (%)
Somewhat Oppose (%)
Strongly Oppose (%)
Don’t Know(%) n
All respondents 38 27 10 20 4 1489“State and federal gas taxes provide all the money that is spent to build and maintain highways and roads in California.” (Question 8a)
Definitely true 37 24 9 24 6 90Probably true 35 29 15 20 2 256Probably false 40 32 10 15 3 481Definitely false* 39 22 9 27 4 465Don’t know 40 25 8 15 12 197
“State and federal gas taxes have not been raised in more than 10 years.” (Question 8b)Definitely true* 45 20 9 21 5 76Probably true 44 29 10 13 4 219Probably false 34 32 12 20 3 352Definitely false 36 22 11 27 4 385Don’t know 40 29 8 17 6 459
“Exhaust from cars, vans, pickups, and SUVs is an important source of the pollution that causes asthma and makes asthma attacks worse.” (Question 8c)
Definitely true* 49 23 10 14 4 472Probably true 36 34 10 16 4 619Probably false 22 21 15 37 4 163Definitely false 24 18 8 43 7 76Don’t know 37 23 8 24 9 158
“In California, motor vehicles, including cars, trucks and trains, are the single largest source of air pollutants that cause smog.” (Question 8d)
Definitely true* 47 23 8 17 5 388Probably true 37 31 11 17 3 560Probably false 34 32 11 21 3 300Definitely false 26 19 11 38 6 149Don’t know 41 20 7 21 11 90
“In California, motor vehicles, including cars, trucks, and trains, are the single largest source of so-called ‘greenhouse gases’ that many scientists say are causing global warming.” (Question 8e)
Definitely true* 53 24 7 13 4 278Probably true 40 32 11 15 3 539Probably false 32 27 14 24 3 304Definitely false 28 19 6 43 4 190Don’t know 34 26 11 17 13 176
“All new cars, vans, pickups, and SUVs pollute the same amount for each mile driven.” (Question 8f)Definitely true 39 23 10 23 5 82Probably true 35 26 13 19 6 156Probably false 34 33 12 19 3 416Definitely false* 43 26 9 20 3 678Don’t know 33 22 8 23 14 155
Note: Percentages may not total to 100% due to rounding.* Correct answer to the question.

104 Appendix G Policy Support by Knowledge of Transportation Issues
Mineta Transportation Institute
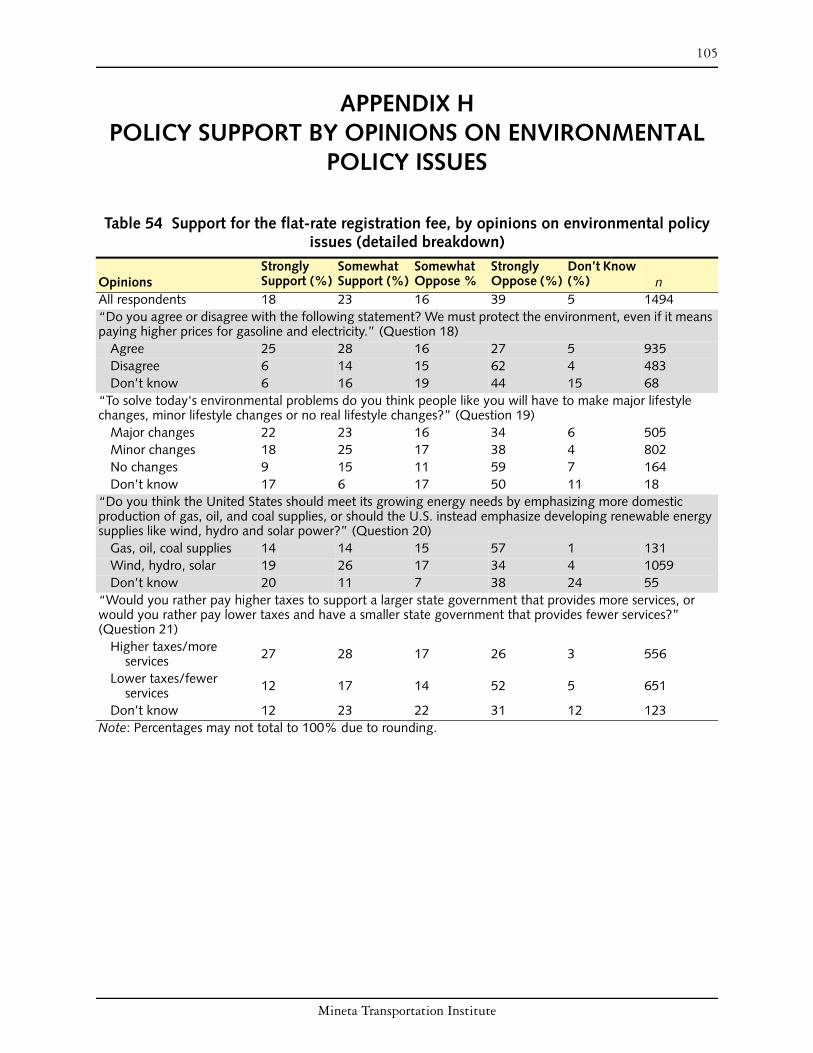
Mineta Transportation Institute
105
APPENDIX H POLICY SUPPORT BY OPINIONS ON ENVIRONMENTAL
POLICY ISSUES
Table 54 Support for the flat-rate registration fee, by opinions on environmental policy issues (detailed breakdown)
OpinionsStrongly Support (%)
Somewhat Support (%)
Somewhat Oppose %
Strongly Oppose (%)
Don’t Know (%) n
All respondents 18 23 16 39 5 1494“Do you agree or disagree with the following statement? We must protect the environment, even if it means paying higher prices for gasoline and electricity.” (Question 18)
Agree 25 28 16 27 5 935Disagree 6 14 15 62 4 483Don’t know 6 16 19 44 15 68
“To solve today's environmental problems do you think people like you will have to make major lifestyle changes, minor lifestyle changes or no real lifestyle changes?” (Question 19)
Major changes 22 23 16 34 6 505Minor changes 18 25 17 38 4 802No changes 9 15 11 59 7 164Don’t know 17 6 17 50 11 18
“Do you think the United States should meet its growing energy needs by emphasizing more domestic production of gas, oil, and coal supplies, or should the U.S. instead emphasize developing renewable energy supplies like wind, hydro and solar power?” (Question 20)
Gas, oil, coal supplies 14 14 15 57 1 131Wind, hydro, solar 19 26 17 34 4 1059Don’t know 20 11 7 38 24 55
“Would you rather pay higher taxes to support a larger state government that provides more services, or would you rather pay lower taxes and have a smaller state government that provides fewer services?” (Question 21)
Higher taxes/more services 27 28 17 26 3 556
Lower taxes/fewer services 12 17 14 52 5 651
Don’t know 12 23 22 31 12 123Note: Percentages may not total to 100% due to rounding.

106 Appendix H Policy Support by Opinions on Environmental Policy Issues
Mineta Transportation Institute
Table 55 Support for the green vehicle registration fee, by opinions on environmental policy issues (detailed breakdown)
Travel Behavior CategoriesStrongly Support (%)
Somewhat Support (%)
Somewhat Oppose (%)
Strongly Oppose (%)
Don’t Know (%) n
All respondents 37 27 9 24 9 1493“Do you agree or disagree with the following statement? We must protect the environment, even if it means paying higher prices for gasoline and electricity.” (Question 18)
Agree 47 28 8 13 3 935Disagree 18 23 9 45 5 482Don’t know 27 32 7 22 12 68
“To solve today's environmental problems do you think people like you will have to make major lifestyle changes, minor lifestyle changes or no real lifestyle changes?” (Question 19)
Major changes 44 28 9 16 3 503 Minor changes 37 27 9 23 4 801 No changes 16 20 7 52 6 164 Don’t know 32 16 5 26 21 19
“Do you think the United States should meet its growing energy needs by emphasizing more domestic production of gas, oil, and coal supplies, or should the U.S. instead emphasize developing renewable energy supplies like wind, hydro and solar power?” (Question 20)
Gas, oil, coal supplies 26 19 8 46 2 132Wind, hydro, solar 42 29 9 17 3 1061Don’t know 24 26 9 19 22 54
“Would you rather pay higher taxes to support a larger state government that provides more services, or would you rather pay lower taxes and have a smaller state government that provides fewer services?” (Question 21)
Higher taxes/more services 49 29 7 14 1 554
Lower taxes/fewer services 25 26 9 35 5 651
Don’t know 39 29 7 15 10 123Note: Percentages may not total to 100% due to rounding.
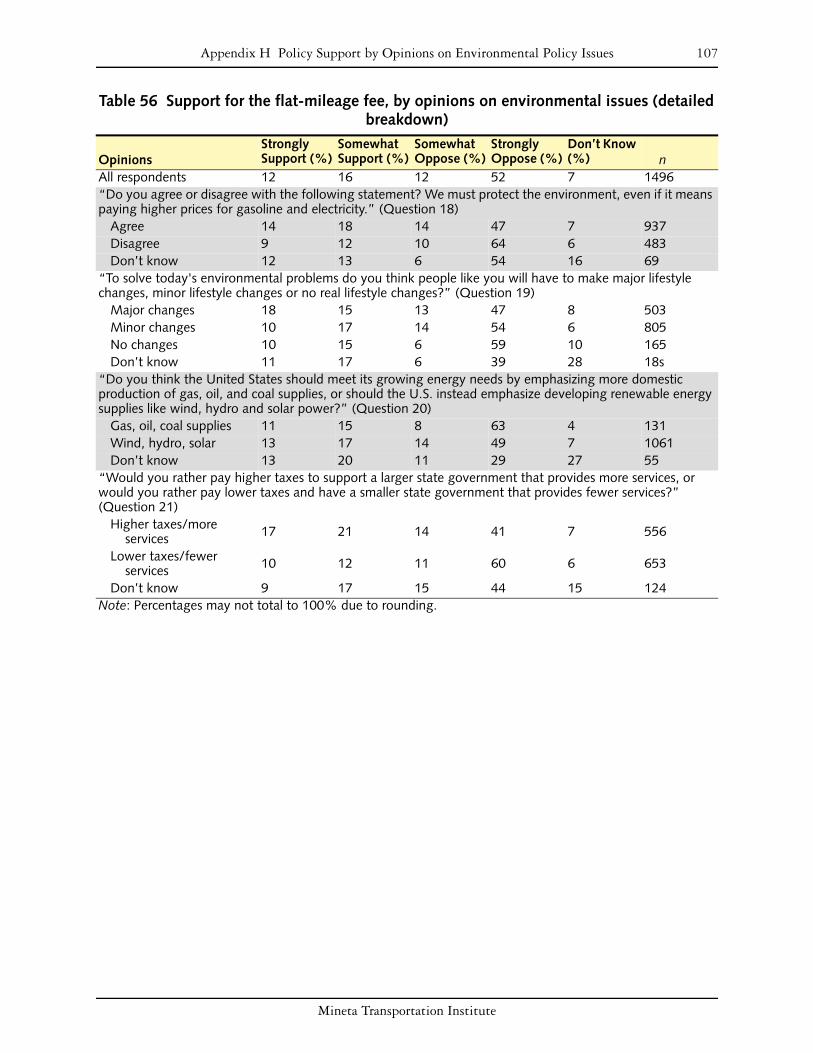
Mineta Transportation Institute
Appendix H Policy Support by Opinions on Environmental Policy Issues 107
Table 56 Support for the flat-mileage fee, by opinions on environmental issues (detailed breakdown)
OpinionsStrongly Support (%)
Somewhat Support (%)
Somewhat Oppose (%)
Strongly Oppose (%)
Don’t Know (%) n
All respondents 12 16 12 52 7 1496“Do you agree or disagree with the following statement? We must protect the environment, even if it means paying higher prices for gasoline and electricity.” (Question 18)
Agree 14 18 14 47 7 937Disagree 9 12 10 64 6 483Don’t know 12 13 6 54 16 69
“To solve today's environmental problems do you think people like you will have to make major lifestyle changes, minor lifestyle changes or no real lifestyle changes?” (Question 19)
Major changes 18 15 13 47 8 503Minor changes 10 17 14 54 6 805No changes 10 15 6 59 10 165Don’t know 11 17 6 39 28 18s
“Do you think the United States should meet its growing energy needs by emphasizing more domestic production of gas, oil, and coal supplies, or should the U.S. instead emphasize developing renewable energy supplies like wind, hydro and solar power?” (Question 20)
Gas, oil, coal supplies 11 15 8 63 4 131Wind, hydro, solar 13 17 14 49 7 1061Don’t know 13 20 11 29 27 55
“Would you rather pay higher taxes to support a larger state government that provides more services, or would you rather pay lower taxes and have a smaller state government that provides fewer services?” (Question 21)
Higher taxes/more services 17 21 14 41 7 556
Lower taxes/fewer services 10 12 11 60 6 653
Don’t know 9 17 15 44 15 124Note: Percentages may not total to 100% due to rounding.

108 Appendix H Policy Support by Opinions on Environmental Policy Issues
Mineta Transportation Institute
Table 57 Support for the green mileage fee, by opinions on environmental policy issues (detailed breakdown)
OpinionStrongly Support (%)
Somewhat Support (%)
Somewhat Oppose (%)
Strongly Oppose (%)
Don’t Know (%) n
All respondents 25 25 11 35 5 1491“Do you agree or disagree with the following statement? We must protect the environment, even if it means paying higher prices for gasoline and electricity.” (Question 18)
Agree 32 26 12 25 5 937Disagree 14 21 10 53 3 479Don’t know 17 35 3 32 13 69
“To solve today's environmental problems do you think people like you will have to make major lifestyle changes, minor lifestyle changes or no real lifestyle changes?” (Question 19)
Major changes 34 24 10 27 4 501Minor changes 23 26 11 35 4 801No changes 10 20 10 55 4 164Don’t know 11 26 0 37 26 19
“Do you think the United States should meet its growing energy needs by emphasizing more domestic production of gas, oil, and coal supplies, or should the U.S. instead emphasize developing renewable energy supplies like wind, hydro and solar power?” (Question 20)
Gas, oil, coal supplies 15 24 14 46 2 131Wind, hydro, solar 28 26 11 31 4 1058Don’t know 20 24 13 20 24 55
“Would you rather pay higher taxes to support a larger state government that provides more services, or would you rather pay lower taxes and have a smaller state government that provides fewer services?” (Question 21)
Higher taxes/more services 36 29 12 20 3 555
Lower taxes/fewer services 18 23 9 46 4 651
Don’t know 24 24 15 26 12 123Note: Percentages may not total to 100% due to rounding.

Mineta Transportation Institute
Appendix H Policy Support by Opinions on Environmental Policy Issues 109
Table 58 Support for the feebate, by knowledge of transportation issues (detailed breakdown)
OpinionsStrongly Support (%)
Somewhat Support (%)
Somewhat Oppose (%)
Strongly Oppose (%)
Don’t Know (%) n
All respondents 38 27 10 20 4 1489“Do you agree or disagree with the following statement? We must protect the environment, even if it means paying higher prices for gasoline and electricity.” (Question 18)
Agree 46 30 8 12 3 934Disagree 23 22 14 35 6 480Don’t know 36 30 8 21 5 66
“To solve today's environmental problems do you think people like you will have to make major lifestyle changes, minor lifestyle changes or no real lifestyle changes?” (Question 19)
Major changes 49 26 7 15 4 504Minor changes 34 30 13 20 4 799No changes 31 19 8 36 6 162Don’t know 22 0 6 39 33 18
“Do you think the United States should meet its growing energy needs by emphasizing more domestic production of gas, oil, and coal supplies, or should the U.S. instead emphasize developing renewable energy supplies like wind, hydro and solar power?” (Question 20)
Gas, oil, coal supplies 28 20 12 37 4 131Wind, hydro, solar 42 30 9 15 3 1056Don’t know 26 17 9 22 26 54
“Would you rather pay higher taxes to support a larger state government that provides more services, or would you rather pay lower taxes and have a smaller state government that provides fewer services?” (Question 21)
Higher taxes/more services 48 30 9 11 3 556
Lower taxes/fewer services 31 26 11 27 5 648
Don’t know 45 26 8 13 8 123Note: Percentages may not total to 100% due to rounding.

110 Appendix H Policy Support by Opinions on Environmental Policy Issues
Mineta Transportation Institute

Mineta Transportation Institute
111
ENDNOTES
1. The Survey and Policy Research Institute (SPRI) at San José State University was engaged to manage this survey, and the final questionnaire form was developed by SPRI Director Philip J. Trounstine. EMH Opinion Sampling, Inc. conducted the telephone interviewing.
2. The 120 sub-groupings represents the sum of all the response options for each major category examined in Table 6, Table 7, Table 8, Table 10, Table 12, and Table 16.
3. American Association of State Highway and Transportation Officials, Future Needs of the U.S. Surface Transportation System (Washington, DC: The Association, February 2007), p. 16.
4. Asha Weinstein, Jennifer Dill, Todd Goldman, John Hall, Franziska Holtzman, Joe Recker, and Eileen Goodwin, Transportation Financing Opportunities for the State of California (San José, CA: Mineta Transportation Institute, College of Business, San José State University, October 2006), http://transweb.sjsu.edu/mtiportal/research/publications/documents/06-01/TransportFinanceOpps5_020107.pdf (accessed on July 5, 2008); Transportation Research Board, Special Report 285: The Fuel Tax and Alternatives for Transportation Funding (Washington, DC: Transportation Research Board of the National Academies, 2005); Cambridge Systematics, Mercator Advisors, Alan E. Pisarski, and Martin Wachs, NCHRP 20-24(49): Future Financing Options to Meet Highway and Transit Needs (Washington, DC: Transportation Research Board, December 2006).
5. National Surface Transportation Policy and Revenue Study Commission, Transportation for Tomorrow: Report of the National Surface Transportation Policy and Revenue Study Commission (Washington, DC: The Commission, December 2007).
6. Uwe Kunert and Hartmut Kuhfeld, “The Diverse Structures of Passenger Car Taxation in Europe and the EU Commissions Proposal for Reform,” Transport Policy 14, no. 4 (2007): 306–316.
7. James Chapman, “Luxury Cars to Be Charged £25 Tax under Britain’s First Pollution Tax,” Daily Mail (London), August 8, 2007.
8. Richard Owens, “Congestion Fee Leaves Milan in a Jam,” The Times (London), January 3, 2008.
9. Salvatore Lazzari, Tax Credits for Hybrid Vehicles—CRS Report for Congress, (February 7, 2008), http://ncseonline.org/NLE/CRSreports/08Mar/RS22558.pdf (July 3, 2008); Hybridcenter.org, State and Federal Hybrid Incentives (2007), http://go.ucsusa.org/hybridcenter/incentives.cfm#CA (accessed July 3, 2008).

112 Endnotes
Mineta Transportation Institute
10. Weinstein et al.; Gary C. Lawrence, A Two-Phase Study of Attitudes of Washington State Voters toward Transportation Issues (prepared for Washington State Transportation Commission), April 11, 2006, http://www.wstc.wa.gov/Tolling/Analysis_AttitWaStateVoters.pdf (accessed August 22, 2006); Fairbank, Maslin, Maullin & Associates, “Los Angeles County Transportation Ballot Measure Survey 2007.”
11. Weinstein, et al.; James B. London, Jason M. Peek, Ellen W. Saltzman, and H. Günsel Günaydin, “Transportation Needs and Funding Alternatives: A Survey,” in Transportation Funding Series Special Report No. 1 (Clemson, SC: The Jim Self Center on the Future, Clemson University, 2001), http://www.strom.clemson.edu/publications/london/TNFAsurvey1.pdf#search=%22’Transportation%20needs%20and%20funding%20alternatives%3A%20a%20survey%22S (accessed on August 22, 2006).
12. Jennifer Dill and Asha Weinstein, “How to Pay for Transportation? A Survey of Public Preferences in California,” Transport Policy 14, no. 4 (2007): 346–356; Dowell Myers, John Pitkin, and Julie Park, “California Homeowners’ Growing Stake in Infrastructure and the Future,” (Los Angeles: The Keston Institute for Infrastructure, 2006), http://www.usc.edu/schools/sppd/keston/pdf/cal-homeowners-stake.pdf, accessed March 22, 2009.
13. Tatyana Gurikova and Stacy C. Davis, Transportation Energy Survey Data Book 1.1, Oak Ridge National Laboratory, ORNL/SUB/02-4000008627/01, May 2002 http://www-cta.ornl.gov/cta/Publications/Reports/ORNL_SUB_02-4000008627_01.pdf (accessed July 20, 2002).
14. Icek Ajzen and Martin Fishbein, Understanding Attitudes and Predicting Social Behavior (Englewood Cliffs: Prentice-Hall, 1980); Icek Ajzen, “The Theory of Planned Behavior,” Organizational Behavior and Human Decision Processes 50, no. 2 (1991): 179–211; Shalom H. Schwartz, “Elicitation of Moral Obligation and Self-Sacrificing Behavior,” Journal of Personality and Social Psychology 15 (1970): 283–93; Shalom H. Schwartz, “Normative Influences on Altruism,” in Advances in Experimental Social Psychology, edited by L. Berkowitz, 221–279 (New York: Academic Press, 1977); Riley E. Dunlap and Kent D. Van Liere, “New Environmental Paradigm,” Journal of Environmental Education 9, no. 4 (1978): 10–19; Riley E. Dunlap, Kent D. Van Liere, Angela G. Mertig, and Robert E. Jones, “Measuring Endorsement of the New Ecological Paradigm: A Revised NEP Scale,” Journal of Social Issues 56, no. 3 (2000): 425–442.
15. Alan Krupnick, Winston Harrington, and Anna Alberini, “Public Support for Pollution Fee Policies for Motor Vehicles with Revenue Recycling: Survey Results,” Regional Science and Urban Economics 31, no. 4 (2001): 505–522, op cit.
16. Dill and Weinstein., 2007.

Mineta Transportation Institute
Endnotes 113
17. YouGov, “YouGov/Evening Standard Survey Results, Fieldwork: 20th–25th March 2008,”http://i.thisislondon.co.uk/i/pix/2008/03/mayorsurvey.pdf (accessed on July 20, 2008),op. cit.
18. Krupnick, 2001.
19. Dill and Weinstein, 2007.
20. Ryuichi Kitamura, Patricia L. Mokhtarian, and Laura Laidet, “A Micro-Analysis of LandUse and Travel in Five Neighborhoods in the San Francisco Bay Area,” Transportation 24,no. 2 (May 1997): 125–158; Michael N. Bagley, Patricia L. Mokhtarian, and RyuchiKitamura, “A Methodology for the Disaggregate, Multidimensional Measurement ofResidential Neighborhood Type,” Urban Studies 39, no. 4 (2002): 689–704; Susan Handy,Xinyu Y. Cao, and Patricia Mokhtarian, “Correlation or Causality between the BuiltEnvironment and Travel Behavior? Evidence from Northern California,” TransportationResearch Part D-Transport and Environment 10, no. 6 (2005): 427–444; Susan Handy, XinyuY. Cao, and Patricia L. Mokhtarian, “Self-Selection in the Relationship Between the BuiltEnvironment and Walking—Empirical Evidence from Northern California,” Journal of theAmerican Planning Association 72, no. 1 (2006): 55–74.
21. Kitamura et al., 1997.
22. Christy M. Collins and Susan M. Chambers, “Psychological and Situational Influences onCommuter-Transport-Mode Choice,” Environment and Behavior 37, no. 5 (2005): 640–661.
23. Matthew A. Coogan, Karla H. Karash, Thomas Adler, and James Sallis, “The Role ofPersonal Values, Urban Form, and Auto Availability in the Analysis of Walking forTransportation,” American Journal of Health Promotion 21, no. 4 (2007): 363–370.
24. Bradley J. Flamm, Environmental Knowledge, Environmental Attitudes, and Vehicle Ownershipand Use. (Ph. D dissertation, University of California at Berkeley, 2006),http://www.uctc.net/papers/diss138.pdf (accessed July 21, 2008).
25. Ibid, p. 133–134.
26. Benjamin Gardner and Charles Abraham, “Psychological Correlates of Car Use: AMeta-Analysis,” Transportation Research Part F: Traffic Psychology and Behaviour 11, no. 4(2008): 300–311.
27. Ibid, p. 306.
28. Jillian Anable, “‘Complacent Car Addicts’ or ‘Aspiring Environmentalists’? IdentifyingTravel Behaviour Segments Using Attitude Theory,” Transport Policy 12, no. 1 (2005):65–78.

114 Endnotes
Mineta Transportation Institute
29. Michael R. Byrne and Michael J. Polonsky, “Impediments to Consumer Adoption of Sustainable Transportation—Alternative Fuel Vehicles,” International Journal of Operations & Production Management 21, no. 12 (2001): 1521–1538; Gordon Ewing and Ermine Sarigollu, “Assessing Consumer Preferences for Clean-Fuel Vehicles: A Discrete Choice Experiment,” Journal of Public Policy & Marketing 19, no. 1 (2000): 106–18; Matthew E. Kahn, “Do Greens Drive Hummers or Hybrids? Environmental Ideology as a Determinant of Consumer Choice,” Journal of Environmental Economics and Management 54, no. 2 (2007): 129–145; Dimitris Potoglou and Pavlos S. Kanaroglou, “Household Demand and Willingness to Pay for Clean Vehicles” Transportation Research Part D-Transport and Environment 12, no. 4 (2007): 264–274.
30. Ewing and Sarigollu, 2000.
31. Kahn, 2007.
32. Potoglou and Kanaroglou, 2007.
33. Kim Jensen, Paul Jakus, Burton English, and Jamey Menard, “Market Participation and Willingness to Pay for Environmentally Certified Products,” Forest Science 49 (2003): 632–641; Stewart Lockie, Kristen Lyons, Geoffrey Lawrence, and Janet Grice, “Choosing Organics: A Path Analysis of Factors Underlying the Selection of Organic Food among Australian Consumers,” Appetite 43, no. 2 (2004): 135–146.
34. Michel Laroche, Jasmin Bergeron, and Guido Barbaro-Forleo, “Targeting Consumers Who Are Willing to Pay More for Environmentally Friendly Products,” Journal of Consumer Marketing 18, no. 6 (2001): 503–520.
35. See, e.g., Laroche et al., and references therein.
36. Patrick De Pelsmacker, Liesbeck Driesen, and Glenn Rayp, “Do Consumers Care About Ethics? Willingness to Pay for Fair-Trade Coffee,” Journal of Consumer Affairs 39, no. 2 (2005): 363–385; Stefan Gossling, Timo Kunkel, Kim Schumacher, Nadine Heck, Johannes Birkemeyer, Jens Froese, Nils Naber, and Elke Schliermann, “A Target-Group Specific Approach To ‘Green’ Power Retailing: Students as Consumers of Renewable Energy,” Renewable and Sustainable Energy Reviews 9, no. 1 (2005): 69–83; Jay Zarnikau, “Consumer Demand for ‘Green Power’ and Energy Efficiency,” Energy Policy 31, (2003): 1661–1672.
37. Zarnikau, 2003.
38. Cheryl Brown, “Consumers’ Preferences for Locally Produced Food: A Study in Southeast Missouri,” American Journal of Alternative Agriculture 18 (2003): 213–24; Maria L. Loureiro, and Susan Hine, “Preferences and Willingness to Pay for GM Labeling Policies,” Food Policy 29, no. 5 (2004): 467–483; Marija Radman, “Consumer Consumption and Perception of Organic Products in Croatia,” British Food Journal 107 (2005): 263–273.
39. Susana Mourato, Bob Saynor, and David Hart, “Greening London’s Black Cabs: A Study of Driver’s Preferences for Fuel Cell Taxis,” Energy Policy 32 (2004): 685–695.
Mineta Transportation Institute
Endnotes 115
40. Jensen, et al., 2003.
41. Roland Menges, Carsten Schroder, and Stefan Traub, “Altruism, Warm Glow and the Willingess-to-Donate for Green Electricity: An Artefactual Field Experiment,” Environmental and Resource Economics 31 (2005): 431–458; Brian Roe, Mario F. Teisl, A. Levy, and M. Russell, “U.S. Consumers’ Willingness to Pay for Green Electricity,” Energy Policy 29 (2001): 917–925; Zarnikau.
42. Brown, 2003; Loureiro, 2004; Lockie, et al., 2004.
43. Adamantios Diamantopoulos, Bodo B. Schlegelmilch, Rudolf R. Sinkovics, and Greg M. Bohlen, “Can Socio-Demographics Still Play a Role in Profiling Green Consumers? A Review of the Evidence and an Empirical Investigation,” Journal of Business Research 56, no. 6 (2003): 465–480.
44. Noboru Nomura and Makato Akai, “Willingness to Pay for Green Electricity in Japan as Estimated through Contingent Valuation Method,” Applied Energy 78, no. 4 (2004): 453–463; Mourato, 2004.
45. Ryan H. Wiser, Meredith Fowlie, and Edward A. Holt, “Public Goods and Private Interests: Understanding Non-Residential Demand for Green Power,” Energy Policy 29, no. 13 (2001): 1085–1097.
46. Brian Harris and David Burress, “Demands for Local and Organic Produce: A Brief Review of the Literature” (Lawrence, KS: Institute for Public Policy and Business Research, University of Kansas, 2000); Athanasios Krystallis and George Chryssohoidis, “Consumers’ Willingness to Pay for Organic Food— Factors That Affect It and Variation Per Organic Product Type,” British Food Journal 107, no. 4-5 (2005): 320–343; Lockie, et al., 2004; Loureiro and Hine, 2004.
47. Particularly helpful in designing the questionnaire were: Flamm, 2006; Krupnick et al., 2001; Michelle Kubik, “Consumer Views on Transportation and Energy (Third Edition)” (Golden, CO: National Renewable Energy Laboratory, 2006); and polls conducted by Mark Baldassare and published by the Public Policy Institute of California, including “PPIC Statewide Survey: Californians and Their Government, July 2001,” “PPIC Statewide Survey: Special Survey of the Central Valley, April 2002,” “PPIC Statewide Survey: Special Survey on Californians and the Environment, June 2002,” “PPIC Statewide Survey: Special Survey of Orange County, December 2002,” “PPIC Statewide Survey: Special Survey on California's Fiscal System” (2004), “PPIC Statewide Survey: Special Survey on Californians and the Environment, July 2006,” and “PPIC Statewide Survey: Californians and the Future, September 2006.”
48. The Survey and Policy Research Institute (SPRI) at San José State University was engaged to manage this survey, and the final questionnaire form was developed by SPRI Director Philip J. Trounstine. EMH Opinion Sampling, Inc. conducted the telephone interviewing.
116 Endnotes
Mineta Transportation Institute
49. U.S. Bureau of the Census, “Selected Social Characteristics in California: 2006,” results from the 2006 American Community Survey, http://factfinder.census.gov (accessed March 3, 2009); U.S. Bureau of the Census, Annual Estimates for the Population for Counties of California: April 1, 2000–July 1, 2007 (CO-EST2007-01-06), http://census.gov/popest/counties/tables/CO-EST2007-01-06.xls (accessed March 3, 2009).
50. Riley E. Dunlap, “The Impact of Political Orientation on Environmental Attitudes and Actions,” Environment and Behavior 7, no. 4 (1975), 428–454; P. Wesley Schultz and William F. Stone, “Authoritarianism and Attitudes Toward the Environment: Field and Laboratory Perspective,” Environment and Behavior 26, no. 1 (1994), 25–37.
51. Brown, 2003; Lockie, et al., 2004; Loureiro and Hine, 2004.
52. De Pelsmacker, et al., 2005; Gossling, et al., 2005; Zarnikau, 2003.
53. Zarnikau, 2003; Brown, 2003; Loureiro and Hine, 2004; Jensen, et al., 2003; Radman, 2005; Mourato, et al., 2004.
54. Lockie, et al., 2004; Jensen, et al., 2003.
55. Laroche, et al., 2001; Diamantopoulos, et al., 2003.
56. Jensen, et al., 2003; Lockie, et al., 2004.
57. Laroche, et al., 2001.
58. The 120 sub-groupings represents the sum of all the response options for each the major categories examined in Table 6, Table 7, Table 8, Table 10, Table 12, Table 14 and Table 16 .

Mineta Transportation Institute
117
ABBREVIATIONS AND ACRONYMS
AASHTO American Association of State Highway and Transportation OfficialsACS American Community SurveyFeebate A self-financing system of fees and rebates that are used to shift the costs“Green” Concerned with the protection of the environmentHOV High Occupancy Vehicle MTC Metropolitan Transportation CommissionPEB Pro-environmental behaviorSUV Sport Utility Vehicle

118 Abbreviations and Acronyms
Mineta Transportation Institute

Mineta Transportation Institute
119
BIBLIOGRAPHY
Ajzen, Icek. “The Theory of Planned Behavior.” Organizational Behavior and Human Decision Processes 50, no. 2 (1991): 179–211.
Ajzen, Icek, and Martin Fishbein. Understanding Attitudes and Predicting Social Behavior. Englewood Cliffs: Prentice-Hall, 1980.
Anable, Jillian. “‘Complacent Car Addicts’ or ‘Aspiring Environmentalists’? Identifying Travel Behaviour Segments Using Attitude Theory.” Transport Policy 12, no. 1 (2005): 65–78.
Baldassare, Mark. “PPIC Statewide Survey: Californians and Their Government, July 2001.” San Francisco: Public Policy Institute of California, 2001.
———. “PPIC Statewide Survey: Special Survey of the Central Valley, April 2002.” San Francisco: Public Policy Institute of California, 2002.
———. “PPIC Statewide Survey: Special Survey on Californians and the Environment, June 2002.” San Francisco: Public Policy Institute of California, June 2002.
———. “PPIC Statewide Survey: Special Survey of Orange County, December 2002.” Irvine: Public Policy Institute of California and the School of Social Ecology at the University of California, Irvine, 2002.
———. “PPIC Statewide Survey: Special Survey on California's Fiscal System.” San Francisco: Public Policy Institute of California, 2004.
———. “PPIC Statewide Survey: Special Survey on Californians and the Environment, July 2006.” San Francisco: Public Policy Institute of California, 2006.
———. “PPIC Statewide Survey: Californians and the Future, September 2006.” San Francisco: Public Policy Institute of California, 2006.
Bagley, Michael N., Patricia L. Mokhtarian, and Ryuchi Kitamura. “A Methodology for the Disaggregate, Multidimensional Measurement of Residential Neighborhood Type.” Urban Studies 39, no. 4 (2000): 689–704.
Brown, Cheryl. “Consumers’ Preferences for Locally Produced Food: A Study in Southeast Missouri.” American Journal of Alternative Agriculture 18, no. 4 (2003): 213–224.
Byrne, Michael R., and Michael J. Polonsky. “Impediments to Consumer Adoption of Sustainable Transportation—Alternative Fuel Vehicles.” International Journal of Operations & Production Management 21, no. 12 (2001): 1521–1538.
Cambridge Systematics, Mercator Advisors, Alan E. Pisarski, and Martin Wachs. NCHRP 20-24(49): Future Financing Options to Meet Highway and Transit Needs. Washington DC: Transportation Research Board, December 2006.

120 Bibliography
Mineta Transportation Institute
Chapman, James. “Luxury Cars to Be Charged £25 Tax under Britain’s First Pollution Tax.” Daily Mail (London), August 8, 2007.
Collins, Christy M., and Susan M. Chambers. “Psychological and Situational Influences on Commuter-Transport-Mode Choice.” Environment and Behavior 37, no. 5 (2005): 640–661.
Coogan, Matthew A., Karla H. Karash, Thomas Adler, and James Sallis. “The Role of Personal Values, Urban Form, and Auto Availability in the Analysis of Walking for Transportation.” American Journal of Health Promotion 21, no. 4 (2007): 363–370.
De Pelsmacker, Patrick, Liesbeth Driesen, and Glenn Rayp. “Do Consumers Care About Ethics? Willingness to Pay for Fair-Trade Coffee.” Journal of Consumer Affairs 39, no. 2 (2005): 363–385.
Diamantopoulos, Adamantios, Bodo B. Schlegelmilch, Rudolf R. Sinkovics, and Greg M. Bohlen. “Can Socio-Demographics Still Play a Role in Profiling Green Consumers? A Review of the Evidence and an Empirical Investigation.” Journal of Business Research 56, no. 6 (2003): 465–480.
Dill, Jennifer, and Asha Weinstein. “How to Pay for Transportation? A Survey of Public Preferences in California.” Transport Policy 14, no. 4 (2007): 346–356.
Dunlap, Riley E. “The Impact of Political Orientation on Environmental Attitudes and Actions.” Environment and Behavior 7, no. 4 (1975), 428–454.
Dunlap, Riley E., and Kent D. Van Liere. “New Environmental Paradigm.” Journal of Environmental Education 9, no. 4 (1978): 10–19.
Dunlap, Riley E., Kent D. Van Liere, Angela G. Mertig, and Robert E. Jones. “Measuring Endorsement of the New Ecological Paradigm: A Revised NEP Scale.” Journal of Social Issues 56, no. 3 (2000): 425–442.
Ewing, Gordon, and Emine Sarigollu. “Assessing Consumer Preferences for Clean-Fuel Vehicles: A Discrete Choice Experiment.” Journal of Public Policy & Marketing 19, no. 1 (2000): 106–118.
Fairbank, Maslin, Maullin & Associates. “Los Angeles County Transportation Ballot Measure Survey 2007.”
Flamm, Bradley J. “Environmental Knowledge, Environmental Attitudes, and Vehicle Ownership and Use.” Ph.D. dissertation, University of California, Berkeley, 2006.
Gardner, Benjamin, and Charles Abraham. “Psychological Correlates of Car Use: A Meta-Analysis” 11, no. 4 (2008): 300–311.

Mineta Transportation Institute
Bibliography 121
Gossling, Stefan, Timo Kunkel, Kim Schumacher, Nadine Heck, Johannes Birkemeyer, Jens Froese, Nils Naber, and Elke Schliermann. “A Target-Group Specific Approach To ‘Green’ Power Retailing: Students as Consumers of Renewable Energy.” Renewable and Sustainable Energy Reviews 9, no. 1 (2005): 69–83.
Gurikova, Tatyana, and Stacy C. Davis. Transportation Energy Survey Data Book 1.1, Oak Ridge National Laboratory, ORNL/SUB/02-4000008627/01, May 2002. http://www-cta.ornl.gov/cta/Publications/Reports/ORNL_SUB_02-4000008627_01.pdf (accessed July 20, 2009).
Handy, Susan, Xinyu Y. Cao, and Patricia L. Mokhtarian. “Self-Selection in the Relationship between the Built Environment and Walking—Empirical Evidence from Northern California.” Journal of the American Planning Association, 72, no. 1 (2006): 55–74.
Harris, Brian, and David Burress. “Demands for Local and Organic Produce: A Brief Review of the Literature.” Lawrence, KS: Institute for Public Policy and Business Research, University of Kansas, 2000.
Hybridcenter.org. State and Federal Hybrid Incentives (2007). http://go.ucsusa.org/hybridcenter/incentives.cfm#CA (accessed July 3, 2008).
Jensen, Kim, Paul Jakus, Burton English, and Jamey Menard. “Market Participation and Willingness to Pay for Environmentally Certified Products.” Forest Science 49, no. 4 (2003): 632–641.
Kahn, Matthew E. “Do Greens Drive Hummers or Hybrids? Environmental Ideology as a Determinant of Consumer Choice.” Journal of Environmental Economics and Management 54, no. 2 (2007): 129–145.
Kitamura, Ryuichi, Patricia L. Mokhtarian, and Laura Laidet. “A micro-Analysis of Land Use and Travel in Five Neighborhoods in the San Francisco Bay Area.” Transportation 24, no. 2 (May 1997): 125–158.
Krupnick, Alan, Winston Harrington, and Anna Alberini. “Public Support for Pollution Fee Policies for Motor Vehicles with Revenue Recycling: Survey Results.” Regional Science and Urban Economics 31, no. 4 (2001): 505–522.
Krystallis, Athanasios, and George Chryssohoidis. “Consumers’ Willingness to Pay for Organic Food—Factors That Affect It and Variation Per Organic Product Type.” British Food Journal 107, no. 4-5 (2005): 320–343.
Kubik, Michelle. “Consumer Views on Transportation and Energy (Third Edition).” Golden, Colorado: National Renewable Energy Laboratory, 2006.
Kunert, Uwe, and Hartmut Kuhfeld. “The Diverse Structures of Passenger Car Taxation in Europe and the EU Commissions Proposal for Reform.” Transport Policy 14, no. 4 (2007): 306–316.

122 Bibliography
Mineta Transportation Institute
Laroche, Michel, Jasmin Bergeron, and Guido Barbaro-Forleo. “Targeting Consumers Who Are Willing to Pay More for Environmentally Friendly Products.” Journal of Consumer Marketing 18, no. 6 (2001): 503–520.
Lazzari, Salvatore. Tax Credits for Hybrid Vehicles - CRS Report for Congress. February 7, 2008. http://ncseonline.org/NLE/CRSreports/08Mar/RS22558.pdf (accessed July 3, 2008).
Lawrence, Gary C. A Two-Phase Study of Attitudes of Washington State Voters toward Transportation Issues (prepared for Washington State Transportation Commission). April 11, 2006. http://www.wstc.wa.gov/Tolling/Analysis_AttitWaStateVoters.pdf (accessed August 22, 2006).
Lockie, Stewart, Kristen Lyons, Geoffrey Lawrence, and Janet Grice. “Choosing Organics: A Path Analysis of Factors Underlying the Selection of Organic Food among Australian Consumers.” Appetite 43, no. 2 (2004): 135–146.
London, James B., Jason M. Peek, Ellen W. Saltzman, and H. Günsel Günaydin. “Transportation Needs and Funding Alternatives: A Survey.” In Transportation Funding Series Special Report No. 1. Clemson, SC: The Jim Self Center on the Future, Clemson University, 2001. Available at http://www.strom.clemson.edu/publications/london/TNFAsurvey1.pdf#search=%22’Transportation%20needs%20and%20funding%20alternatives%3A%20a%20survey%22S (accessed on August 22, 2006).
Loureiro, Maria L., and Susan Hine. “Preferences and Willingness to Pay for GM Labeling Policies.” Food Policy 29, no. 5 (2004): 467–483.
Menges, Roland, Carsten Schroder, and Stefan Traub. “Altruism, Warm Glow and the Willingness-to-Donate for Green Electricity: An Artefactual Field Experiment.” Environmental and Resource Economics 31, no. 4 (2005): 431–458.
Mourato, Susana, Bob Saynor, and David Hart. “Greening London’s Black Cabs: A Study of Driver’s Preferences for Fuel Cell Taxis.” Energy Policy 32, no. 5 (2004): 685–695.
Myers, Dowell, John Pitkin, and Julie Park. “California Homeowners’ Growing Stake in Infrastructure and the Future.” Los Angeles: The Keston Institute for Infrastructure, 2006. http://www.usc.edu/schools/sppd/keston/pdf/cal-homeowners-stake.pdf (accessed March 22, 2009).
Nomura, Noboru, and Makato Akai. “Willingness to Pay for Green Electricity in Japan as Estimated through Contingent Valuation Method.” Applied Energy 78, no. 4 (2004): 453-463.
National Surface Transportation Policy and Revenue Study Commission. Transportation for Tomorrow: Report of the National Surface Transportation Policy and Revenue Study Commission. Washington DC: The Commission, December 2007.

Mineta Transportation Institute
Bibliography 123
Owens, Richard. “Congestion Fee Leaves Milan in a Jam.” The Times (London), January 3, 2008.
Potoglou, Dimitris, and Pavlos S. Kanaroglou. “Household Demand and Willingness to Pay for Clean Vehicles.” Transportation Research Part D 12, no. 4 (2007): 264–274.
Radman, Marija. “Consumer Consumption and Perception of Organic Products in Croatia.” British Food Journal 107, no. 4 (2005): 263–273.
Roe, Brian, Mario F. Teisl, Alan Levy, and Matthew Russell. “U.S. Consumers’ Willingness to Pay for Green Electricity.” Energy Policy 29, no. 11 (2001): 917–925.
Schultz, P. Wesley, and William F. Stone. “Authoritarianism and Attitudes Toward the Environment: Field and Laboratory Perspective.” Environment and Behavior 26, no. 11 (1994): 25–37.
Schwartz, Shalom H. “Elicitation of Moral Obligation and Self-Sacrificing Behavior: An Experimental Study of Volunteering to Be a Bone Marrow Donor.” Journal of Personality and Social Psychology 15, no. 4 (1970): 283–293.
———. “Normative Influences on Altruism.” In Advances in Experimental Social Psychology, edited by L. Berkowitz, 221–279. New York: Academic Press, 1977.
———. Annual Estimates for the Population for Counties of California: April 1, 2000–July 1, 2007 (CO-EST2007-01-06). http://census.gov/popest/counties/tables/CO-EST2007-01-06.xls (accessed March 3, 2009).
Transportation Research Board. Special Report 285: The Fuel Tax and Alternatives for Transportation Funding. Washington, DC: Transportation Research Board of the National Academies, 2005.
Uchitelle, Louis, and Megan Thee. “Americans Are Cautiously Open to Gas Tax Rise, Poll Shows.” New York Times, February 28, 2006, 14.
U.S. Bureau of the Census. “Selected Social Characteristics in California: 2006.” Results from the 2006 American Community Survey. http://factfinder.census.gov (accessed March 3, 2009).
U. S. Bureau of the Census. Annual Estimates for the Population for Counties of California: April 1, 2000–July 1, 2007. (CO-EST2007-01-06), http://census.gov/popest/counties/tables/CO-EST2007-01-06.xls (accessed March 3, 2009).

124 Bibliography
Mineta Transportation Institute
Weinstein, Asha, Jennifer Dill, Todd Goldman, John Hall, Franziska Holtzman, Joe Recker, and Eileen Goodwin. Transportation Financing Opportunities for the State of California. San José, CA: Mineta Transportation Institute, College of Business, San José State University, October 2006. http://transweb.sjsu.edu/mtiportal/research/publications/documents/06-01/TransportFinanceOpps5_020107.pdf (accessed on July 5, 2008).
Wiser, Ryan H., Meredith Fowlie, and Edward A. Holt. “Public Goods and Private Interests: Understanding Non-Residential Demand for Green Power.” Energy Policy 29, no. 13 (2001): 1085–1097.
YouGov. “YouGov/Evening Standard Survey Results, Fieldwork: 20th–25th March 2008.” http://i.thisislondon.co.uk/i/pix/2008/03/mayorsurvey.pdf (accessed on July 20, 2008).
Zarnikau, Jay. “Consumer Demand for ‘Green Power’ and Energy Efficiency.” Energy Policy 31, no. 15 (2003): 1661–1672.

Mineta Transportation Institute
125
ABOUT THE AUTHORS
ASHA WEINSTEIN AGRAWAL, PhD
Dr. Agrawal is the Director of the MTI National Transportation Finance Center, and also an Associate Professor of Urban and Regional Planning at San José State University. Her research and teaching interests in transportation policy and planning include transportation finance, pedestrian planning, and urban street design. She also works in the area of planning and transportation history. She has a BA from Harvard University in Folklore and Mythology, an MSc from the London School of Economics and Political Science in Urban and Regional Planning, and a PhD from the University of California at Berkeley in City and Regional P l a n n i n g . F o r a c o m p l e t e l i s t i n g o f h e r p u b l i c a t i o n s , s e e http://www.sjsu.edu/faculty/weinstein.agrawal.
JENNIFER DILL, PhD
Dr. Dill is an Associate Professor of Urban Studies and Planning at Portland State University, and the Director of the Center for Transportation Studies at PSU. Her research and teaching interests focus on transportation and environmental planning, travel behavior, air quality, and transportation-land use interactions. Prior to entering academia, she worked as an environmental and transportation planner for government and non-profit organizations in California. She has a BS in Environmental Policy Analysis and Planning from UC Davis, an MA in Urban Planning from University of California at Los Angeles, and a PhD. in City and Regional Planning from the University of California at Berkeley.
HILARY NIXON, PhD
Dr. Nixon is an Assistant Professor of Urban and Regional Planning at San José State University. Her research and teaching interests in the field of environmental planning and policy focus on the relationship between environmental attitudes and behavior, particularly related to waste management and linkages between transportation and the environment. She has a BA from the University of Rochester in Environmental Management and a PhD in Planning, Policy, and Design from the University of California at Irvine.

126 About the Authors
Mineta Transportation Institute

Mineta Transportation Institute
127
PEER REVIEW
San José State University, of the California State University system, and the MTI Board ofTrustees have agreed upon a peer view process to ensure that the results presented are basedupon a professionally acceptable research protocol.
Research projects begin with the approval of a scope of work by the sponsoring entities, within-process reviews by the MTI research director and the project sponsor. Periodic progressreports are provided to the MTI research director and the Research Associates Policy OversightCommittee (RAPOC). Review of the draft research product is conducted by the ResearchCommittee of the board of trustees and may include invited critiques from other professionalsin the subject field. The review is based on the professional propriety of the researchmethodology.

128 Peer Review
Mineta Transportation Institute

The Norman Y. Mineta International Institute for Surface Transportation Policy Studies (MTI) was established by Congress as part of the Intermodal Surface Transportation Efficiency Act of 1991. Reauthorized in 1998, MTI was selected by the U.S. Department of Transportation through a competitive process in 2002 as a national “Center of Excellence.” The Institute is funded by Con-gress through the United States Department of Transportation’s Research and Innovative Technology Administration, the Califor-nia Legislature through the Department of Transportation (Caltrans), and by private grants and donations.
The Institute receives oversight from an internationally respected Board of Trustees whose members represent all major surface transportation modes. MTI’s focus on policy and management resulted from a Board assessment of the industry’s unmet needs and led directly to the choice of the San José State University College of Business as the Institute’s home. The Board provides policy direction, assists with needs assessment, and connects the Institute and its programs with the international transportation community.
MTI’s transportation policy work is centered on three primary responsibilities:
MINETA TRANSPORTATION INSTITUTE
Research MTI works to provide policy-oriented research for all levels of government and the private sector to foster the development of optimum surface transportation systems. Research areas include: transportation security; planning and policy develop-ment; interrelationships among transportation, land use, and the environment; transportation finance; and collaborative labor-management relations. Certified Research Associates conduct the research. Certification requires an advanced degree, gener-ally a Ph.D., a record of academic publications, and professional references. Research projects culminate in a peer-reviewed publication, available both in hardcopy and on TransWeb, the MTI website (http://transweb.sjsu.edu).
Education The educational goal of the Institute is to provide graduate-level education to students seeking a career in the development and operation of surface transportation programs. MTI, through San José State University, offers an AACSB-accredited Master of Sci-ence in Transportation Management and a graduate Certificate in Transportation Management that serve to prepare the nation’s transportation managers for the 21st century. The master’s de-gree is the highest conferred by the California State University system. With the active assistance of the California Department
of Transportation, MTI delivers its classes over a state-of-the-art videoconference network throughout the state of California and via webcasting beyond, allowing working transportation professionals to pursue an advanced degree regardless of their location. To meet the needs of employ-ers seeking a diverse workforce, MTI’s education program promotes enrollment to under-represented groups.
Information and Technology Transfer MTI promotes the availability of completed research to professional organizations and journals and works to integrate the research findings into the graduate education program. In addition to publishing the studies, the Institute also sponsors symposia to disseminate research results to transportation professionals and encourages Research As-sociates to present their findings at conferences.The World in Motion, MTI’s quarterly newsletter, covers innovation in the Institute’s research and education programs. MTI’s extensive collection of transportation-related publications is integrated into San José State University’s world-class Martin Luther King, Jr. Library.
The contents of this report reflect the views of the authors, who are responsible for the facts and accuracy of the information presented here-in. This document is disseminated under the sponsorship of the U.S. Department of Transportation, University Transportation Centers Program and the California Department of Transportation, in the interest of information exchange. This report does not necessarily reflect the official views or policies of the U.S. government, State of California, or the Mineta Transportation Institute, who assume no liability for the contents or use thereof.This report does not constitute a standard specification, design standard, or regulation.
DISCLAIMER
MTI FOUNDER Hon. Norman Y. Mineta
MTI BOARD OF TRUSTEESRebecca BrewsterPresident/COOAmerican TransportationResearch InstituteSmyrna, GA
Donald H. CamphPresidentCalifornia Institute for Technology ExchangeLos Angeles, CA
Anne P. CanbyPresidentSurface TransportationPolicy ProjectWashington, DC
Jane ChmielinskiPresidentDMJM Harris
New York, NY
William DoreyPresident/CEOGranite Construction, Inc.
Watsonville, CA
Mortimer DowneyChairmanPB Consult Inc.
Washington, DC
Nuria FernandezCommissionerCity of Chicago,Department of Aviation,
Chicago, IL
Steve HemingerExecutive DirectorMetropolitan TransportationCommissionOakland, CA
Hon. John Horsley #
Executive DirectorAmerican Association of StateHighway & TransportationOfficials (AASHTO)Washington, DC
Joseph BoardmanPresident/CEOAmtrak60 Massachusetts Ave., N.E.Washington, DC 20002
Will KemptonDirectorCalifornia Department of TransportationSacramento, CA
Brian MacleodSenior Vice PresidentGillig Corporation
Hayward, CA
Dr. Bruce MagidDeanCollege of BusinessSan José State UniversitySan José, CA
Stephanie PinsonPresident/COOGilbert Tweed Associates, Inc.New York, NY
Hans RatSecretary GeneralUnion Internationale desTransports PublicsBruxelles, Belgium
Vickie ShafferGeneral ManagerTri-State Transit AuthorityHuntington, WV
Paul Toliver #
PresidentNew Age IndustriesSeattle, WA
Michael S. Townes #
President/CEOTransportation DistrictCommission of Hampton Roads
Hampton, VA
Edward WytkindPresidentTransportation TradesDepartment, AFL-CIOWashington, DC
National Transportation Security Center
Asha Weinstein Agrawal, PhDUrban and Regional Planning San José State University
Jan Botha, PhDCivil & Environmental Engineering San José State University
Katherine Kao Cushing, PhDEnviromental Science San José State University
Dave Czerwinski, PhDMarketing and Decision Science San José State University
Frances Edwards, PhDPolitical Science San José State University
Taeho Park, PhDOrganization and Management San José State University
Diana WuMartin Luther King, Jr. Library San José State University
Honorary Co-ChairHon. James Oberstar **
ChairHouse Transportation and Infrastructure CommitteeHouse of Representatives Washington, DC
Honorary Co-Chair
Hon. John L. Mica **
Ranking MemberHouse Transportation and Infrastructure CommitteeHouse of Representatives Washington, DC
David L. Turney *
Chair/President/CEODigital Recorders, Inc.Dallas, TX
William W. Millar ^
Vice Chair/PresidentAmerican Public Transportation Association (APTA)Washington, DC
Hon. Rod Diridon, Sr. #
Executive DirectorMineta Transportation InstituteSan Jose, CA
Ronald BarnesGeneral ManagerVeolia Transportation/EastValley RPTA
Mesa, AZ
DirectorsHon. Rod Diridon, Sr.Executive Director
Karen E. Philbrick, PhDResearch Director
Peter Haas, PhDEducation Director
Donna MaurilloCommunications Director
Asha Weinstein Agrawal, PhDNational Transportation Finance Center
Brian Michael Jenkins
Research Associates Policy Oversight Committee
** Honorary* Chair^ Vice Chair# Past Chair

“Green” Transportation Taxes and Fees: A Survey Of Californians
MTI Report 08-05
Funded by U.S. Department of Transportation and California Department of Transportation
MT
I“G
reen” Transportation T
axes and Fees: A Survey O
f Californians
MT
I Report 08-05June 2009