Green Star - Interiors Potable Water Calculator Guide · Heat Rejection Water 13 Calculation...
36
Green Star Potable Water Calculator Guide Date Issued: October 2012 changelog Version Release Date Description of Changes 1.0 August 2010 Release for Green Star – Custom 1.1 January 2012 Amended Rainwater section. 1.2 October 2012 Made applicable to Green Star – Interiors & Green Star – Public Building
Transcript of Green Star - Interiors Potable Water Calculator Guide · Heat Rejection Water 13 Calculation...
Green Star
Potable Water Calculator Guide Date Issued: October 2012
changelog
Version Release Date Description of Changes
1.0 August 2010 Release for Green Star – Custom
1.1 January 2012 Amended Rainwater section.
1.2 October 2012 Made applicable to Green Star – Interiors & Green Star – Public Building
Green Star – Potable Water Calculator Guide --2
Date issued: 12 October 2012
Table of Contents
1. Introduction 4
2. The Water Category 5
How points are awarded in the ‘Potable Water’ credit 5
3. Building Information 6
Calculation methodology 6
Data entry requirement 7
4. Fixtures and Fittings 10
Calculation methodology 10
Data entry requirement 11
Standard Practice Benchmark Water Efficiency 12
Additional Guidance 12
5. Heat Rejection Water 13
Calculation methodology 13
Data entry requirements 14
Benchmark water efficiency 14
6. Landscape Irrigation 15
Calculation methodology 15
Data entry requirements 16
Standard Practice Benchmark Water Efficiency 19
7. Reclaimed water use 21
Demand for reclaimed water 21
Rainwater 23
Greywater and Blackwater 27
Stormwater 28
Off-site supply of Reclaimed water 28
8. Green Star Sewerage Calculator 29
9. Green Star Greenhouse Gas Emissions Calculator 30
10. References 30
Appendix A. Crop coefficient (Kc) 31
Green Star – Potable Water Calculator Guide --3
Date issued: 12 October 2012
List of tables
Table 1 ‘Points Allocation for the Green Star Potable Waster credit’ ................................................................................ 5
Table 2 ‘Default occupancy profiles included in the calculator’ ......................................................................................... 8
Table 3 ‘Assumed usage rates of toilets, urinals and taps’ ............................................................................................. 11
Table 4 ‘Assumed percentage of staff that use showers’ ............................................................................................... 11
Table 5 ‘Standard Practice Benchmark water efficiency’ ................................................................................................ 12
Table 6 ‘Heat Rejection Water Constants’ ...................................................................................................................... 13
Table 7 ‘Standard Practice Benchmarks’ ........................................................................................................................ 14
Table 8 ‘Landscape Irrigation Definitions and Further Information’ ................................................................................ 16
Table 9 ‘Sample rainfall and point potential evapotranspiration data from the BoM for grid coordinates -37.87
(Latitude), 145.26 (Longitude)’ ........................................................................................................................................ 17
Table 10 ‘Microclimate factors’ ........................................................................................................................................ 18
Table 11 ‘Planting density factors’................................................................................................................................... 18
Table 12 ‘Application efficiencies of common irrigation systems’ ................................................................................... 19
Table 13 ‘Water Efficiency Benchmarks’ ......................................................................................................................... 20
Table 14 ‘Run-off coefficients’ ......................................................................................................................................... 24
Table 15 ‘Run-off Coefficients’ ........................................................................................................................................ 26
Table 16 ‘Tree Crop Coefficient’...................................................................................................................................... 32
Table 17 ‘Shrub Crop Coefficient’ ................................................................................................................................... 34
Table 18 ‘Climbers Crop Coefficient’ ............................................................................................................................... 35
Table 19 ‘Ground Cover Crop Coefficient’ ...................................................................................................................... 36
Table 20 ‘Additional Crop Coefficients’ ........................................................................................................................... 36
List of Figures
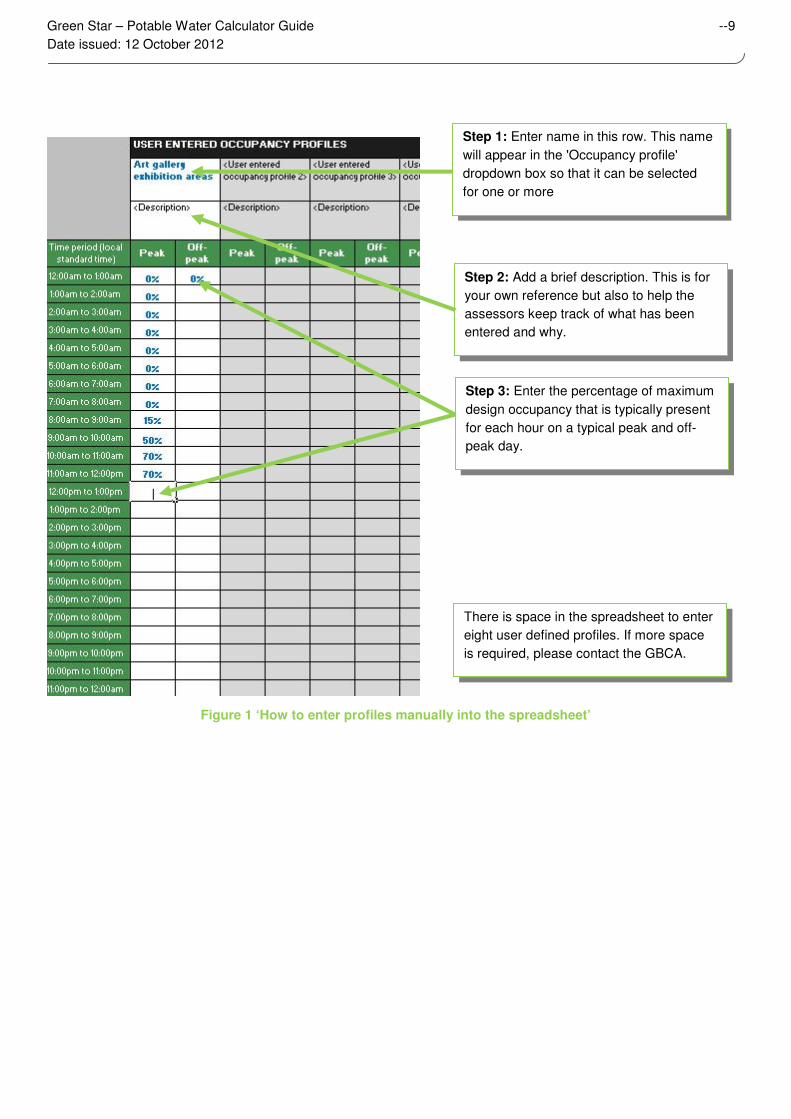
Figure 1 ‘How to enter profiles manually into the spreadsheet’ 9

Green Star – Potable Water Calculator Guide --4
Date issued: 12 October 2012
1. Introduction
The Green Building Council of Australia (GBCA) has developed a Potable Water Calculator (the Calculator) used in
Green Star to estimate potable water consumption in buildings. The Calculator returns the number of points awarded
for the Green Star credit ‘‘Potable Water’. This guide should be used in conjunction with the Potable Water Calculator
in Green Star. The Calculator is embedded in the Green Star Rating Tool calculators.
The Calculator determines the points awarded based on the usage of potable water in toilets, bathroom taps, kitchen
taps, urinals, showers, heat rejection systems and landscape irrigation.
The water usage is calculated for each month. The total water demand from each of the water uses is added for each
month and the available re-used water is subtracted for each month, to calculate a total monthly potable water
demand. An annual potable water demand is calculated by adding the monthly potable water demands.
Total monthly
potable water
demand
=
Monthly
water
demand for
fixtures and
fittings
+
Monthly
water
demand for
landscape
irrigation
+
Monthly water
demand for
heat rejection
-
Monthly supply of non-potable
water
(rainwater, greywater,
blackwater, stormwater and off-
site supply.
A monthly calculation methodology is used to provide sensitivity to the seasonal variations in demand for water and in
supply of water for re-use.
It should be noted that the GBCA assumes that thorough calculations and dimensioning of all components in the water
recycling system have been undertaken in addition to the Green Star submission. The GBCA will not accept any
responsibility for the dimensioning and functionality of the water recycling and re-use designs that are being assessed
under Green Star.
Green Star – Potable Water Calculator Guide --5
Date issued: 12 October 2012
2. The Water Category
How points are awarded in the ‘Potable Water’ credit
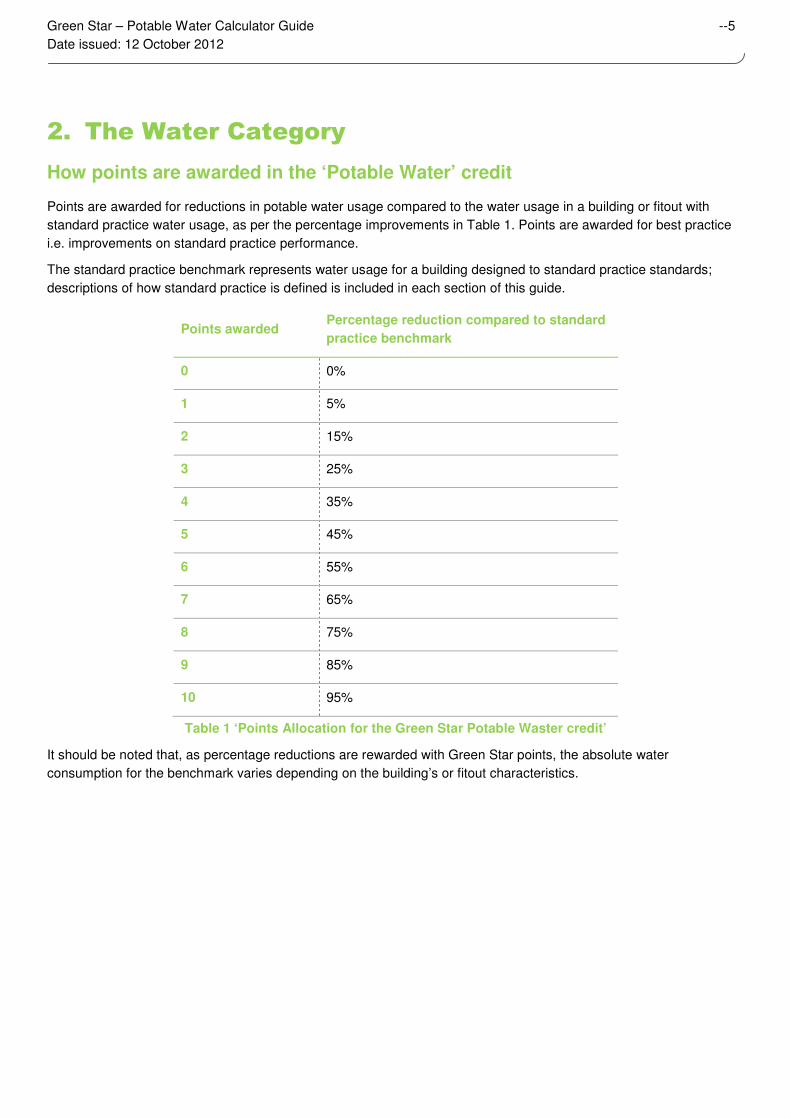
Points are awarded for reductions in potable water usage compared to the water usage in a building or fitout with
standard practice water usage, as per the percentage improvements in Table 1. Points are awarded for best practice
i.e. improvements on standard practice performance.
The standard practice benchmark represents water usage for a building designed to standard practice standards;
descriptions of how standard practice is defined is included in each section of this guide.
Points awarded Percentage reduction compared to standard
practice benchmark
0 0%
1 5%
2 15%
3 25%
4 35%
5 45%
6 55%
7 65%
8 75%
9 85%
10 95%
Table 1 ‘Points Allocation for the Green Star Potable Waster credit’
It should be noted that, as percentage reductions are rewarded with Green Star points, the absolute water
consumption for the benchmark varies depending on the building’s or fitout characteristics.
Green Star – Potable Water Calculator Guide --6
Date issued: 12 October 2012
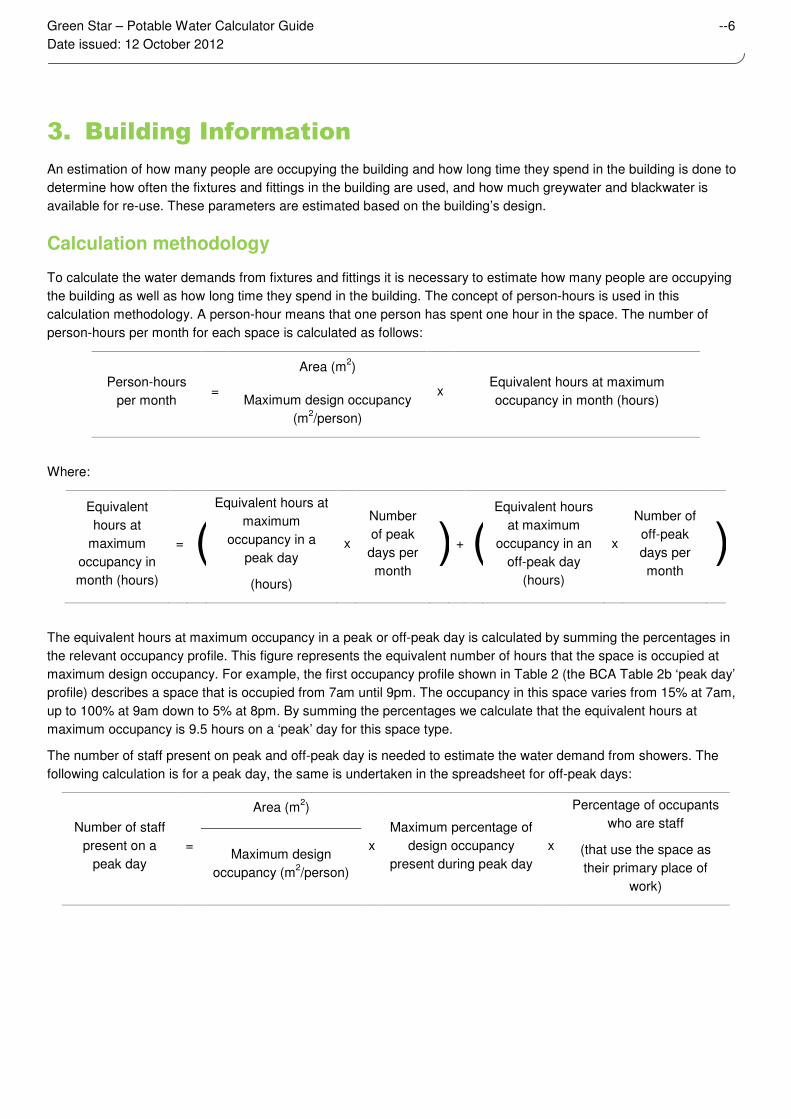
3. Building Information
An estimation of how many people are occupying the building and how long time they spend in the building is done to
determine how often the fixtures and fittings in the building are used, and how much greywater and blackwater is
available for re-use. These parameters are estimated based on the building’s design.
Calculation methodology
To calculate the water demands from fixtures and fittings it is necessary to estimate how many people are occupying
the building as well as how long time they spend in the building. The concept of person-hours is used in this
calculation methodology. A person-hour means that one person has spent one hour in the space. The number of
person-hours per month for each space is calculated as follows:
Person-hours
per month =
Area (m2)
x Equivalent hours at maximum
occupancy in month (hours) Maximum design occupancy
(m2/person)
Where:
Equivalent
hours at
maximum
occupancy in
month (hours)
= (Equivalent hours at
maximum
occupancy in a
peak day
(hours)
x
Number
of peak
days per
month
) + (Equivalent hours
at maximum
occupancy in an
off-peak day
(hours)
x
Number of
off-peak
days per
month
)
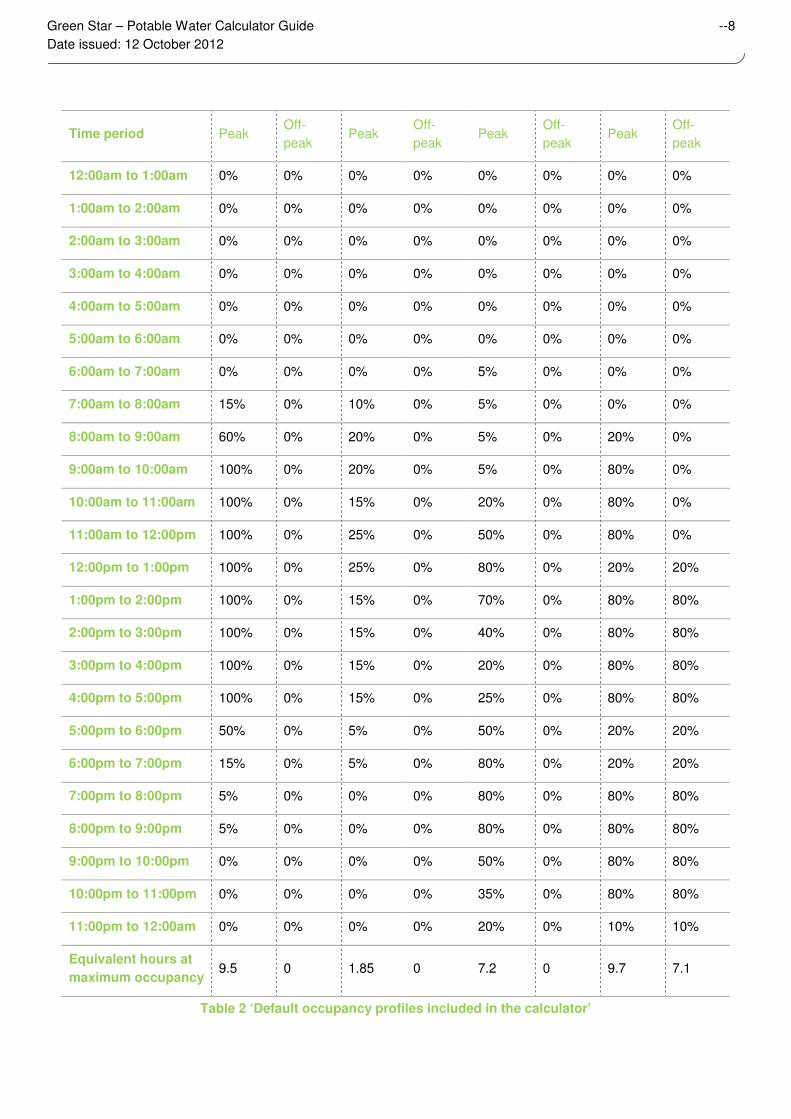
The equivalent hours at maximum occupancy in a peak or off-peak day is calculated by summing the percentages in
the relevant occupancy profile. This figure represents the equivalent number of hours that the space is occupied at
maximum design occupancy. For example, the first occupancy profile shown in Table 2 (the BCA Table 2b ‘peak day’
profile) describes a space that is occupied from 7am until 9pm. The occupancy in this space varies from 15% at 7am,
up to 100% at 9am down to 5% at 8pm. By summing the percentages we calculate that the equivalent hours at
maximum occupancy is 9.5 hours on a ‘peak’ day for this space type.
The number of staff present on peak and off-peak day is needed to estimate the water demand from showers. The
following calculation is for a peak day, the same is undertaken in the spreadsheet for off-peak days:
Number of staff
present on a
peak day
=
Area (m2)
x
Maximum percentage of
design occupancy
present during peak day
x
Percentage of occupants
who are staff
(that use the space as
their primary place of
work)
Maximum design
occupancy (m2/person)

Green Star – Potable Water Calculator Guide --7
Date issued: 12 October 2012
Data entry requirement
The building should be divided into space types with different occupancy levels and patterns. For more information on
how to do this, refer to Appendix A of the Green Star Greenhouse Gas Emissions Calculator Guide. The following data
must be entered for all occupied1 space types:
1. Area, entered in m2
2. Number of ’peak’ days of operation per week - the number of days per typical week the space is occupied as
described in the relevant ‘peak’ occupancy profile. The remaining days are assumed to follow the off-peak profile.
3. Occupancy profiles – the way the space is occupied must be entered by either:
a. Selecting one of the four sets of default occupancy profiles (the default occupancy profiles are based on
those included in Section J of the BCA 2010, see Table 2 ‘Default occupancy profiles included in the
calculator’; or
b. Entering peak and off-peak profiles into the spreadsheet manually. This options should be used where
none of the existing profiles are suitable for the space type (see Figure 1 ‘How to enter profiles manually
into the spreadsheet’),
The profiles used in this Calculator must correlate with those used in the Greenhouse Gas Emissions Calculator.
4. Maximum design occupancy – the maximum design occupancy must be entered by either:
a. Selecting one of the default values as per table D1.13 of the BCA 2010; or
b. Entering the maximum design occupancy manually.
5. Percentage of occupants who are staff, and use the space as their primary place of work – for example, in an
office, 100% of occupants can be assumed to be staff that uses the space as their primary place of work, whereas
in an exhibition space, perhaps only 5% of occupants would be staff. This figure needs to be determined by the
design team. It is used to estimate the number of staff in the building, a parameter required to calculate the water
demand from showers (it is assumed that only staff will use the shower facilities). Only the staff that uses the
space as primary places of work must be included in the percentage entered; this is so that staff are not double-
counted as they move around the building.
BCA Table 2b
(Class 5 building,
Class 8
laboratory or
Class 9a clinic,
Day surgery or
procedure unit)
BCA Table 2c
(Class 6 shop or
shopping centre)
BCA Table 2d
(Class 6
restaurant or
cafe)
BCA Table 2f
(Class 9b theatre
or cinema)
1 Occupied spaces include all spaces in the building except for those with no or low/transient occupancy such as
stairwells, corridors and storage rooms.
Green Star – Potable Water Calculator Guide --8
Date issued: 12 October 2012
Time period Peak Off-
peak Peak
Off-
peak Peak
Off-
peak Peak
Off-
peak
12:00am to 1:00am 0% 0% 0% 0% 0% 0% 0% 0%
1:00am to 2:00am 0% 0% 0% 0% 0% 0% 0% 0%
2:00am to 3:00am 0% 0% 0% 0% 0% 0% 0% 0%
3:00am to 4:00am 0% 0% 0% 0% 0% 0% 0% 0%
4:00am to 5:00am 0% 0% 0% 0% 0% 0% 0% 0%
5:00am to 6:00am 0% 0% 0% 0% 0% 0% 0% 0%
6:00am to 7:00am 0% 0% 0% 0% 5% 0% 0% 0%
7:00am to 8:00am 15% 0% 10% 0% 5% 0% 0% 0%
8:00am to 9:00am 60% 0% 20% 0% 5% 0% 20% 0%
9:00am to 10:00am 100% 0% 20% 0% 5% 0% 80% 0%
10:00am to 11:00am 100% 0% 15% 0% 20% 0% 80% 0%
11:00am to 12:00pm 100% 0% 25% 0% 50% 0% 80% 0%
12:00pm to 1:00pm 100% 0% 25% 0% 80% 0% 20% 20%
1:00pm to 2:00pm 100% 0% 15% 0% 70% 0% 80% 80%
2:00pm to 3:00pm 100% 0% 15% 0% 40% 0% 80% 80%
3:00pm to 4:00pm 100% 0% 15% 0% 20% 0% 80% 80%
4:00pm to 5:00pm 100% 0% 15% 0% 25% 0% 80% 80%
5:00pm to 6:00pm 50% 0% 5% 0% 50% 0% 20% 20%
6:00pm to 7:00pm 15% 0% 5% 0% 80% 0% 20% 20%
7:00pm to 8:00pm 5% 0% 0% 0% 80% 0% 80% 80%
8:00pm to 9:00pm 5% 0% 0% 0% 80% 0% 80% 80%
9:00pm to 10:00pm 0% 0% 0% 0% 50% 0% 80% 80%
10:00pm to 11:00pm 0% 0% 0% 0% 35% 0% 80% 80%
11:00pm to 12:00am 0% 0% 0% 0% 20% 0% 10% 10%
Equivalent hours at
maximum occupancy 9.5 0 1.85 0 7.2 0 9.7 7.1
Table 2 ‘Default occupancy profiles included in the calculator’
Green Star – Potable Water Calculator Guide --9
Date issued: 12 October 2012
Figure 1 ‘How to enter profiles manually into the spreadsheet’
Step 1: Enter name in this row. This name
will appear in the 'Occupancy profile'
dropdown box so that it can be selected
for one or more
Step 2: Add a brief description. This is for
your own reference but also to help the
assessors keep track of what has been
entered and why.
Step 3: Enter the percentage of maximum
design occupancy that is typically present
for each hour on a typical peak and off-
peak day.
There is space in the spreadsheet to enter
eight user defined profiles. If more space
is required, please contact the GBCA.
Green Star – Potable Water Calculator Guide --10
Date issued: 12 October 2012
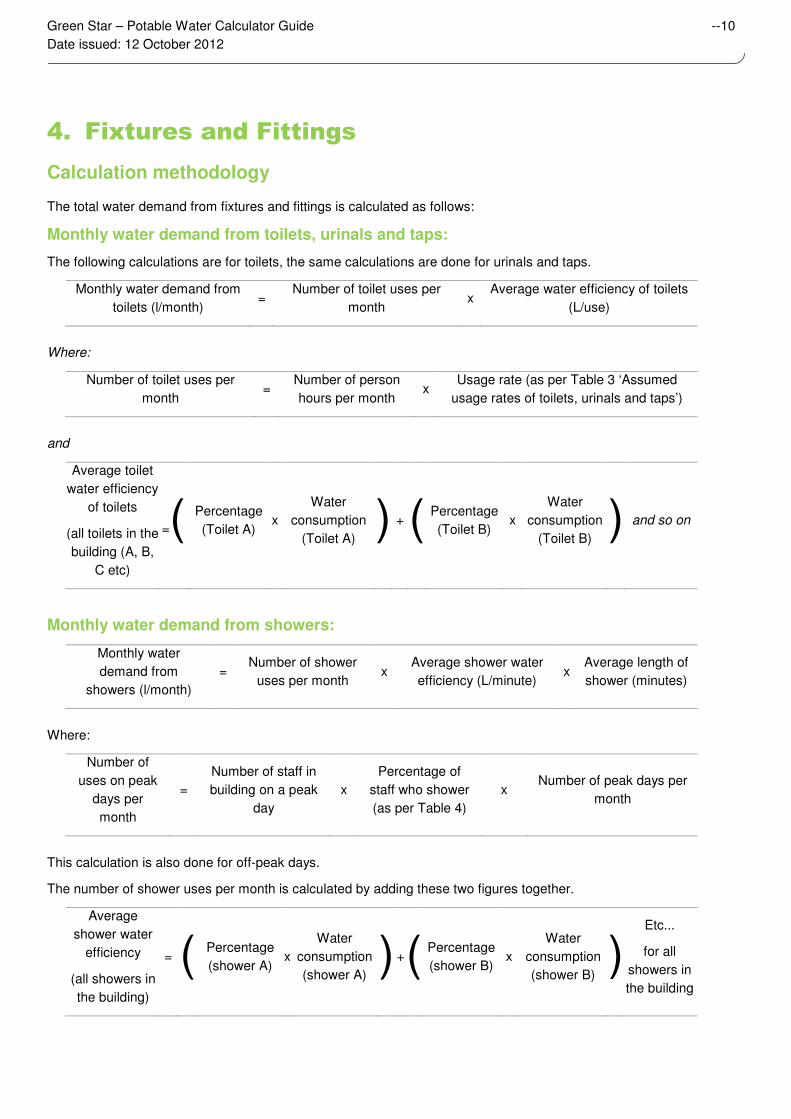
4. Fixtures and Fittings
Calculation methodology
The total water demand from fixtures and fittings is calculated as follows:
Monthly water demand from toilets, urinals and taps:
The following calculations are for toilets, the same calculations are done for urinals and taps.
Monthly water demand from
toilets (l/month) =
Number of toilet uses per
month x
Average water efficiency of toilets
(L/use)
Where:
Number of toilet uses per
month =
Number of person
hours per month x
Usage rate (as per Table 3 ‘Assumed
usage rates of toilets, urinals and taps’)
and
Average toilet
water efficiency
of toilets
(all toilets in the
building (A, B,
C etc)
=( (Percentage
(Toilet A) x
Water
consumption
(Toilet A) ) + ( Percentage
(Toilet B) x
Water
consumption
(Toilet B) ) and so on
Monthly water demand from showers:
Monthly water
demand from
showers (l/month)
= Number of shower
uses per month x
Average shower water
efficiency (L/minute) x
Average length of
shower (minutes)
Where:
Number of
uses on peak
days per
month
=
Number of staff in
building on a peak
day
x
Percentage of
staff who shower
(as per Table 4)
x Number of peak days per
month
This calculation is also done for off-peak days.
The number of shower uses per month is calculated by adding these two figures together.
Average
shower water
efficiency
(all showers in
the building)
= (( Percentage
(shower A) x
Water
consumption
(shower A) ) + ( Percentage
(shower B) x
Water
consumption
(shower B) )
Etc...
for all
showers in
the building
Green Star – Potable Water Calculator Guide --11
Date issued: 12 October 2012
and
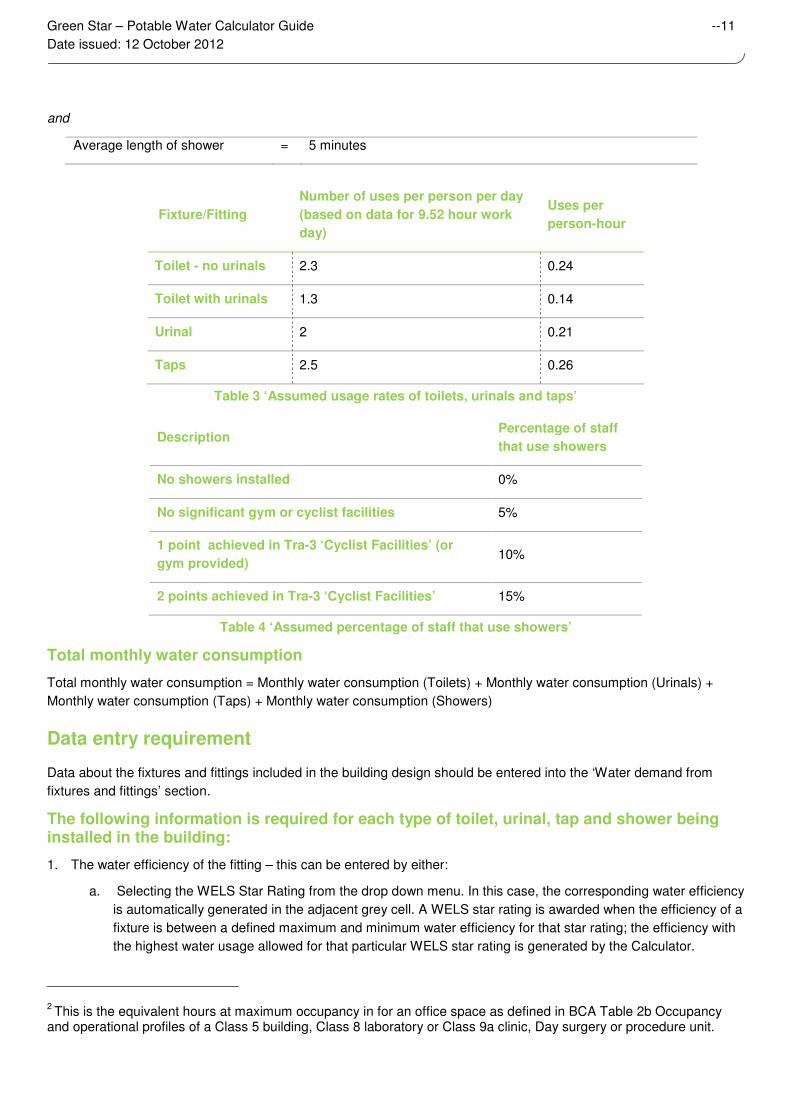
Average length of shower = 5 minutes
Fixture/Fitting
Number of uses per person per day
(based on data for 9.52 hour work
day)
Uses per
person-hour
Toilet - no urinals 2.3 0.24
Toilet with urinals 1.3 0.14
Urinal 2 0.21
Taps 2.5 0.26
Table 3 ‘Assumed usage rates of toilets, urinals and taps’
Description Percentage of staff
that use showers
No showers installed 0%
No significant gym or cyclist facilities 5%
1 point achieved in Tra-3 ‘Cyclist Facilities’ (or
gym provided) 10%
2 points achieved in Tra-3 ‘Cyclist Facilities’ 15%
Table 4 ‘Assumed percentage of staff that use showers’
Total monthly water consumption
Total monthly water consumption = Monthly water consumption (Toilets) + Monthly water consumption (Urinals) +
Monthly water consumption (Taps) + Monthly water consumption (Showers)
Data entry requirement
Data about the fixtures and fittings included in the building design should be entered into the ‘Water demand from
fixtures and fittings’ section.
The following information is required for each type of toilet, urinal, tap and shower being installed in the building:
1. The water efficiency of the fitting – this can be entered by either:
a. Selecting the WELS Star Rating from the drop down menu. In this case, the corresponding water efficiency
is automatically generated in the adjacent grey cell. A WELS star rating is awarded when the efficiency of a
fixture is between a defined maximum and minimum water efficiency for that star rating; the efficiency with
the highest water usage allowed for that particular WELS star rating is generated by the Calculator.
2 This is the equivalent hours at maximum occupancy in for an office space as defined in BCA Table 2b Occupancy
and operational profiles of a Class 5 building, Class 8 laboratory or Class 9a clinic, Day surgery or procedure unit.
Green Star – Potable Water Calculator Guide --12
Date issued: 12 October 2012
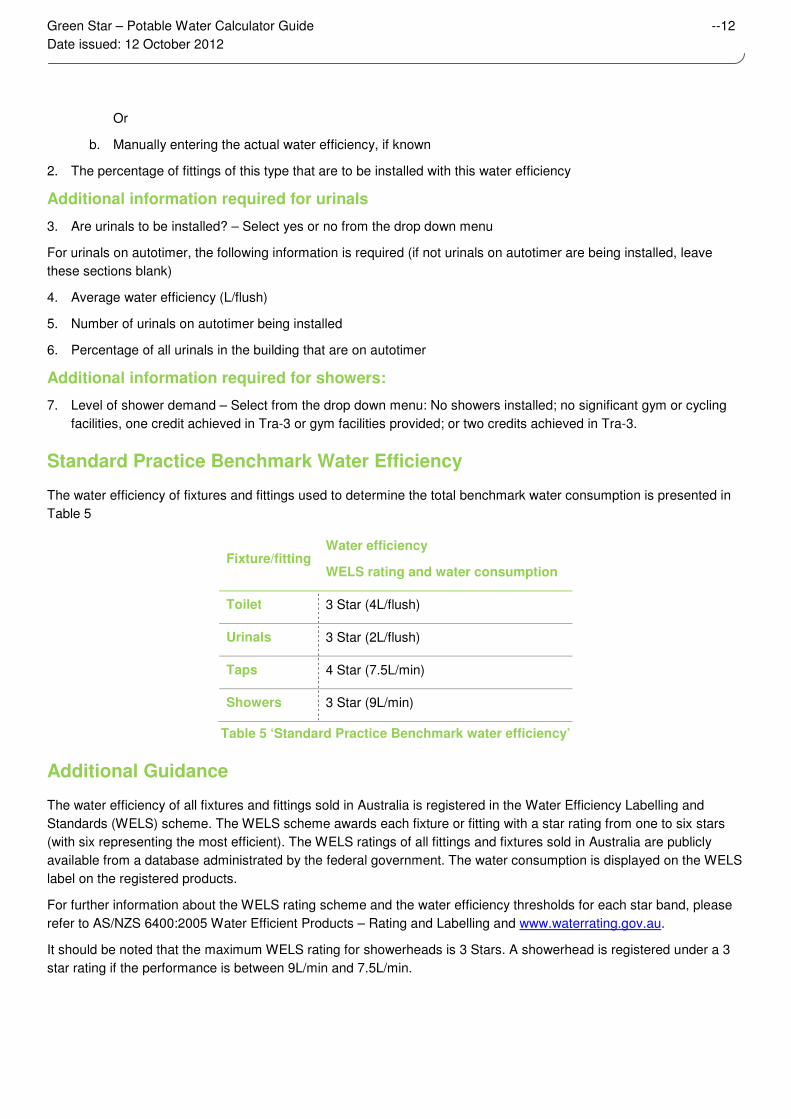
Or
b. Manually entering the actual water efficiency, if known
2. The percentage of fittings of this type that are to be installed with this water efficiency
Additional information required for urinals
3. Are urinals to be installed? – Select yes or no from the drop down menu
For urinals on autotimer, the following information is required (if not urinals on autotimer are being installed, leave
these sections blank)
4. Average water efficiency (L/flush)
5. Number of urinals on autotimer being installed
6. Percentage of all urinals in the building that are on autotimer
Additional information required for showers:
7. Level of shower demand – Select from the drop down menu: No showers installed; no significant gym or cycling
facilities, one credit achieved in Tra-3 or gym facilities provided; or two credits achieved in Tra-3.
Standard Practice Benchmark Water Efficiency
The water efficiency of fixtures and fittings used to determine the total benchmark water consumption is presented in
Table 5
Fixture/fitting Water efficiency
WELS rating and water consumption
Toilet 3 Star (4L/flush)
Urinals 3 Star (2L/flush)
Taps 4 Star (7.5L/min)
Showers 3 Star (9L/min)
Table 5 ‘Standard Practice Benchmark water efficiency’
Additional Guidance
The water efficiency of all fixtures and fittings sold in Australia is registered in the Water Efficiency Labelling and
Standards (WELS) scheme. The WELS scheme awards each fixture or fitting with a star rating from one to six stars
(with six representing the most efficient). The WELS ratings of all fittings and fixtures sold in Australia are publicly
available from a database administrated by the federal government. The water consumption is displayed on the WELS
label on the registered products.
For further information about the WELS rating scheme and the water efficiency thresholds for each star band, please
refer to AS/NZS 6400:2005 Water Efficient Products – Rating and Labelling and www.waterrating.gov.au.
It should be noted that the maximum WELS rating for showerheads is 3 Stars. A showerhead is registered under a 3
star rating if the performance is between 9L/min and 7.5L/min.
Green Star – Potable Water Calculator Guide --13
Date issued: 12 October 2012
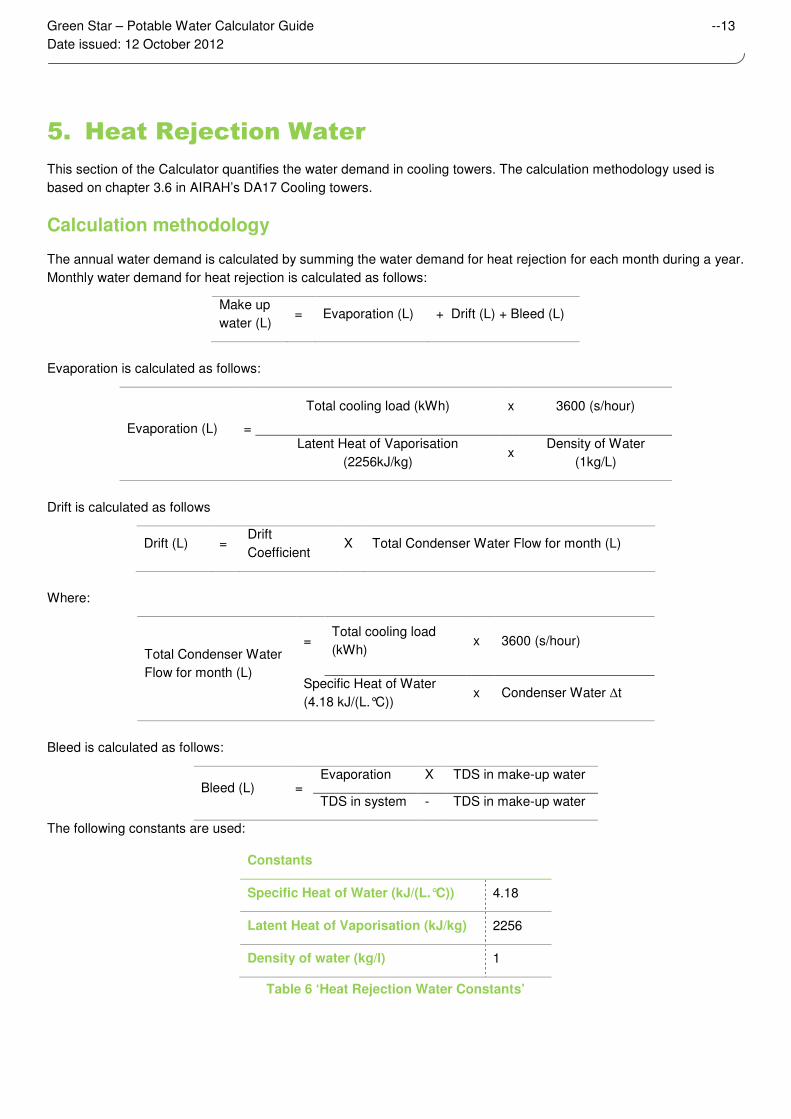
5. Heat Rejection Water
This section of the Calculator quantifies the water demand in cooling towers. The calculation methodology used is
based on chapter 3.6 in AIRAH’s DA17 Cooling towers.
Calculation methodology
The annual water demand is calculated by summing the water demand for heat rejection for each month during a year.
Monthly water demand for heat rejection is calculated as follows:
Make up
water (L) = Evaporation (L) + Drift (L) + Bleed (L)
Evaporation is calculated as follows:
Evaporation (L) =
Total cooling load (kWh) x 3600 (s/hour)
Latent Heat of Vaporisation
(2256kJ/kg) x
Density of Water
(1kg/L)
Drift is calculated as follows
Drift (L) = Drift
Coefficient X Total Condenser Water Flow for month (L)
Where:
Total Condenser Water
Flow for month (L)
= Total cooling load
(kWh) x 3600 (s/hour)
Specific Heat of Water
(4.18 kJ/(L.°C)) x Condenser Water ∆t
Bleed is calculated as follows:
Bleed (L) = Evaporation X TDS in make-up water
TDS in system - TDS in make-up water
The following constants are used:
Constants
Specific Heat of Water (kJ/(L.°C)) 4.18
Latent Heat of Vaporisation (kJ/kg) 2256
Density of water (kg/l) 1
Table 6 ‘Heat Rejection Water Constants’
Green Star – Potable Water Calculator Guide --14
Date issued: 12 October 2012
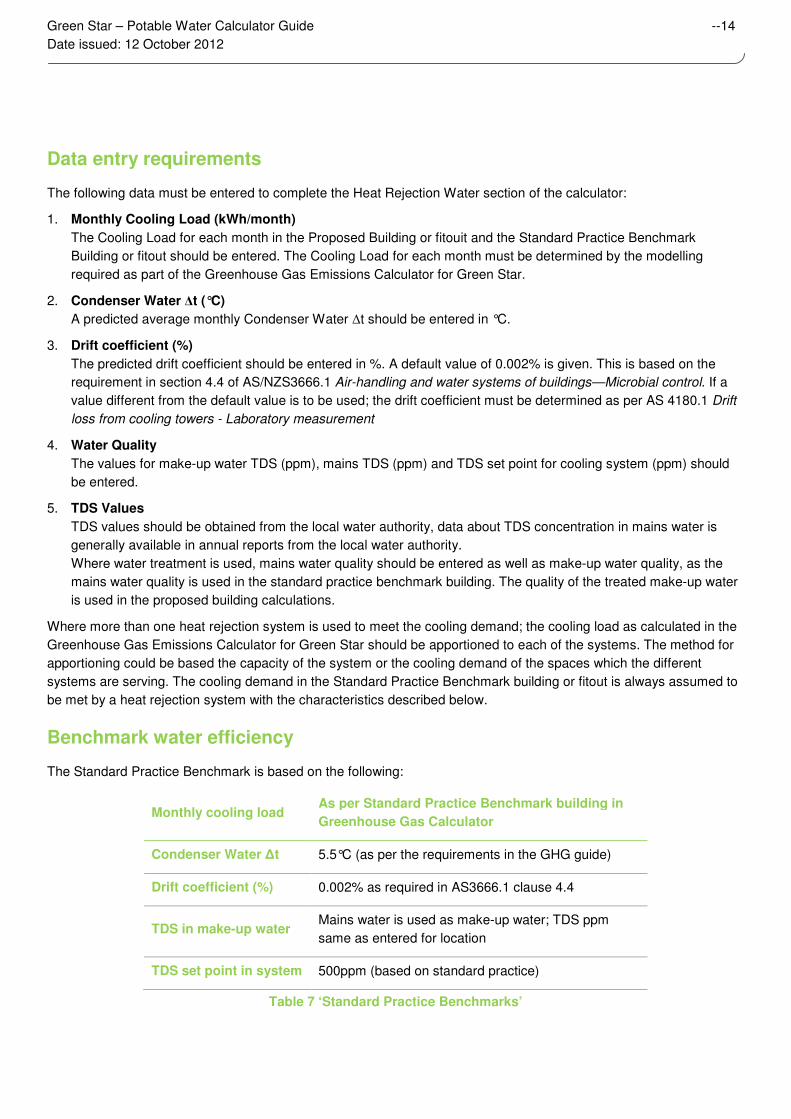
Data entry requirements
The following data must be entered to complete the Heat Rejection Water section of the calculator:
1. Monthly Cooling Load (kWh/month)
The Cooling Load for each month in the Proposed Building or fitouit and the Standard Practice Benchmark
Building or fitout should be entered. The Cooling Load for each month must be determined by the modelling
required as part of the Greenhouse Gas Emissions Calculator for Green Star.
2. Condenser Water ∆t (°C)
A predicted average monthly Condenser Water ∆t should be entered in °C.
3. Drift coefficient (%)
The predicted drift coefficient should be entered in %. A default value of 0.002% is given. This is based on the
requirement in section 4.4 of AS/NZS3666.1 Air-handling and water systems of buildings—Microbial control. If a
value different from the default value is to be used; the drift coefficient must be determined as per AS 4180.1 Drift
loss from cooling towers - Laboratory measurement
4. Water Quality
The values for make-up water TDS (ppm), mains TDS (ppm) and TDS set point for cooling system (ppm) should
be entered.
5. TDS Values
TDS values should be obtained from the local water authority, data about TDS concentration in mains water is
generally available in annual reports from the local water authority.
Where water treatment is used, mains water quality should be entered as well as make-up water quality, as the
mains water quality is used in the standard practice benchmark building. The quality of the treated make-up water
is used in the proposed building calculations.
Where more than one heat rejection system is used to meet the cooling demand; the cooling load as calculated in the
Greenhouse Gas Emissions Calculator for Green Star should be apportioned to each of the systems. The method for
apportioning could be based the capacity of the system or the cooling demand of the spaces which the different
systems are serving. The cooling demand in the Standard Practice Benchmark building or fitout is always assumed to
be met by a heat rejection system with the characteristics described below.
Benchmark water efficiency
The Standard Practice Benchmark is based on the following:
Monthly cooling load As per Standard Practice Benchmark building in
Greenhouse Gas Calculator
Condenser Water ∆t 5.5°C (as per the requirements in the GHG guide)
Drift coefficient (%) 0.002% as required in AS3666.1 clause 4.4
TDS in make-up water Mains water is used as make-up water; TDS ppm
same as entered for location
TDS set point in system 500ppm (based on standard practice)
Table 7 ‘Standard Practice Benchmarks’
Green Star – Potable Water Calculator Guide --15
Date issued: 12 October 2012
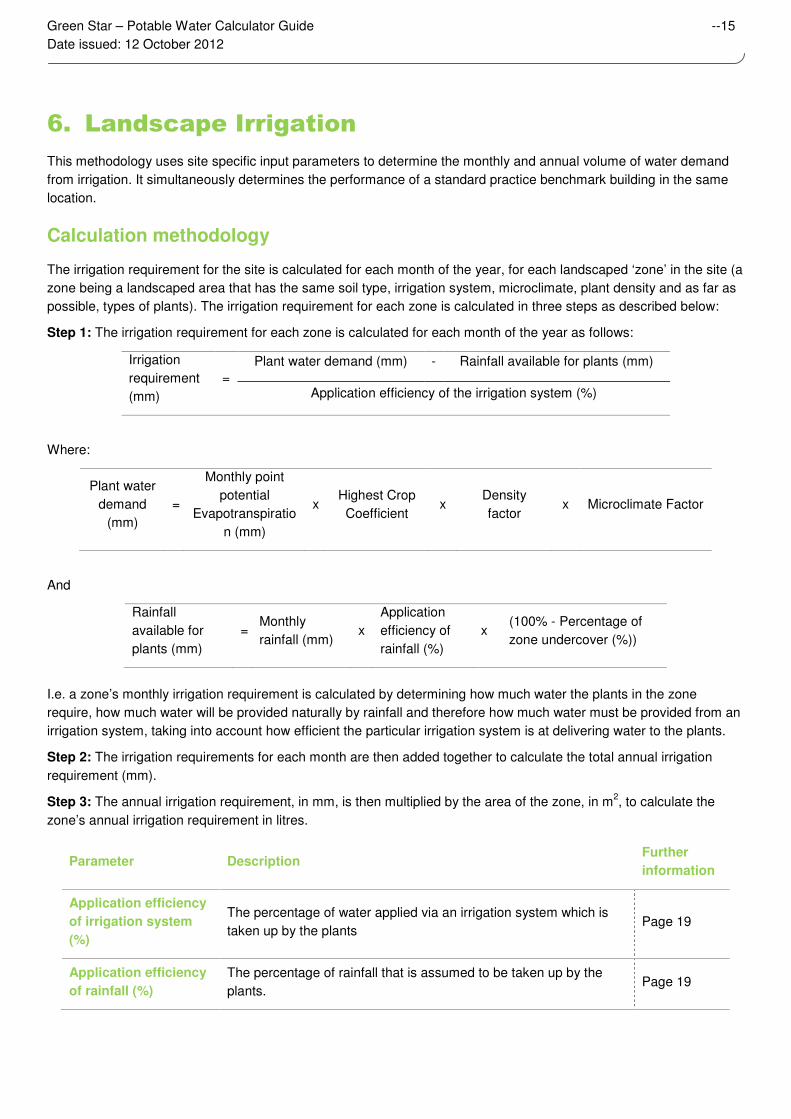
6. Landscape Irrigation
This methodology uses site specific input parameters to determine the monthly and annual volume of water demand
from irrigation. It simultaneously determines the performance of a standard practice benchmark building in the same
location.
Calculation methodology
The irrigation requirement for the site is calculated for each month of the year, for each landscaped ‘zone’ in the site (a
zone being a landscaped area that has the same soil type, irrigation system, microclimate, plant density and as far as
possible, types of plants). The irrigation requirement for each zone is calculated in three steps as described below:
Step 1: The irrigation requirement for each zone is calculated for each month of the year as follows:
Irrigation
requirement
(mm)
=
Plant water demand (mm) - Rainfall available for plants (mm)
Application efficiency of the irrigation system (%)
Where:
Plant water
demand
(mm)
=
Monthly point
potential
Evapotranspiratio
n (mm)
x Highest Crop
Coefficient x
Density
factor x Microclimate Factor
And
Rainfall
available for
plants (mm)
= Monthly
rainfall (mm) x
Application
efficiency of
rainfall (%)
x (100% - Percentage of
zone undercover (%))
I.e. a zone’s monthly irrigation requirement is calculated by determining how much water the plants in the zone
require, how much water will be provided naturally by rainfall and therefore how much water must be provided from an
irrigation system, taking into account how efficient the particular irrigation system is at delivering water to the plants.
Step 2: The irrigation requirements for each month are then added together to calculate the total annual irrigation
requirement (mm).
Step 3: The annual irrigation requirement, in mm, is then multiplied by the area of the zone, in m2, to calculate the
zone’s annual irrigation requirement in litres.
Parameter Description Further
information
Application efficiency
of irrigation system
(%)
The percentage of water applied via an irrigation system which is
taken up by the plants Page 19
Application efficiency
of rainfall (%)
The percentage of rainfall that is assumed to be taken up by the
plants. Page 19
Green Star – Potable Water Calculator Guide --16
Date issued: 12 October 2012
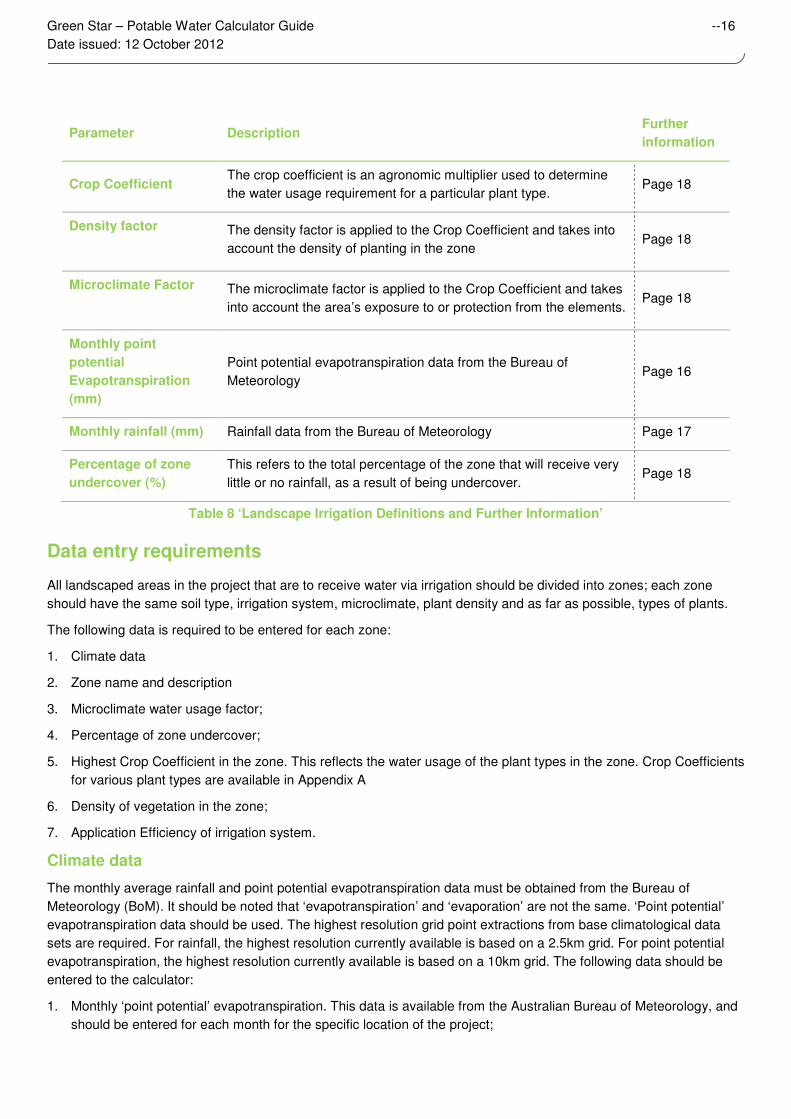
Parameter Description Further
information
Crop Coefficient The crop coefficient is an agronomic multiplier used to determine
the water usage requirement for a particular plant type. Page 18
Density factor
The density factor is applied to the Crop Coefficient and takes into
account the density of planting in the zone Page 18
Microclimate Factor
The microclimate factor is applied to the Crop Coefficient and takes
into account the area’s exposure to or protection from the elements. Page 18
Monthly point
potential
Evapotranspiration
(mm)
Point potential evapotranspiration data from the Bureau of
Meteorology Page 16
Monthly rainfall (mm) Rainfall data from the Bureau of Meteorology Page 17
Percentage of zone
undercover (%)
This refers to the total percentage of the zone that will receive very
little or no rainfall, as a result of being undercover. Page 18
Table 8 ‘Landscape Irrigation Definitions and Further Information’
Data entry requirements
All landscaped areas in the project that are to receive water via irrigation should be divided into zones; each zone
should have the same soil type, irrigation system, microclimate, plant density and as far as possible, types of plants.
The following data is required to be entered for each zone:
1. Climate data
2. Zone name and description
3. Microclimate water usage factor;
4. Percentage of zone undercover;
5. Highest Crop Coefficient in the zone. This reflects the water usage of the plant types in the zone. Crop Coefficients
for various plant types are available in Appendix A
6. Density of vegetation in the zone;
7. Application Efficiency of irrigation system.
Climate data
The monthly average rainfall and point potential evapotranspiration data must be obtained from the Bureau of
Meteorology (BoM). It should be noted that ‘evapotranspiration’ and ‘evaporation’ are not the same. ‘Point potential’
evapotranspiration data should be used. The highest resolution grid point extractions from base climatological data
sets are required. For rainfall, the highest resolution currently available is based on a 2.5km grid. For point potential
evapotranspiration, the highest resolution currently available is based on a 10km grid. The following data should be
entered to the calculator:
1. Monthly ‘point potential’ evapotranspiration. This data is available from the Australian Bureau of Meteorology, and
should be entered for each month for the specific location of the project;
Green Star – Potable Water Calculator Guide --17
Date issued: 12 October 2012
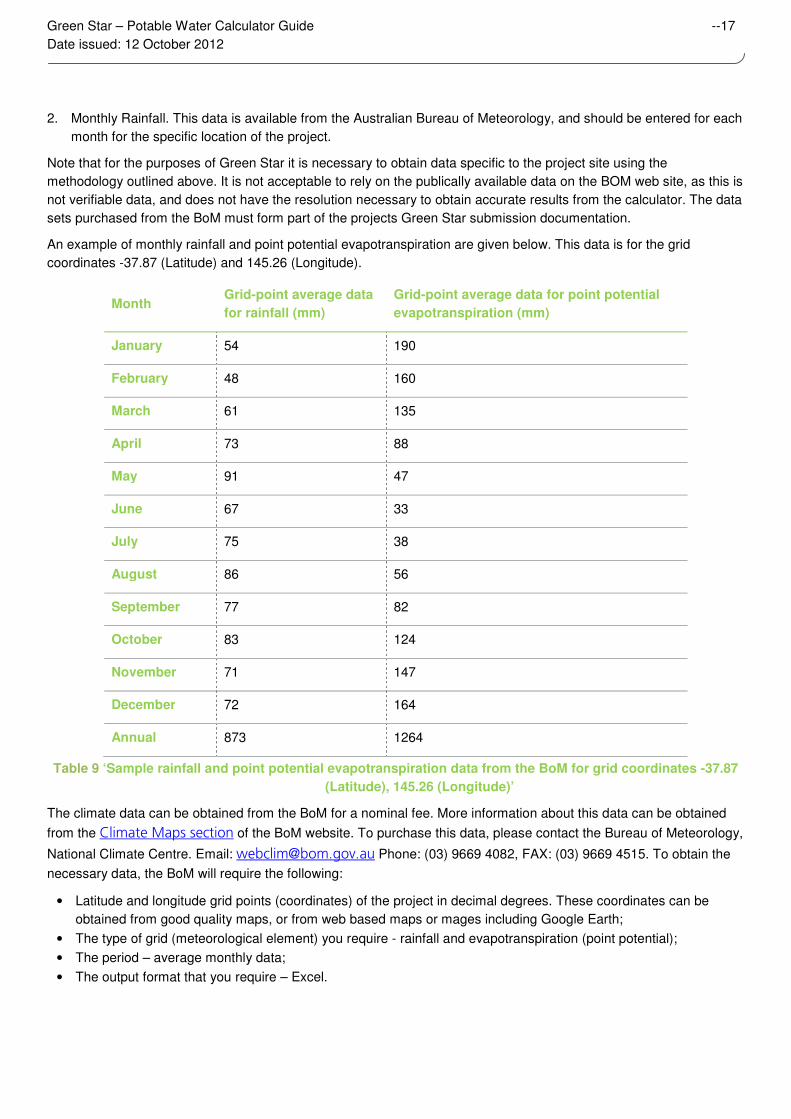
2. Monthly Rainfall. This data is available from the Australian Bureau of Meteorology, and should be entered for each
month for the specific location of the project.
Note that for the purposes of Green Star it is necessary to obtain data specific to the project site using the
methodology outlined above. It is not acceptable to rely on the publically available data on the BOM web site, as this is
not verifiable data, and does not have the resolution necessary to obtain accurate results from the calculator. The data
sets purchased from the BoM must form part of the projects Green Star submission documentation.
An example of monthly rainfall and point potential evapotranspiration are given below. This data is for the grid
coordinates -37.87 (Latitude) and 145.26 (Longitude).
Month Grid-point average data
for rainfall (mm)
Grid-point average data for point potential
evapotranspiration (mm)
January 54 190
February 48 160
March 61 135
April 73 88
May 91 47
June 67 33
July 75 38
August 86 56
September 77 82
October 83 124
November 71 147
December 72 164
Annual 873 1264
Table 9 ‘Sample rainfall and point potential evapotranspiration data from the BoM for grid coordinates -37.87
(Latitude), 145.26 (Longitude)’
The climate data can be obtained from the BoM for a nominal fee. More information about this data can be obtained
from the Climate Maps section of the BoM website. To purchase this data, please contact the Bureau of Meteorology,
National Climate Centre. Email: [email protected] Phone: (03) 9669 4082, FAX: (03) 9669 4515. To obtain the
necessary data, the BoM will require the following:
• Latitude and longitude grid points (coordinates) of the project in decimal degrees. These coordinates can be
obtained from good quality maps, or from web based maps or mages including Google Earth;
• The type of grid (meteorological element) you require - rainfall and evapotranspiration (point potential);
• The period – average monthly data;
• The output format that you require – Excel.
Green Star – Potable Water Calculator Guide --18
Date issued: 12 October 2012
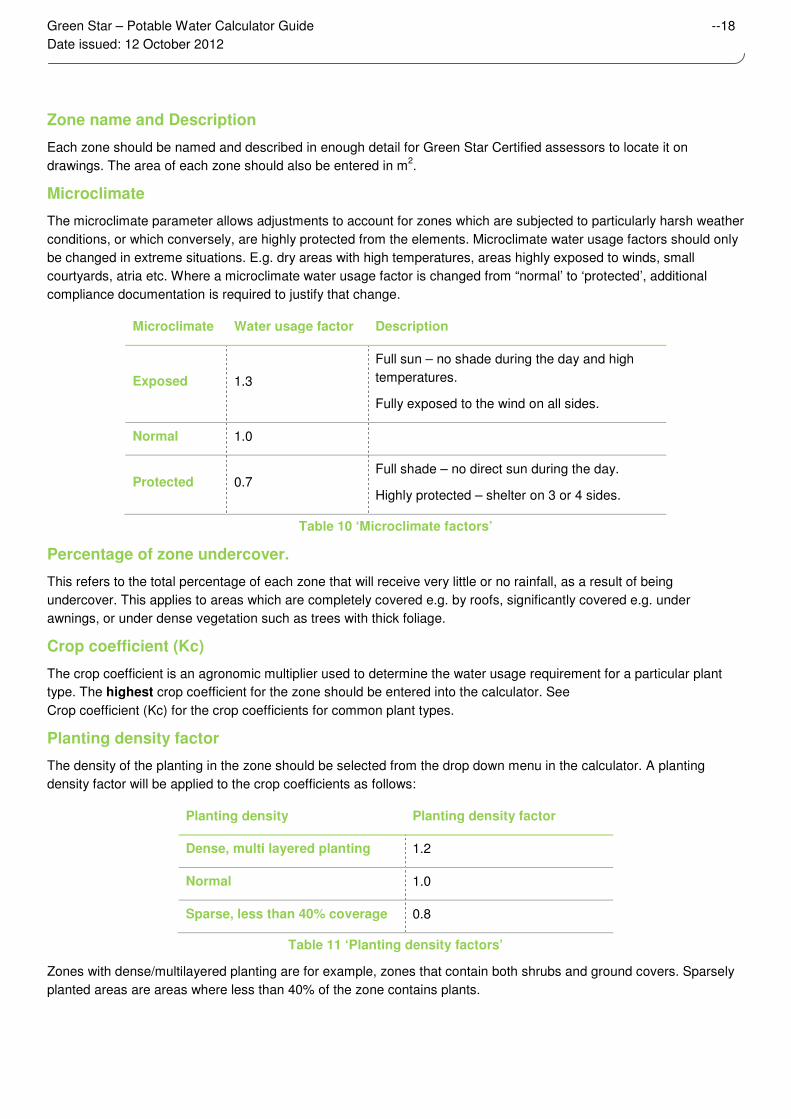
Zone name and Description
Each zone should be named and described in enough detail for Green Star Certified assessors to locate it on
drawings. The area of each zone should also be entered in m2.
Microclimate
The microclimate parameter allows adjustments to account for zones which are subjected to particularly harsh weather
conditions, or which conversely, are highly protected from the elements. Microclimate water usage factors should only
be changed in extreme situations. E.g. dry areas with high temperatures, areas highly exposed to winds, small
courtyards, atria etc. Where a microclimate water usage factor is changed from “normal’ to ‘protected’, additional
compliance documentation is required to justify that change.
Microclimate Water usage factor Description
Exposed 1.3
Full sun – no shade during the day and high
temperatures.
Fully exposed to the wind on all sides.
Normal 1.0
Protected 0.7 Full shade – no direct sun during the day.
Highly protected – shelter on 3 or 4 sides.
Table 10 ‘Microclimate factors’
Percentage of zone undercover.
This refers to the total percentage of each zone that will receive very little or no rainfall, as a result of being
undercover. This applies to areas which are completely covered e.g. by roofs, significantly covered e.g. under
awnings, or under dense vegetation such as trees with thick foliage.
Crop coefficient (Kc)
The crop coefficient is an agronomic multiplier used to determine the water usage requirement for a particular plant
type. The highest crop coefficient for the zone should be entered into the calculator. See
Crop coefficient (Kc) for the crop coefficients for common plant types.
Planting density factor
The density of the planting in the zone should be selected from the drop down menu in the calculator. A planting
density factor will be applied to the crop coefficients as follows:
Planting density Planting density factor
Dense, multi layered planting 1.2
Normal 1.0
Sparse, less than 40% coverage 0.8
Table 11 ‘Planting density factors’
Zones with dense/multilayered planting are for example, zones that contain both shrubs and ground covers. Sparsely
planted areas are areas where less than 40% of the zone contains plants.
Green Star – Potable Water Calculator Guide --19
Date issued: 12 October 2012
Application Efficiency
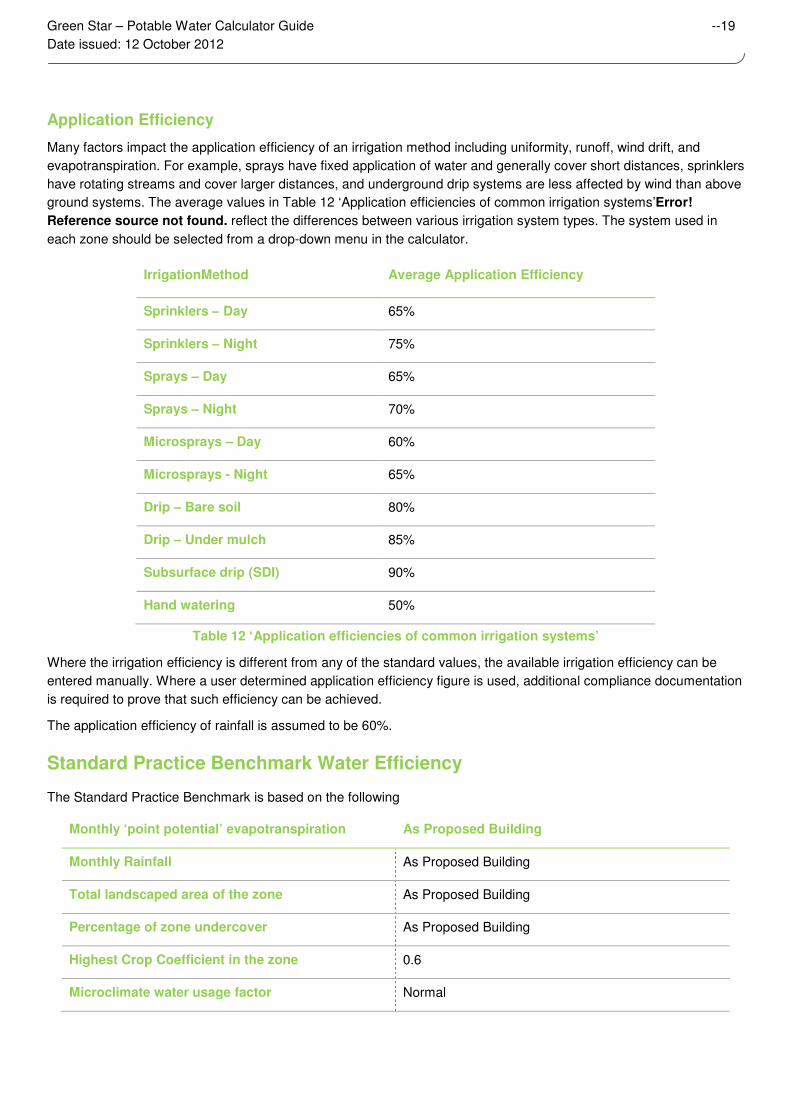
Many factors impact the application efficiency of an irrigation method including uniformity, runoff, wind drift, and
evapotranspiration. For example, sprays have fixed application of water and generally cover short distances, sprinklers
have rotating streams and cover larger distances, and underground drip systems are less affected by wind than above
ground systems. The average values in Table 12 ‘Application efficiencies of common irrigation systems’Error!
Reference source not found. reflect the differences between various irrigation system types. The system used in
each zone should be selected from a drop-down menu in the calculator.
IrrigationMethod Average Application Efficiency
Sprinklers – Day 65%
Sprinklers – Night 75%
Sprays – Day 65%
Sprays – Night 70%
Microsprays – Day 60%
Microsprays - Night 65%
Drip – Bare soil 80%
Drip – Under mulch 85%
Subsurface drip (SDI) 90%
Hand watering 50%
Table 12 ‘Application efficiencies of common irrigation systems’
Where the irrigation efficiency is different from any of the standard values, the available irrigation efficiency can be
entered manually. Where a user determined application efficiency figure is used, additional compliance documentation
is required to prove that such efficiency can be achieved.
The application efficiency of rainfall is assumed to be 60%.
Standard Practice Benchmark Water Efficiency
The Standard Practice Benchmark is based on the following
Monthly ‘point potential’ evapotranspiration As Proposed Building
Monthly Rainfall As Proposed Building
Total landscaped area of the zone As Proposed Building
Percentage of zone undercover As Proposed Building
Highest Crop Coefficient in the zone 0.6
Microclimate water usage factor Normal

Green Star – Potable Water Calculator Guide --20
Date issued: 12 October 2012
Density of vegetation Normal
Application Efficiency of irrigation system 75% (night time sprinklers)
Table 13 ‘Water Efficiency Benchmarks’

Green Star – Potable Water Calculator Guide --21
Date issued: 12 October 2012
7. Reclaimed water use
Reclaimed water use refers to the use on-site rainwater, greywater, blackwater and stormwater and the use of
reclaimed water supplied from off-site.
The first step in determining how much reclaimed water is used on site is to establish the water demand that can be
met with reclaimed water. The methodology used to establish the demands is given in 0 Demand for reclaimed water.
The second step is to calculate how much reclaimed water is available – this is described in Sections 0 to 0. If there is
not enough reclaimed water to meet the demand, it is assumed that mains water will be used instead.
Demand for reclaimed water
The demand for reclaimed water set the upper limit to the reclaimed water use; it is the maximum potential demand.
The demand for ‘mains water only’ is also calculated. This defines the minimum quantity of mains water used (i.e.
regardless of how much reclaimed water is available, if the water uses are not connected to the reclaimed water
system; reclaimed water will not be used).
The reclaimed water demand from water uses that may be rewarded in other credits is also calculated in this section.
The water demands from water uses not addressed in the calculator are met before the ‘Potable Water’ credit.
The demands are established separately for each of the following water sources:
1. Rainwater systems;
2. Greywater and blackwater systems; and
3. Stormwater and off-site reclaimed water systems
4. Mains water only.
The demand for rainwater is calculated separately as the monthly demand is used in the Rainwater Calculator as
described in Section 0 Green Star Rainwater Calculator Calculation Methodology. The demand for greywater and
blackwater is calculated separately as this is used to determine the reduction in discharge to sewer in the Sewerage
Calculator (the calculator used to establish the number of points achieved in Emi-6: Discharge to Sewer). The demand
for stormwater and off-site reclaimed water is then calculated separately as the remaining reclaimed water sources.
Where water uses are supplied with water from more than one source, it is assumed that they are first supplied with
water from any greywater and blackwater systems, followed by rainwater, stormwater and off-site reclaimed water
systems. The order in which these calculations are done has no effect on the score for the ‘Potable Water’ credit, but
does affect the score in other credits (for example Emi-6 in green Star - Public Building). The calculations are done in
this way to recognise and reward the maximum potential reduction of discharge to sewer from installing greywater and
blackwater systems.
Calculation methodology
The maximum potential demand for reclaimed water from a particular source (be it rainwater; greywater and
blackwater; or stormwater and off-site reclaimed water systems) is calculated on a monthly basis using the total
monthly water demands from each fitting/system, and the percentages of the fittings/systems connected to each type
of reclaimed water system.

Green Star – Potable Water Calculator Guide --22
Date issued: 12 October 2012
For example, the demand for rainwater, from water uses addressed by the calculator, is calculated for the month of
January as follows:
Maximum
potential
demand for
rainwater in
January
= (
Percentage of
toilets
connected to
rainwater
system
x
Water
demand
from toilets
in January
) + ( Percentage of
urinals
connected to
rainwater
system
x
Water
demand
from urinals
in January
)
And so on for all
water uses addressed
by the calculator:
- taps;
- showers;
- landscape irrigation;
and
- heat rejection.
(The water demands from toilets, urinals, taps etc.. in the formula above are determined in the Water Demand section
of The Calculator (see Sections 3: Building Information through to 5: Heat Rejection Water for more information)).
This calculation is undertaken for each month of the year and for rainwater systems; greywater and blackwater
systems; stormwater and off-site reclaimed water systems; and the mains system separately.
The monthly demand for reclaimed water uses not addressed in the calcualtor (such as water demands from fire
systems and swimming pools) is calculated in the same way as for water uses that are adressed. The total monthly
water demands are however entered directly into the calculator rather than being determined in the Water Demand
section of The Calculator.
Note: following this methodology, where the demand from a particular water use can be met by water supplied from
more than one source, the total reclaimed water demands can add up to more than 100% of the actual demand. This
is correct and not a problem as the ‘mains water only’ demand is also calculated which limits the reduction in potable
water demand from reclaimed systems I.e. regardless of how much reclaimed water is available, if the water uses are
not connected to the reclaimed water system, the reclaimed water will not be used.
Data entry requirements
To establish the reclaimed water demand:
1. Percentage of each water use connected to an on-site rainwater systems
2. Percentage of each water use connected to an on-site greywater and/or blackwater system
3. Percentage of each water use connected to an on-site stormwater system and/or off-site reclaimed water system
4. Percentage of each water use connected to mains water only.
To establish the reclaimed water demand for water uses not addressed by the calculator:
1. Monthly water demand (kL/month) from each water use not addressed by the calculator (fire system, swimming
pool, other)
2. Percentage of each water use connected to an on-site rainwater systems
3. Percentage of each water use connected to an on-site greywater and/or blackwater system
4. Percentage of each water use connected to an on-site stormwater system and/or off-site reclaimed water system
5. Percentage of each water use connected to mains water only.
Green Star – Potable Water Calculator Guide --23
Date issued: 12 October 2012
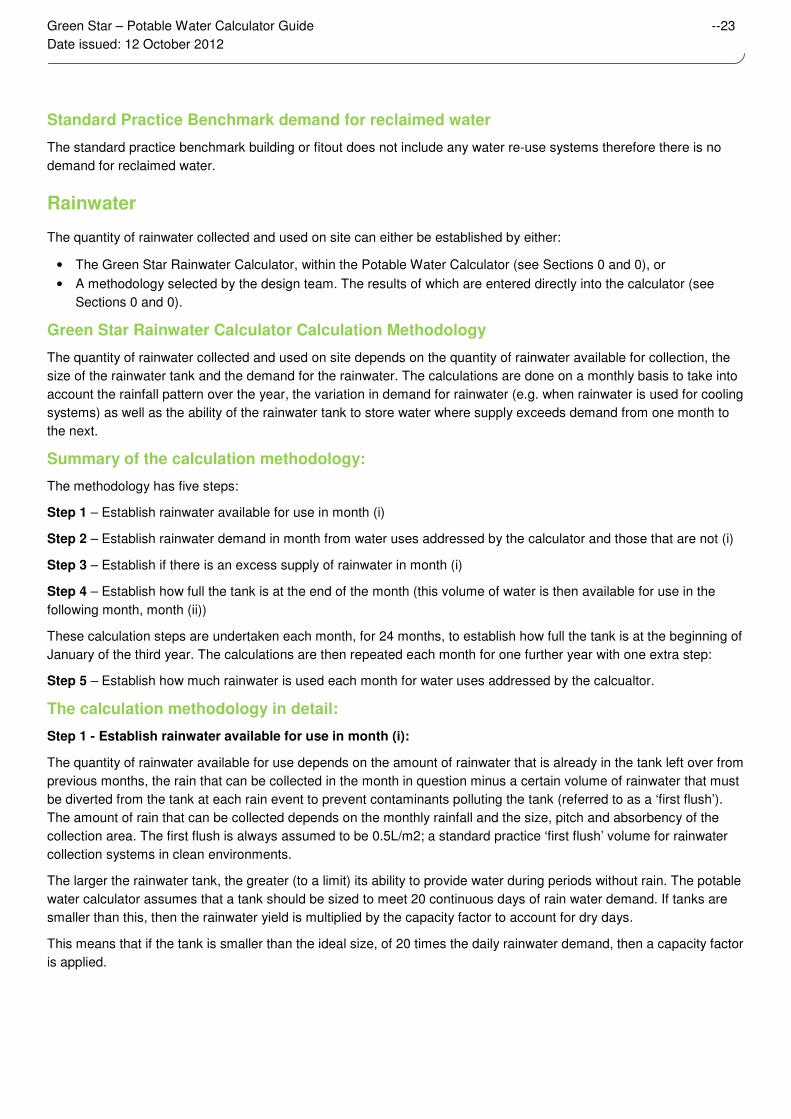
Standard Practice Benchmark demand for reclaimed water
The standard practice benchmark building or fitout does not include any water re-use systems therefore there is no
demand for reclaimed water.
Rainwater
The quantity of rainwater collected and used on site can either be established by either:
• The Green Star Rainwater Calculator, within the Potable Water Calculator (see Sections 0 and 0), or
• A methodology selected by the design team. The results of which are entered directly into the calculator (see
Sections 0 and 0).
Green Star Rainwater Calculator Calculation Methodology
The quantity of rainwater collected and used on site depends on the quantity of rainwater available for collection, the
size of the rainwater tank and the demand for the rainwater. The calculations are done on a monthly basis to take into
account the rainfall pattern over the year, the variation in demand for rainwater (e.g. when rainwater is used for cooling
systems) as well as the ability of the rainwater tank to store water where supply exceeds demand from one month to
the next.
Summary of the calculation methodology:
The methodology has five steps:
Step 1 – Establish rainwater available for use in month (i)
Step 2 – Establish rainwater demand in month from water uses addressed by the calculator and those that are not (i)
Step 3 – Establish if there is an excess supply of rainwater in month (i)
Step 4 – Establish how full the tank is at the end of the month (this volume of water is then available for use in the
following month, month (ii))
These calculation steps are undertaken each month, for 24 months, to establish how full the tank is at the beginning of
January of the third year. The calculations are then repeated each month for one further year with one extra step:
Step 5 – Establish how much rainwater is used each month for water uses addressed by the calcualtor.
The calculation methodology in detail:
Step 1 - Establish rainwater available for use in month (i):
The quantity of rainwater available for use depends on the amount of rainwater that is already in the tank left over from
previous months, the rain that can be collected in the month in question minus a certain volume of rainwater that must
be diverted from the tank at each rain event to prevent contaminants polluting the tank (referred to as a ‘first flush’).
The amount of rain that can be collected depends on the monthly rainfall and the size, pitch and absorbency of the
collection area. The first flush is always assumed to be 0.5L/m2; a standard practice ‘first flush’ volume for rainwater
collection systems in clean environments.
The larger the rainwater tank, the greater (to a limit) its ability to provide water during periods without rain. The potable
water calculator assumes that a tank should be sized to meet 20 continuous days of rain water demand. If tanks are
smaller than this, then the rainwater yield is multiplied by the capacity factor to account for dry days.
This means that if the tank is smaller than the ideal size, of 20 times the daily rainwater demand, then a capacity factor
is applied.
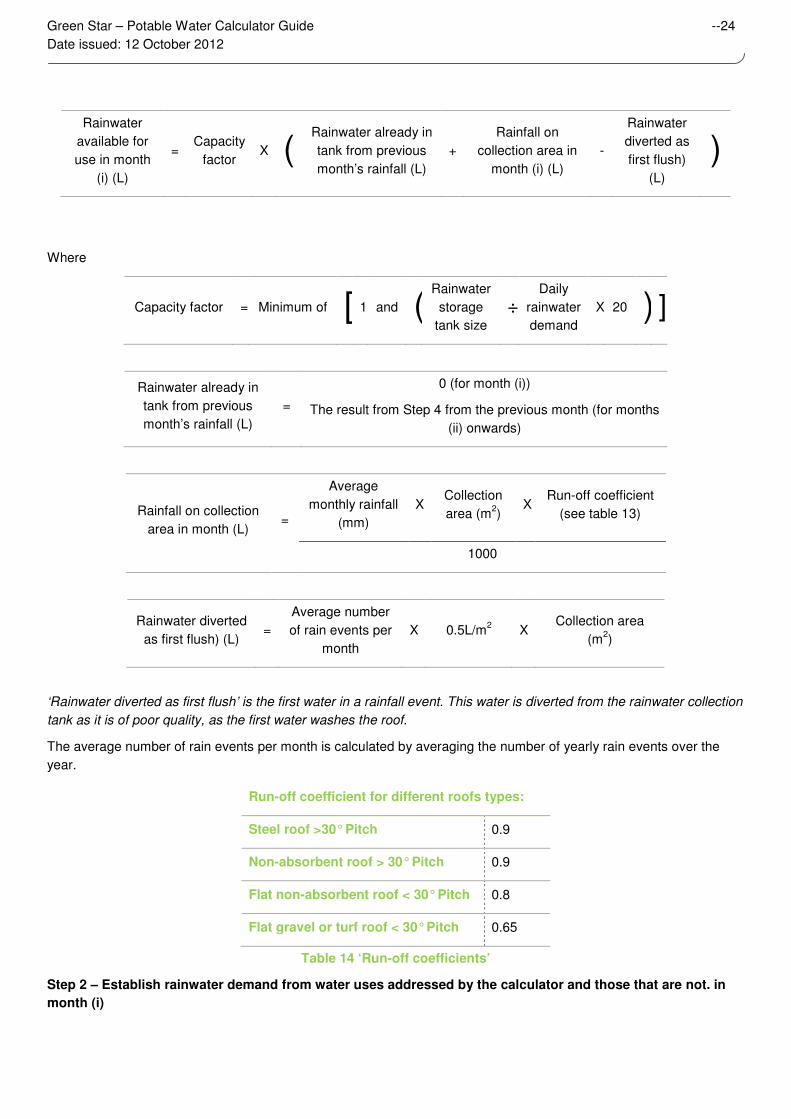
Green Star – Potable Water Calculator Guide --24
Date issued: 12 October 2012
Rainwater
available for
use in month
(i) (L)
= Capacity
factor X (
Rainwater already in
tank from previous
month’s rainfall (L)
+
Rainfall on
collection area in
month (i) (L)
-
Rainwater
diverted as
first flush)
(L)
)
Where
Capacity factor = Minimum of [ 1 and (Rainwater
storage
tank size
÷
Daily
rainwater
demand
X 20 ) ]
Rainwater already in
tank from previous
month’s rainfall (L)
=
0 (for month (i))
The result from Step 4 from the previous month (for months
(ii) onwards)
Rainfall on collection
area in month (L) =
Average
monthly rainfall
(mm)
X Collection
area (m2)
X Run-off coefficient
(see table 13)
1000
Rainwater diverted
as first flush) (L) =
Average number
of rain events per
month
X 0.5L/m2 X
Collection area
(m2)
‘Rainwater diverted as first flush’ is the first water in a rainfall event. This water is diverted from the rainwater collection
tank as it is of poor quality, as the first water washes the roof.
The average number of rain events per month is calculated by averaging the number of yearly rain events over the
year.
Run-off coefficient for different roofs types:
Steel roof >30° Pitch 0.9
Non-absorbent roof > 30° Pitch 0.9
Flat non-absorbent roof < 30° Pitch 0.8
Flat gravel or turf roof < 30° Pitch 0.65
Table 14 ‘Run-off coefficients’
Step 2 – Establish rainwater demand from water uses addressed by the calculator and those that are not. in
month (i)
Green Star – Potable Water Calculator Guide --25
Date issued: 12 October 2012
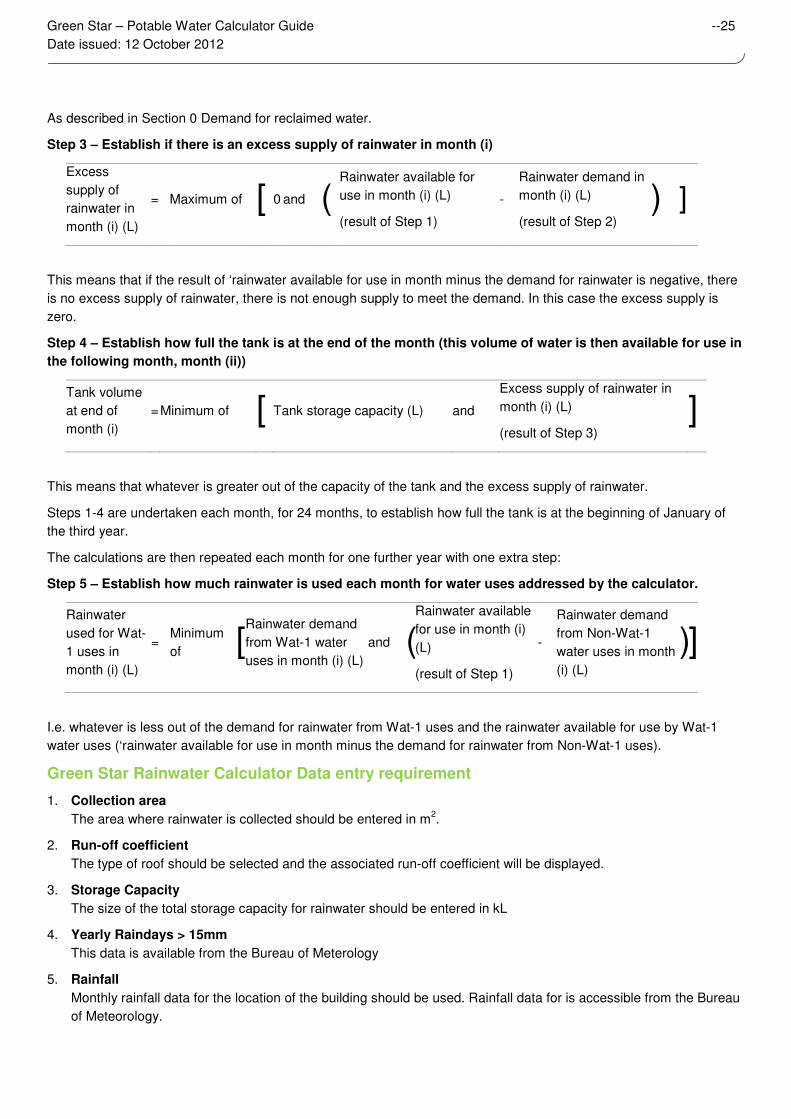
As described in Section 0 Demand for reclaimed water.
Step 3 – Establish if there is an excess supply of rainwater in month (i)
Excess
supply of
rainwater in
month (i) (L)
= Maximum of [ 0 and (
Rainwater available for
use in month (i) (L)
(result of Step 1)
-
Rainwater demand in
month (i) (L)
(result of Step 2)
) ]
This means that if the result of ‘rainwater available for use in month minus the demand for rainwater is negative, there
is no excess supply of rainwater, there is not enough supply to meet the demand. In this case the excess supply is
zero.
Step 4 – Establish how full the tank is at the end of the month (this volume of water is then available for use in
the following month, month (ii))
Tank volume
at end of
month (i)
= Minimum of [ Tank storage capacity (L) and
Excess supply of rainwater in
month (i) (L)
(result of Step 3)
]
This means that whatever is greater out of the capacity of the tank and the excess supply of rainwater.
Steps 1-4 are undertaken each month, for 24 months, to establish how full the tank is at the beginning of January of
the third year.
The calculations are then repeated each month for one further year with one extra step:
Step 5 – Establish how much rainwater is used each month for water uses addressed by the calculator.
Rainwater
used for Wat-
1 uses in
month (i) (L)
= Minimum
of [Rainwater demand
from Wat-1 water
uses in month (i) (L)
and (Rainwater available
for use in month (i)
(L)
(result of Step 1)
-
Rainwater demand
from Non-Wat-1
water uses in month
(i) (L)
)]
I.e. whatever is less out of the demand for rainwater from Wat-1 uses and the rainwater available for use by Wat-1
water uses (‘rainwater available for use in month minus the demand for rainwater from Non-Wat-1 uses).
Green Star Rainwater Calculator Data entry requirement
1. Collection area
The area where rainwater is collected should be entered in m2.
2. Run-off coefficient
The type of roof should be selected and the associated run-off coefficient will be displayed.
3. Storage Capacity
The size of the total storage capacity for rainwater should be entered in kL
4. Yearly Raindays > 15mm
This data is available from the Bureau of Meterology
5. Rainfall
Monthly rainfall data for the location of the building should be used. Rainfall data for is accessible from the Bureau
of Meteorology.

Green Star – Potable Water Calculator Guide --26
Date issued: 12 October 2012
Roof type Run-off coefficient
Steel roof (> 30 pitch) 0.9
Non-absorbent roof (> 30 pitch) 0.9
Flat non-absorbent roof (<30 pitch) 0.8
Flat gravel or turf roof (<30 pitch) 0.65
Table 15 ‘Run-off Coefficients’
User determined rainwater calculation methodology
A Credit Interpretation Request should be submitted to the GBCA to demonstrate that the proposed methodology is at
least of equivalent accuracy as the Green Star methodology for quantifying rainwater collection described above.
Data entry requirement for user determined rainwater calculation methodologies
The user should enter a percentage of the demand for rainwater that is met, for each month of the year. The demand
is calculated in the ‘Reclaimed water use’ section of The Calculator and presented in the ‘Rainwater Collection’
Section.
Standard Practice Benchmark
The standard practice benchmark building or fitout does not include any water re-use.
Green Star – Potable Water Calculator Guide --27
Date issued: 12 October 2012
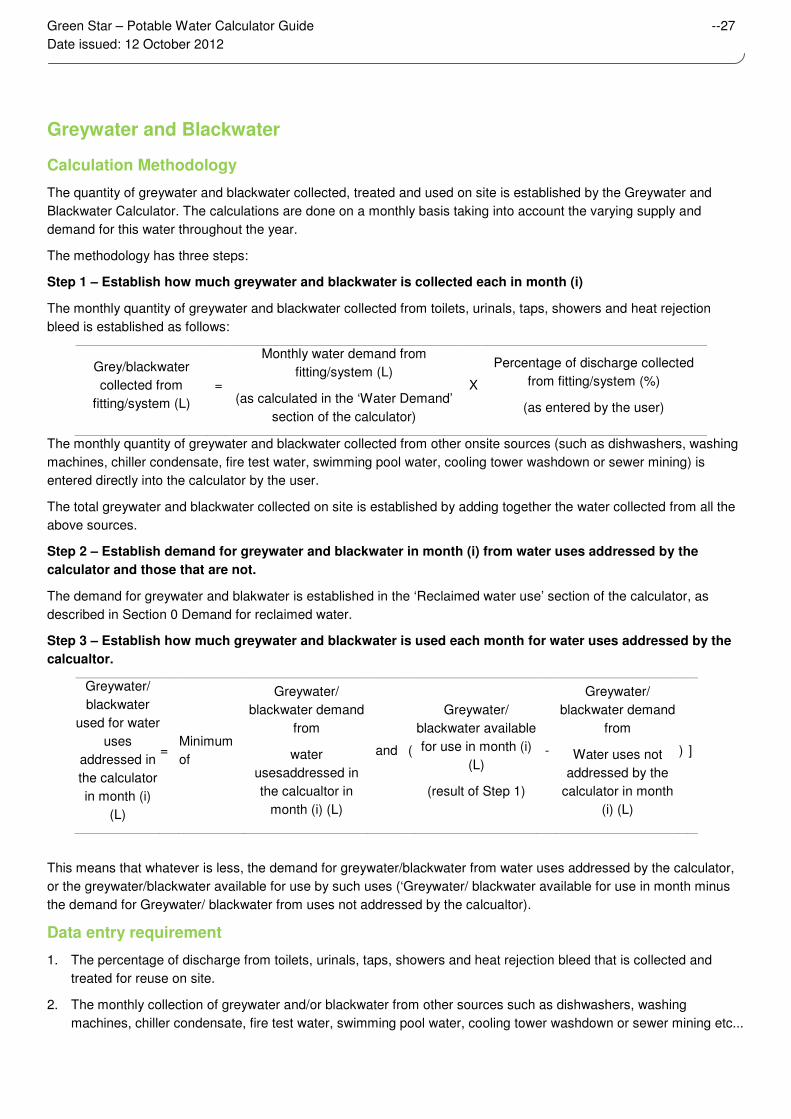
Greywater and Blackwater
Calculation Methodology
The quantity of greywater and blackwater collected, treated and used on site is established by the Greywater and
Blackwater Calculator. The calculations are done on a monthly basis taking into account the varying supply and
demand for this water throughout the year.
The methodology has three steps:
Step 1 – Establish how much greywater and blackwater is collected each in month (i)
The monthly quantity of greywater and blackwater collected from toilets, urinals, taps, showers and heat rejection
bleed is established as follows:
Grey/blackwater
collected from
fitting/system (L)
=
Monthly water demand from
fitting/system (L)
(as calculated in the ‘Water Demand’
section of the calculator)
X
Percentage of discharge collected
from fitting/system (%)
(as entered by the user)
The monthly quantity of greywater and blackwater collected from other onsite sources (such as dishwashers, washing
machines, chiller condensate, fire test water, swimming pool water, cooling tower washdown or sewer mining) is
entered directly into the calculator by the user.
The total greywater and blackwater collected on site is established by adding together the water collected from all the
above sources.
Step 2 – Establish demand for greywater and blackwater in month (i) from water uses addressed by the
calculator and those that are not.
The demand for greywater and blakwater is established in the ‘Reclaimed water use’ section of the calculator, as
described in Section 0 Demand for reclaimed water.
Step 3 – Establish how much greywater and blackwater is used each month for water uses addressed by the
calcualtor.
Greywater/
blackwater
used for water
uses
addressed in
the calculator
in month (i)
(L)
= Minimum
of [
Greywater/
blackwater demand
from
water
usesaddressed in
the calcualtor in
month (i) (L)
and (
Greywater/
blackwater available
for use in month (i)
(L)
(result of Step 1)
-
Greywater/
blackwater demand
from
Water uses not
addressed by the
calculator in month
(i) (L)
) ]
This means that whatever is less, the demand for greywater/blackwater from water uses addressed by the calculator,
or the greywater/blackwater available for use by such uses (‘Greywater/ blackwater available for use in month minus
the demand for Greywater/ blackwater from uses not addressed by the calcualtor).
Data entry requirement
1. The percentage of discharge from toilets, urinals, taps, showers and heat rejection bleed that is collected and
treated for reuse on site.
2. The monthly collection of greywater and/or blackwater from other sources such as dishwashers, washing
machines, chiller condensate, fire test water, swimming pool water, cooling tower washdown or sewer mining etc...
Green Star – Potable Water Calculator Guide --28
Date issued: 12 October 2012
Standard Practice Benchmark
The standard practice benchmark building or fitout does not include any water re-use.
Stormwater
This section does not apply in Green Star – Interiors.
Calculation Methodology
Calculations and documentation must be done according to the requirements of the Emi-6 ‘Stormwater’ credit.
Data entry requirement
Monthly supply of stormwater available for re-use in the building should be entered in kL for each month.
Standard Practice Benchmark
The standard practice benchmark building does not include any water re-use.
Off-site supply of Reclaimed water
Calculation Methodology
Using off-site reclaimed water is an acceptable way to achieve reductions in potable water consumption in Green Star
provided that it can be demonstrated that the relevant local authority has given approval for its use. The reclaimed
water system must be operational at the time of practical completion of the building.
Monthly supply of off-site supply should be entered in kL for each month. The volume entered for each month must be
confirmed by the supply authority in the submission
Data entry requirement
Insert how much water is available per month in kL
Standard Practice Benchmark
The standard practice benchmark building or fitout does not include any water re-use.

Green Star – Potable Water Calculator Guide --29
Date issued: 12 October 2012
8. Green Star Sewerage Calculator
This section does not apply in Green Star – Interiors.
The Green Star Sewerage Calculator does not require any data input from the user. All required data is entered to the
Potable Water Calculator and then exported to the Sewerage Calculator. The Sewerage returns the number of
awarded points (out of four available3) for the Green Star credit Emi-6 ‘Discharge to Sewer’. The Sewerage Calculator
is embedded in the Green Star Rating Tool; it can be found on a tab in the spreadsheet next to the Emissions
Category.
Points are awarded based on the percentage reduction compared to a standard practice building. Reduced flow to
sewer can be achieved through water-efficient fixtures and fittings as well as the collection of greywater and
blackwater. Descriptions of how standard practice is defined is included in each section of this guide.
3 The Sewer Calculator awards up to four points, there are however five points available in the Emi-6 ‘Discharge to
Sewer’ credit, for further details please refer to the Technical Manual.
Green Star – Potable Water Calculator Guide --30
Date issued: 12 October 2012
9. Green Star Greenhouse Gas Emissions Calculator
The Green Star – Greenhouse Gas Emissions Calculator is designed to assess reductions in greenhouse gas
emissions compared to a standard practice building. The Greenhouse Gas Emissions Calculator is embedded in the
Green Star Rating Tool; it can be found on a tab in the spreadsheet or scorecard. More information about the Green
Star – Greenhouse Gas Emissions Calculator is available in the Green Star – Greenhouse Gas Calculator Emissions
Calculator Guide, available at www.gbca.org.au.
The energy consumption associated with water heating for taps and showers in the building (domestic hot water) is a
required input of the Greenhouse Gas Emissions Calculator. The methodology that must be used to determine the
energy consumption associated with domestic hot water is included in the Green Star – Greenhouse Gas Calculator
Emissions Calculator Guide; it requires the demand for domestic hot water as an input. The methodology shows that
reductions in greenhouse gas emissions can be achieved by installing more efficient fittings and fixtures as well as
installing an efficient hot water system and or a solar hot water system.
The domestic hot water demand figures that must be used are calculated and displayed in the Potable Water
Calculator. The calculator assumes that 50% of the water used in taps and showers in the Proposed and Standard
Practice Buildings is hot water. The water efficiency of taps and showers in the Proposed Building are as entered by
the design team in the Potable Water Calculator. The water efficiency of the fittings of the Standard Practice Building
are based on the standard practice fittings described in Section 0 Standard Practice Benchmark Water Efficiency. The
hot water consumption figures are displayed in the Results Section of the Potable Water Calculator.
10. References
AIRAH (2009) DA17 Cooling Towers Application Manual
Connellan, Geoff (2002) Efficient Irrigation: A reference Manual for Turf and Landscape, School of resource
management and geography, University of Melbourne
Green Star – Potable Water Calculator Guide --31
Date issued: 12 October 2012
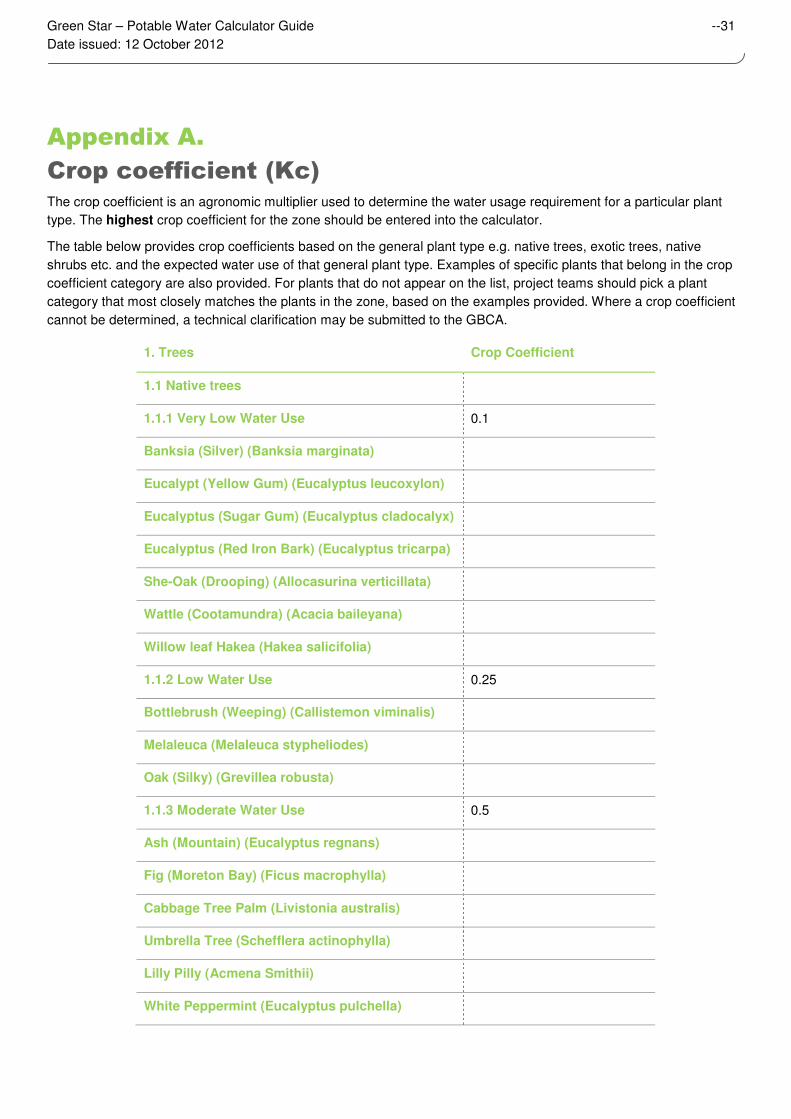
Appendix A.
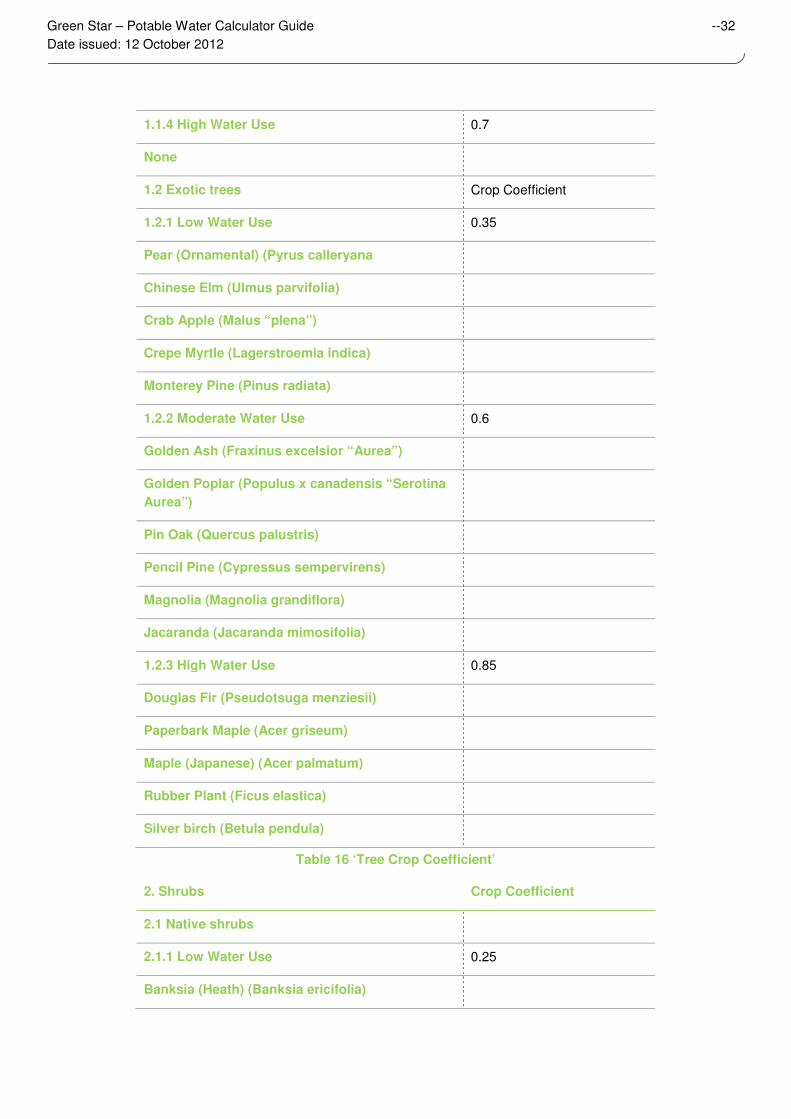
Crop coefficient (Kc) The crop coefficient is an agronomic multiplier used to determine the water usage requirement for a particular plant
type. The highest crop coefficient for the zone should be entered into the calculator.
The table below provides crop coefficients based on the general plant type e.g. native trees, exotic trees, native
shrubs etc. and the expected water use of that general plant type. Examples of specific plants that belong in the crop
coefficient category are also provided. For plants that do not appear on the list, project teams should pick a plant
category that most closely matches the plants in the zone, based on the examples provided. Where a crop coefficient
cannot be determined, a technical clarification may be submitted to the GBCA.
1. Trees Crop Coefficient
1.1 Native trees
1.1.1 Very Low Water Use 0.1
Banksia (Silver) (Banksia marginata)
Eucalypt (Yellow Gum) (Eucalyptus leucoxylon)
Eucalyptus (Sugar Gum) (Eucalyptus cladocalyx)
Eucalyptus (Red Iron Bark) (Eucalyptus tricarpa)
She-Oak (Drooping) (Allocasurina verticillata)
Wattle (Cootamundra) (Acacia baileyana)
Willow leaf Hakea (Hakea salicifolia)
1.1.2 Low Water Use 0.25
Bottlebrush (Weeping) (Callistemon viminalis)
Melaleuca (Melaleuca stypheliodes)
Oak (Silky) (Grevillea robusta)
1.1.3 Moderate Water Use 0.5
Ash (Mountain) (Eucalyptus regnans)
Fig (Moreton Bay) (Ficus macrophylla)
Cabbage Tree Palm (Livistonia australis)
Umbrella Tree (Schefflera actinophylla)
Lilly Pilly (Acmena Smithii)
White Peppermint (Eucalyptus pulchella)
Green Star – Potable Water Calculator Guide --32
Date issued: 12 October 2012
1.1.4 High Water Use 0.7
None
1.2 Exotic trees Crop Coefficient
1.2.1 Low Water Use 0.35
Pear (Ornamental) (Pyrus calleryana
Chinese Elm (Ulmus parvifolia)
Crab Apple (Malus “plena”)
Crepe Myrtle (Lagerstroemia indica)
Monterey Pine (Pinus radiata)
1.2.2 Moderate Water Use 0.6
Golden Ash (Fraxinus excelsior “Aurea”)
Golden Poplar (Populus x canadensis “Serotina
Aurea”)
Pin Oak (Quercus palustris)
Pencil Pine (Cypressus sempervirens)
Magnolia (Magnolia grandiflora)
Jacaranda (Jacaranda mimosifolia)
1.2.3 High Water Use 0.85
Douglas Fir (Pseudotsuga menziesii)
Paperbark Maple (Acer griseum)
Maple (Japanese) (Acer palmatum)
Rubber Plant (Ficus elastica)
Silver birch (Betula pendula)
Table 16 ‘Tree Crop Coefficient’
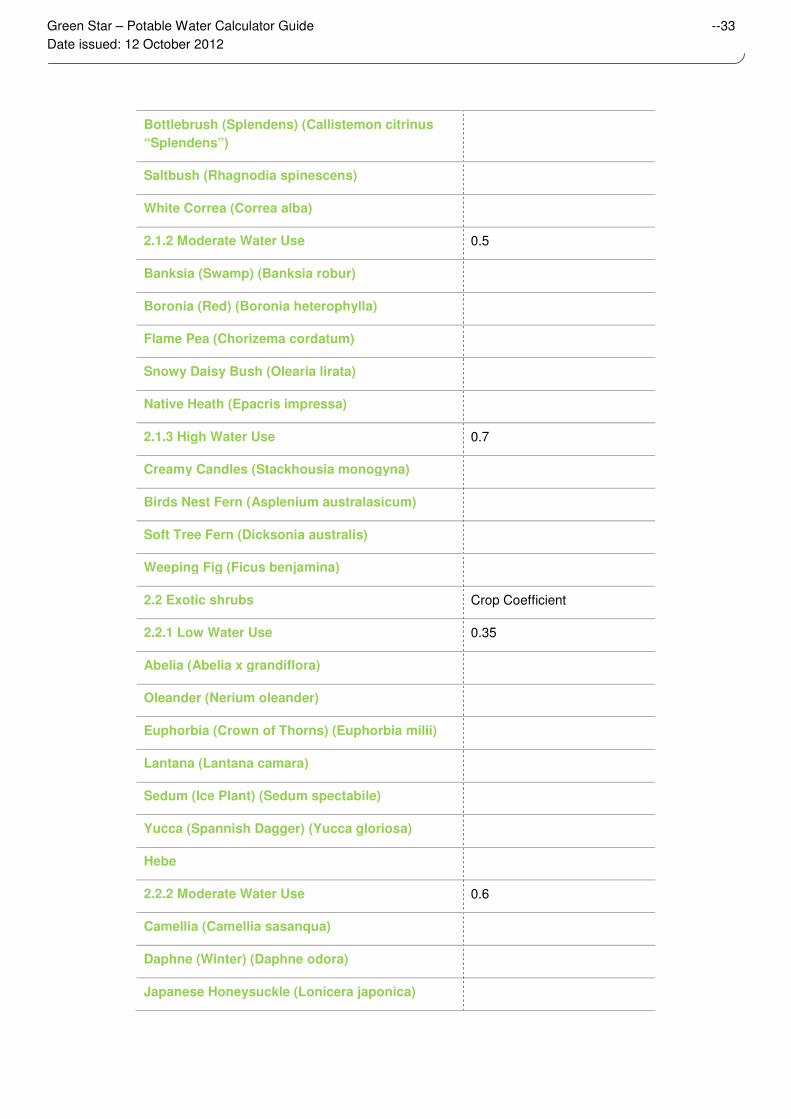
2. Shrubs Crop Coefficient
2.1 Native shrubs
2.1.1 Low Water Use 0.25
Banksia (Heath) (Banksia ericifolia)
Green Star – Potable Water Calculator Guide --33
Date issued: 12 October 2012
Bottlebrush (Splendens) (Callistemon citrinus
“Splendens”)
Saltbush (Rhagnodia spinescens)
White Correa (Correa alba)
2.1.2 Moderate Water Use 0.5
Banksia (Swamp) (Banksia robur)
Boronia (Red) (Boronia heterophylla)
Flame Pea (Chorizema cordatum)
Snowy Daisy Bush (Olearia lirata)
Native Heath (Epacris impressa)
2.1.3 High Water Use 0.7
Creamy Candles (Stackhousia monogyna)
Birds Nest Fern (Asplenium australasicum)
Soft Tree Fern (Dicksonia australis)
Weeping Fig (Ficus benjamina)
2.2 Exotic shrubs Crop Coefficient
2.2.1 Low Water Use 0.35
Abelia (Abelia x grandiflora)
Oleander (Nerium oleander)
Euphorbia (Crown of Thorns) (Euphorbia milii)
Lantana (Lantana camara)
Sedum (Ice Plant) (Sedum spectabile)
Yucca (Spannish Dagger) (Yucca gloriosa)
Hebe
2.2.2 Moderate Water Use 0.6
Camellia (Camellia sasanqua)
Daphne (Winter) (Daphne odora)
Japanese Honeysuckle (Lonicera japonica)
Green Star – Potable Water Calculator Guide --34
Date issued: 12 October 2012
Japanese Wisteria (Wisteria floribunda)
Dogwood (Buddleia davidii))
Pittosporum (Diamond leaf) (Pittosporum
rhombifolium)
Viburnum (Viburnum x burkerwoodii)
Rose (Rosa spp)
Azalea
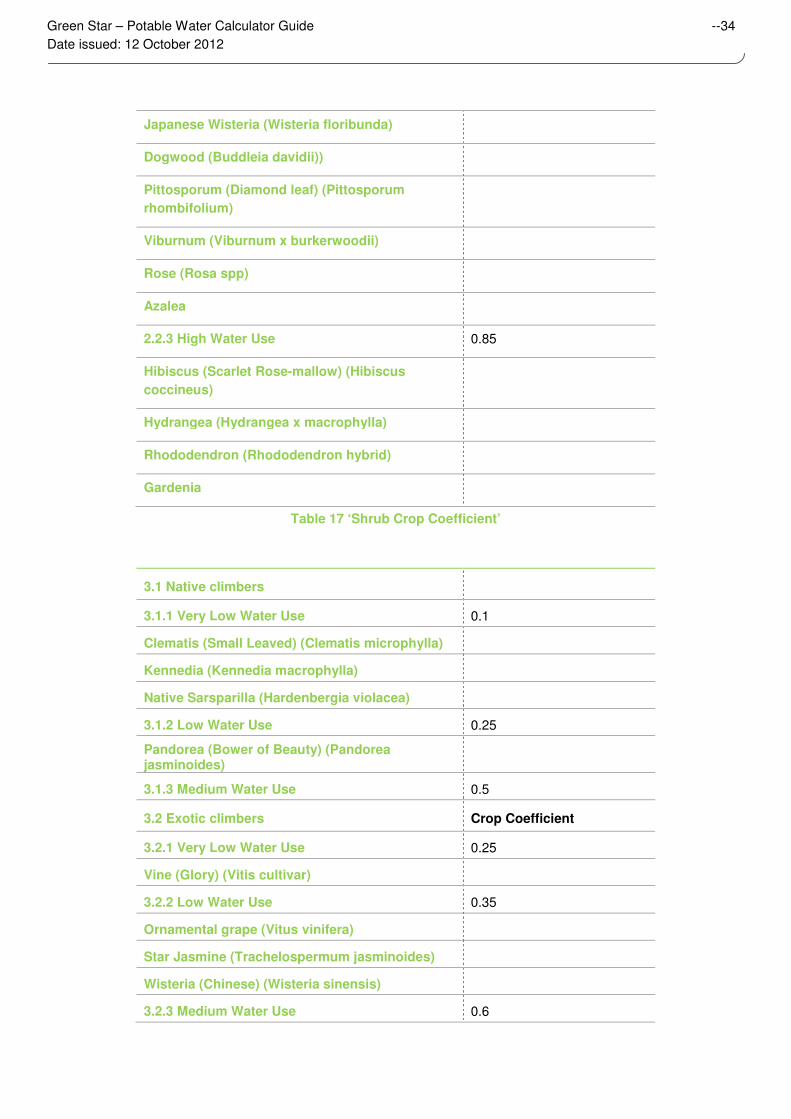
2.2.3 High Water Use 0.85
Hibiscus (Scarlet Rose-mallow) (Hibiscus
coccineus)
Hydrangea (Hydrangea x macrophylla)
Rhododendron (Rhododendron hybrid)
Gardenia
Table 17 ‘Shrub Crop Coefficient’
3. Climbers Crop Coefficient
3.1 Native climbers
3.1.1 Very Low Water Use 0.1
Clematis (Small Leaved) (Clematis microphylla)
Kennedia (Kennedia macrophylla)
Native Sarsparilla (Hardenbergia violacea)
3.1.2 Low Water Use 0.25
Pandorea (Bower of Beauty) (Pandorea jasminoides)
3.1.3 Medium Water Use 0.5
3.2 Exotic climbers Crop Coefficient
3.2.1 Very Low Water Use 0.25
Vine (Glory) (Vitis cultivar)
3.2.2 Low Water Use 0.35
Ornamental grape (Vitus vinifera)
Star Jasmine (Trachelospermum jasminoides)
Wisteria (Chinese) (Wisteria sinensis)
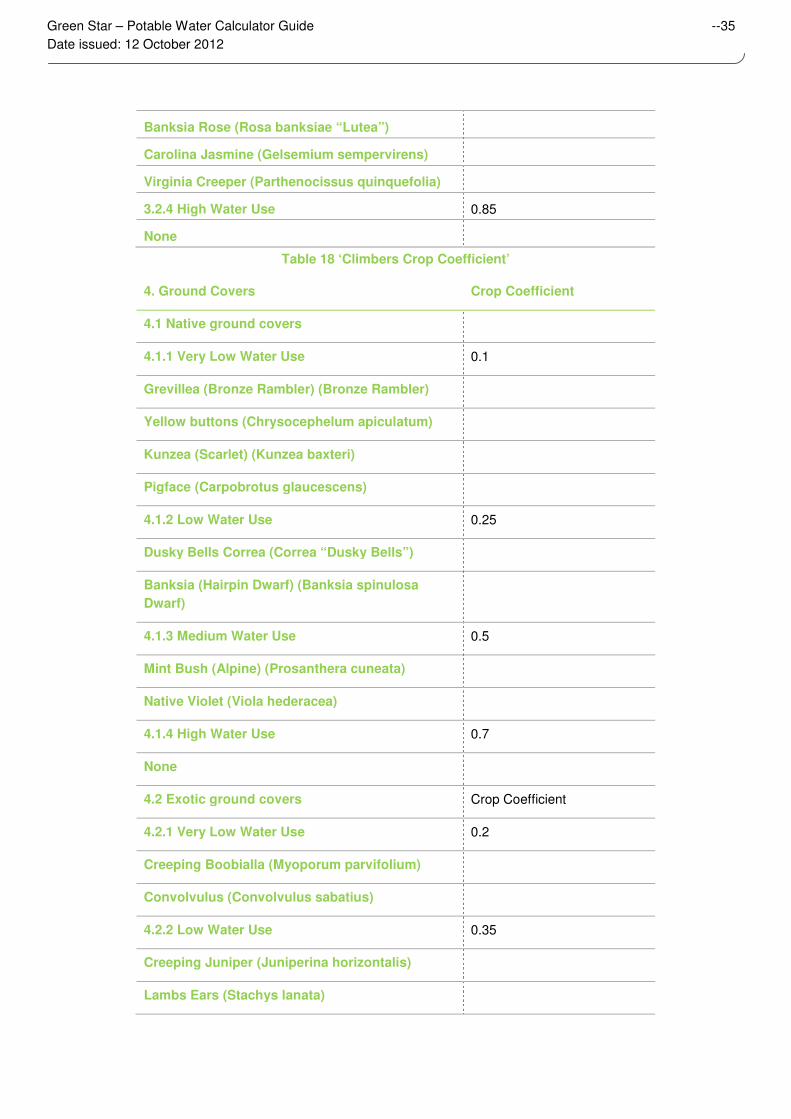
3.2.3 Medium Water Use 0.6
Green Star – Potable Water Calculator Guide --35
Date issued: 12 October 2012
Banksia Rose (Rosa banksiae “Lutea”)
Carolina Jasmine (Gelsemium sempervirens)
Virginia Creeper (Parthenocissus quinquefolia)
3.2.4 High Water Use 0.85
None
Table 18 ‘Climbers Crop Coefficient’
4. Ground Covers Crop Coefficient
4.1 Native ground covers
4.1.1 Very Low Water Use 0.1
Grevillea (Bronze Rambler) (Bronze Rambler)
Yellow buttons (Chrysocephelum apiculatum)
Kunzea (Scarlet) (Kunzea baxteri)
Pigface (Carpobrotus glaucescens)
4.1.2 Low Water Use 0.25
Dusky Bells Correa (Correa “Dusky Bells”)
Banksia (Hairpin Dwarf) (Banksia spinulosa
Dwarf)
4.1.3 Medium Water Use 0.5
Mint Bush (Alpine) (Prosanthera cuneata)
Native Violet (Viola hederacea)
4.1.4 High Water Use 0.7
None
4.2 Exotic ground covers Crop Coefficient
4.2.1 Very Low Water Use 0.2
Creeping Boobialla (Myoporum parvifolium)
Convolvulus (Convolvulus sabatius)
4.2.2 Low Water Use 0.35
Creeping Juniper (Juniperina horizontalis)
Lambs Ears (Stachys lanata)
Green Star – Potable Water Calculator Guide --36
Date issued: 12 October 2012
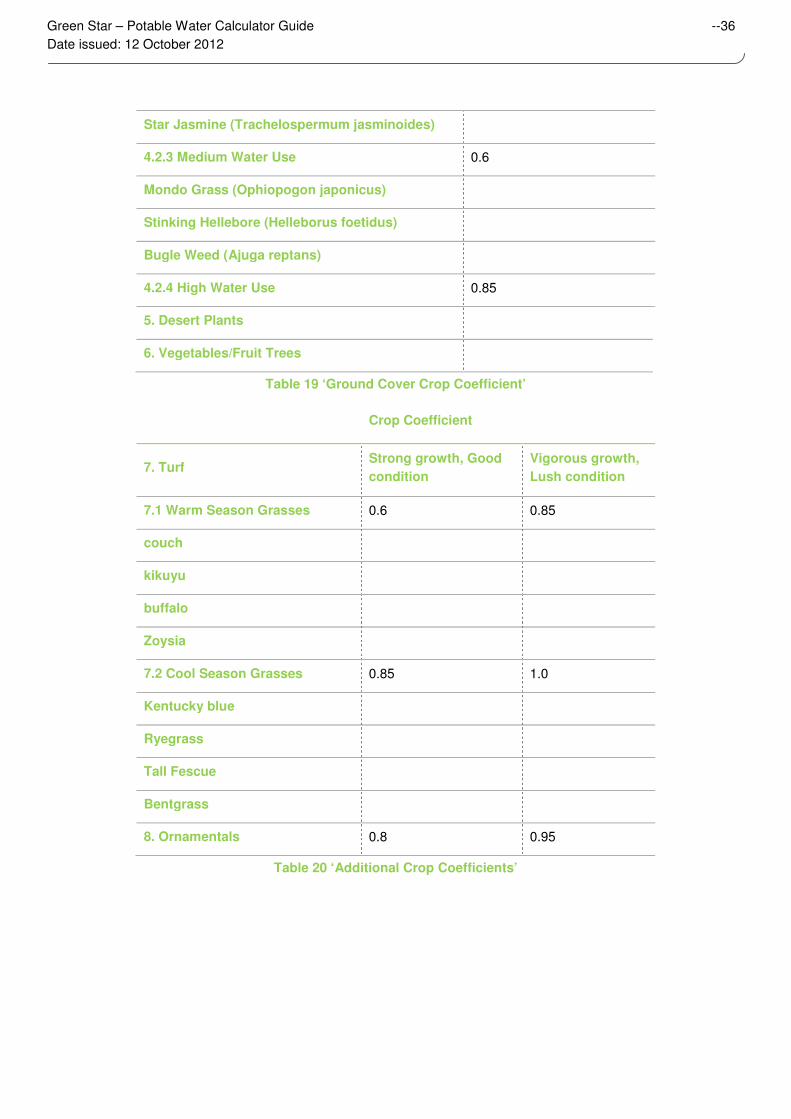
Star Jasmine (Trachelospermum jasminoides)
4.2.3 Medium Water Use 0.6
Mondo Grass (Ophiopogon japonicus)
Stinking Hellebore (Helleborus foetidus)
Bugle Weed (Ajuga reptans)
4.2.4 High Water Use 0.85
5. Desert Plants
6. Vegetables/Fruit Trees
Table 19 ‘Ground Cover Crop Coefficient’
Crop Coefficient
7. Turf Strong growth, Good
condition
Vigorous growth,
Lush condition
7.1 Warm Season Grasses 0.6 0.85
couch
kikuyu
buffalo
Zoysia
7.2 Cool Season Grasses 0.85 1.0
Kentucky blue
Ryegrass
Tall Fescue
Bentgrass
8. Ornamentals 0.8 0.95
Table 20 ‘Additional Crop Coefficients’