GREEN PACKET BERHAD ( 534942-H ) (Incorporated in Malaysia ...
13
GREEN PACKET BERHAD ( 534942-H ) (Incorporated in Malaysia) 30/6/2018 30/6/2017 30/6/2018 30/6/2017 (Unaudited) (Unaudited) (Unaudited) (Unaudited) RM '000 RM '000 RM '000 RM '000 Revenue 103,585 82,694 210,131 162,019 Operating expenses -Depreciation & amortisation (659) (773) (1,339) (1,473) -Other operating costs (109,573) (81,279) (217,775) (160,914) Other income 484 355 1,282 543 (Loss)/Profit from operations (6,163) 997 (7,701) 175 Share of losses in associate companies (515) (126) (1,943) (852) Finance costs (4,802) (4,058) (9,414) (8,067) Loss before tax (11,480) (3,187) (19,058) (8,744) - Income tax expense 272 (392) 47 (226) Loss for the period (11,208) (3,579) (19,011) (8,970) Fair value gain on other quoted investment - - 2,137 - Foreign currency translation differences for foreign operations 4,562 (2,033) 6,352 (2,118) Total other comprehensive income/(expenses) for the period 4,562 (2,033) 8,489 (2,118) Total comprehensive loss for the period (6,646) (5,612) (10,522) (11,088) Loss attributable to: Owners of the Company (10,215) (3,502) (17,268) (8,799) Non-controlling interests (993) (77) (1,743) (171) Loss for the Period (11,208) (3,579) (19,011) (8,970) Total comprehensive loss attributable to: Owners of the Company (5,653) (5,535) (8,779) (10,917) Non-controlling interests (993) (77) (1,743) (171) Total comprehensive loss for the period (6,646) (5,612) (10,522) (11,088) (1.3) (0.5) (2.3) (1.2) Basic loss per ordinary share (sen): The condensed consolidated statements of comprehensive income should be read in conjunction with the audited financial statements for the year ended 31 December 2017. CONDENSED CONSOLIDATED STATEMENTS OF COMPREHENSIVE INCOME FOR THE FINANCIAL PERIOD ENDED 30 JUNE 2018 Individual Quarter Cumulative Quarter 3 Months Period Ended 6 Months Period Ended Page 1 of 13
Transcript of GREEN PACKET BERHAD ( 534942-H ) (Incorporated in Malaysia ...

GREEN PACKET BERHAD ( 534942-H )
(Incorporated in Malaysia)
30/6/2018 30/6/2017 30/6/2018 30/6/2017
(Unaudited) (Unaudited) (Unaudited) (Unaudited)
RM '000 RM '000 RM '000 RM '000
Revenue 103,585 82,694 210,131 162,019
Operating expenses
-Depreciation & amortisation (659) (773) (1,339) (1,473)
-Other operating costs (109,573) (81,279) (217,775) (160,914)
Other income 484 355 1,282 543
(Loss)/Profit from operations (6,163) 997 (7,701) 175
Share of losses in associate companies (515) (126) (1,943) (852)
Finance costs (4,802) (4,058) (9,414) (8,067)
Loss before tax (11,480) (3,187) (19,058) (8,744)-
Income tax expense 272 (392) 47 (226)
Loss for the period (11,208) (3,579) (19,011) (8,970)
Fair value gain on other quoted investment - - 2,137 -
Foreign currency translation differences for
foreign operations 4,562 (2,033) 6,352 (2,118)
Total other comprehensive income/(expenses) for the period 4,562 (2,033) 8,489 (2,118)
Total comprehensive loss for the period (6,646) (5,612) (10,522) (11,088)
Loss attributable to:
Owners of the Company (10,215) (3,502) (17,268) (8,799)
Non-controlling interests (993) (77) (1,743) (171)
Loss for the Period (11,208) (3,579) (19,011) (8,970)Results for the financial period ended 30 June 2016)
Total comprehensive loss attributable to:
Owners of the Company (5,653) (5,535) (8,779) (10,917)
Non-controlling interests (993) (77) (1,743) (171)
Total comprehensive loss for the period (6,646) (5,612) (10,522) (11,088)
(1.3) (0.5) (2.3) (1.2) Basic loss per ordinary share (sen):
The condensed consolidated statements of comprehensive income should be read in conjunction with the audited financial statements for the year
ended 31 December 2017.
CONDENSED CONSOLIDATED STATEMENTS OF COMPREHENSIVE INCOME FOR THE FINANCIAL PERIOD ENDED
30 JUNE 2018
Individual Quarter Cumulative Quarter
3 Months Period Ended 6 Months Period Ended
Page 1 of 13

GREEN PACKET BERHAD ( 534942-H )
(Incorporated in Malaysia)
CONDENSED CONSOLIDATED STATEMENTS OF FINANCIAL POSITION AS AT 30 JUNE 2018
As at As at
30/6/2018 31/12/2017Explanatory Notes Pursuant to Malaysian Financial Reporting Standard ("MFRS") 134 Interim Financial Reporting(Unaudited) (Audited)
RM '000 RM '000
ASSETS
Investment in associates 36,157 38,099
Property, plant and equipment 5,982 6,626
Other long term investments 270,291 267,621
Intangible Assets 13,059 12,422
Development costs 10,794 8,534
Total non-current assets 336,283 333,302
Inventories 12,553 1,347
Trade receivables 125,374 148,077
Other receivables, deposits and prepayments 36,317 27,890
Tax recoverable 2,317 2,479
Fixed deposits with licensed banks 8,615 10,971
Cash and bank balances 19,187 31,110
Total current assets 204,363 221,874888.//.
TOTAL ASSETS 540,646 555,176
EQUITY
Share capital 155,880 155,880
Reserves 3,099 11,879
158,979 167,759
Non-controlling interests (480) 1,723Additional investment in an associate
Total equity 158,499 169,482
LIABILITIES
Long term borrowings 243,238 234,424
Hire purchase and finance lease liabilities 260 260
Deferred tax liabilities 2,221 2,481
Total non-current liabilities 245,719 237,165
Trade payables 106,805 128,537
Other payables and accruals 18,385 19,872
Short term borrowings 11,178 -
Hire purchase and finance lease liabilities 60 120
Total current liabilities 136,428 148,529
TOTAL LIABILITIES 382,147 385,694
TOTAL EQUITY AND LIABILITIES 540,646 555,176Results for the financial period ended 30 June 2016)
21 22
Total equity attributable to owners of the Company
Net asset per share attributable to ordinary equity holders
of the parent (sen)
The condensed consolidated statements of financial position should be read in conjunction with the audited
financial statements for the year ended 31 December 2017.
Page 2 of 13

GREEN PACKET BERHAD ( 534942-H )
(Incorporated in Malaysia)
Shares
Capital
Shares
Premium
Foreign
Exchange
Translation
Reserves
Treasury
Shares
Fair Value
Reserves
Accumulated
Losses
Sub-total Non-
controlling
Interests
Total
Equity
RM '000 RM '000 RM '000 RM '000 RM '000 RM '000 RM '000 RM '000 RM '000
Unaudited
At 1 January 2018 155,880 412,796 4,438 (12,217) 40,328 (433,466) 167,758 1,723 169,481
Fair value gain on other quoted investment - - - - 2,137 - 2,137 - 2,137
Foreign currency translation differences for
foreign operations - - 6,352 - - - 6,352 - 6,352
Acquisition of non-controlling interest - - - - - - - (460) (460)
Loss for the period - - - - - (17,268) (17,268) (1,743) (19,011)
- - 6,352 - 2,137 (17,268) (8,779) (2,203) (10,982)
At 30 June 2018 155,880 412,796 10,790 (12,217) 42,464 (450,734) 158,979 (480) 158,499
The share premium has not been transferred to the share capital pursuant to Section 618 of the Companies Act 2016.
CONDENSED CONSOLIDATED STATEMENTS OF CHANGES IN EQUITY FOR THE FINANCIAL PERIOD ENDED 30 JUNE 2018
-----------------------------------Attributable to owners of the Company -----------------------------------
Non-Distributable______________________________________________
The condensed consolidated statements of financial position should be read in conjunction with the audited financial statements for the year ended 31 December 2017.
Page 3 of 13

GREEN PACKET BERHAD ( 534942-H )
(Incorporated in Malaysia)
Shares
Capital
Shares
Premium
Foreign
Exchange
Translation
Reserves
Treasury
Shares
Accumulated
Losses
Sub-total Non-
controlling
Interests
Total
Equity
RM '000 RM '000 RM '000 RM '000 RM '000 RM '000 RM '000 RM '000
Unaudited
At 1 January 2017 138,089 412,796 8,655 (12,217) (417,269) 130,054 88 130,142
Issue of ordinary shares 18,093 - - - - 18,093 - 18,093
Share issues expenses - (302) - - - (302) - (302)
Foreign currency translation differences for - -
foreign operations - - (2,118) - - (2,118) - (2,118)
Acquisition of non-controlling interest - - - - - - 1,066 1,066
Loss for the period - - - - (8,799) (8,799) (171) (8,970)
18,093 (302) (2,118) - (8,799) 6,874 895 7,769
At 30 June 2017 156,182 412,494 6,537 (12,217) (426,068) 136,928 983 137,911
-----------------------------------Attributable to Equity Holders of the Parent -----------------------------------
Non-Distributable______________________________________________
The condensed consolidated statements of financial position should be read in conjunction with the audited financial statements for the year ended 31 December 2017.
CONDENSED CONSOLIDATED STATEMENTS OF CHANGES IN EQUITY FOR THE FINANCIAL PERIOD ENDED 30 JUNE 2017
Page 4 of 13

GREEN PACKET BERHAD ( 534942-H )
(Incorporated in Malaysia)
30/6/2018 30/6/2017
RM'000 RM'000
(Unaudited) (Unaudited)
CASH FLOW (FOR)/FROM OPERATING ACTIVITIES
Loss before taxation (19,058) (8,745)
Adjustments for non cash items:-
Amortisation of development cost 234 47
Amortisation of intangible assets - -
Depreciation of property, plant and equipment 1,104 913
Interest income (136) (405)
Interest expense 9,277 7,935
Share of loss of associates 1,943 852
Fair value gains (533) -
Operating profit/(loss) before working capital changes (7,169) 597
Changes in working capital
Decrease/(Increase) in inventories (11,206) (2,052)
Decrease/(Increase) in assets 14,276 106,999
(Decrease)/Increase in liabilities (23,220) (82,683)
Cash (for)/from operating activities (27,319) 22,861
Interest received 136 405
Tax paid (51) (2,301)
Net cash (for)/from operating activities (27,234) 20,965
CASH FLOW FOR INVESTING ACTIVITIES
Acquisition of subsidiary (1,099) (6,000)
Cash from investing subsidiary - 1,905
Purchase of other investment - (6,460)
Purchase of property, plant and equipment (460) (1,281)
Development costs incurred (2,492) (3,393)
Advance to related companies - (456)
Net cash for investing activities (4,052) (15,685)
CASH FLOW FROM FINANCING ACTIVITIES
Proceeds from issuance of ordinary shares (net of expenses) - 17,790
Net Drawdown/(Repayment) of borrowings 10,722 (225)
Net withdrawal of fixed deposit pledged to a licensed bank 1,542 3,271
Repayment of hire purchase obligations (68) (68)
Net cash from financing activities 12,196 20,768
Net (decrease)/increase in cash and cash equivalents (19,090) 26,048
Foreign exchange translation differences 6,352 (2,118)
CASH AND CASH EQUIVALENTS AT BEGINNING OF THE FINANCIAL YEAR 33,128 49,075
CASH AND CASH EQUIVALENTS AT END OF THE FINANCIAL YEAR 20,390 73,006
Cash and cash equivalents at the end of the financial period comprise the following:
Cash and bank balances 19,187 40,746
Fixed deposit with licensed bank 8,615 42,320
27,802 83,066
Fixed deposit pledged with licensed bank (7,412) (10,060)
20,390 73,006
CONDENSED CONSOLIDATED STATEMENTS OF CASH FLOWS FOR THE FINANCIAL PERIOD ENDED 30 JUNE 2018
Financial period ended
The condensed consolidated statements of financial position should be read in conjunction with the audited financial statements for the year ended
31 December 2017.
Page 5 of 13

GREEN PACKET BERHAD ( 534942-H )(Incorporated in Malaysia)
A
A1 Basis of preparation
A2 Changes in accounting policies
a)
b)
c)
d)
e)
a)
b)
c)
A3 Auditors' report on preceding annual financial statements
A4 Seasonal or cyclical of operations
A5 Unusual items
A6 Material changes in estimates
A7 Changes in debts or equity securities
A8 Dividends payment
There were no unusual items affecting assets, liabilities, equity, net income or cash flows of the Group during the current
financial quarter under review.
There were no material changes in estimates of amounts reported in prior financial years, which may have a material effect in
the current financial period under review.
There were no issuances, cancellations, repurchases, resale and repayments of debt and equity securities during the period
ended 30 June 2018.
There were no dividends paid or proposed during the current financial period under review.
The following MFRS have been issued by the MASB and are effective for annual period commencing on or after
1 January 2019, and have yet to be adopted by the Group:
MFRS 16: Leases
Amendments to MFRS 10 and MFRS 128: Sale or Contribution of Assets between an Investor and its Associate or
Joint Venture (Deferred)
IC Interpretation 23 : Uncertainty over Income Tax Treatments
The auditors issued an unqualified audit opinion on the financial statements for the year ended 31 December 2017.
The Group's operations were not materially affected by any seasonal and cyclical factors.
Amendments to MFRS 2 : Classification and Measurement of Share-based Payment Transactions
MFRS 9: Financial Instrument
MFRS 15: Revenue from Contracts with Customers
Amendments to MFRS 128: Investments in Associates and Joint Ventures (Annual Improvements to MFRSs 2014-2016)
IC Interpretation 22 : Foreign Currency Translations and Advance Consideration
The adoption of the above standards and interpretations does not have significant financial impact to the Group's consolidated
financial statements for the current quarter.
NOTES TO THE FINANCIAL STATEMENTS FOR THE FINANCIAL PERIOD ENDED 30 JUNE 2018
Explanatory Notes Pursuant to Malaysian Financial Reporting Standard ("MFRS") 134 Interim Financial Reporting
The interim financial report has been prepared in accordance with Malaysian Financial Reporting Standards ("MFRS") 134
"Interim Financial Reporting" issued by the Malaysian Accounting Standards Board ("MASB") and Paragraph 9.22 and
Appendix 9B of Chapter 9 Part K of the Main Listing Requirement of Bursa Malaysia Securities Berhad ("BMSB"). The
interim financial report should be read in conjunction with the audited financial statements of the Group for the financial year
ended 31 December 2017.
The significant accounting policies and methods of computation adopted for the interim financial statements are consistent with
those of the audited financial statements for the financial year ended 31 December 2017 except for the new standards,
amendments to publish standards and interpretations that are mandatory for the Group’s financial year beginning on or after 1
January 2018 as set out below:
Page 6 of 13

A9 Segmental information
Malaysia Overseas Group
RM`000 RM`000 RM`000
Revenue
Software and Devices - 24,673 24,673
Communication Services - 183,633 183,633
E-Services 1,825 - 1,825
1,825 208,306 210,131
Results
Software and Devices - (1,136) (1,136)
Communication Services - 2,360 2,360
Digital Services (7,598) - (7,598)
Investment Holding (1,463) - (1,463)
(9,061) 1,224 (7,837)
Finance costs (9,414)
Finance income 136
(17,115)
Share of net loss of associate (1,943)
Loss before taxation (19,058)
Income tax expense 47
Loss after taxation (19,011)
Non-controlling interests 1,743
Loss after taxation & non-controlling interests (17,268)
Malaysia Overseas Group
RM`000 RM`000 RM`000
Revenue
Software and Devices - 52,662 52,662
Communication Services 300 108,494 108,794
E-Services 563 - 563
863 161,156 162,019
Results
Software and Devices - 1,135 1,135
Communication Services (7) 1,235 1,228
E-Services (2,773) - (2,773)
Investment Holding 180 - 180
(2,600) 2,370 (230)
Finance costs (8,067)
Finance income 405
(7,892)
Share of net loss of associate (852)
Loss before taxation (8,744)
Income tax expense (226)
Loss after taxation (8,970)
Non-controlling interests 171
Loss after taxation & Non-controlling interests (8,799)
A10 Valuation of property, plant and equipment
A11 Material events subsequent to the end of the quarter
A12 Changes in the composition of the Group
Results for the financial period ended 30 June 2018
Results for the financial period ended 30 June 2017
Property, plant and equipment are stated at cost less accumulated depreciation and impairment loss.
There is no material events subsequent to the end of the quarter.
There is no change in the composition of the Group during the current financial quarter ended 30 June 2018.
Segmental information is provided based on geographical segment by customers' location as follows:-
Page 7 of 13

A13 Contingent assets and changes in contingent liabilities
A14 Capital commitments
The Group does not have any capital commitments at the date of the announcement.
A15 Significant related party transactions
The Group does not have any contingent assets at the date of this announcement and there were no changes in contingent
liabilities since the last annual balance sheet date.
The Directors of GPB are of the opinion that there are no related party transactions which would have material impact on the
financial position and the business of the Group during the current financial year under review.
Page 8 of 13

B1 Review of the performance of the Group
Financial review for current quarter and financial year to date:-
30-Jun-18 30-Jun-17 30-Jun-18 30-Jun-17RM million RM million RM million RM million
Revenue 103.58 82.69 25% 210.13 162.02 30%Operating (Loss) (6.16) 1.00 -718% (7.70) 0.18 -4501%EBITDA (5.50) 1.77 -411% (6.36) 1.65 -486%(Loss) Before Tax (11.48) (3.19) -260% (19.06) (8.74) -118%(Loss) After Tax (11.21) (3.58) -213% (19.01) (8.97) -112%
(10.22) (3.50) -192% (17.27) (8.80) -96%
Group's Segmental Analysis:-
Revenue contribution comprises the following:-
30-Jun-18 30-Jun-17 30-Jun-18 30-Jun-17
RM million RM million RM million RM million
Software and Devices 6.11 27.38 -78% 24.67 52.66 -53%
Communication Services 96.17 55.04 75% 183.63 108.79 69%
Digital Services 1.31 0.28 370% 1.83 0.56 224%
Total 103.58 82.69 25% 210.13 162.02 30%
•
•
•
30-Jun-18 30-Jun-17 30-Jun-18 30-Jun-17
RM million RM million RM million RM million
Software and Devices (1.31) 1.38 -195% (1.06) 1.81 -159%
Communication Services 0.55 1.36 -59% 2.76 1.81 52%
Digital Services (3.69) (1.08) -241% (6.91) (2.11) -227%
Investment Holding (1.05) 0.11 -1059% (1.15) 0.14 -930%
Total (5.50) 1.77 -411% (6.36) 1.65 -486%
The EBITDA losses of RM5.50 million in the current quarter compared to a EBITDA profits of RM1.77 million in the previous
corresponding quarter were mainly due to continue investment in business development costs consisting mainly of staff costs
and sales/marketing costs incurred to build the Digital Services business, substantially lower revenue from the Software and
Devices business and dropped in gross profits margins despite higher revenue in the Communication business .
The Communication Services business recorded a higher revenue of 75% in the current quarter as compared to the
previous year on year mainly due to improved sales from most of the countries in ASEAN.
The Digital Services business continue to register improved revenue of 370% in the current quarter as compared to the
previous year on year mainly due to contribution from new major projects secured during the year.
EBITDA comprises the following:-
3 months period ended% Change
6 months period ended% Change
Total revenue, EBITDA profits and loss after tax ("LAT") of the Group stands at approximately RM82.69 million, RM1.77
million and RM3.58 million respectively for the financial year ended at 30 June 2017 ("2Q17").
3 months period ended% Change
6 months period ended% Change
Software and Devices business registered 78% lower sales in the current quarter compared to year on year basis mainly
due to lower devices shipment to a major customer in Philipines compared to the previous year corresponding quarter.
3 months period ended% Change
6 months period ended% Change
(Loss) Attributable
to Ordinary Equity
Holders of the Parent
Total revenue, EBITDA losses and loss after tax ("LAT") of the Group stands at approximately RM103.58 million, RM5.5
million and RM11.21 million respectively for the current financial quarter ended at 30 June 2018 ("2Q18").
Explanatory Notes Pursuant to Appendix 9B of the Listing Requirements of Bursa Securities
Page 9 of 13
30-Jun-18 30-Jun-17 30-Jun-18 30-Jun-17
RM million RM million RM million RM million
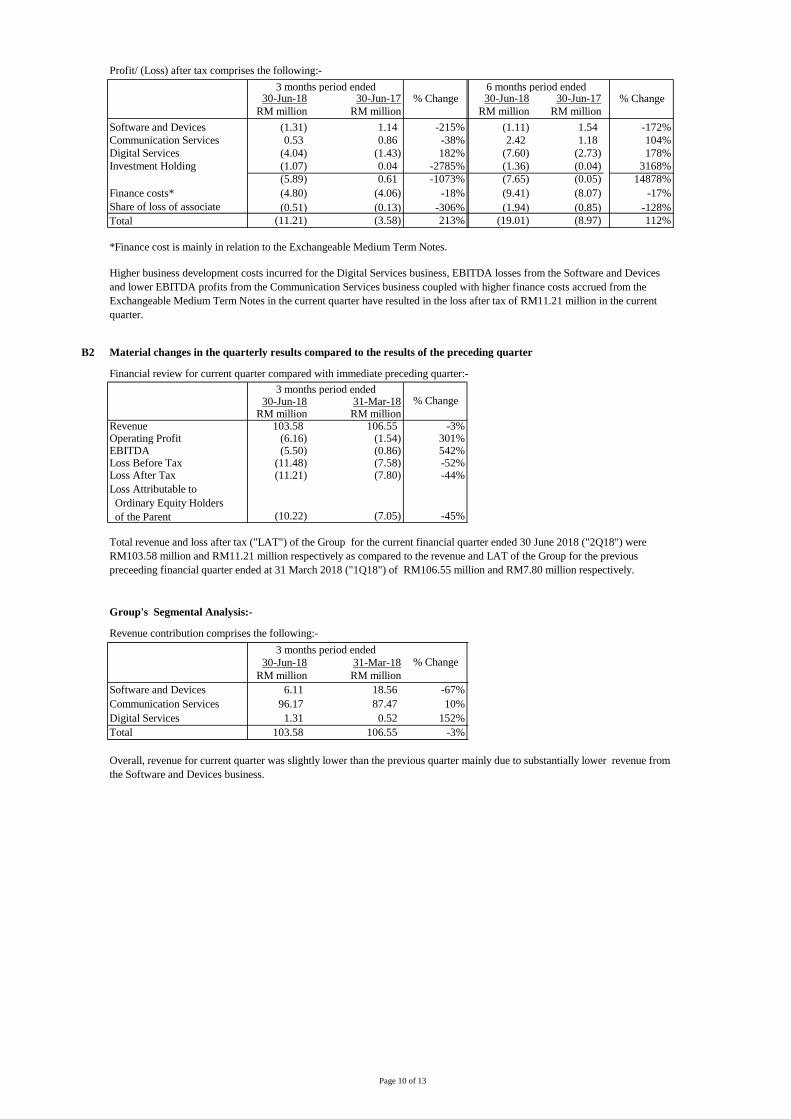
Software and Devices (1.31) 1.14 -215% (1.11) 1.54 -172%
Communication Services 0.53 0.86 -38% 2.42 1.18 104%
Digital Services (4.04) (1.43) 182% (7.60) (2.73) 178%
Investment Holding (1.07) 0.04 -2785% (1.36) (0.04) 3168%
(5.89) 0.61 -1073% (7.65) (0.05) 14878%
Finance costs* (4.80) (4.06) -18% (9.41) (8.07) -17%
Share of loss of associate (0.51) (0.13) -306% (1.94) (0.85) -128%
Total (11.21) (3.58) 213% (19.01) (8.97) 112%
*Finance cost is mainly in relation to the Exchangeable Medium Term Notes.
B2 Material changes in the quarterly results compared to the results of the preceding quarter
Financial review for current quarter compared with immediate preceding quarter:-
30-Jun-18 31-Mar-18RM million RM million
Revenue 103.58 106.55 -3%Operating Profit (6.16) (1.54) 301%EBITDA (5.50) (0.86) 542%Loss Before Tax (11.48) (7.58) -52%Loss After Tax (11.21) (7.80) -44%
(10.22) (7.05) -45%
Group's Segmental Analysis:-
Revenue contribution comprises the following:-
30-Jun-18 31-Mar-18
RM million RM million
Software and Devices 6.11 18.56 -67%
Communication Services 96.17 87.47 10%
Digital Services 1.31 0.52 152%
Total 103.58 106.55 -3%
Loss Attributable to
Ordinary Equity Holders
of the Parent
Total revenue and loss after tax ("LAT") of the Group for the current financial quarter ended 30 June 2018 ("2Q18") were
RM103.58 million and RM11.21 million respectively as compared to the revenue and LAT of the Group for the previous
preceeding financial quarter ended at 31 March 2018 ("1Q18") of RM106.55 million and RM7.80 million respectively.
3 months period ended% Change
Overall, revenue for current quarter was slightly lower than the previous quarter mainly due to substantially lower revenue from
the Software and Devices business.
Higher business development costs incurred for the Digital Services business, EBITDA losses from the Software and Devices
and lower EBITDA profits from the Communication Services business coupled with higher finance costs accrued from the
Exchangeable Medium Term Notes in the current quarter have resulted in the loss after tax of RM11.21 million in the current
quarter.
3 months period ended% Change
Profit/ (Loss) after tax comprises the following:-
3 months period ended% Change
6 months period ended% Change
Page 10 of 13

30-Jun-18 31-Mar-18
RM million RM million
Software and Devices (1.31) 0.25 621%
Communication Services 0.55 2.21 75%
Digital Services (3.69) (3.22) -15%
Investment Holding (1.05) (0.10) 934%
Total (5.50) (0.86) 542%
30-Jun-18 31-Mar-18
RM million RM million
Software and Devices (1.31) 0.20 769%
Communication Services 0.53 1.89 72%
Digital Services (4.04) (3.56) -13%
Investment Holding (1.07) (0.29) 272%
(5.89) (1.76) 234%Finance costs* (4.80) (4.61) -4%
Share of loss of associate (0.51) (1.43) 64%
Total (11.21) (7.80) -44%
*Finance cost is mainly in relation to the Exchangeable Medium Term Notes.
B3 Current prospects and progress on previously announced financial estimates
a) Current prospects
a.
b. Expand the wholesale voice traffic and grow the wholesale data services.
c.
d.
b)
There was no financial forecast previously announced by the Group.
B4
Not applicable
B5 Financial estimate, forecast or projection/profit guarantee
There was no financial estimate, forecast or projection and profit guarantee issued by the Group.
B6 Income tax expense
Financial
period ended30-Jun-18RM'000
Current period tax expense (47)
Progress and steps to achieve financial estimate, forecast, projection and internal targets previously announced
Statement of the Board of Directors' opinion on achievebility of financial estimate, forecast, projection and internal
targets previously announced
The Company is continuing its efforts to improve the performance of the Group in the following ways:-
Secure greater geographical reach in markets for new LTE products.
Focus to drive business growth in the Internet of Things ("IOT") and Digital Services platform in the current financial
year which are complementary to and synergistic with the existing 2 business pillars and having the potential to
contribute positively to the Group.
Upsell new media devices and IOT products to its global telecommunication customers.
3 months period ended% Change
EBITDA losses of RM5.50 million in the current quarter were higher as compared with the EBITDA losses of RM0.86 millon
in the preceeding quarter were mainly due to losses in the Software and Devices business and lower EBITDA profits from the
Communication Services. This was due to substantially lower revenue from the Software and Devices business and dropped in
gross profits margins in the Communication business.
Loss after tax comprises the following:-
3 months period ended% Change
EBITDA comprises the following:-
Page 11 of 13

B7 Status of corporate proposals and utilisation of proceeds
The status of corporate proposals announced but not completed are as follow:
a)
b)
i)
ii)
B8 Group borrowings and debt securities
Non-current Current TotalRM '000 RM '000 RM '000
Secured:- Exchangeable medium term notes 242,802 - 242,802- Term loan 436 227 663- Trade facilities - 3,856 3,856- Revolving Credits - 7,095 7,095
260 60 320
Total 243,498 11,238 254,736
Non-current Current TotalRM '000 RM '000 RM '000
Secured:- Exchangeable medium term notes 224,291 - 224,291
605 196 801
304 136 440
Total 225,200 332 225,532
B9 Material litigations
B10 Dividends
B11 Realised and unrealised losses disclosure
As at As at30-Jun-18 30-Jun-17RM'000 RM'000
- (896,141) (876,946)
- 203 (347)
445,204 451,224
(450,734) (426,068)
Realised accumulated lossesUnrealised retained profit/(loss)
Consolidation adjustments
Total Group accumulated losses
- Hire purchases creditors, which are denominated in Ringgit
Malaysia.
There were no material litigations involving the Group as at the date of this announcement.
No dividend has been declared or recommended in respect of the current financial period under review.
The Group's realised and unrealised accumulated losses disclosure are as follows:
Total accumulated losses of the Company and subsidiaries:
On 20 July 2018, the application for the Proposed Capital Reduction and Proposed SGS was approved by Bursa
Malaysia Securities Berhad
Total borrowings of the Group are as follows:As at 30 June 2018
- Hire purchases creditors, which are denominated
in Ringgit Malaysia.
As at 30 June 2017
- Term loan
On 22 June 2018, the Company ("GPB") had announced that its proposes to undertake a renounceable rights issue of up
to 150,202,583 Rights Shares on the basis of 1 Rights Share for every 5 existing GPB Shares held, together with up to
450,607,749 Warrants on the basis of 3 Warrants for every 1 Rights Share subscribed for, based on an entitlement date to
be determined later ("Proposed Rights Issues with Warrants"). Subsequently, on 11 July 2018, the application for the
Proposed Rights Issue with Warrants had been submitted to Bursa Malaysia Securities Berhad. On 10 August 2018, the
application for the Proposed Rights Issue with Warrants was approved by Bursa Malaysia Securities Berhad.
On 26 June 2018, the Company had announced to undertake the following proposals :
A capital reduction exercise pursuant to Section 116 of the Companies Act, 2016 (“Act”) to reduce the issued share
capital of GPB by an amount equivalent to the entire accumulated losses of the Company as at 31 December 2017
("Proposed Capital Reduction") and;
Establishment and implementation of a share grant scheme of up to 15% of the total number of issued shares of GPB
(excluding treasury shares) at any point in time during the duration of the Proposed Share Grant Scheme for the executive
directors and employees of GPB and its subsidiaries (excluding subsidiaries which are dormant) (“GPB Group” or
“Group”) who fulfil the eligibility criteria (“Proposed SGS”)
Page 12 of 13

B12 Earnings per share
30-Jun-18 30-Jun-17 30-Jun-18 30-Jun-17
(10,215) (3,502) (17,268) (8,799)
758,721 720,837 758,721 720,837
Basic earning per share (sen) (1.3) (0.5) (2.3) (1.2)
B13 Profit/(Loss) for the Period
30-Jun-18 30-Jun-17 30-Jun-18 30-Jun-17RM'000 RM'000 RM'000 RM'000
Profit/(Loss) for the period is arrived at after charging :Amortisation of :
- development cost 120 39 232 47
- intellectual property 0 - 2 -
Depreciation of plant and equipment 539 457 1,104 913
Rental of premises 404 370 787 733
Loss/(Gain) on foreign exchange
- realised 849 (181) 1,350 (62)
- unrealised (213) 424 (194) 540
Staff costs:
- defined contribution plan 569 357 901 671
- salaries and other benefits 5,962 6,212 11,510 10,579
Interest expense:
- hire purchase 4 4 8 8
- exchangeable medium term notes 4,798 4,054 9,406 8,059
and after crediting :
Interest income 112 273 136 405
B14 Authorisation for issue
The interim financial statements were authorised on 27 August 2018 for issue by the Board of Directors.
3 months period ended 6 months period ended
Loss attributable to ordinary equity holders of the
Company (RM'000)
Weighted average numbers of ordinary shares in issue of
RM0.20 par each ('000)
3 months period ended 6 months period ended
Basic EPS
Basic EPS is calculated by dividing the net profit/(loss) for the period by the weighted average number of ordinary shares in
issue during the period.
Page 13 of 13