Green Infrastructure and urban air quality - IAQM · Concrete/Brick 0.015 ... “Green...
20
Pugh, T. A. M., A. R. MacKenzie, et al. (2012). "The effectiveness of green infrastructure for improvement of air quality in urban street canyons." Environmental Science & Technology. DOI: 10.1021/es300826w Green Infrastructure and urban air quality Thomas A.M. Pugh, A. Robert MacKenzie, J. Duncan Whyatt, C. Nicholas Hewitt 1) Introduction 2) Current practice 3) New estimates 4) Conclusions & caveats IAQM, London, 28 June 2012
Transcript of Green Infrastructure and urban air quality - IAQM · Concrete/Brick 0.015 ... “Green...
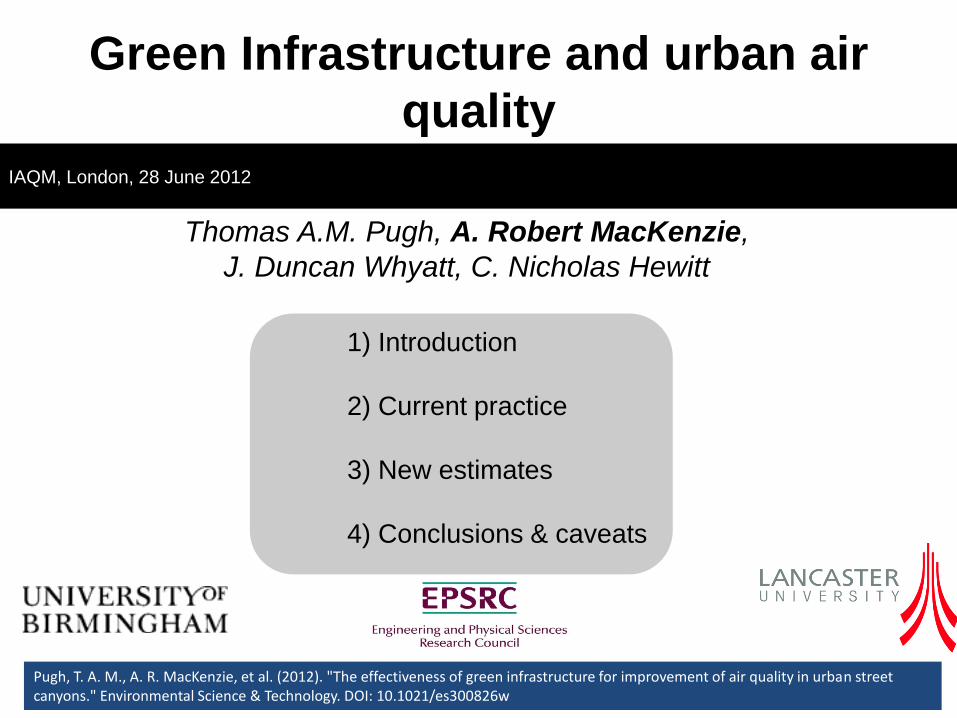
Pugh, T. A. M., A. R. MacKenzie, et al. (2012). "The effectiveness of green infrastructure for improvement of air quality in urban street canyons." Environmental Science & Technology. DOI: 10.1021/es300826w
Green Infrastructure and urban air
quality
Thomas A.M. Pugh, A. Robert MacKenzie,
J. Duncan Whyatt, C. Nicholas Hewitt
1) Introduction
2) Current practice
3) New estimates
4) Conclusions & caveats
IAQM, London, 28 June 2012

Introduction: Emission controls
Policy has focused on emissions control (at tail-pipe or through traffic control). Since ~2004, UK urban air NO2 concentrations have failed to show decreases expected from estimated emissions – especially at roadside. PM concentrations also stubbornly high.
Defra (2010) Air pollution in the UK 2010. (Defra, London).
1990 1990 2010 2010
Concentration = f(Emissions, Mixing, Deposition, Chemistry, Advection)
40
20
50
30

Dry deposition to green roofs and parks
Surface Typical NO2 Vd
(cm s-1) Typical PM10 Vd
(cm s-1)
Concrete/Brick 0.015 - 0.05 0.02 (vertical)
Vegetation 0.3 0.64
C = f( E,M,D …)
e.g., green roof, but same thinking can be applied to parks, gardens, etc.

Land use classification. E.g., West Midlands 900 km2, 27 land use attributes, 8 land use classes
The “constant boundary-layer concentration” method to determine pollutant deposition
Farms and villages
Light suburban
Very light suburban
Dense suburban
Dense urban/transport
Urban
Light urban/open water
Woodlands
Owen et al. (2006) Landscape and Urban Planning, 78, 311-319
F = Vd.C Calculated flux
Literature + land-use
Observed air concentrations

The “constant boundary-layer concentration” method to determine pollutant deposition
E.g.: McDonald, A.G. et al. Atmos. Environ. 41, 8455–8467 (2007)
Currie, & Bass, Estimates of air pollution mitigation with green plants and green roofs using the UFORE model. Urban Ecosyst. 11, 409-422 (2008).
Tallis ,et al., Landscape and Urban Planning 103, 129– 138 (2011)
Method makes two assumptions: • constant pollutant air concentration - implies that depositional loss is too small to
significantly impact the concentration. Otherwise, will over-estimate the deposition.
• a well-mixed urban boundary layer. Will under-estimate deposition.
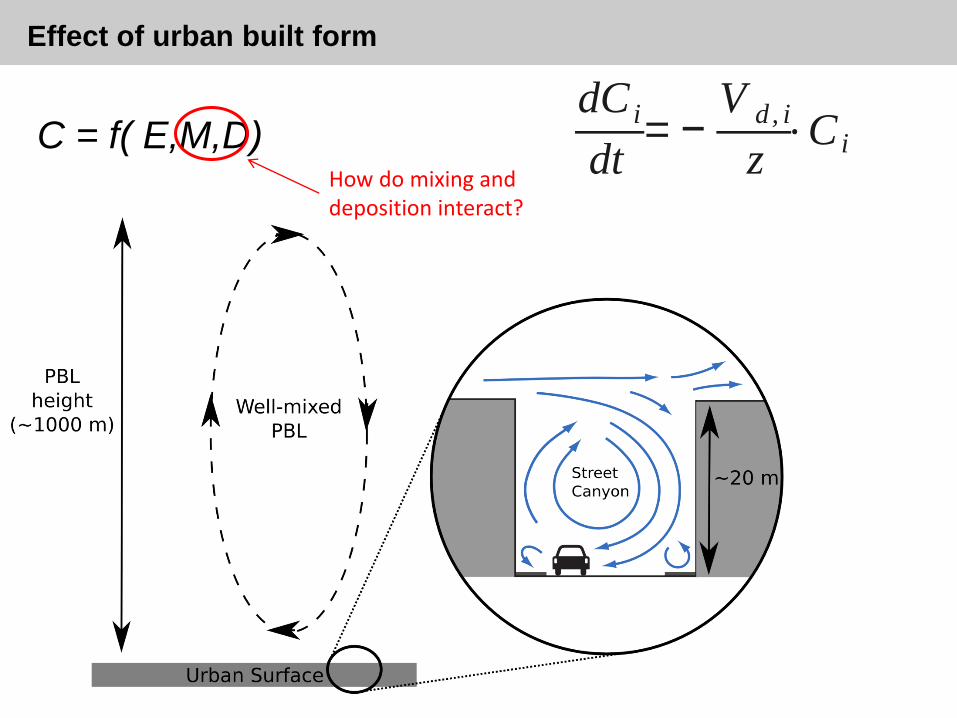
Effect of urban built form
dC i
dt= −
V d, i
z⋅C iC = f( E,M,D)
How do mixing and deposition interact?
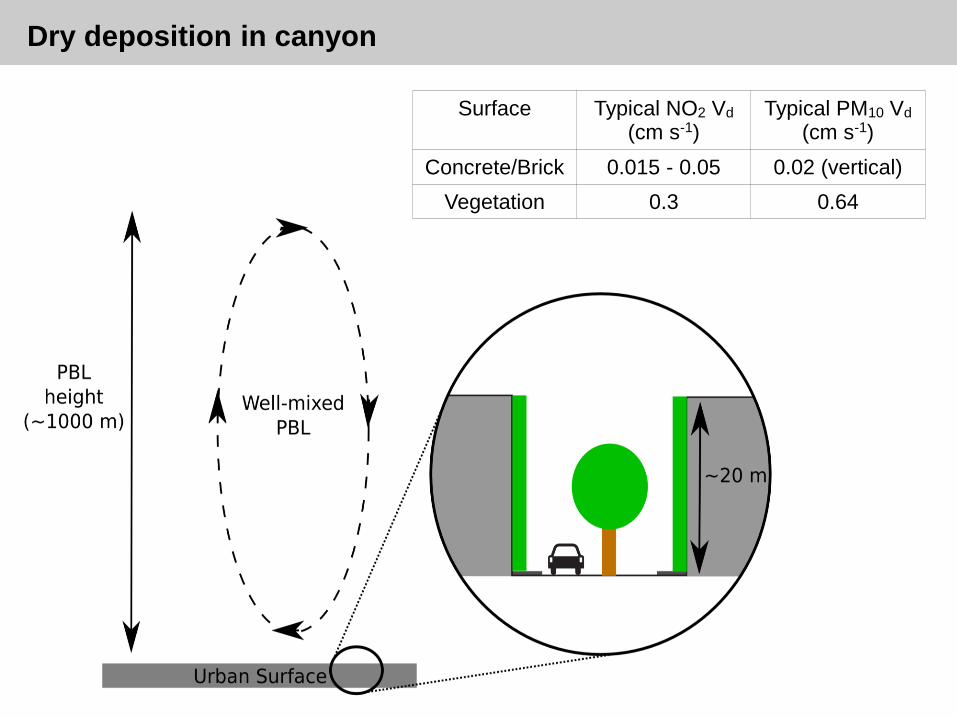
Dry deposition in canyon
Surface Typical NO2 Vd
(cm s-1) Typical PM10 Vd
(cm s-1)
Concrete/Brick 0.015 - 0.05 0.02 (vertical)
Vegetation 0.3 0.64
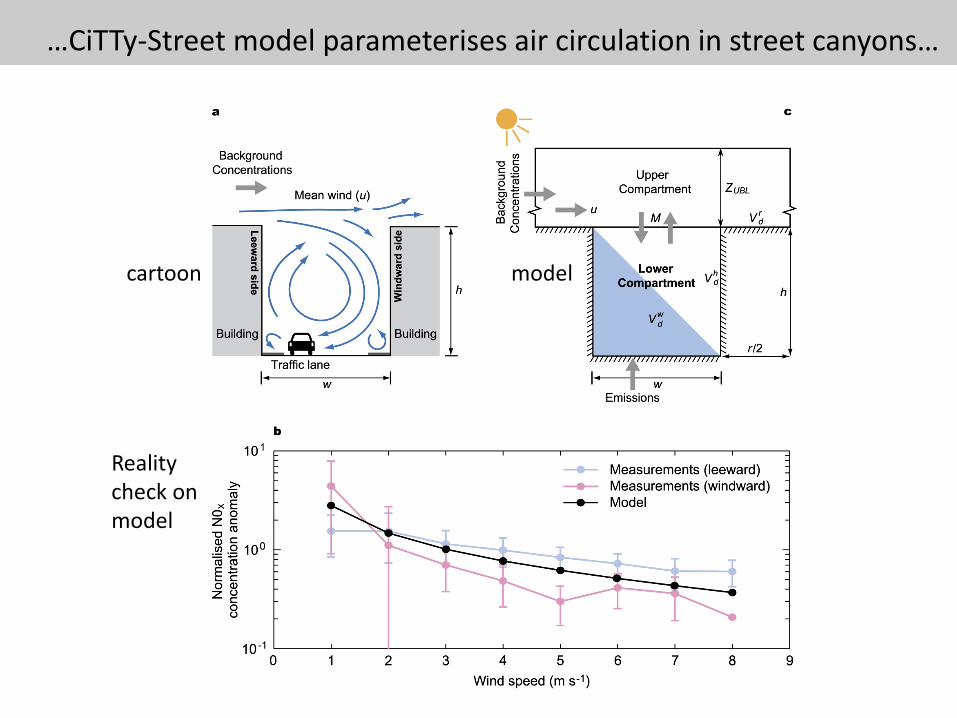
…CiTTy-Street model parameterises air circulation in street canyons…
cartoon model
Reality check on model

Comparison of modeled (dashed blue lines) NO2 and O3 with measurements (solid black lines) for Göttinger Strasse, Hanover, Germany on 21/06/94.
Model evaluation: temporal concentration variations at street level and above

Green walls can be much more effective than previous calculations predicted…(central London example)
…and can have effective cleaning of air in a single canyon (localism). Bottom-up policy becomes possible. Political traction.
Recent estimates: 50,000 die prematurely every year in the UK, 1.34M worldwide, due to the chronic & acute air pollution effects.
Previously under-estimated effect
In-c
anyo
n c
on
cen
trat
ion
red
uct
ion
(%
)

Deep green canyons can even produce better air quality than shallow canyons under some conditions…and the action of all green canyons is to buffer against low-windspeed pollution events
Deep canyon
shallow canyon
The influence of in-canyon deposition on vegetation increases at low wind speeds
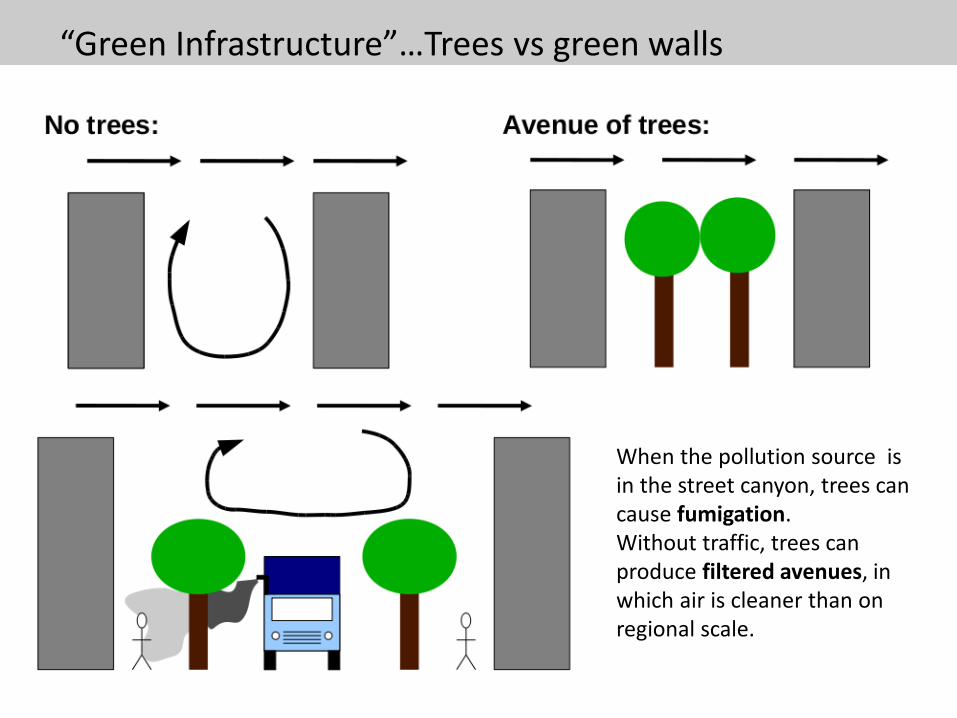
When the pollution source is in the street canyon, trees can cause fumigation. Without traffic, trees can produce filtered avenues, in which air is cleaner than on regional scale.
“Green Infrastructure”…Trees vs green walls

Can’t calculate residence time as function of green infrastructure (yet) – so explore model parameter space
Filtered avenues
Fumigated avenues
Flat grey city
Flat green city
Single street; central London emissions
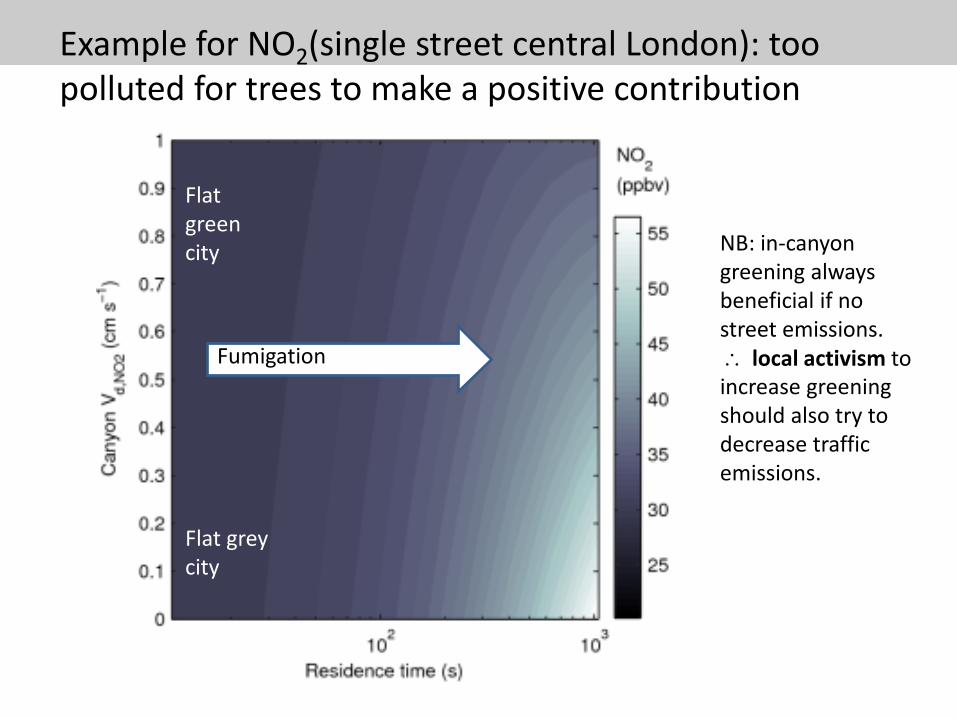
Example for NO2(single street central London): too polluted for trees to make a positive contribution
Flat grey city
Flat green city
Fumigation
NB: in-canyon greening always beneficial if no street emissions. local activism to increase greening should also try to decrease traffic emissions.
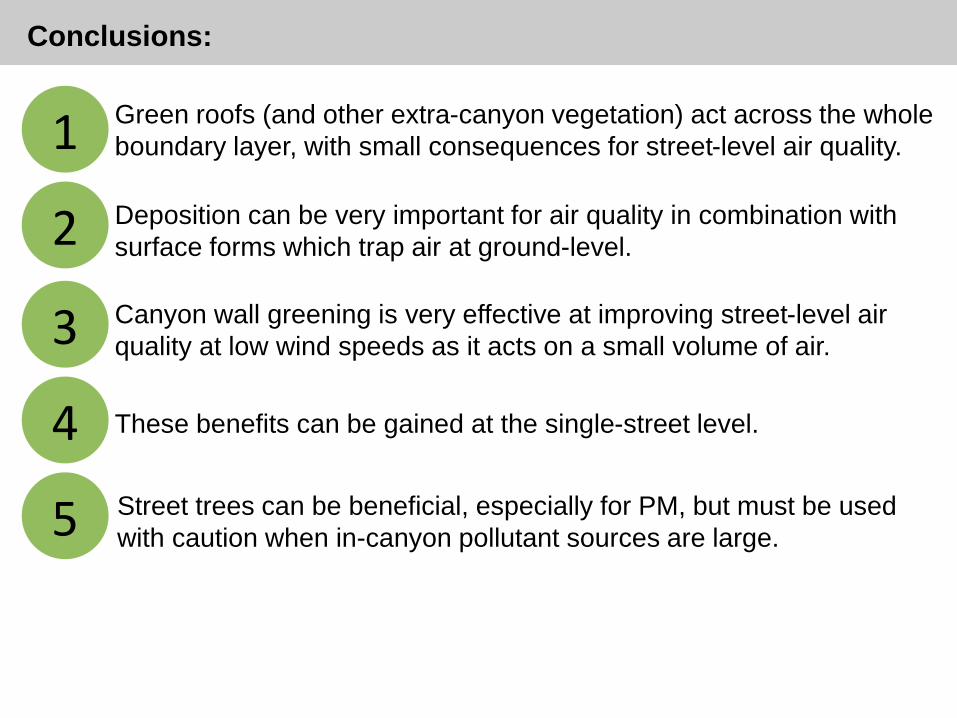
Conclusions:
Green roofs (and other extra-canyon vegetation) act across the whole
boundary layer, with small consequences for street-level air quality.
Deposition can be very important for air quality in combination with
surface forms which trap air at ground-level.
Canyon wall greening is very effective at improving street-level air
quality at low wind speeds as it acts on a small volume of air.
Street trees can be beneficial, especially for PM, but must be used
with caution when in-canyon pollutant sources are large.
1
2
3
4 These benefits can be gained at the single-street level.
5

Further Work/Questions:
What are the effects of wall greening on ventilation?
Better constraints on real Vd to leaves and other surfaces
in a street canyon.
(e.g. is aerodynamic resistance increased?)
What are residence times with non-perpendicular winds?
What is the effect of realistic junctions?
Which plant species viable in urban settings?
Field testing of results!

EPSRC grant Urban Futures – Designing Resilient Cities (BRE Press, 2012): http://www.brebookshop.com/details.jsp?id=326921

Ash
Common alder
Field maple
Larch
Norway maple
Scots pine
Silver birch
Apple
Cherry laurel
Common elm
Common lime
Elder
Grey alder
Hawthorn
Hazel
Holly
Italian alder
Lawson cypress
Leyland cypress
Lilac
Mountain ash
Sycamore
Wild cherry
Crack willow
English oak
Goat willow
Poplar
Red oak
Sessile oak
White willow
Best Worst
Greatest capacity to improve air quality Small capacity to
improve air quality
Potential to worsen air quality
www.es.lancs.ac.uk/people/cnh/UrbanTreesBrochure.pdf
Urban Tree Air Quality Score: UTAQS Groups
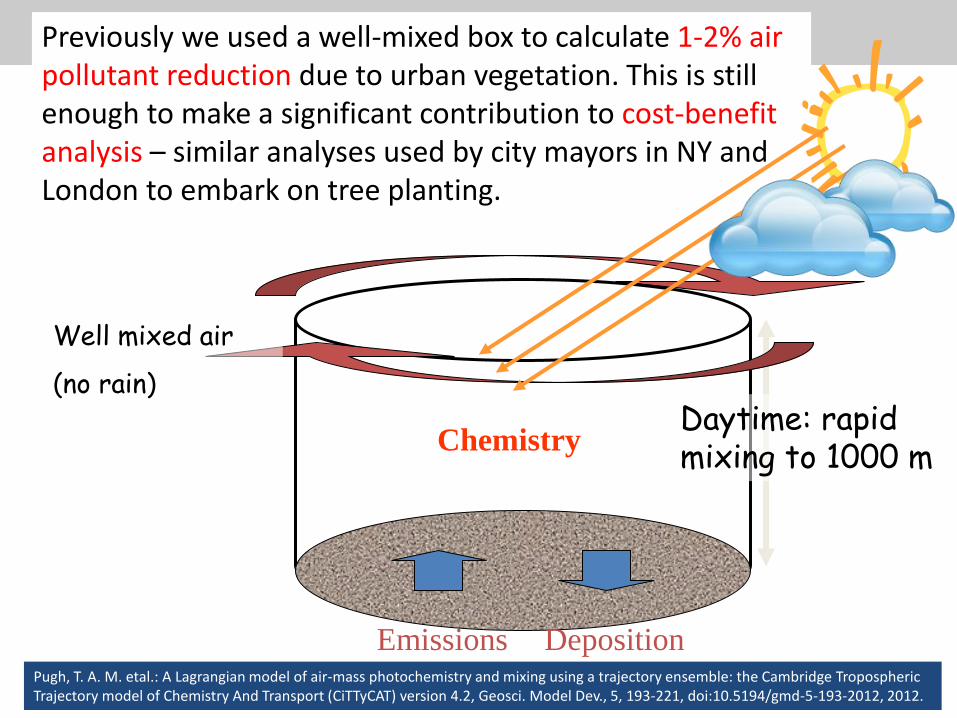
Previously we used a well-mixed box to calculate 1-2% air pollutant reduction due to urban vegetation. This is still enough to make a significant contribution to cost-benefit analysis – similar analyses used by city mayors in NY and London to embark on tree planting.
Well mixed air
(no rain)
Emissions Deposition
Chemistry Daytime: rapid mixing to 1000 m
Pugh, T. A. M. etal.: A Lagrangian model of air-mass photochemistry and mixing using a trajectory ensemble: the Cambridge Tropospheric Trajectory model of Chemistry And Transport (CiTTyCAT) version 4.2, Geosci. Model Dev., 5, 193-221, doi:10.5194/gmd-5-193-2012, 2012.

Model evaluation: street/roof concentration anomalies
Anomalies are calculated by subtracting background measurements from in-canyon measurements and normalizing against traffic emissions and the mean concentration anomaly.
Göttinger Strasse, Hannover
Jagtvej, Copenhagen
Schildhornstrasse, Berlin