Green Growth – Asia-Pacific Regional Response To … · Asia-Pacific Regional Response To Global...
37
Green Growth – Asia-Pacific Regional Response To Global Challenges Aneta Nikolova, EDD, ESCAP Asia‐Pacific – a Region on the Move Rapid economic growth = Significant gains in poverty and hunger reduction Associated costs: Overstretched carrying capacity of the natural endowment; Uneven distribution of benefits; Insufficient access to and quality of social protection Jobless growth Economic uncertainty Vulnerability to external shocks: High and volatile prices of fossil fuel and natural resources; Food prices; Natural disasters Climate change
Transcript of Green Growth – Asia-Pacific Regional Response To … · Asia-Pacific Regional Response To Global...
Green Growth –Asia-Pacific Regional Response
To Global Challenges
Aneta Nikolova, EDD, ESCAP
Asia‐Pacific – a Region on the Move
Rapid economic growth = Significant gains in poverty and hunger reduction
Associated costs: Overstretched carrying capacity of the natural endowment; Uneven distribution of benefits; Insufficient access to and quality of social protection Jobless growth Economic uncertainty
Vulnerability to external shocks: High and volatile prices of fossil fuel and natural resources; Food prices; Natural disasters Climate change

Risk & uncertaintyRapid & accelerating feedbacks between environmental, social and
economic systems ‐ convergence
Food, energy & commodity prices – trends closely aligned Environmental pressures and resource constraints ‐ Climate change &
food security – energy, water & food nexus
Resource constraints Rising fuel prices and approaching “Peak Oil” Non‐fuel commodities ‐metals & minerals, agricultural raw materials – prices
more than doubled between 2002 & 2008 Metals – approaching & ongoing supply constraints –iron, cobalt, platinum,
palladium may be close to exhaustion in 40 years; rare earth metals supply uncertainties
“Peak water” ‐ ?
Magnitude of Impacts of Climate Change and WaterScarcity
– Food and Beverage Sector, S. & SEA
Source: HSBC

A new economic realityIs the return to rapid growth based on intensive resource‐use really sustainable ?
Growth constrained by resources, climate change and natural disaster
Unemployment, agitation for change Basis for competitiveness >> going green
>>>> Economic growth strategies based on an unlimited supply of undervalued natural resources, resource‐intensive lifestyles, and carbon‐intensive fuels are not economically, socially or environmentally sustainable
Resource use trends
Regional resource efficiency decreasing, resource use accelerating
Resource intensity 3x rest of world
Regional countries reducing resource intensity (resources used per $GDP) – but not fast enough
Asia‐Pacific carbon intensity (GHG emissions per $ GDP) significantly higher than global

•Total A‐P resource use accelerating ‐35 billion tonnes in 2005•Most important resource – construction minerals ‐almost 50% of all resources
Asia-Pacific
Rest of world
Domestic material consumption
Source: CSIRO and UNEP Asia Pacific Material Flows database
* primary materialsimported + domestically-extracted,minus exports, covering metal ores,industrial minerals, fossil fuels,
construction minerals & biomass
Resource intensity
A‐P uses > 3 xresources to produce $1 of GDP, compared to the rest of the world
Resource intensity increasing >> productivity/efficiency declining after 2000
Domestic material consumption intensity
Asia-Pacific
Rest of world
Source: CSIRO and UNEP Asia Pacific Material Flows database

A/P resources use patterns increase risksLIMITED CARRYING CAPACITY Population density 1 ½ times the global average Freshwater available: 3,920m3/cap/yr vs. South America
38,300m3.cap/yr. Productive area available per capita: 60 % of the global
average Arable land per capita: 80 % of the global average
BUT Production of non‐food crops growing faster than food crops,
even where hunger persists Low water productivity in water‐stressed countries High hunger rates even where scarce water is mainly used for
agriculture Health & productivity of ecosystems in decline even though the
majority of the workforce depends on this
What does this mean for policymakers ? – policy tensionsIncreasing throughputs of energy and resources >>> increased labour productivity
& high economic growth rates
BUT TRADEOFFS GROWING
unsustainable resource use patterns
Vulnerability to resource risks
increased costs to the economy and people
reduced rates of employment creation over time (jobless growth)

A better quality of growth Economic Quality: high labour productivity but low unemployment, resilience to financial/oil crisis, high resource productivity, high competitiveness
Ecological Quality: eco‐efficient, less vulnerable to climate change, healthy & productive eco‐systems
Social Quality: inclusiveness, adaptability/resilience, high quality of life, well‐being*
Ecological Inefficiency
Growth and Consumption and Production

Ecological Inefficiency
Growth and Consumption and Production
Ecological Inefficiency
Growth and Consumption and Production

GG: System Change Economies to be recalibrated to better fit to
a new economic realityTradeoffs >>>>> synergies.
Ecological crisis >>>>> economic opportunity
By re-designing invisible & visible economic infrastructure – focus on eco-efficiency (EE)
To arrive at Green Economy where investment in renewable energies and other improvements in eco-efficiency can generate profit, employment, growth
Ecological Inefficiency
Growth and Consumption and Production

Eco-efficiency Concept
Ecological Inefficiency
Visible & Invisible economic “Infrastructure”
Invisible economic infrastructure: the way we produce & consume: market price, regulations, cultural and social values and preferences, lifestyles
Visible economic infrastructure: the way we design built environment, city, building, transport, energy and water systems and promote investments in natural capital

Jump-starting GG: political leadership
GG: not automatic – recent price increases will not do it - 2 gapsTime gap: short-term cost > long–term benefit
Price Gap: ecological price > market price
Government has to lead system change Private sector: to grasp opportunity rather than
resisting as burden
People: to be engaged for political support and participation & to embrace lifestyle changes
Green growth applicable to developing countries?
AP DCs most vulnerable, must take action to reduce risk
GG: not only a matter of money & technology
but also political commitment, vision & policy options that promote systemic, rather than incremental change
Easier to initiate at the early stages of development
>>> the sooner, the better: Singapore example

Recalibrating the economyCreate a virtuous cycle – policy framework that acts as
a green growth engine - shift investments to resource-savings and job creation
Secure a double dividend – green tax and budget reform key Increase taxes/prices/costs on the “bads” – pollution and
wasteful resource use
Reduce taxes on the “goods” – employment, capital gains
Subsidize the “goods” not the “bads”
Recycle revenues to deal with regressive impacts or towards environmentally or socially sustainable investments
Green growth policy framework needed to maintain momentum
Ecological Inefficiency
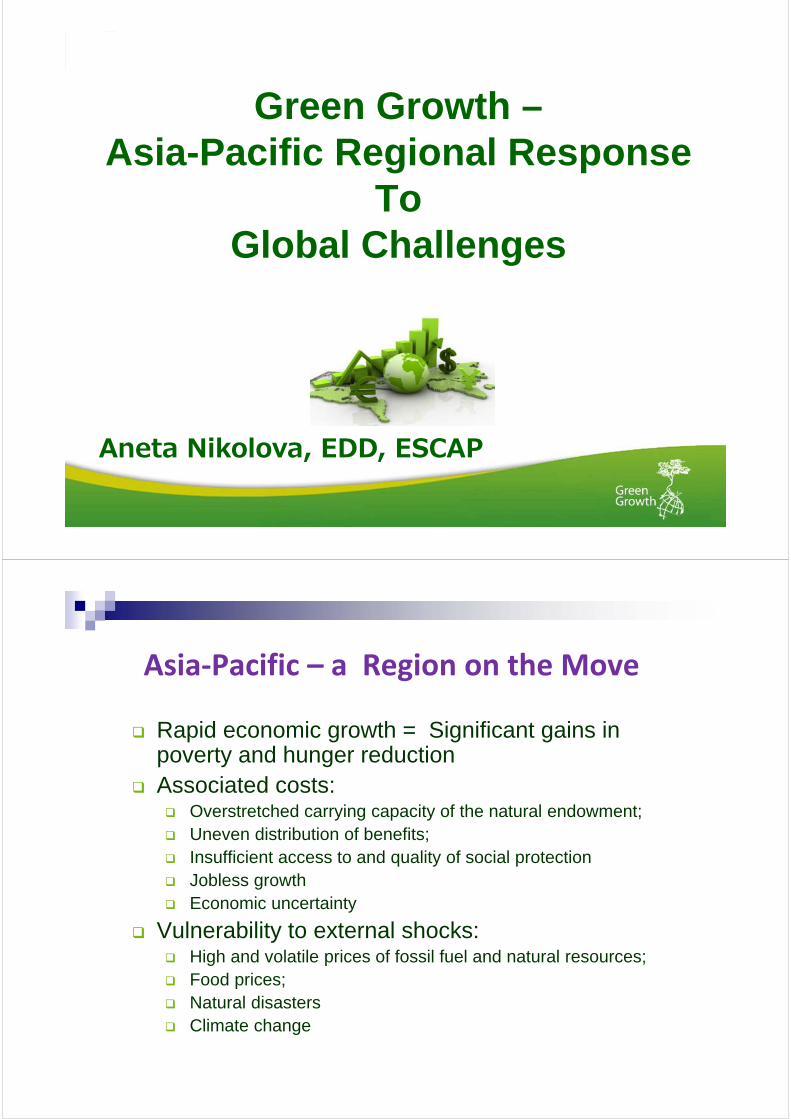
Cross Sectoral Linkages
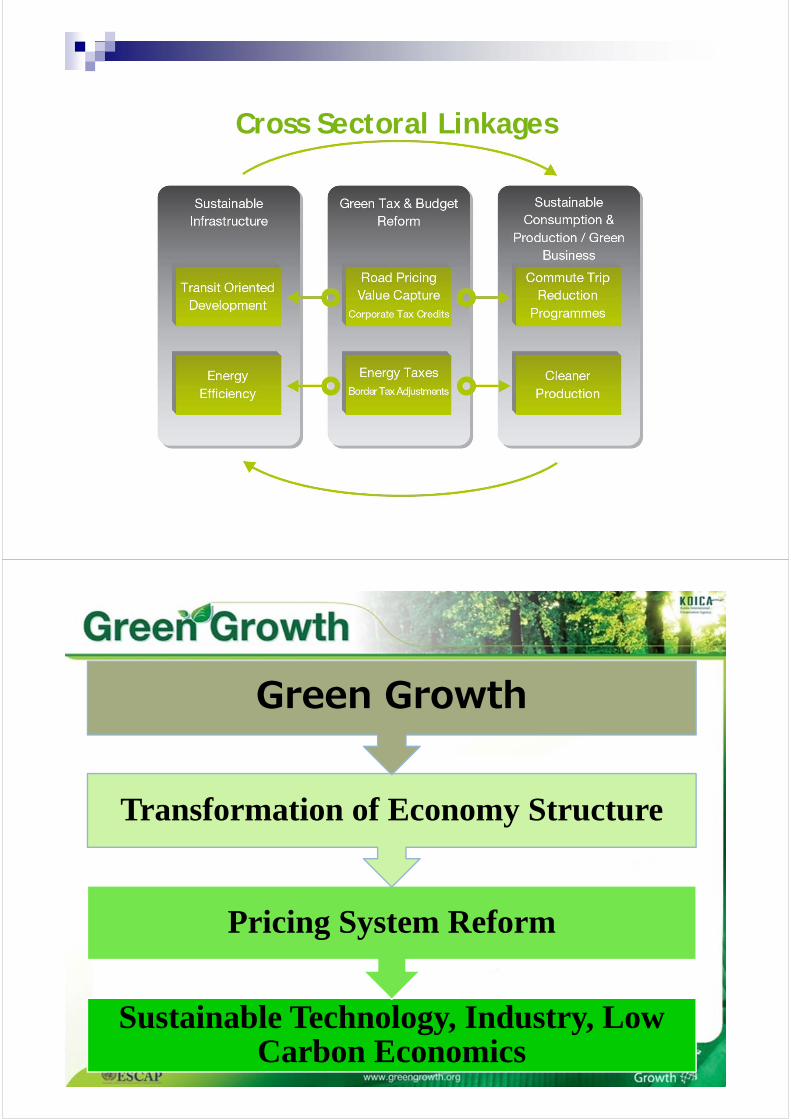
Sustainable Technology, Industry, Low Carbon Economics
Pricing System Reform
Transformation of Economy Structure
Green Growth

ETR EFR
Closing the price gap
Shifting tax bases from ʻgoodsʼ to ʻbadsʼ
Revenue neutrality
Closing the time gap Short-term
investment and long-term benefits
Why environmental taxes? (1)For environmental taxation
Market failure leading to excessive pollution and environmental destruction
For energy taxation
Energy demand increases with income (income elasticity +0.5)
Energy demand decreases with price (industry elasticity -0.6)
Market failures for some energy efficiency technologies
For carbon taxation
Rich countries must achieve a minimum of 80% decarbonisation by 2050
Only carbon pricing (taxing or trading) will stimulate the uptake and development of existing low-carbon and efficiency technologies, and reduction in the demand for carbon-based fuels
Why environmental taxes? (2)Conclusions from the literature
Without environmental taxation, the (macro-economic) cost of environmental improvement will be higher than it needs to be
Without significant increases in energy prices, energy consumption will go on rising
Where the energy is carbon-based this will lead to increased carbon emissions and a failure to stabilise the climate
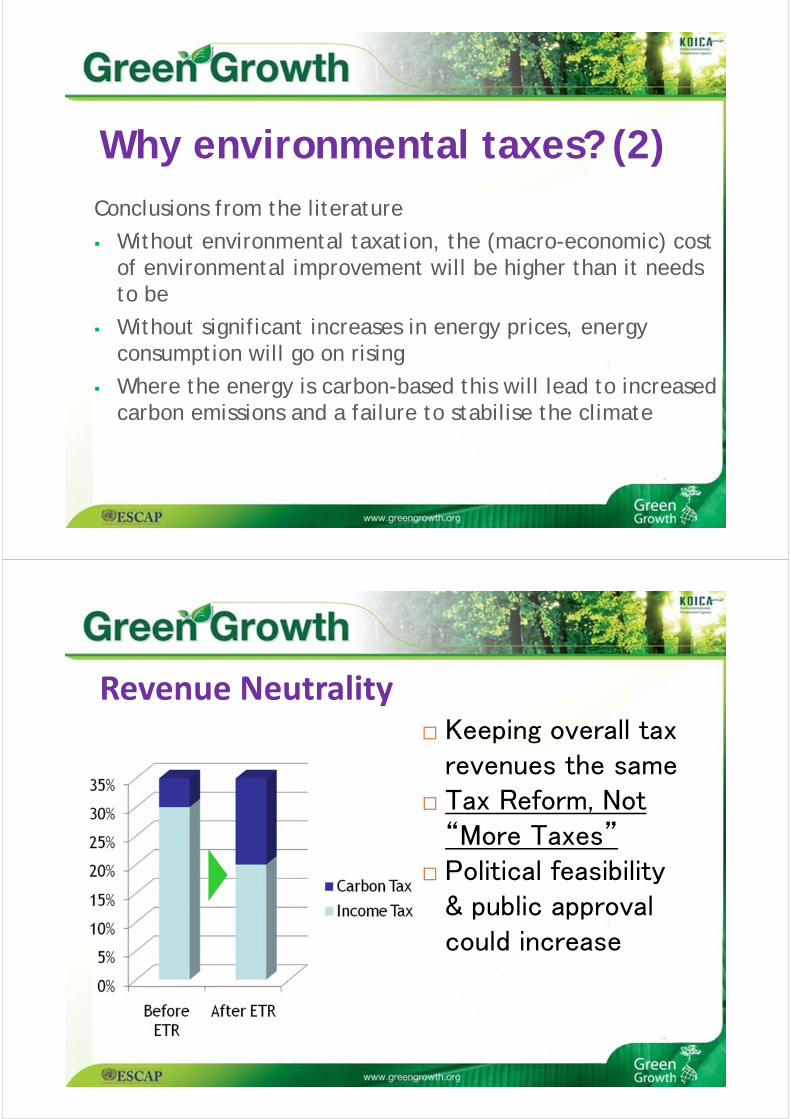
Revenue Neutrality Keeping overall tax
revenues the same Tax Reform, Not
“More Taxes” Political feasibility
& public approval could increase

The potential of ETR/GFR:ETR/GFR is the shifting of taxation from ‘goods’ (like income, profits) to ‘bads’ (like resource use and pollution)
Economic impacts
Environmental impacts
ETR Increased output
Higher employment
Less pollution Less resource use
Higher human
well-being
Green innovation Green technology development
0.00%5.00%
10.00%15.00%20.00%25.00%30.00%35.00%
Chin
a
Japa
n
Kore
a
Cam
bodi
a
Thai
land
Indi
a
Mal
aysi
a
Labour tax
Capital incometaxCorporate tax
Consumptiontax
A Tax Shift in DCs: Corporate or Consumption Taxes instead of Labor/Income Taxes?
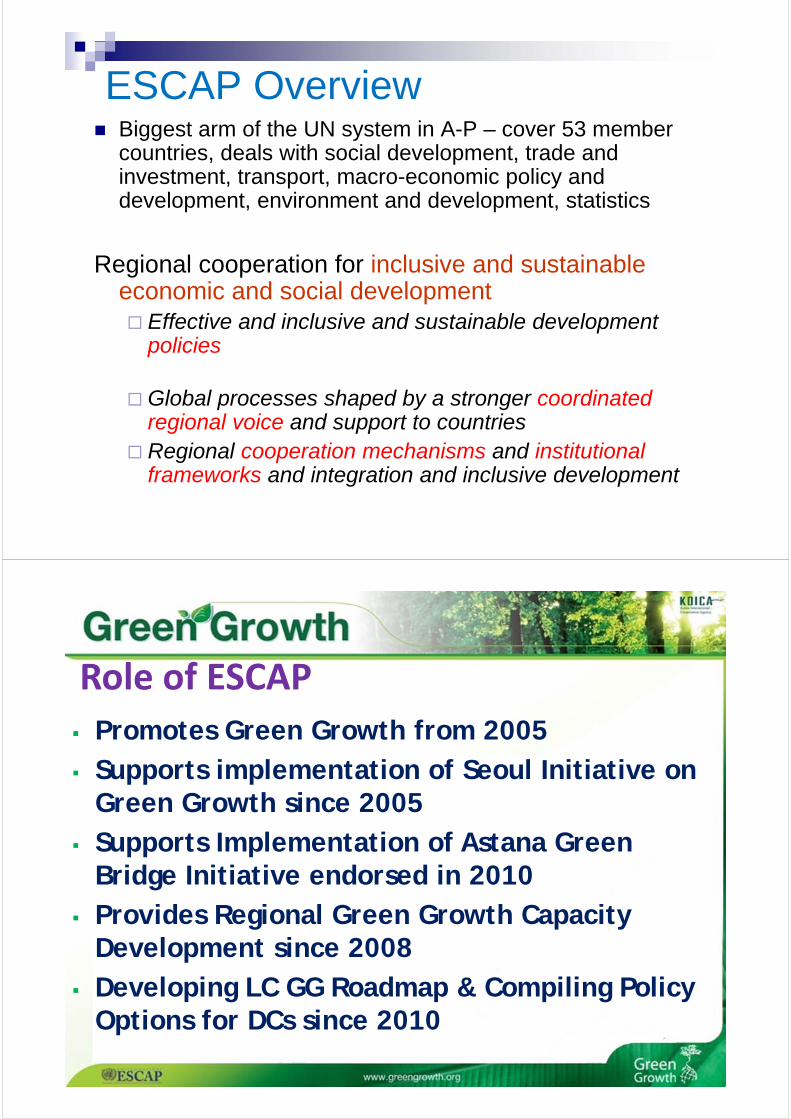
ESCAP Overview Biggest arm of the UN system in A-P – cover 53 member
countries, deals with social development, trade and investment, transport, macro-economic policy and development, environment and development, statistics
Regional cooperation for inclusive and sustainable economic and social development Effective and inclusive and sustainable development
policies to narrow development gaps and build resilience
Global processes shaped by a stronger coordinated regional voice and support to countries
Regional cooperation mechanisms and institutional frameworks and integration and inclusive development
Role of ESCAP Promotes Green Growth from 2005 Supports implementation of Seoul Initiative on
Green Growth since 2005 Supports Implementation of Astana Green
Bridge Initiative endorsed in 2010 Provides Regional Green Growth Capacity
Development since 2008 Developing LC GG Roadmap & Compiling Policy
Options for DCs since 2010

Regional Responses – Green Growth
MCED-5 (March 2005): Seoul Initiative and Network on Green Growth
MCED-6 (October 2006): Astana Green Bridge Initiative: Europe-Asia-Pacific Partnership for Implementation of Green Growth
Asia-Pacific Regional Preparatory Meeting for UNCSD (September 2011) – Seoul Outcome Document and Report
After the Asia‐Pacific MCED‐5 in 2005
• UNEP: Green Economy in 2008
• OECD: Green Growth Strategy in 2009

MCED6: Astana Green Bridge 2010linking Europe & AP with GG


Green Subsidy Reform Indonesia
In 2008 the oil price reached $120 per barrel
The Indonesian budget for fuel subsidies was Rp135,1 billion
The high oil price increased subsidy budget by Rp200 billion
Took money from other programs e.g. education, healthcare, small business credit facilities, infrastructure development
Forced to undertake subsidy reform and raised the fuel price
Simultaneously introduced programs to reduce burden on low income families, e.g. direct cash assistance, food sustainability program – low price rice
Sustainable Transport Malaysia

Solar Tuk-Tuk Thailand
Micro-hydro Power Generation
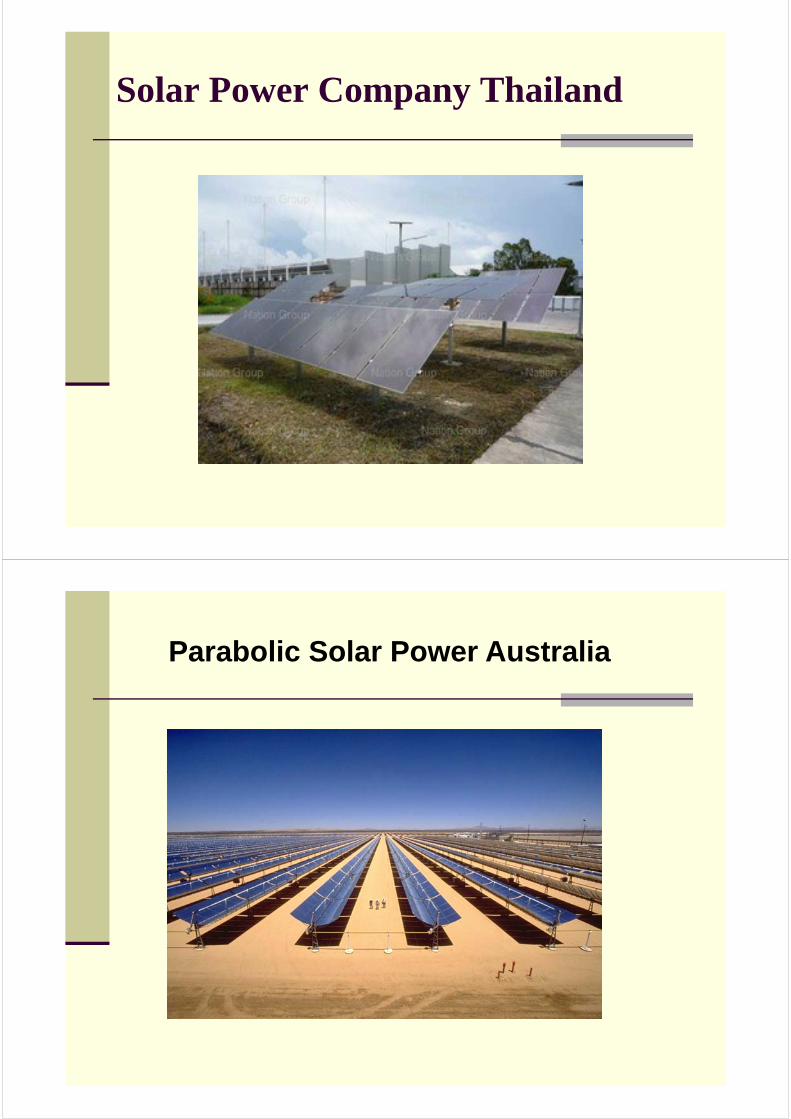
Solar Power Company Thailand
Parabolic Solar Power Australia

Green Buildings Malaysia
Low Energy Ministry building: MalaysiaKey data
Gross floor area: 20 000 m2
Energy performance index: 114 kWh/m2/year
Addition cost to construct: 5%
Annual energy savings: RM 600 000
Energy efficiency features
Orientation & building envelope insulation
Energy efficient lighting, ventilation & office appliances
Energy management system Ministry of Energy, Green
Technology and Water, Putrajaya
Retrofitting Prefabricated Buildings Mongolia
• Approximately 250,000 people (20% of the urban population) live in prefabricated buildings in Ulaanbaatar.
• Pilot project of one apartment building to determine potential energy savings.• It was found that up to 40 % of the heating energy can be saved. A potential
60% or more is also possible with consumption-oriented heating tariffs.

Green Roof and Living Wall Singapore
Beijing ‐ Central Business District (CBD) Sustainability Plan
The amount of trees that will be planted in the CBD is estimated to remove 215,000 tons of CO2 every
year, the equivalent of planting 14 million
forest trees!
http://www.designstores.gr/tag/master‐plan

Electric vehicles are appearing throughout major automakers’ line-ups. Combined with renewable energy sources and production techniques, they are a real viable solution.
The Tesla Roadster sport has the ability to accelerate from 0-100 km/h in 3.7 seconds and has a range of 400 kms. There goes the myth that EV’s are slow and inefficient.
www.ev.com
The express bus system is a cost effective solutions to a growing city population.
The bus will travel just above the height of a car, but just under an overpass and be able to carry up to 1200 people at a time. The designers project traffic jam reduction of 30%, enough to save hours of commute in Beijing.
http://www.engadget.com/2010/08/02/china-to-build-ginormous-buses-that-cars-
can-drive-under-video/

Beijing
Super-capacitators are finally being integrated in public transport. China’s buses at the 2010 Shianghai World Expo were using this system, as well as a new company in Germany.
The bus charges rapidly when it stops at a bus station and has enough power to go to the next station, where it quickly charges again and so on, along the whole route.
http://www.popsci.com.au/2010/05/the‐expos‐softly‐whirring‐fleet‐of‐electric‐vehicles/
The BYD Electric Bus - BYD eBUS-12 when fully charged can supposedly travel up to 300 kilometers (186.4 miles) under optimal conditions. BYD e6 taxis have been servicing Shenzhen, China for more than a year. To date, the fleet of 50 electric taxis have accumulated more than three million kilometers
(1.86 million miles).
Elsewhere in China
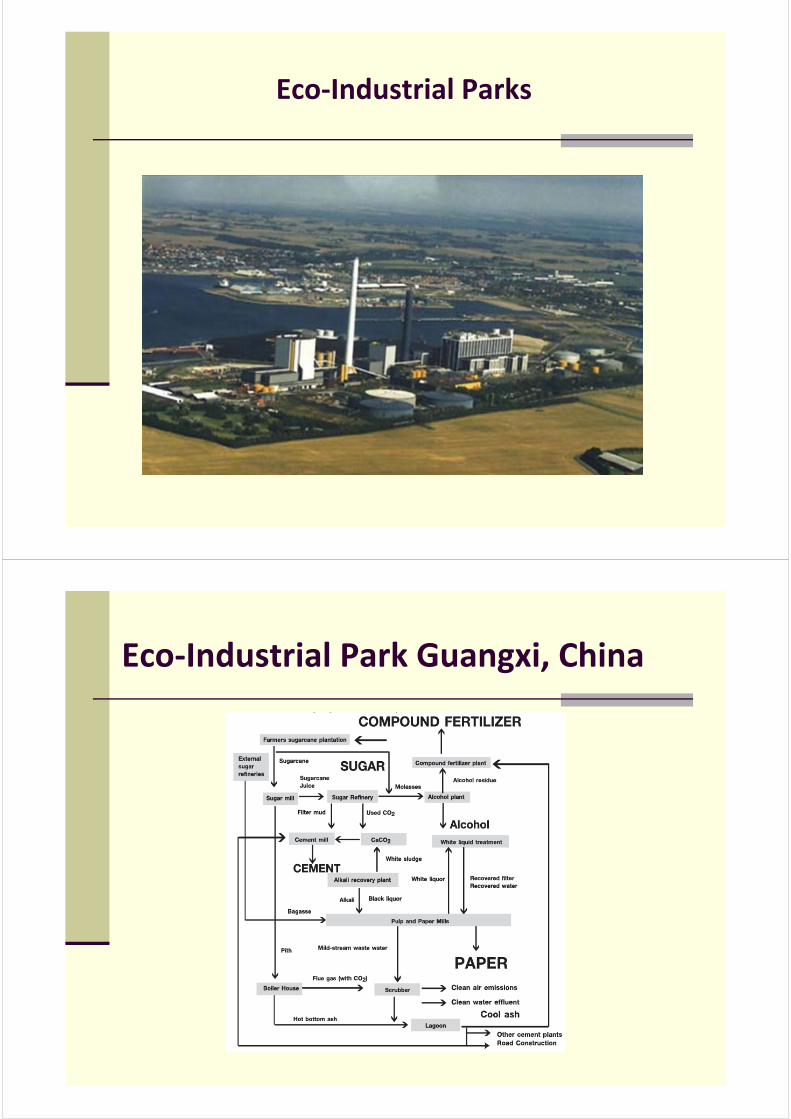
Eco‐Industrial Parks
Eco‐Industrial Park Guangxi, China
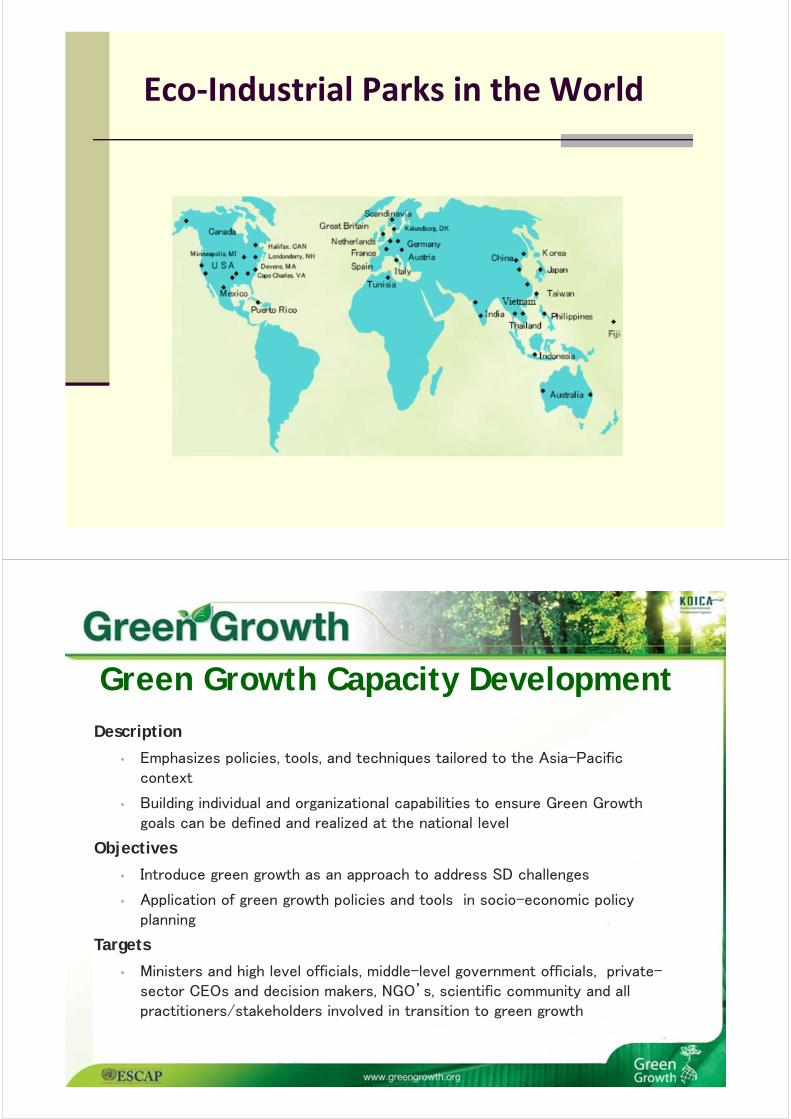
Eco‐Industrial Parks in the World
Green Growth Capacity DevelopmentDescription
• Emphasizes policies, tools, and techniques tailored to the Asia-Pacific context
• Building individual and organizational capabilities to ensure Green Growth goals can be defined and realized at the national level
Objectives
• Introduce green growth as an approach to address SD challenges
• Application of green growth policies and tools in socio-economic policy planning
Targets
• Ministers and high level officials, middle-level government officials, private-sector CEOs and decision makers, NGO’s, scientific community and all practitioners/stakeholders involved in transition to green growth

ESCAP Regional GGCD Since 2005; more than 500 policy makers
ESCAP and SINGG with partners
10 regional policy dialogues;
10 National and 5 Regional Training of Trainers Seminars; 6 Leadership Workshops
ESCAP ToT and green growth methodology;
Sustainable livelihoods at the core of all tools;
Pilot applications in Kazakhstan, Cambodia, Samoa, Fiji;
Mongolia and Lao PDR in the pipeline
PACIFIC PILOTFAITH-BASED GREEN GROWTH BUSINESS
MODEL ON RENEWABLE ENERGY FOR POOR RURAL COMMUNITIES

What? ESCAP, KOICA, Regional SCP Helpdesk and UK
Government – e-Learning Tools (2009-2010)
ESCAP, UK, AIT/UNEP RRC.AP - On-line e-Learning Facility (2011)
Online version CD Rom version
Pacific Pilot – YWAM, Samoa

Pacific Pilot – YWAM, Samoa
Pacific Pilot – YWAM, Samoa

Pacific Pilot – YWAM, Samoa
Pacific Pilot – YWAM, Samoa

CAMBODIA PILOT
PRO-POOR GREEN BUSINESS MODEL ON RENEWABLE ENERGY (SOLAR)
http://www.greengrowth.org/capacity_building/capacity.asp
Two floating villages Kompong Prohot and Anlong Ta Ur in Battambong Province,

Replacing home made kerosene lamps with solar charged lanterns
• Community based business cooperative – fees for services
On-line e-Learning Facility
Online version CD Rom version
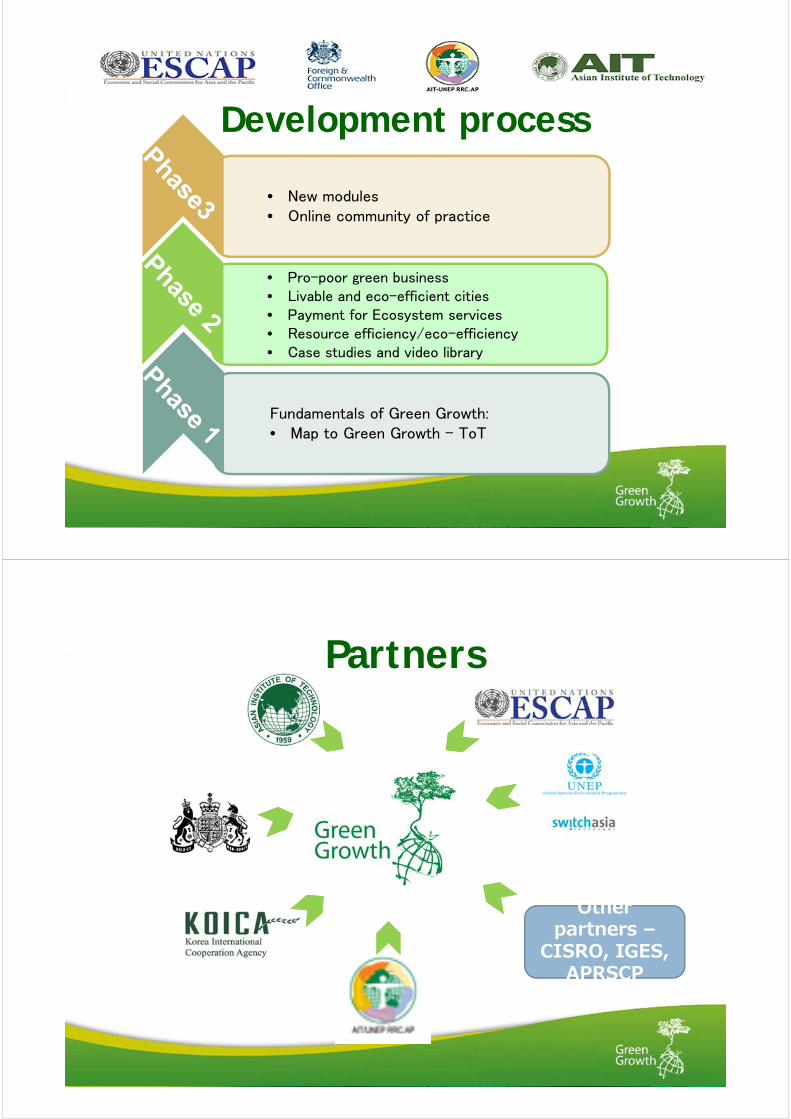
Development process
Fundamentals of Green Growth:• Map to Green Growth – ToT
• Pro-poor green business• Livable and eco-efficient cities• Payment for Ecosystem services• Resource efficiency/eco-efficiency• Case studies and video library
• New modules• Online community of practice
Partners
Other partners –
CISRO, IGES, APRSCP

OutcomesImpact
• Enhance regional and global green growth solidarity• Expand the Green Growth community of practitioners;• Green growth policy and knowledge sharing web-space
Certification• “Green Growth Trainer of Trainers” certificate and
member of Green Growth Champions networkPartnerships with
• GG/GE Initiatives – SINGG, Astana GB Initiative• Knowledge based networks – CISRO, IGES, SWITCH-ASIA-
PSC and SWITCH-ASIA Network Facility• Learning Institutions - UNITAR, UNU, Pacific University• Networks of practitioners – APSCP, GPN, CSR-Asia,
Consumer International, etc
Registrations open for courses
Next courses: 20 February -30 March 2012 Every six weeks from 12 April till the end of
2012 Send your expressions of interest to:
[email protected] copy to: [email protected]

Thank you for your kind attention
For more information please visit:www.unescap.org/esdwww.greengrowth.org