Green Economy Sector Study on Agriculture in...
40
Green Economy Sector Study on Agriculture in Kenya Working Document 2015
Transcript of Green Economy Sector Study on Agriculture in...
Green Economy Sector Study on Agriculture in Kenya
Working Document
2015
©United Nations Environment Programme, 2015
This publication may be produced in whole or in part and in any form for educational or non-profit purposes without special permission from the copyright holder, provided acknowledgement of the source is made. UNEP would appreciate receiving a copy of any publication that uses this publication as a source.
No use of this publication may be made for resale or for any other commercial purpose whatsoever without prior permission in writing from the United Nations Environment Programme.
Citation
UNEP. (2015). Green Economy Sector Study on Agriculture in Kenya. 34 p.
Disclaimer
The designations employed and the presentation of the material in this publication do not imply the expression of any opinion whatsoever on the part of the United Nations Environment Programme, nor does citing of trade names or commercial processes constitute endorsement.
This publication has been produced with the assistance of the European Union. The contents of this publication are the sole responsibility of UNEP and can in no way be taken to reflect the views of the European Union.

Table of Contents
LIST OF TABLES ..................................................................................................................................................... 1
LIST OF ACRONYMS ............................................................................................................................................... 1
KEY MESSAGES ..................................................................................................................................................... 4
1. INTRODUCTION .............................................................................................................................................. 5
1.1 GREEN ECONOMY IN KENYA ........................................................................................................................................ 5
1.2 GREEN ECONOMY NATIONAL STUDY AND THE PURPOSE OF THIS REPORT .............................................................................. 5
1.3 MACRO-ECONOMIC AND COUNTRY PROFILE .................................................................................................................... 6
2. THE AGRICULTURE SECTOR IN KENYA ......................................................................................................... 10
2.1 SECTOR PROFILE .................................................................................................................................................... 10
2.1.1 Performance of the agriculture sector............................................................................................................... 10
2.1.2 Characteristics of the agriculture sector ............................................................................................................ 12
2.1.3 Strategies and policies ................................................................................................................................... 13
2.2 GREENING THE AGRICULTURE SECTOR ........................................................................................................................ 15
3. MODELLING A GREEN AGRICULTURE SECTOR ............................................................................................. 16
3.1 MODEL DESCRIPTION AND DATA SOURCE ..................................................................................................................... 16
3.2 SECTOR MODELING OF THE AGRICULTURE SECTOR ........................................................................................................ 18
3.3 SCENARIO SETTING FOR THE SIMULATION OF GREEN ECONOMY INTERVENTIONS .................................................................. 19
3.4 SIMULATION RESULTS .............................................................................................................................................. 23
4. DISCUSSION OF POLICY-ENABLING CONDITIONS ......................................................................................... 26
4.1 POLICY AND LEGAL FRAMEWORK ................................................................................................................................ 26
4.2 TAXATION SYSTEM .................................................................................................................................................. 26
4.3 INCREASING PRODUCTIVITY, COMMERCIALIZATION AND COMPETITIVENESS ........................................................................ 27
4.4 PROMOTING PRIVATE SECTOR PARTICIPATION IN AGRICULTURE ...................................................................................... 27
4.5 PROMOTING SUSTAINABLE LAND AND NATURAL RESOURCES MANAGEMENT....................................................................... 28
4.6 REFORMING DELIVERY OF AGRICULTURAL SERVICES ..................................................................................................... 28
5. CONCLUSION ............................................................................................................................................... 30
REFERENCES ....................................................................................................................................................... 31
ANNEX 1 THREE SPHERES IN THE T21-KENYA MODEL .......................................................................................... 33
ANNEX 2 MODELLING STRUCTURE FOR GREEN AGRICULTURE SECTOR ............................................................... 34

1
List of tables
Table 1 Macroeconomic indicators for Kenya ...................................................................................................... 7
Table 2 Environmental indicators for Kenya ........................................................................................................ 8
Table 3 Social indicators for Kenya .................................................................................................................... 8
Table 4 Performance of the agriculture sector in Kenya (2008-2012) .................................................................. 12
Table 5 Kenya’s targets for growth, food security and poverty reduction by 2020 ................................................. 14
Table 6 Modules, sectors and spheres of the T21-Kenya model ......................................................................... 18
Table 7 Green economy investment simulated .................................................................................................. 21
Table 8 Main results of the quantitative scenario analysis in selected years ......................................................... 25
List of figures
Figure 1 Contribution of agricultural sub-sectors to AGDP and agricultural exports ............................................... 10
Figure 2 Trends in agricultural and economic growth (1960-2008) ...................................................................... 11
Figure 3 Impacts on GDP growth under BAU, BAU2% and GE2% scenarios. ...................................................... 23
Figure 4 Agricultural yield under BAU, BAU2% and GE2% scenarios. ................................................................. 24
List of Acronyms
AGDP Agricultural gross domestic product
ASAL Arid and Semi-Arid Lands
ASDS Agricultural Sector Development Strategy 2010-2020
BAU Business-as-usual
BOP Balance of payment
CAADP Kenya comprehensive Africa Agriculture Development Programme
ERS Economic Recovery Strategy for Employment and Wealth Creation
FDI Foreign direct investment
GE Green economy
GEA Green Economy Assessment
GESIP Green Economy Strategy and Implementation Plan GHG Greenhouse gas
GKI Greening Kenya Initiative
GNI Gross national income
GoK Government of Kenya
IGES Institute for Global Environmental Strategies
IMF International Monetary Fund
KBS Kenya Bureau of Standards
KEPHIS Kenya Plant Health Inspectorate Service
KIPPRA Kenya Institute for Public Policy Research and Analysis
KSh Kenyan shilling

2
MDG Millennium Development Goal
MEWNR Ministry of Environment, Water and Natural Resources
MTIP Medium-Term Investment Plan 2010-2015
NASEP National Agricultural Sector Extension Policy
NCCRS National Climate Change Response Strategy
NEMA National Environment management Authority
PPP Purchasing power parity
ROW Rest of the world
SAM Social Accounting Matrix
SAP Structural Adjustment Programmes
SD System dynamics
SRA Strategy for Revitalizing Agriculture
T21 Threshold 21 model
TFP Total factor productivity
UNEP United Nations Environment Programme
USD US dollar

3
Acknowledgements
This study was commissioned by the United Nations Environment Programme (UNEP) under the ‘Green Economy and Social and Environmental Entrepreneurship Development in Africa’ Project. It builds on the Green Economy Assessment of Kenya (UNEP, 2014). The study was prepared by Zhou Xin of the Institute for Global Environmental Strategies (IGES), under the overall supervision of Joy Kim, Senior Economic Affairs officer in the UNEP Economics and Trade Branch. Within UNEP, Dambudzo Muzenda, Jose Pineda and Rhoda Wachira contributed to the report with valuable comments. Administrative support was provided by Desiree Leon, Fatma Pandey and Rahila Somra. The report was edited by Elizabeth Kemf.
UNEP is grateful for the financial support provided by the European Commission.

4
Key Messages
Kenya has established fundamental policies and a legal framework for a green economy to help address multiple
challenges in achieving its long-term sustainable development goals.
Despite having one of the most dynamic economies in Africa, Kenya must overcome a number of economic, social
and environmental obstacles in order to achieve its sustainable development goals. Economically, the country has
experienced recent stable economic growth, averaging 5.7 per cent in 2013, and that is expected to remain the same
for 2014, according to Kenya’s National Bureau of Statistics (KNBS) (World Bank, 2014). Kenya’s economy has the
largest economy of the East Africa Community (EAC), with its Gross Domestic Product (GDP) counting for 40 per
cent of the region’s five members (Kimenyi and Kibe, 2014). However, the rate of industrialization is low and the
current external account is in deficit. In addition, Kenya has a high level of poverty (34 % to 42 %) (World Bank,
2014), strong inequalities, and a relatively high unemployment rate, in particular for youth. Environmentally, the
country is trending towards overshooting its ecological capacity and depleting its natural resources and ecosystems.
A green economy transformation could help the country meet multiple challenges, while it works to achieve rapid and
stable economic growth, environmental protection, natural resource conservation and social inclusion. The
Government of Kenya has made substantial efforts in moving the country towards a green economy, including
establishing a supportive policy and legal framework as well as creating a National Climate Change Response
Strategy. The strategy promotes investments in renewable energy, resource-efficient and clean production, pollution
control, waste management, environmental planning and governance and restoration of forest ecosystems.
The agriculture sector is essential for an economy-wide green economy transformation.
Agriculture is the mainstay of the Kenyan economy, contributing to 24 per cent of national GDP directly and another
27 per cent indirectly. The agriculture sector is not only the driver of Kenya’s economy, but also the means of
livelihood for the majority of Kenyan people. The sector provides income to more than 80 per cent of the population,
employing over 40 per cent of the total population and over 70 per cent of the rural population. However, the sector is
facing major challenges including stagnant or declining productivity levels, under-exploitation of land, inefficiencies in
the supply chain due to limited storage capacity, lack of post-harvest services, poor access to input markets and low
value addition of most agriculture exports.
Kenyan Vision 2030 (GoK, 2007) identified agriculture as one of the key sectors to deliver a 10 per cent annual
economic growth rate. The government considers that a critical factor in achieving this target is the transformation of
smallholder subsistence agriculture into an innovative, commercially-oriented modern agricultural sector. Given the
high correlation of economic growth to the development in agriculture and the importance of the sector in absorbing
the labour force, greening Kenya’s agriculture sector is essential for greening the economy as a whole.
Green agriculture is characterized by shifting both commercial and subsistence farming towards more productive and
ecologically-sound farming practices. To this end, Kenya has embarked on the formulation of a suite of strategies
and policies.
Green agriculture is characterized by shifting both commercial and subsistence farming towards ecologically-sound
farming practices, such as efficient use of water, extensive use of organic and natural soil nutrients, optimal tillage,
integrated pest control and agroforestry.

5
In Kenya’s Economic Recovery Strategy for Employment and Wealth Creation, high priority is given to the agriculture
sector by recognizing it as the backbone of the economy and highlighting its importance in supporting the economy
through wealth generation and employment. The strategy recognized that revival of agricultural institutions and
investment in agricultural research and extension were critical and essential for sustainable economic growth.
In 2004, the Strategy for Revitalizing Agriculture envisioned a transformation of “Kenya’s agriculture into a profitable,
commercially oriented and internationally and regionally competitive economic activity that provides high quality
gainful employment to Kenyans”. The target of agricultural growth was set at over 5 per cent by 2007.
In the Agricultural Sector Development Strategy 2010-2020, the overall agricultural sector goal was revised upward
from “over 5 per cent” and set to achieve an average growth rate of 7 per cent per year over the next five years. The
new strategy envisioned “A Food Secure and Prosperous Nation” (GoK, 2009).
Green economy-related investments in the agriculture sector could mitigate the impact of climate change on
productivity, promote more sustainable farming and boost productivity. Green agricultural practices create jobs,
improve nutrition and stabilize food security.
The quantitative analyses undertaken to assess the economy-wide impact of green investments show that
investment in the agriculture sector under the business-as-usual (BAU) scenario would result in increased yields in
the short-term but would also result in increased use of chemical fertilizers and lower soil quality, which would reflect
negatively on yields in the medium- and long-term. Under the green economy (GE) investment scenario, the average
agricultural yield, in the medium- and long-term, exceed that of the BAU investment scenario by about 15 per cent by
2030. The report outlines the benefits of scaling up efforts in agroforestry; sustainable water management, such as
rainwater harvesting for irrigation; education, training and capacity building, mainly in soil and water management;
and research and development. By supporting green agricultural practices, such as organic farming, fish farming and
post-harvest loss reduction, Kenya can enhance job creation, nutrition and food security.
Policy recommendations
A green economy transformation for Kenya requires policy support and interventions. Based on the Agricultural
Sector Development Strategy 2010-2020 and its Medium-Term Investment Plan 2010-2015, the underlying
institutional and policy processes, financial resources and fiscal instruments should be considered in supporting the
greening of Kenya’s agriculture sector. These include:
Reviewing and harmonizing existing policies. Creating a new policy framework is necessary in order to
make the agricultural sector more profitable, competitive and sustainable. The current policy environment is
not fully supportive of private sector-led agricultural development. Multiple and complex laws and
regulations in Kenya’s agriculture sector are not properly aligned for investment in a liberalized economic
environment. These need to be changed if Kenya wants to compete in the international market place and
attain food security and green economic growth.
Reforming taxation systems. There is a wide range of taxes, levies, cesses and fees charged on farm
produce, forestry, farm inputs and services which distort market prices, thus making farm produce
uncompetitive in the domestic and international markets. Hence, a review and revision of all taxation laws
and regulations are needed in order to create a favourable climate for production and marketing of
agricultural products.

6
Increasing productivity, commercialization and competitiveness. Average yields of major commodities
in Kenya are far below their potential. Proven yield-increasing technologies and practices exist, but are often
not being adopted, or adopted too slowly, for rapid productivity growth. The government should consider: i)
prioritizing activities that reduce costs and enhance benefits of uptake and utilization of improved inputs and
practices; ii) emphasize activities that feature a strategic combination of technical improvements and
institutional innovations, e.g. pest control, soil and water management, agroforestry, and crop–livestock
interactions; iii) develop physical infrastructure including irrigation and water conservation structures; and iv)
support management platforms that bundle together soil improvement, new crop and livestock varieties,
intensified input use, and farmer collective action in value chains.
Encouraging private sector participation. Profitable value addition in Kenyan agriculture is limited due to
the large share of processing and marketing costs in final prices. In addition, Kenya’s agricultural private
sector is systematically excluded from formal financial systems, undermining the ability to attract significant
private investment into the sector. The government could consider prioritizing activities that are both
privately profitable and socially efficient as such activities would help agribusiness firms to overcome the
wide variety of physical, financial, institutional, and human resource constraints on investment in agriculture.
Support could also be given to improving access to finance and technology for input supply, farm production,
storage and assembly, processing, distribution, wholesaling and retailing.
Promoting sustainable land and natural resources management. High population density has resulted
in continuous cultivation, resulting in biodiversity loss and widespread land degradation, most notably soil
nutrient depletion and erosion. Inadequate crop and livestock husbandry have compounded the problems.
Land-use regulations need to be strengthened and enforced, particularly in ecologically-threatened areas.
Moreover, physical infrastructure could be enhanced, thus increasing resilience of vulnerable people living
in extreme poverty. It is also important to rehabilitate degraded natural capital and ecosystem services, on
which subsistence smallholders depend, to promote sustainable land-use and restoration of natural capital
and to narrow, and ultimately close, gaps in inequalities.
Reforming delivery of agricultural services. Sustained growth in agricultural productivity in Kenya
depends on development of appropriate technologies and delivery of required services. It is therefore
necessary to make Kenya’s agricultural research system more relevant and responsive to farmer and trader
needs. Technical and institutional innovations that promote technology acquisition and exchange within
eastern and central Africa region 6 hould also be strengthened. Efforts to bolster private delivery of
agricultural services should be supported, alongside more effective and efficient public delivery, including
continued reform of legal and regulatory regimes governing public systems.
Ensuring effective coordination and implementation. The agricultural sector in Kenya comprises the
sub-sectors of crops, livestock, fisheries, land, water, cooperatives, environment, regional development and
forestry. These sub-sectors are represented by 10 ministries of agriculture, livestock development, fisheries
development, lands, water and irrigation, cooperative development and marketing, environment and mineral
resources, science and technology, regional development authorities, trade, and forestry and wildlife. Hence,
implementation of the Agricultural Sector Development Strategy 2010-2020 (ASDS) and green agriculture
initiatives requires strong partnerships among the Government of Kenya, the private sector, development

7
partners and other non-state actors. Strong coordination mechanisms, fundamental to a green economy
transformation, could also be established.

5
1. Introduction
1.1 Green economy in Kenya
In recent years, green economy has been widely recognised as an important tool to achieve sustainable
development. It is being pursued as a new paradigm by an increasing number of national governments, from
developing and developed countries, to achieve sustained economic growth which contributes to low carbon,
resource efficient and socially inclusive development.
The United Nations Environment Programme (UNEP) defines a green economy as one that results in improved
human well-being and social equity, while significantly reducing environmental risks and ecological scarcities (UNEP,
2011). In practice, there is no generic model for a green economy. Kenya is embarking on a new era of development
with recent discoveries of oil, natural gas, coal and other minerals. Undertaking a green economy transformation will
allow the country to take advantage of growing revenues from these recent discoveries and invest in a development
pathway that puts people, the environment and livelihoods at the forefront.
The Government of Kenya is already doing substantial work on the green economy. First of all, the policy and legal
landscape support a green economy. Furthermore, the government, development partners and other non-state
actors are supporting and implementing green economy-related policies and initiatives. Vision 2030 for the
environment sector is embedded in three pillars: the economic, social and political. The social pillar advocates “a just
and cohesive society enjoying reputable social development in a clean and secure environment” (GoK, 2007).
Kenya’s key policies and programmes for a green economy include investments in renewable energy, promotion of
resource-efficient and clean production, pollution control and waste management, environmental planning and
governance and restoration of forest ecosystems. In addition, Kenya has developed a National Climate Change
Response Strategy (NCCRS) and seeks to embrace a low-carbon development pathway that is inclusive and
equitable, and that contributes to Kenya’s global competitiveness. Through the Greening Kenya Initiative (GKI), the
government developed a database on green economy activities, which includes the manufacture of eco-friendly
materials, tree planting, organic farming, fish farming, renewable energy, eco-labelling, solid waste management and
environmental management.
1.2 Green economy national study and the purpose of this report
To help mainstream green economy in Kenyan policy discourse, the Kenya Institute for Public Policy Research and
Analysis (KIPPRA) and the Ministry of Environment, Water and Natural Resources (MEWNR), in partnership with
UNEP, conducted a Green Economy Assessment (GEA), focusing on four sectors: agriculture, energy,
manufacturing and transportation (UNEP, 2014). The GEA applied a system dynamics-based model, Threshold 21
(T21), to simulate investments in selected sectors and assess impacts on the economy, society and the environment.
Based on a literature review, stakeholder consultations and the modelling results, policy advice and
recommendations are provided to support national policies and plans on green economy.
The GEA report provided evidence that moving towards a green economy would bring a wide range of benefits to
Kenya in terms of relatively high long-term economic growth, cleaner environment and high productivity (UNEP,
2014). The quantitative analyses show that significant positive returns can be realized after only seven to ten years.
In the short-term (from 2012 to 2020), in spite of costs associated with green economy investments, growth in Gross

6
Domestic Product (GDP) would not be substantially different compared to BAU. However, the prices of goods and
services, costs of operations and technology choices could create different welfare costs and benefits for different
segments of the population in the short term. These require careful attention and “social protection floors” in order to
ensure a smooth and just transition. In the long term (from 2012 to 2030), the analysis finds that a green economy
scenario results in faster economic growth and increased wealth creation opportunities. For example, under a green
economy scenario, national real GDP is projected to exceed the BAU investment scenario by 12 per cent by 2030.
Furthermore, green economy investments can yield several positive impacts in the medium- to long-term across all
sectors in the economy.
Following the results of the GEA report, the MEWNR together with partners including UNEP, the World Wildlife Fund,
Danish International Development Agency, and the African Development Bank, are developing the Green Economy
Strategy and Implementation Plan (GESIP). This is consistent with the Kenya Vision 2030 which aims at transforming
Kenya into “a newly industrialized, middle-income country, providing high quality life to all its citizens in a clean and
secure environment” The five areas identified as the building blocks of the Kenya green economy strategy are:
promoting sustainable infrastructure; building resilience; sustainable natural resource management; promoting
resource efficiency; and social inclusion.
Commissioned by UNEP, the Institute for Global Environmental Strategies (IGES) prepared this green economy
sector study on Kenya’s agriculture sector. This study is derived from and based on the national GEA report for
Kenya (UNEP, 2014), with additional desk research conducted by IGES based on a literature and policy review. The
purpose of this sector report is to present the assessment results of potential opportunities and options to promote
green economy and scenario simulations of investments at the sector level.
Agriculture is one of the four core sectors of the GEA to support a green economy in Kenya. It was selected for this
green economy sector study because it is the main source of livelihood for the majority of the Kenyan people in terms
of food security, economic growth, employment creation, off-farm employment and foreign exchange earnings.
Greening the sector is expected to have many positive impacts through the use of sustainable practices which can
reduce water use for agriculture, combat soil erosion, and diversify and increase the incomes of farmers, especially
smallholders.
1.3 Macro-economic and country profile
Kenya is the largest economy in the East African Community (EAC) with an estimated per capita GDP of $862 in
2012 (World Bank, 2013). Between 2003 and 2007, the economy achieved sustained growth of 5.9 per cent on
average and the GDP growth reached 7 per cent in 2007 (UNEP, 2014). This growth was, however, disrupted due to
multiple shocks emanating from a political crisis in 2007-08, drought and floods, among other extreme climate events,
high global energy and food prices, and the global financial crisis in 2008 (UNEP, 2014). Consequently, economic
growth fell to 1.5 per cent in 2008, before increasing in the following years reaching 4.6 per cent in 2012, and 3.7 per
cent on average for the period 2007 to 2012.1
As Kenya’s leading sector, agriculture accounts for about one quarter of national GDP and absorbs 60 per cent of all
households in farming activities and 84 per cent of rural households in livestock farming (KIPPRA, 2009). Roughly 42
per cent of GDP is derived from natural resource sectors (agriculture, mining, forestry, fishing, tourism, water supply
1 Kenya National Bureau of Statistics (KNBS). (2012); Kenya Facts and Figures (2012); and the World Bank (2014).
Available at: http://knbs.or.ke/downloads/pdf/Kenyafacts2012.pdf.

7
and energy), which account for more than 70 per cent of employment (UNEP, 2014). The services sector, which
includes transport and communication, wholesale and retail trade, financial and other services, accounts for more
than 50 per cent of GDP (UNEP, 2014). The share of the manufacturing sector in GDP has stagnated at about 10 per
cent, indicating that the rate of industrialization has been low (UNEP, 2014).
Kenya’s economic growth has largely been driven by increases in domestic demand, with private consumption
accounting for about three-quarters of GDP (UNEP, 2014). In 2011, savings and investment rates were estimated at
about 13.2 per cent and 21 per cent, respectively (UNEP, 2014). Due to the low performance of external trade in
goods and services, together with a rapid growth in key imports of oil, capital goods and machinery and the
weakening of Kenya’s currency, the deficit in Kenya’s external current account increased from about 2.3 per cent of
GDP in 2006 to 11.9 per cent in 2012 (UNEP, 2014). Kenya receives a relatively modest amount of foreign direct
investment (FDI), which only represents 0.6 per cent of GDP, while foreign development assistant is 5.1 per cent of
Gross National Income (GNI) (Table 1).
Table 1 Macroeconomic indicators for Kenya
Indicator Year Value
GDP (PPP1 at constant 2011 billion USD) 2012 92.9
GDP annual growth rate (%, at constant 2011 USD) 2007-2012 3.8
GDP per capita (PPP at constant 2011 USD) 2012 2,151
FDI net flows (% of GDP) 2007-2011 0.6
Current account balance ( BOP2 current USD) 2012 -10
Net official development assistance received (% of GNI) 2010 5.1
Expenditure in research and development (% of GDP) 2012 0.4
Unemployment rate (% of labour force) 2012 9
Human Development Index (0-1, with 1 the highest) 2012 0.519
Source: World Bank, UNDP and OECD.
Note: 1. PPP: Purchasing power parity. 2. BOP: Balance of payment.
From an environmental perspective, Kenya has a low ecological footprint (Rees, 2003) due mainly to its relatively low
levels of consumption and economic activities. However, the country has moved rapidly into a state of “ecological
overshooting” with a faster depletion rate than the replacement rate of its natural resources. In 2007, Kenya’s
ecological footprint was 1.11 ha/person, while its biocapacity was estimated to be only 0.59 ha/person (Table 2). The
increasing deficit in the national ecological account is attributable to both anthropogenic impacts from activities, such
as overexploitation, industrial pollution and deforestation, and natural disasters including prolonged droughts and
floods. The strain on ecosystems is especially apparent in the Arid and Semi-Arid Lands (ASALs), which make up
more than 80 per cent of Kenya’s total territory, and are home to over 10 million people, about a quarter of Kenya’s
total population (UNEP, 2014). Environmental degradation, particularly in the ASALs, is evidenced by soil erosion,
desertification, loss of biodiversity, water scarcity and degraded water quality (UNEP, 2014).

8
Table 2 Environmental indicators for Kenya
Indicator Year Value
Share of fossil fuels in primary energy supply (%) 2009 16.8
Share of renewables in primary energy supply (%) 2009 83.2
Greenhouse gas emissions (GHG) per capita (tonnes)
of carbon dioxide equivalent)
2005 0.9
Carbon dioxide emissions per capita (tonnes) 2008 0.3
Carbon dioxide emissions per capita (average annual growth rate %) 1970-2008 0
Forest area (% of total land area) 2010 6.1
Change of forest area (%) 1990-2010 -6.5
Fresh water withdrawals (% of total renewable water resources) 2003-2012 8.9
Endangered species (% of total species) 2011 8.4
Agricultural land (% of total land area) 2009 48.1
Ecological footprint (global hectares per person) 2007 1.11
Biocapacity (global hectares per person) 2007 0.59
Source: UNDP and Global Footprint Network (2010).
From a social perspective, Kenya’s high poverty rate and growing inequality are among the biggest challenges that
the country is facing in its transformation to a green economy. National absolute poverty in Kenya, based on the
national poverty line at KSh 1,239 (USD 15.4), per person per month for rural areas, and KSh 2,648 (USD 32.8) per
person per month for urban areas, declined slightly from 52.3 per cent in 1997 to 45.9 per cent in 2005-2006 (UNEP,
2014). However, there are disparities between rural and urban areas, characterized by greater poverty reduction in
towns and cities. The 2009 Oxford Poverty and Human Development Initiative report on multidimensional poverty in
Kenya (University of Oxford, 2011) estimated that 47.8 per cent of the population is multidimensional poor. Around
27.4 per cent of the population is vulnerable to poverty, while 19.8 per cent of the population is in severe poverty
(UNEP, 2014). Overall income inequality is relatively high in Kenya with a 47.7 Gini coefficient (see Table 3).
The country’s population was 40.7 million in 2012 (see Table 3). In 2011, the primary working age population (15 - 64
years) was estimated to be 54 per cent of the total population, characterized by a large proportion of youth (UNEP,
2014). Kenya faces employment challenges, in particular for young people. In 2011, overall unemployment was 8.6
per cent, with higher unemployment rate for youth at 10.4 per cent and differences across regions (UNEP, 2014).
The level of under-employment (i.e. the proportion of employed people who are involuntarily working less than the
normal working hours) is also relatively high (UNEP, 2014). The informal sector remains the major employer,
accounting for about 80 per cent of total recorded employment (Economic Survey, 2013). Due to the predominance
of informal employment, the quality of employment remains as a policy question to the national government.
Table 3 Social indicators for Kenya
Indicator Year Kenya
Poverty rate (% of population living under PPP 1.25 USD a day) 2002-2011 43.4
Multidimensional poverty (% of population living under multidimensional poverty) 2008-2009 47.8
Adult literacy (%) 2005-2010 87.4
Population with at least secondary education (% ages 25 and older) 2010 41.9
Homicide rate (% per 100,000 people) 2004-2011 20.1

9
Under five mortality rate (deaths per 1,000 live births) 2010 85
Income (Gini coefficient) 2000-2010 47.7
Electrification rate (% of population) 2009 16.1
Population (million people) 2012 40.7
Urban population (% of total) 2012 24.4
Total dependency ratio (per 100 people ages 15–64) 2012 54
Source: KNBS (2013), UNDP and the World Bank.
The government of Kenya has recognized that realizing a green economy is important to achieve the country’s
multiple targets for rapid and stable economic growth, environmental protection and natural resource conservation
and social inclusion.
10
2. The agriculture sector in Kenya
2.1 Sector profile
2.1.1 Performance of the agriculture sector
According to the GEA report (UNEP, 2014), a multi-stakeholder consultation workshop was held on 15 February
2012 in Nairobi, aimed at supporting Kenya’s efforts in its transformation to a green economy. During the gathering,
the participants identified agriculture, energy, transport (roads) and manufacturing as having significant potential for
greening the economy because of their contribution to GDP, job creation, poverty reduction and the country’s global
competitiveness.
Agriculture is the mainstay of Kenyan economy, contributing to 24 per cent of national GDP valued at KSh 342 billion
(USD 4.5 billion2) and another 27 per cent indirectly valued at KSh 385 billion (USD 5.1 billion) in 2009 (GoK, 2009).
This sector in Kenya is large and complex, with a multitude of public, parastatal, non-governmental and private actors,
accounting for 65 per cent of Kenya’s total exports (GoK, 2011). Moreover, the sector employs over 40 per cent of
the total population and over 70 per cent of the rural population. Agriculture also provides livelihoods (employment,
income, and food security needs) for more than 80 per cent of the Kenyan population (FAO, 2010). Therefore, the
sector is not only the driver of Kenya’s economy, but also the means of wellbeing for the majority of the Kenyan
people (GoK, 2009).
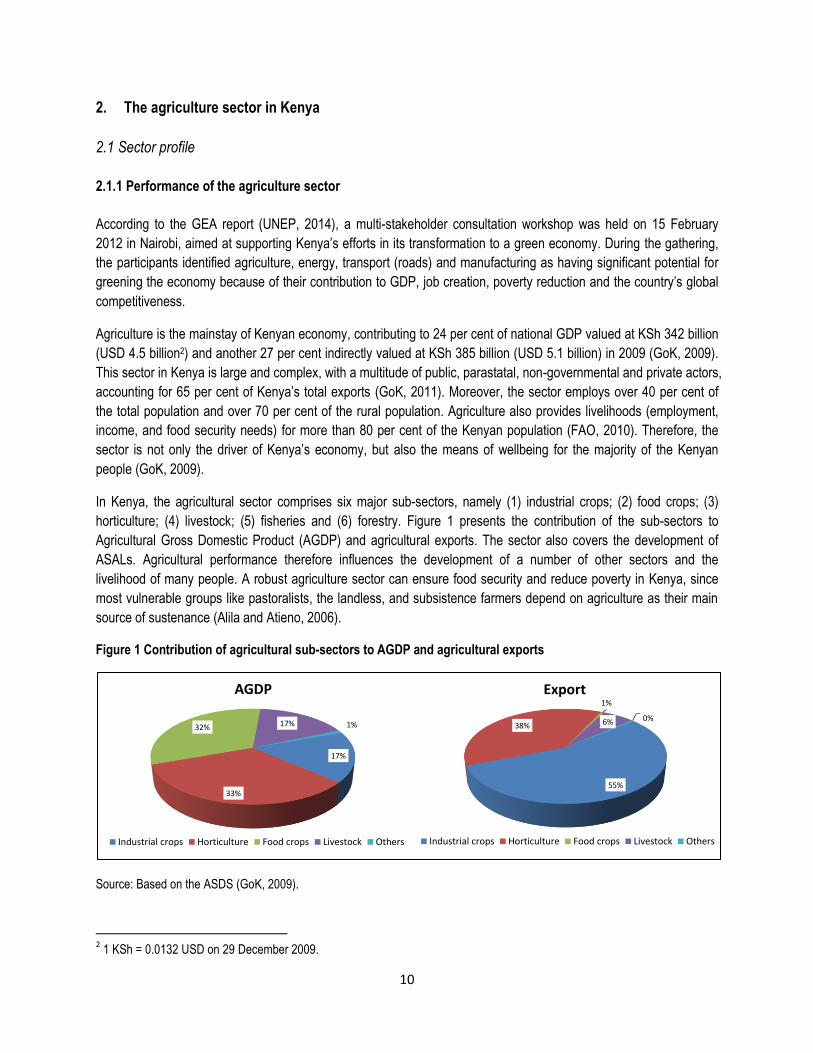
In Kenya, the agricultural sector comprises six major sub-sectors, namely (1) industrial crops; (2) food crops; (3)
horticulture; (4) livestock; (5) fisheries and (6) forestry. Figure 1 presents the contribution of the sub-sectors to
Agricultural Gross Domestic Product (AGDP) and agricultural exports. The sector also covers the development of
ASALs. Agricultural performance therefore influences the development of a number of other sectors and the
livelihood of many people. A robust agriculture sector can ensure food security and reduce poverty in Kenya, since
most vulnerable groups like pastoralists, the landless, and subsistence farmers depend on agriculture as their main
source of sustenance (Alila and Atieno, 2006).
Figure 1 Contribution of agricultural sub-sectors to AGDP and agricultural exports
Source: Based on the ASDS (GoK, 2009).
2 1 KSh = 0.0132 USD on 29 December 2009.
17%
33%
32% 17% 1%
AGDP
Industrial crops Horticulture Food crops Livestock Others
55%
38%
1%
6% 0%
Export
Industrial crops Horticulture Food crops Livestock Others

11
In Kenya, economic growth is highly correlated with the development of agriculture (Figure 2). In the first two
decades after independence, the agricultural sector, as well as the national economy, recorded the most impressive
growth in sub-Saharan Africa growing at average rates of 6 per cent per annum for agriculture and 7 per cent for the
national economy (GoK, 2009). This growth was driven by ample available land and better use of technology.
Moreover, the government provided support to agricultural extension and research, agricultural inputs, marketing,
credit and agro-processing, as well as to the establishment of agricultural institutions (including farmers’
cooperatives). An average of 13 per cent of the national budget was allocated to this sector during this period (GoK,
2009).
Figure 2 Trends in agricultural and economic growth (1960-2008)
Source: GoK (2009).
However, this rapid growth was not sustained. The sector shrank to an average annual growth rate of 3.5 per cent in
the 1980s and fell further to an average rate of 1.3 per cent in the 1990s (GoK, 2009). According to the ASDS (GoK,
2009), the main reasons for this decline included low investment, mismanagement, virtual collapse of agricultural
institutions and negligence of agricultural extension and research. During this period, the government was
implementing Structural Adjustment Programmes (SAPs), which encouraged poorly sequenced privatization in the
sector and saw budgetary allocation to agriculture declining to 2 per cent or less of the national budget (GoK, 2009).
As explained in the ASDS (GoK, 2009), the agriculture sector began to revive in 2000, with an average growth rate of
2.4 per cent. This was driven by the governments’ efforts, especially after 2003, to recognize agriculture as a priority
sector, key to economic growth in the context of the Economic Recovery Strategy for Employment and Wealth
Creation (ERS) and the Strategy for Revitalizing Agriculture (SRA). The government gradually started to invest more
in the sector and to increase budgetary allocation to an average of 4.5 per cent of the total national budget (GoK,
2009). The sector reached a high growth rate of 6.1 per cent in 2007 (GoK, 2009).
However, these gains were affected by many adverse factors, including the post-election violence in 2008, multiple
crises caused by global food prices, escalating fuel prices in 2008, and the financial crises of 2008/2009 (GoK, 2009).
In 2008, the agricultural sector grew at a negative rate of 4.1 per cent (see Table 4). The effect of these factors was
further aggravated by severe drought and erratic rainfall in 2009 which continued to dampen agriculture output.

12
In 2010, growth in the agriculture sector rebounded. Vibrant internal demand for major staples, livestock products
and horticultural goods, and growth in key export sub-sectors such as coffee, tea, pyrethrum, horticulture, and cut
flowers, were important factors that contributed to this recovery (GoK, 2010). In 2012, agricultural output grew by 3.8
per cent, more than twice its growth in 2011 (Table 4), thanks largely to better weather conditions. The government is
undertaking important legal and institutional reforms in the sector, in addition to increasing allocation of resources
towards irrigation, and improved access to inputs, especially fertilizer and seeds (KIPPRA, 2013).
Table 4 Performance of the agriculture sector in Kenya (2008-2012)
Item 2008 2009 2010 2011 2012*
GDP growth rate at 2001 constant prices (%) 1.5 2.7 5.8 4.4 4.6
Growth rate of agriculture and forestry sector at 2001 constant prices (%) -4.1 -2.6 6.4 1.5 3.8
Contributions of agriculture and forestry sector to GDP at current prices (%) 22.3 23.5 21.4 24 26
Source: Kenya National Bureau of Statistics (KNBS) (2012).
Note: Data for 2012 is based on information from the Kenya Institute for Public Policy Research and Analysis (KIPPRA) (2013).
2.1.2 Characteristics of the agriculture sector
Of 576,000 square kilometres in total land area, only about 16 per cent is of high and medium agricultural potential
with adequate and reliable rainfall (GoK, 2009). This potentially arable land is dominated by commercial agriculture
with cropland occupying 31 per cent, grazing land 30 per cent, and forests 22 per cent (GoK, 2009). The rest is
ASALs not suitable for rain-fed farming but rather used by ranchers, agro-pastoralists and pastoralists.
Kenya has seven distinct ecological zones, including Tropical Alpine, Upper Highland, Lower Highland, Upper
Midland, Lower Midland, Lowland and Coastal Lowlands. The country is also divided into three main production
zones based on rainfall. In the high rainfall zone, the productive agricultural land can receive more than 1,000 mm of
rainfall annually. The region occupies less than 20 per cent of total productive agricultural land, but has
approximately 50 per cent of the country’s population. Using semi-intensive and intensive systems, this zone
accounts for all the tea, pyrethrum, potato, coffee, vegetables and nearly 75 per cent milk production (GoK, 2009).
The medium rainfall zone receives between 750 mm and 1,000 mm of rainfall annually and occupies 30 per cent to
35 per cent of the country’s land area (GoK, 2009). It is home to about 30 per cent of the population. Farmers in this
zone keep cattle, small livestock and grow drought-tolerant crops. The low rainfall areas receive 200 mm to 750 mm
of rainfall annually and are home to about 20 per cent of the Kenyan population. They also contain 80 per cent of the
country’s livestock and 65 per cent of its wildlife (Gok, 2009).
Kenya’s agriculture is mainly rain-fed, making the sector vulnerable to weather variability which leads to fluctuations
in production and incomes, especially in rural areas (Alila and Atieno, 2006). Over reliance on rain-fed agriculture is
one of the major causes of the country’s food insecurity.
Irrigation agriculture in Kenya is limited and mainly developed in the form of irrigation schemes and large-scale
irrigation of crops like rice and coffee. Individual farmers have developed their own systems of irrigation, notably for
export crops like coffee and horticultural produce. Large commercial farms account for 40 per cent of irrigated land,
while the smallholder farmers and government-managed schemes account for 42 per cent and 18 per cent of
irrigated land, respectively (GoK, 2009). Despite the enormous potential for irrigation, less than 17 per cent of
540,000 hectares of suitable land has been irrigated (GoK, 2004). This is mainly due to low utilization of water, lack
of efficient technologies, destruction of rainfall catchment areas, poor management of government irrigation schemes,

13
degradation of surface water, uncontrolled exploitation of underground water leading to a drop in the water table, an
increase in water extraction costs, and sluggishness in permit allocation for water use (Alila and Atieno, 2006).
Farming in Kenya is usually on a small scale. About 75 per cent of total agricultural output and 70 per cent of
marketed agricultural production comes from farms around two to three hectares in size (UNEP, 2014). Adoption of
improved inputs such as hybrid seed, concentrate feeds, fertilizers and pesticides or machinery by small-scale
farmers is low. This indicates that there is huge potential for increasing productivity for farmers who adopt modern
and green farming practices (GoK, 2009).
The agriculture sector has come under pressure due to the population increase and extreme weather changes. The
sub-division of land, resulting from population pressure and the relative scarcity of productive agricultural land, has
resulted in small uneconomic farm sizes, which cannot be managed sustainably (UNEP, 2014). The problem is
expected to increase, with available land per capita in Kenya decreasing from the present area of approximately 1.5
ha to 0.3 ha by 2050 (GoK, 2007). In addition, the sector is vulnerable to more frequent and prolonged droughts and
major floods due to climate change. The increased frequency of these weather extremes is leading to intensified soil
erosion, deforestation, loss of soil fertility and reduced productivity.
2.1.3 Strategies and policies
In order to put Kenya back on a strong economic growth path, the government embarked on the formulation of a wide
range of policies aimed at economic reconstruction and the rehabilitation of collapsed infrastructure and institutions.
In 2003, the ERS was launched as a blueprint for economic development with an overall goal of creating more jobs
and wealth to move the country from poverty to prosperity. The ERS gives high prominence and priority to agriculture
and recognizes it as the backbone of the economy. Its rapid growth is necessary to to generate wealth and
employment. In addition, the strategy recognizes that revival of agricultural institutions and investment in agricultural
research and extension are essential for sustainable economic growth (GoK, 2009).
As a response to the ERS, the Government of Kenya, as mentioned above, launched the SRA in 2004. The SRA
states that the Vision of the Government is “to transform Kenya’s agriculture into a profitable, commercially oriented
and internationally and regionally competitive economic activity that provides high quality gainful employment to
Kenyans” (GoK, 2009). The target set by SRA for agricultural growth was for an average annual rate of 3.1 per cent
during 2003-2007 and was predicted to reach over 5 per cent by 2007.
The ERS was a 5-year plan, expected to expire in the financial year 2007/2008. In June 2008, the Government
launched the Kenya Vision 2030 as the new long-term development blueprint for the country (GoK, 2009). The Vision
of this blueprint is “a globally competitive and prosperous country with a high quality of life by 2030.” It aims to
change Kenya into “a newly industrializing, middle-income country providing a high quality of life to all its citizens in a
clean and secure environment.” The Vision is underpinned by three pillars: the economic pillar aiming to achieve a
sustained economic growth rate of 10 per cent per annum in 2030; the social pillar seeking to create cohesive and
equitable social development in a clean and secure environment, and the political pillar aspiring to realize an
accountable democratic system. Table 5 below outlines the country’s main targets that it hopes to achieve by 2020.

14
Table 5 Kenya’s targets for growth, food security and poverty reduction by 2020
Indicator Target
GDP growth rate (%) 10
Agricultural growth rate (%) 7
Poverty rate (%) 25
Reduction in food insecurity (%) 30
Annual increase in agriculture contribution to GDP (billions of KSh) 80
Divestiture in state corporations dealing with production, processing and marketing All
Reform and streamlining of agricultural services All
Source: ASDS (GoK, 2009).
The ASDS outlines the following interventions to facilitate rapid growth in the sector:
Review and harmonize legal, regulatory and institutional frameworks;
Restructure and privatize non-core functions of parastatals and sector ministries;
Improve delivery of research, extension and advisory services;
Improve access to quality inputs (fertilizer, hybrid seeds, equipment) and financial services; and
Improve access to both domestic and external markets.
According to the ASDS mission, a better extension service is one of the critical change agents needed to transform
subsistence farming to modern and commercial agriculture. Thus, in 2012, the National Agricultural Sector Extension
Policy (NASEP) was drafted by the government of Kenya to strengthen the important role of extension service in
sharing knowledge, technologies and agricultural information, and in linking the farmer to other actors in the economy.
Based on the ASDS, the government developed the Kenya Comprehensive Africa Agriculture Development
Programme (CAADP) Compact that commits Kenya to the vision, principles and strategy elements of the pan-African
programme, CAADP, established in 20033 (GoK, 2010). In addition, the government prepared the Medium-Term
Investment Plan (2010-2015) in 2010 that elaborates on and solidifies plans for agricultural sector development
signalled in the ASDS and Kenya CAADP Compact.
In addition, the government has developed a National Food and Nutrition Security Policy to address challenges
related to nutrition and food security, and is implementing the CAADP supported by the New Partnership for Africa’s
Development (NEPAD).
The country is also allocating resources towards increased irrigation, distribution of drought-resistant seeds for maize
as well as indigenous crops (UNEP, 2014). Some policy initiatives aim at encouraging the country’s youth to venture
into agribusiness by providing concessional loans and promoting greenhouse farming.
3 The Comprehensive Africa Agriculture Development Programme (CAADP) is Africa’s policy framework for agricultural
transformation, wealth creation, food security and nutrition, economic growth and prosperity for all. Available at: http://www.caadp.net/about-us

15
2.2 Greening the agriculture sector
In Kenya, where the majority of farming is small-scale, greening the small-farm sector through promotion and
dissemination of sustainable practices could be the most effective way to make more food available to the poor and
hungry, reduce poverty, increase carbon sequestration and access growing international markets for green products
(UNEP, 2014). Given food security concerns in the country, greening the sector must deliver an improved productivity
by using green practices.
Given Kenya’s challenges and priorities, the following options are recommended for the national government and
other stakeholders to facilitate greening the agriculture sector based on the GEA Report for Kenya (UNEP, 2014) and
the multi-stakeholder consultation workshop held on 15 February 2012 in Nairobi.
Promote agroforestry – The addition of trees to farms offers an opportunity for farmers to increase
farm productivity and diversify their incomes, and helps combat soil erosion and nutrient depletion by
providing a more balanced agro-ecological profile. Agroforestry also contributes to the government’s
goal of 10 per cent tree cover on farms. The GoK and various stakeholders have already undertaken
significant work on agroforestry and investment could be boosted to provide support for this initiative.
Sustainable water management – Kenya is a water-scarce country and, therefore, needs to strongly
prioritize the efficient allocation of water in its policymaking and planning. Sectors like industry compete
for Kenya’s scarce water resources. Allocation should effectively balance the conflicting priorities of
economic growth and food security/agricultural productivity. Measures, such as rainwater harvesting,
irrigation and the use of less water-intensive crop varieties, could be employed extensively.
Improved livestock management – Healthier herds can be encouraged through destocking or
reducing herds to sustainable numbers, switching to breeds better suited to the local climate, and
livestock switching (e.g. from cattle to goats or camels) to animals better suited to ASALs conditions,
where much livestock farming occurs.
Research and Development (R&D), education and capacity building – Export-oriented crops can
be supported through R&D programmes that help producers, in particular smallholders to meet
international standards, improve productivity and energy-efficiency and introduce clean sources of
energy (e.g. drying of tea and coffee), and reduce negative environmental impacts (e.g. reducing water,
fertilizer and pesticide use). Given the large number of smallholder farms in the country, providing
farmers with valuable information and resources will be key in assisting them in transitioning to greener,
more sustainable farming practices. Extending and improving the services should be the focus. Some
possible areas of education and focus include soil and water management, different crop strains and
species, agroforestry and livestock management.
Green credentials – Efforts need to be enhanced to establish Kenya’s green credentials on
international markets, by introducing and enforcing domestic standards and working with private players
in the value chain to develop and obtain internationally-recognized product labels. Investing in the
necessary market institutions such as certification bodies and testing laboratories is also required (Ellis,
et al., 2013).

16
3. Modelling a green agriculture sector4
3.1 Model description and data source
Modelling work was conducted in the GEA report (UNEP, 2014) in order to test the hypothesis that efficient and
sustainable management of natural resources does not necessarily imply lower economic growth.
The T21 model is applied to carry out the quantitative analysis of greening the economy in Kenya. T21 is a System
Dynamics (SD)-based model designed to support national development planning in medium to long-term perspective.
Due to its systematic framework, the model integrates the economic, social, and environmental aspects of
development, thereby providing insight into the potential impact of development policies across a wide range of
sectors, and revealing how different strategies interact to achieve desired goals and objectives.
The T21-Kenya model has three spheres: society, economy, and environment (see Figure A1 in Annex 1). The
economy sphere contains five sub-sectors, namely Production, Households, Government, Rest of the World (ROW)
and Investment. Major production sectors, including agriculture, industry and services, are characterized by the
Cobb-Douglas production function with resources, labour, capital and technology as inputs and an inclusive Total
Factor Productivity (TFP) variable. A Social Accounting Matrix (SAM) is used to elaborate the economic flows and to
balance supply and demand in each of the sectors. Demand is based on population and per capita income and
distributed among sub-sectors using Engle’s Curves. This helps calculate relative prices, which are the basis for
allocating investment among the sectors. The standard International Monetary Fund (IMF) budget categories are
employed and key macro balances are incorporated into the model. The ROW sub-sector comprises trade, current
account transactions and capital flows (including debt management).
The society sphere contains six sub-sectors, namely Population, Education, Health, Infrastructure, Labour and
Poverty. The society sphere presents detailed population dynamics by sex and age; health and education challenges
and programmes; basic infrastructure; employment; poverty levels and income distribution. These sub-sectors take
into account, for example, the interactions of income, healthcare, and adult literacy rates on fertility and life
expectancy that, in turn, determine population growth. Population determines the labour force over time, which,
interacting with the level of economic activity, influences employment. Education and health condition influence
labour productivity and life expectancy. In the model, employment and labour productivity affect the level of
production from a given capital stock. An HIV/AIDS sector is also included, which shows the possible impact on
population and productivity and the effects of different treatment programmes. Food sufficiency and nutrition,
reproductive health and vocational training are also modelled.
The environment sphere consists of five sub-sectors: Land, Water, Energy, Emissions and Sustainability. It tracks
pollution created in the production processes and its impacts on health and, eventually, on production. It also
estimates the use of natural resources – both renewable and non-renewable – and can estimate the impact of the
depletion of these resources on production and other factors. In addition, the environment sphere also examines the
effect of soil erosion and other forms of environmental degradation and their impact on other sectors, such as
agricultural productivity and nutrition. Additional issues addressed are fossil fuel use, forest depletion, land and water
degradation, air and water pollution, and greenhouse gas (GHG) emissions. The environment sphere is normally
expanded to take account of country-specific concerns, including the effects of climate change. Climate has been
integrated into the T21-Kenya model to represent the impacts of climate change on various sectors and to evaluate
4 This entire section mainly draws on the GEA report for Kenya (UNEP, 2014).
17
the implications of green economy interventions on climate adaptation. Overall, the sectors whose climate impacts
and investments have been analyzed in the model include: agriculture, livestock, fisheries, forestry, irrigation, water,
energy and tourism.
Under the three-sphere framework, the T21-Kenya model consists of 16 sectors and 50 modules (see Table 6). Each
sector belongs to one of the three spheres and each of the first 40 modules belongs to one of the 16 sectors.
Modules 41-50 are separated as Extra Modules, capturing cross-sector impacts. One module is a piece of the T21
model, whose internal mechanisms can be understood in isolation from the rest of the model, but is linked to the
other modules across 16 key sectors such as energy, agriculture and infrastructure in economic, environmental and
social spheres.
Data was obtained from various sources, including the Kenya National Bureau of Statistics (KNBS), government
ministries, as well as related parastatals. For example, in the agriculture module, data on crop yield, factor inputs,
crop losses, factor inputs (labour and capital) and crop production were used.

18
Table 6 Modules, sectors and spheres of the T21-Kenya model
Society Economy Environment Population Sector:
Production Sector:
Land Sector:
1. Population 15. Production and Income 34. Land 2. Fertility 16. Agriculture 3. Mortality 17. Husbandry-fishery-forestry Water Sector: 18. Livestock 35. Water demand
Education Sector: 19. Fisheries 36. Water supply 4. Primary Education 20. Forestry 5. Secondary Education 21. Industry Energy Sector:
22. Services 37. Energy demand Health Sector: 23. Tourism 38. Energy supply
6. Access to basic health care 7. HIV/AIDS Households Sector: Emissions Sector: 8. HIV children and orphans 24. Households accounts 39. Fossil fuel and GHG emissions 9. Nutrition
Government Sector: Sustainability Sector: Infrastructure Sector: 25. Government revenue 40. Ecological footprint
10. Roads 26. Government expenditure 11. Irrigation 27. Public inv. and consumption Extra modules:
Labour Sector: 28. Gov. balance and financing 41. MDGs 12. Employment 29. Government debt 42. HDI and GDI 13. Labour Availability and unemployment
43. Indicators
ROW Sector: 44. Climate Impacts Poverty Sector: 30. International trade 45. Climate Interventions
14. Income distribution 31. Balance of payments 46. Climate Investments 47. Malaria transmission
Investment Sector: 48. IVM interventions
32. Relative prices 49. Malaria treatment
33. Investment 50. Malaria cost accounting
Source: UNEP, 2014.
3.2 Sector modeling of the agriculture sector
The agriculture sector is included in the T21-Kenya model as a module under the Production Sector, in the economy
sphere. For the Production Sector, GDP is divided across main outputs of three economic sectors, namely,
agriculture, industry and services. The agriculture module includes crop production (which differentiates between
production utilizing conventional and organic fertilizer), along with the forestry and fishery modules. The agricultural
production module is based on the Cobb-Douglas production function, where land, labour and capital are the main
factors of production, and are influenced by water availability, electricity prices, literacy rate and access to roads. The
agriculture sector has an influence on macroeconomic indicators related to the green economy, as illustrated in the
causal loop diagram (Figure A2 in Annex 2). Investment in ‘resource conservation’ and ‘agriculture capital’ will lead to
an increase in ‘agricultural production’ with a consequent increase in GDP, which provide opportunities for further
investments. These investments could be in health and education, which will influence the population and labour
force and, in turn, affect agricultural production. Likewise, education will also affect labour productivity and

19
agricultural production. Another option could be to channel investments into ‘pollution control’, which can improve life
expectancy and associate benefits to the rest of the economy, or directly improve agricultural production.
3.3 Scenario setting for the simulation of green economy interventions
In the GEA report (UNEP, 2014), green economy interventions were simulated by the T21-Kenya model in four
selected key sectors, namely, agriculture, energy, transport and manufacturing. Given the reliance of these sectors
on natural resources, and the potential impacts of climate change, the analysis includes the assessment of: the
impact of climate change, impact of selected investments and interventions, and cross-sectoral synergies and side-
effects.
In this respect, the analysis accounts for the projections of specific climate impacts in eleven sectors, distributed
across crop production, livestock, tourism, forestry, fishery, transport, communication, energy, land use (e.g.
forestland), health and issues related to biodiversity. For the agriculture sector in particular, major impacts considered
include the following:
Reduced productivity due to the changes in rainfall patterns/rainfall variability;
Low agricultural production during droughts due to the changes in rainfall patterns /rainfall variability;
Reduced crop production due to the leaching of key soil minerals (soil salinity);
Land degradation due to drought and overexploitation;
Crop infestation by pests and increased crop diseases due to rise in temperatures;
Crop disease outbreak during no/low rainfall due to low rainfall.
Concerning interventions, nine green economy investment categories and 27 interventions (see Table 7) are
evaluated, impacting practically every sphere, sector and module of T21-Kenya. The interventions are defined using
the National Climate Change Response Strategy (NCCRS) as the main reference with the same prioritization
highlighted in the NCCRS. For the agriculture sector specific interventions include:
Increasing the acreage under irrigated agriculture;
Investing in water harvesting programmes
Provision of farm inputs such as fertilizers and environmentally-friendly pesticides;
Promotion of conservation agriculture, i.e. agroforestry and soil and water conservation;
Enhanced agricultural research, including international collaboration.
To implement the interventions set out in the NCCRS, the largest resource will be required by the energy sector,
especially in green energy development (solar, wind, renewable biomass, etc.) by the private sector (KSh 22.5 billion
per year). These are followed by geothermal power development by the government and its development partners
(KSh 20.3 billion per year). The largest resource portion for the agriculture sector will be required for increasing
acreage under irrigated agriculture (KSh 5.2 billion per year), followed by a portion for investing in water harvesting
programmes (KSh 2 billion per year).
Following the ‘2 per cent of GDP’ assumption from the UNEP Green Economy Report (UNEP, 2011), this study
allocates 2 per cent of GDP per annum to investments in green economy interventions. These investments are based
on selected key sectors using the prioritization in the NCCRS. The analysis includes the comparison of conventional
and green economy scenarios assuming the same 2 per cent of GDP being invested, respectively, in conventional
sectors or activities (BAU2%) and in interventions that would support resource efficiency, low carbon development

20
and natural capital preservation (GE2%). Total investment of approximately KSh 1.2 trillion (US$14.9 billion) (in
nominal or current terms) between 2012 and 2030 is analysed in a variety of interventions. This investment is equal
to approximately 2 per cent of GDP annually, with most of the interventions to be implemented by 2020. In summary:
The BAU or baseline scenario assumes no fundamental changes in policy or external conditions up to 2030;
The BAU2% allocates an additional 2 per cent of GDP per annum as investments to the current BAU
investment path; and
The GE2% scenario assumes an additional 2 per cent of GDP per annum as green investments to the
baseline.
Under crop production, the specific interventions modelled and analysed for this study include investments in
irrigation, fertilizers and pesticides, organic fertilizer, agriculture R&D, as well as investment in water conservation,
specifically investment in new dams. Similarly, under fisheries, investment in fishery adaptation measures and
ecosystem restoration were modelled and analysed. Under forestry, three main investments were analysed:
investment in afforestation, forest management, and forestry R&D.

21
Table 7 Green economy investment simulated
Sector Sub-Sector Description of specific activities/ interventions Implementation timeframe (yr)
Resource requirement per year (billions of
KSh)
Productive
Agriculture
Increasing the acreage under irrigated agriculture 20 5.2
Investing in water harvesting programme, e.g., construction of water pans 20 2
Provision of farm inputs such as fertilizers and environmentally-friendly pesticides, e.g., through govt. subsidies 20 0.8
Promotion of conservation agriculture: agroforestry, soil and water conservation 20 0.82
Enhanced agricultural research, including international collaborations 20 1.28
Marine and Fisheries Resources
Assessment of socio-economic impacts of climate change on livelihoods of riparian communities 20 0.026
Developing mitigation measures against resource decline
Enactment of necessary laws
Strengthening monitoring and surveying systems
Upscaling sustainable aquaculture activities in fresh, brackish and marine water systems to ensure food security
20 0.035
Reducing the sector’s carbon emissions through promotion of solar lamps for “dagaa” fishing, solar driers for fish curing, improved energy fish smoking ovens, etc., and planting of trees around ponds
20 0.13
Forestry and wildlife
Afforestation and reforestation targeting additional 4.1 million ha of land under forest cover
Rehabilitation and restoration of all degraded forests and riverine vegetation
Production of 3.5 billion seedlings in 35,000 schools countrywide
Production of 4 billion seedlings by KFS for rehabilitation of degraded forest areas, reclaimed forests and farmlands
Establishment of additional arboreta
Other interventions
20 5.55
Pursuit of innovative funding mechanisms for forestry development
Payment for environmental services
Preparation of tree planting proposals for funding through the Constituency Development Fund (CDF) and Local Authority Transfer Fund (LATF)
Setting up a Forest Management and Conservation Fund (FMCF)
Revenues from sale of plantation timber
Other measures
20 8
Research to project future climate change scenarios and likely impacts on wildlife and rangelands 20 0.39
Cooperatives Development
Lifestyle and livelihoods interventions
Promotion of energy-efficient cook stoves
Development of rural sewage treatment plants
20 0.05
Physical Infrastructure and Service Industry
Water & Irrigation
In conjunction with the Ministry of Agriculture, undertaking irrigation projects 20 2
Construction and maintenance of large 24 dams 20 2.8
Exploitation of deep aquifers 20 0.018
Artificial recharging of aquifers 20 0.005

22
Sector Sub-Sector Description of specific activities/ interventions Implementation timeframe (yr)
Resource requirement per year (billions of
KSh)
Energy
Accelerated development of geothermal power by the government and its development partners 10 20.3
Accelerated development of geothermal power by the private sector (GDC will take up if there are no suitable investors)
10 12.1
Accelerated development of green energy (solar, wind, renewable biomass, etc.) by the government and its development partners
5 15
Accelerated development of green energy (solar, wind, renewable biomass, etc.) by the private sector 5 22.5
Provision of efficient (fluorescent) bulbs to domestic consumers 10 0.36
Water catchment protection programmes e.g. afforestation 10 0.375
Promotion of low-end solar devices including solar drip irrigation, solar water heating, etc. 10 3
Transport Development of a Bus Rapid Transit (BRT) system 4 8.75
Development of Light Rail 4 3.1
Roads Road maintenance 20 20
Manpower Youth Affairs and Sports
Mass tree planting countrywide under the theme “Planting Our Future” using “Groasis Water Box” technology to enhance tree survival, especially in arid and semi-arid regions
20 0.3
Source: UNEP (2014)
Note: The interventions presented in this table form part of the action plan of the NCCRS. The table outlines specific activities, timeframe and estimated costs of various
interventions. The estimates were generated by ministries as part of climate change project concepts submitted to the Ministry of Environment, Water and Natural resources for
the preparation of the NCCRS.

23
3.4 Simulation results
From an economy-wide perspective, positive economic returns are expected approximately seven to ten years after
green economy policy interventions. The national real GDP is projected to exceed BAU2% by about 12 per cent by
2030, to reach KES 3.6 trillion (US$45 billion). Annual real GDP growth rates with GE and BAU interventions are 5.2
per cent and 4.6 per cent, respectively, in the 2012-2030 period on average (Figure 3). The Kenyan population will
also benefit from this economic development as real per capita national income will rise from KES 39,897 (US$498.7)
to KES 69,702 (US$871.3) in 2030 under the GE2% scenario, compared to KES 39,721 (US$496.5) in 2012 and
KES 53,146 (US$664.3) in 2030 under the BAU2% scenario. The proportion of the population below the poverty line
under GE2% is expected to be about 2 percentage points lower on average between 2015 and 2030 than that of the
BAU2%.
Figure 3 Impacts on GDP growth under BAU, BAU2% and GE2% scenarios.
Source: UNEP, 2014.
In the agriculture sector (crop cultivation, livestock, fisheries and forestry), average agricultural yield under GE2% is
expected to exceed BAU2% by about 15 per cent in 2030 (Figure 4). In terms of crop production, a number of green
economy measures (such as water and land-use investments) will mitigate the impact of climate change on
productivity, promote more sustainable farming and boost crop yields relative to the BAU2% case, thus improving
nutrition and food security.
Policy simulations under different assumptions suggest that the same amount of investments allocated to the
agriculture sector in the BAU2% case would result in greater use of chemical fertilizers, which is projected to increase
yields in the short run. However, the increased use of chemical fertilizers is also projected to lower soil quality, which
reflects negatively on yield in the medium-and long-term. With green economy interventions, the use of chemical
fertilizers is phased out (or greatly complemented) by organic fertilizers and ecological agriculture practices (Figure

24
A2 in Annex 2). According to existing studies, the use of ecological practices in Africa yields great benefits in terms of
productivity and production, at least in the medium-term, by avoiding negative impacts on soil quality (Pretty, et al.,
2006).
Figure 4 Agricultural yield under BAU, BAU2% and GE2% scenarios.
Source: UNEP (2014)
In addition, the investments will improve Kenya’s overall performance on the Millennium Development Goals (MDGs).
The MDGs’ composite indicator is projected to improve to 0.78 in 2030 in the GE2% scenario, compared to 0.63
when there is no intervention (BAU), and 0.69 in the BAU2% scenario. Considering the social, economic and
environmental indicators included in the MDGs’ aggregate indicator calculation, the overall development of the
country is projected to perform better in the green economy scenario when compared to BAU (i.e. more progress
towards several goals). Annex Table 8 summarizes the main results of the analysis. Further, it is worth noting that the
analysis assumes effective implementation of all the investment simulated.
The economy-wide results indicate that green economy investments yield several positive impacts in the medium to
long-term period, across all sectors. However, in the short-run, the green economy investments may be associated
with adjustment costs so that the gain in GDP is not substantial compared to BAU. Green policies that are associated
with short-run changes in prices of final goods and services, costs of operations and technology choices may create
different welfare costs and benefits for different segments of the population (Porto, 2012). The outcome is also likely
to depend on the type and combination of green economy interventions or the policy package implemented. For
instance, increasing acreage under irrigation has a relatively stronger short run impact on national output than
afforestation and reforestation (e.g. it takes approximately eight years for a tree to grow); however, afforestation and

25
reforestation increases long-term potential output. This implies that, depending on the specific economic conditions
and resource endowments, prioritization of green economy interventions are likely to shape the outcomes.
Table 8 Main results of the quantitative scenario analysis in selected years
Time (year) 1990 2000 2010 2012 2015 2020 2025 2030
Real GDP growth rate, per cent (%)
BAU2% 4.04 4.38 6.15 4.96 4.80 4.65 4.41 4.04
BAU 4.04 4.44 6.14 4.54 3.83 3.78 3.59 3.41
GE2% 4.04 4.38 6.15 4.93 4.73 5.61 5.50 4.73
Real GDP factor cost, in billion KES/year
BAU2% 690.65 931.43 1 326.82 1 460.53 1 692.14 2 136.6 2 656.65 3 264.27
BAU 690.74 932.00 1 328.24 1 453.36 1 636.46 1 975.02 2 355.55 2 800.53
GE2% 690.65 931.43 1 326.82 1 459.98 1 686.82 2 195.99 2 857.49 3 640.32
CO2
emission, in million tonnes/year
BAU2% 7.339 8.749 11.24 12.49 14.69 18.60 22.83 26.71
BAU 7.340 8.754 11.25 12.44 14.29 17.47 20.81 23.74
GE2% 7.339 8.749 11.12 11.98 13.35 16.38 20.25 24.35
Real per capita G DP, KES/year/person
BAU2% 34 504 32 701 37 936 39 912 43 357 49 407 55 699 62 371
BAU 34 508 32 722 37 981 39 721 41 938 45 649 49 241 53 146
GE2% 34 504 32 701 37 936 39 897 43 221 50 778 59 930 69 702
Proportion of population below poverty line, per cent (%)
BAU2% 0.4666 0.4788 0.3782 0.3619 0.3333 0.2848 0.2349 0.1929
BAU 0.4665 0.4784 0.3777 0.3641 0.348 0.3212 0.294 0.2621
GE2% 0.4666 0.4788 0.3782 0.362 0.3343 0.2713 0.2033 0.1584
Overall MDGs performance (index)
BAU2% 0.4965 0.4547 0.5418 0.5513 0.5687 0.6101 0.6493 0.6881
BAU 0.4965 0.4548 0.542 0.5498 0.5588 0.5845 0.6077 0.6331
GE2% 0.4965 0.4547 0.5432 0.5565 0.5782 0.6309 0.7097 0.7773
Fossil fuel CO2
emissions, in million tonnes/year
BAU2% 7.339 8.749 11.24 12.49 14.69 18.60 22.83 26.71
BAU 7.340 8.754 11.25 12.44 14.29 17.47 20.81 23.74
GE2% 7.339 8.749 11.12 11.98 13.35 16.38 20.25 24.35
Crop average yield, tonnes/ha/year
BAU2% 2.55 2.39 2.788 2.826 2.963 3.094 3.234 3.406
BAU 2.552 2.395 2.797 2.825 2.922 2.996 2.997 3.161
GE2% 2.55 2.39 2.788 2.821 2.971 3.335 3.6 3.903
Source: UNEP (2014)

26
4. Discussion of policy-enabling conditions
This section provides an overview of the key policy issues that could be considered in supporting sectoral actions
outlined above. Most of the suggested policy interventions are taken from the ASDS (GoK, 2009) and the Medium-
Term Investment Plan (MTIP) 2010-2015 (GoK, 2010), an important current government policy strategy and its
investment plan guiding the development of the agriculture sector.
ASDS provided two strategic thrusts that will generate overall development and growth of the agriculture sector:
i) Increasing productivity, commercialization and competitiveness of agriculture commodities and enterprises;
and
ii) Developing and managing the key factors of production.
These thrusts will require critical inputs and support from enabling sectors and factors such as macro-economic
environment, security, infrastructure, education and social development. Furthermore, institutional reforms and better
coordination will be critical (GoK, 2009).
4.1 Policy and legal framework
The current policy environment is not fully supportive of private sector-led agricultural development. In Kenya,
multiple and complex laws and regulations have evolved in the agricultural sector. However, these laws and
regulations are not properly aligned for investment in a liberalized economic environment. Policy priorities should be
set to promote a competitive agriculture sector and develop diversified market outlets and products.
Another important area of intervention is the reform of regulatory institutions with dual mandates, i.e. the regulatory
mandate and the developmental mandate. The development mandate of these institutions could be “shed” to the
private sector, including famer apex organizations. Moreover, appropriate policies could be provided for the changed
role of government as a facilitator and regulator of agricultural activities.
Plant protection and quality assurance services are crucial in increasing productivity and reducing losses along the
production and trade chains, and in the promotion of exports. The prevalence of disease outbreaks and incidence of
major pests have limited the utilization of large portions of fertile land for agriculture, increased costs and losses and
prevented trade in plant products. Furthermore, the pollution of the environment, the misuse and adulteration of agro-
chemicals as well as seeds, are becoming a serious government and public concern.
The bodies that address these concerns are the Plant Protection Services, Kenya Plant Health Inspectorate Service
(KEPHIS), the Pesticides Control Products Board, the National Environment Management Authority (NEMA) and the
KBS. These agencies are expected to control plant pests and diseases, regulate and monitor aspects of plant health
services, license the use of agro-chemicals and undertake other quality assurance measures. Given the large
number of agencies, it is necessary to rationalize regulatory bodies in order to achieve economies of scale, improve
efficiency, quality and synergies, while minimizing overlapping and duplication. To achieve this, the laws that relate to
the delivery of plant protection services need to be reviewed and their enforcement enhanced.
4.2 Taxation system

27
Kenyan farmers face numerous direct and indirect taxes, which make agriculture less competitive internationally. The
central government and local authorities impose a wide range of taxes, levies, cesses and fees on farm produce,
forestry, farm inputs and services used by the sector. The impact of these measures distorts market prices, thus
making farm produce uncompetitive in domestic and international markets. Some taxes such as the local
government’s cess, create artificial barriers to the movement of goods and create a fertile ground for corruption.
It is therefore necessary to review all taxation laws and regulations to rationalize taxation systems in agriculture in
order to create a favorable climate for production and marketing of produce.
4.3 Increasing Productivity, Commercialization and Competitiveness
Kenya has the potential to achieve a largely market-led agricultural transformation despite unfavourable conditions
such as mostly rain-fed and highly diversified smallholder agriculture, high-cost agricultural input and output
marketing, volatile prices, inefficient land, labour and credit markets, and a vibrant but relatively low-capacity private
sector. Average yields of major commodities in Kenya are far below potential, with yield gaps ranging between 150
per cent and over 260 per cent. Proven yield-increasing technologies and practices exist, but they are seldom
adopted: when they are, it is at rates too slow for rapid productivity growth.
It is important to prioritize activities that reduce costs and enhance the benefits of uptake and utilization of improved
inputs and practices, aiming for self-sustaining processes and technological advancement. Activities that feature a
strategic combination of technical improvements with institutional innovations could be emphasized. In particular,
they could aim to build robustness into technologies through integrated systems, e.g. in pest control, soil and water
management, agroforestry, and crop-livestock interactions. Where necessary and feasible, physical infrastructure
could be developed or rehabilitated, including irrigation and water conservation structures in the ASALs. Support
could be given to promising management platforms that bundle together soil improvement, new crop and livestock
varieties, intensified input use, and farmer collective action in value chains. It is also worth backing institutional
innovations in input supply and post-harvest handling and processing, given their powerful impacts on farm
productivity and competitiveness.
4.4 Promoting Private Sector Participation in Agriculture
The scope for profitable value addition in Kenyan agriculture is severely limited by the large share of final prices
consumed by processing and marketing costs, due to the rudimentary product transformation technologies employed
by farmers and other value chain participants. Traditional methods of adding value are often time consuming and
labour-intensive, and mostly carried out manually, because small-scale actors do not have adequate capital to
mechanize. Further, the bulk of Kenya’s agricultural private sector is systematically excluded from formal financial
systems. Farmers, traders, and processors seldom possess the assets or records to qualify for bank loans. They
must also generate working capital from internal sources, greatly increasing their risk of exposure. Lack of micro-level
finance in Kenyan agriculture reflects a larger phenomenon of limited macro-level finance for the sector. Most
Kenyan banks structure their lending to agriculture in favour of high-value enterprises, typically targeting production
for export markets, such as coffee, tea and horticulture. This practice leaves the rest of the sector under-served.
The ASDS calls for privatization of state corporations dealing with agricultural production, processing and marketing.
Recent experience suggests that such divestment is necessary for improved private incentives in affected agricultural
sub-sectors, but it is generally not sufficient to draw significant private investment into areas in which such investment

28
has been lacking. Activities that equip agribusiness firms to overcome the wide range of physical, financial,
institutional, and human resource constraints on investment in agriculture, that are both privately profitable and
socially efficient, could be prioritized. Activities that raise returns to value addition in commodity supply chains are
especially critical, since scope for profitable value addition is the key determinant and reflection of agribusiness
development. Other crucial issues include enhancing improving access to finance and technology for input supply,
farm production, storage and assembly, processing, distribution, and wholesaling and retailing. Capacity
development for farmer organizations and private sector associations could be strengthened, including support for
feasibility studies, development of business plans, produce-price negotiations, marketing and market linkages and
policy engagement.
4.5 Promoting Sustainable Land and Natural Resources Management
Climate change is acting as a multiplier of existing threats to productivity growth and food security. Natural disasters
and extreme weather events including prolonged droughts, major floods and more frequent and intense storms,
increased land and water scarcity and reduced access to water, are impeding production. These new drivers of
vulnerability, combined with others, like food market instability, inhibit growth, thus rendering increasing numbers of
Kenyans susceptible to food insecurity, malnutrition and inequalities.
Kenya’s high-rainfall areas cover only 11 per cent of the country’s land area, but are home to 80 per cent of the
population. Such high population density has resulted in continuous cultivation, which, together with inadequate crop
and livestock husbandry, leads to loss of biodiversity and widespread land degradation, most notably soil nutrient
depletion and soil erosion. Under lax enforcement of land-use regulations, water catchment areas and wetlands are
being encroached upon and converted into agricultural land, leading to massive destruction of vegetative cover. In
many areas, river levels have fallen precipitously, seasonal streams have dried up, and fragile ecosystems have
been destroyed. In other areas, higher runoff rates have resulted in increased flooding and loss of valuable topsoil,
cutting sharply into productivity. Therefore, promotion of sustainable management of land and other agriculture-
related natural resources is a priority.
Although population density is lower in Kenya’s ecologically-fragile expansive arid and semi-arid lands, the agro
pastoralists and pastoralists living in these areas are threatened by a potent combination of more frequent prolonged
droughts and major floods, severely degraded soil, water and forage bases as well as declining productivity.
Promotion of diverse livelihood options and sustainable management of pastoral and other agriculture-related natural
resources should enhance resilience. This also requires improved management of flood and drought risks.
Throughout the country, where necessary and feasible, physical infrastructure to build resilience and promote
rehabilitation of degraded natural assets could be developed. Moreover, measures to enhance knowledge about the
impacts of climate change are needed, as they could lead to development and dissemination of context-specific
options for climate change adaptation.
4.6 Reforming Delivery of Agricultural Services
Sustained growth in agricultural productivity in Kenya depends on growth of appropriate technologies, cost effective
access by agriculturalists to such technologies and associated crop and natural resource management systems. In
addition, correct incentives for private actors to invest in development and delivery of these new technologies and
practices, and appropriate priorities for public sector provision, are needed. Hence, it is necessary to make Kenya’s

29
agricultural research system more relevant and responsive to farmer and trader demands. Technical and institutional
innovations that promote technology acquisition and exchange within the eastern and central Africa region could also
be strengthened. Efforts to facilitate private delivery of agricultural services could be supported, alongside more
effective and efficient public delivery, including continued reform of legal and regulatory regimes governing public
systems.
4.7 Ensuring Effective Coordination and Implementation
Kenya is implementing an inclusive and consultation-driven sector-wide approach to agricultural development,
coordinated by the Agricultural Sector Coordination Unit (ASCU), in order to exploit complementarities, eliminate
duplication of activities and reduce wastage. Kenya’s agricultural sector comprises the following sub-sectors: crops,
livestock, fisheries, land, water, cooperatives, environment, regional development and forestry. The sector also
includes the development of ASALs under the leadership of the Ministry for Development of Northern Kenya and
Other Arid Lands.
With the responsibilities of the agricultural sector currently spread over ten ministries, mentioned in detail above, and
the need for partnerships with several other ministries and stakeholders, implementation of ASDS and green
agriculture initiatives will require strong partnerships between the government, the private sector, development
partners and other non-state actors. Strong coordination mechanisms are fundamental and need to be established
and operational.

30
5. Conclusion
Despite having the largest economy in the EAC, and one of the most dynamic economies in Africa, Kenya is facing a
number of economic, social and environmental challenges. In recent years, the country has experienced fluctuating
economic growth, a low rate of industrialization and a deficit in the current external account. Socially, Kenya has an
elevated poverty rate, a number of inequalities and relatively high unemployment, particularly among youth.
Environmentally, the country is poised to overshoot its ecological capacity. It is depleting its natural resources and
ecosystems, which are indispensable to achieving sustainable development in the long run.
In response to these challenges, the country is actively seeking innovative solutions to stabilize its economy and
improve the well-being of its growing population. In 2014, a joint study by UNEP and the Government of Kenya
estimated that the country could boost its economy by as much as US$45 billion by 2030 if it follows a low carbon
green economy path. Its GHG emissions could potentially fall by up to 9 per cent by 2030 if the proposed green
economy measures are adopted, while Kenya's average agricultural yield could increase by 15 per cent from its
current baseline.
The government of Kenya has already implemented a suite of policies and programmes intended to further transform
the country to a green economy. A green economy can be a good paradigm to help the country address its pressing
challenges, while achieving multiple targets of rapid and stable economic growth, environmental protection, natural
resource conservation and social inclusion.
Given the importance of the agriculture sector as the driver of Kenya’s economy and as the livelihood for the majority
of its people, greening agriculture is regarded as essential for greening the economy as a whole for Kenya.
The macroeconomic modelling work for the simulation of different policy interventions under the BAU and GE
scenarios reveals that transformation to a green economy can bring a wide range of benefits to Kenya (UNEP, 2014).
Investment under the BAU scenario would generate increased yields in the short term, but at the same time augment
the use of chemical fertilizers. This would lower the soil quality and impact negatively on yields in the medium- and
long-term. In contrast to the BAU scenario, investment under the GE scenario would deliver more agricultural yields
than under the BAU scenario from a medium to long-run perspective.
The GE scenario demonstrates the benefits of scaling up efforts in agroforestry; sustainable water management,
such as rainwater harvesting for irrigation; education, training and capacity building, mainly in soil and water
management; and research and development. It can be envisioned that by supporting green agricultural practices,
such as organic farming, fish farming and post-harvest loss reduction, Kenya can enhance job creation, nutrition and
food security, and reduce inequalities and poverty.
Changing the agriculture sector into an innovative, commercialized and competitive sector is the strategic mission for
achieving the ASDS and the key to greening the agriculture sector. To realize this mission, it is important to
harmonize existing policies and create a new supportive policy framework, reform the taxation system to correct the
distortion of market prices, strengthen R&D of practical technologies and improve the provision of agricultural
services. In addition, sustainable management of land and other agriculture-related natural resources is the basis for
achieving the transformation of the agriculture sector.

31
References
Alila, P. O. and Atieno, R. (2006). Agricultural Policy in Kenya: Issues and Processes. A paper for the Future
Agricultures Consortium Workshop, Institute of Development Studies, 20-22 March 2006. Available at:
http://www.fao.org/fileadmin/user_upload/fsn/docs/Ag_policy_Kenya.pdf
Ellis, K., Lemma, A., Mutimba, S., Wanyoike, R. (2013). Low Carbon Competitiveness in Kenya. Available at:
http://www.odi.org/sites/odi.org.uk/files/odi-assets/publications-opinion-files/8593.pdf
FAO (Food and Agriculture Organization of the UN). (2010). Agricultural Policy Frameworks in Kenya. Food and
Agriculture Policy Decision Analysis. Available at: http://www.fao.org/fileadmin/templates/fapda/Kenya-
Policy_Report.pdf
Global Footprint Network. (2010). Ecological Footprint Atlas. (2010). Available at:
http://www.footprintnetwork.org/en/index.php/GFN/page/ecological_footprint_atlas_2010
GoK (Government of Kenya). (2004). Strategy for Revitalising Agriculture 2004-2014, Ministry of Agriculture and
Ministry of Livestock and fisheries Development, Nairobi.
GoK (Government of Kenya). (2007). Kenya Vision 2030. Nairobi. Nairobi: Government Printers. Available at:
http://www.vision2030.go.ke/cms/vds/Popular_Version.pdf
GoK (Government of Kenya). (2009). Agricultural Sector Development Strategy (ASDS). Available at:
http://www.kecosce.org/downloads/AGRICULTURE_SECTOR_DEVELOMENT_STRATEGY_2009_2025.pdf
GoK (Government of Kenya). (2010). Agricultural Sector Development Strategy-Medium-Term Investment Plan:
2010-2015. Available at: http://www.resakss.org/sites/default/files/blog/2011/08/kenya-medium-term-investment-plan-
2010-2015.pdf
GoK (Government of Kenya). (2011). Medium-Term Expenditure Framework 2011/12 – 2013/14, Report for the
Agriculture and Rural Development Sector. Nairobi: Government Printers. Available at:
https://www.google.co.ke/search?q=medium+term+expenditure+framework+agriculture+sector&oq=medium+term+e
xpenditure+framework+agriculture+sector&aqs=chrome..69i57.17861j0j8&sourceid=chrome&espv=210&es¬_sm=91
&ie=UTF-8
KIPPRA (Kenya Institute for Public Policy Research and Analysis). (2009). Kenya Economic Report 2009: Building a
Globally Competitive Economy. Nairobi: KIPPRA.
KIPPRA (Kenya Institute for Public Policy Research and Analysis). (2013). Kenya Economic Report 2013. Nairobi:
KIPPRA.
KIPPRA (Kenya Institute for Public Policy Research and Analysis). (2014). Green Economy Strategy and
Implementation Plan. Available at: http://www.kippra.org/News-and-Highlights/green-economy-strategy-and-
implementation-plan.html
KNBS (Kenya National Bureau of Statistics). (2013). Kenya Facts and Figures 2013. Available at:
http://www.knbs.or.ke/index.php?option=com_phocadownload&view=category&id=20&Itemid=1107

32
Kimenyi, M.S. and Kibe, J. (2014). Africa’s Powerhouse. Brookings Institution. Available at:
http://www.brookings.edu/research/opinions/2013/12/30-kenya-economy-kimenyi
OECD (The Organisation for Economic Co-operation and Development). Statistics. Available at:
http://www.oecd.org/statistics/
Porto, G. (2012). The Cost of Adjustment to Green Growth Policies Lessons from Trade Adjustment Costs, World
Bank Policy Research Working Paper 6237.
Pretty, J.N. et al. (2006). Resource-Conserving Agriculture Increases Yields in Developing Countries. Environmental
Science and Technology, 40 (4).
Rees, W.E. (2003). Economic Development and Environmental Protection: An Ecological Economics Perspective.
Environmental Monitoring and Assessment, 86, 29-4.
United Nations Development Programme (UNDP). Human Development Reports: Data. Available at:
http://hdr.undp.org/en/data
United Nations Environment Programme (UNEP). (2011). Towards a Green Economy: Pathways to Sustainable
Development and Poverty Eradication. Available at:
http://www.unep.org/greeneconomy/Portals/88/documents/ger/GER_synthesis_en.pdf
UNEP (United Nations Environment Programme). (2014). Green Economy Assessment Report: Kenya. Available at:
http://www.unep.org/greeneconomy/portals/88/documents/KenyaGEassessment.pdf
University of Oxford. Department of International Development. (2011). Country Briefing: Kenya – Multi-Dimensional
Poverty Index at a Glance. Available at: http://hdr.undp.org/external/mpi/Kenya-OPHI-CountryBrief-2011.pdf
World Bank. (2014). World Development Indicators. Available at http://data.worldbank.org/data-catalog/world-
development-indicators

33
Annex 1 Three spheres in the T21-Kenya model
Figure A1 Three spheres and their linkages in the T21 model
Source: UNEP (2014).

34
Annex 2 Modelling structure for green agriculture sector
Figure A2 Causal loop diagram for green economy effects of investment on agricultural production
Source: UNEP (2014)