Green-Co Forum Meet_Shindewadi_unit-2016.pdfGodrej Infotech Godrej Efacec Automation & Robotics...
77
1 Green-Co Forum Meet Abhay M Pendse 24 th Sept 2016
Transcript of Green-Co Forum Meet_Shindewadi_unit-2016.pdfGodrej Infotech Godrej Efacec Automation & Robotics...

1
Green-Co Forum Meet
Abhay M Pendse
24th Sept 2016
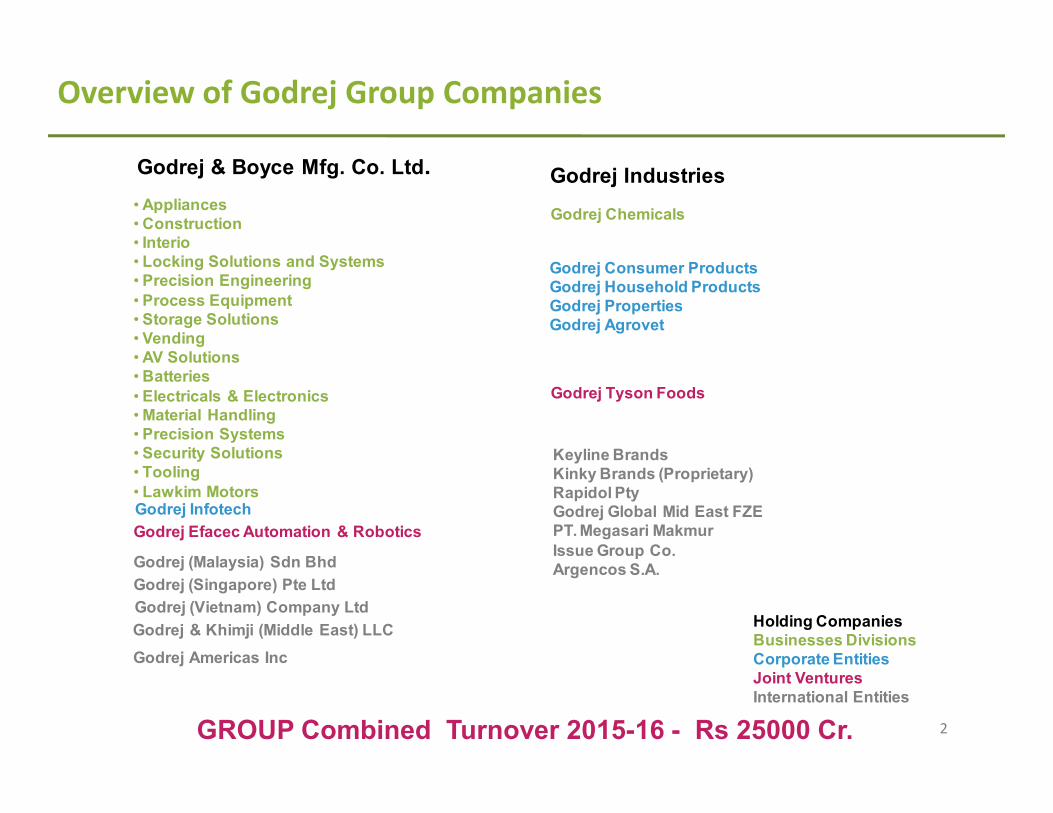
Overview of Godrej Group Companies
• Appliances
• Construction
• Interio
• Locking Solutions and Systems
• Precision Engineering
• Process Equipment
• Storage Solutions
• Vending
• AV Solutions
• Batteries
• Electricals & Electronics
• Material Handling
• Precision Systems
• Security Solutions
• Tooling
• Lawkim Motors Godrej Infotech
Godrej Efacec Automation & Robotics
Godrej (Malaysia) Sdn Bhd
Godrej (Singapore) Pte Ltd
Godrej (Vietnam) Company Ltd
Godrej & Khimji (Middle East) LLC
Godrej Consumer Products
Godrej Household Products
Godrej Properties
Godrej Agrovet
Godrej Chemicals
Godrej Tyson Foods
Keyline Brands
Kinky Brands (Proprietary)
Rapidol Pty
Godrej Global Mid East FZE
PT. Megasari Makmur
Issue Group Co.
Argencos S.A.
Holding Companies
Businesses Divisions
Corporate Entities
Joint Ventures
International Entities
Godrej & Boyce Mfg. Co. Ltd. Godrej Industries
Godrej Americas Inc
GROUP Combined Turnover 2015-16 - Rs 25000 Cr. 2
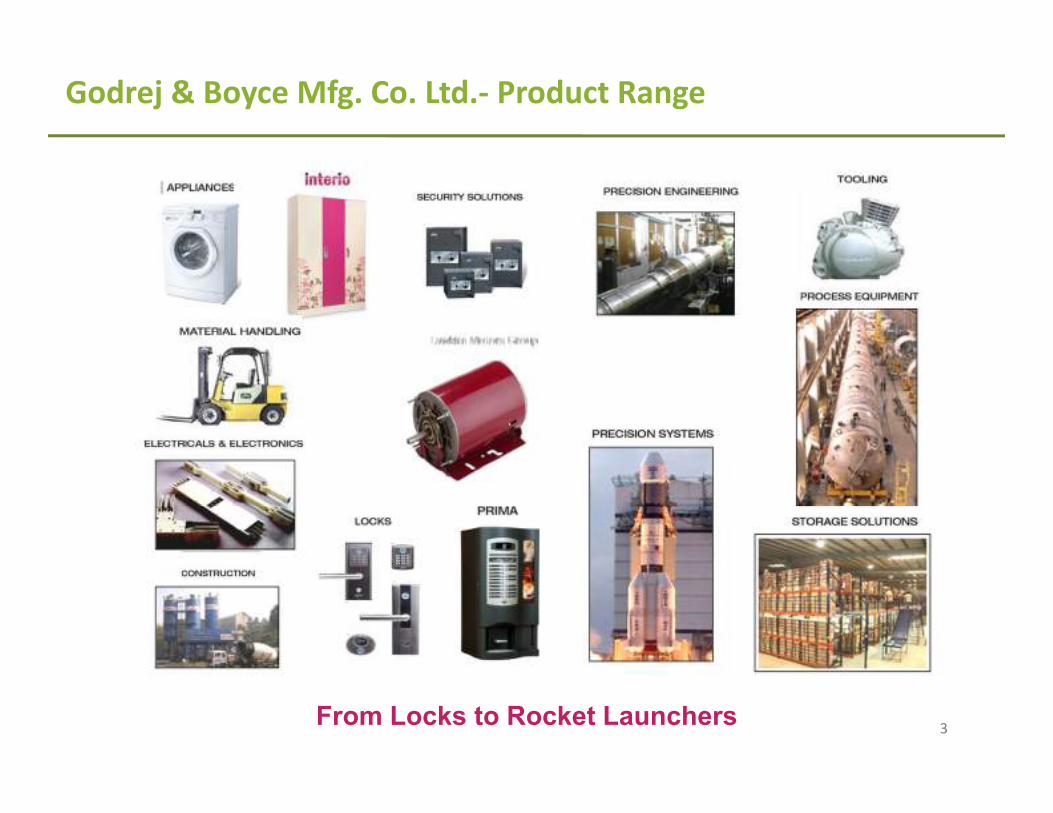
Godrej & Boyce Mfg. Co. Ltd.- Product Range
12
From Locks to Rocket Launchers3

4
Motors
Plant
Compressor
Plant
Afforestration
site, Palshi
Aerial View of
Plant Location
NH4 Highway
4

55
Photographs of the location at the time of setting up Plant
in Year - 1992
Context :-

6
Aerial View of
Factory
45 % Green
Cover6

Customers
• Godrej Appliance
• Emerson Climate
• Highly Electrical
Appliances Ltd.
• Tecumseh
Our Product Segments
Differentiators - Customized Solutions, YOY Value Addition,
Consistent Quality & Delivery
Hermetic Motors Industrial & Commercial Lam & Motor Components
1 φ
3 φ
72 % 13 % 12 %
Customers
• Cummins India
• In-Motion Us, USA
• Schabmueller, Germany
• Other small OEMs
• Inresol, Sweden
• Crompton India
Customers
• Remco, UK
• Gilbarco, India
• Panosonic India
• Hitachi India
• LG India
• Daikin India
• Other OEMs
1 phase –
11 %
3 ph -
Introducing3 %29 %Market
Share
Customers
• Private & Govt
across all
industries
• More than 1500
Customers
C & I Services
8 %
3 % % of Lawkim
Business
7

8
Our Approach towards Operational Excellence.
– Recognize challenge of Dynamic Business Environment
Profit
Safety Environment
Quality
Need Commitment, Patience, Perseverance

9
Our Approach – Adopted EFQM Business Excellence Model
Work on Enablers ���� Results Shall Follow
Benchmarking used for setting targets.

10
Godrej is Synonymous with Caring for the Environment
Our strong Corporate culture drives divisional goals & actions
Top Management Commitment – “Godrej Good & Green”
By 2020 Godrej aims to be

11
Top Management Commitment – Policy & Strategy
Decided to work on “CII-Cluster Program”
for Operational Excellence
0 1 2 3 4 5 6 7 8 9 10 11 12 13 14 15 16 17 18 19 20 21 22 23 24
1. Re-Training Knowledge Mgt
2. Training Modules Holding Gains
3. SOP for Sustenance
1. Cellular Manufacturing Through put time reduction
2. Low Cost automation Stress / fatigue reduction
3. Line Balancing Consistency in Qty & Quality
1. Q C / QA Online Inspection
2. SOP Creation & Adherence Zero Defects at each stage
3. Corrective actions & Preventive Action Reduction in In-process rejection
4. Poka-Yoke Zero Defects at Customer end
5. Calibration Cost of Poor Quality Reduction
1. Mapping of Inventory ZERO Non moving
2. Receipt , Storage , Handling & Control Container reduction and standardization
3. RACK reduction Forklift reduction / Elimination
4. FIFO ( First Produced First Out ) WIP reduction
5. SMED Change-over time reduction
1. Step 1 , 2 ,3 OEE Improvement
2. Greening The Production System Improved Environemnet Performace
1. Kaizen Employee Involvement
2. QCC + QC story Employee Satisfaction Score
3. 7 QC tools Participation Kaizen / QCC / CFT/SIT
1. Basic 5 S 5 S Score
2. Red Tag Campaign Zero red tag items
3. Safety Safety Frequency / Severity , No. of Accident free days
4. Waste Elimination Cost reduction
Time in Months : 0 1 2 3 4 5 6 7 8 9 10 11 12 13 14 15 16 17 18 19 20 21 22 23 24
Road Map for Competitiveness Godrej group of companies
Rev 1 : July 2011
Time in Months Deliverables
Sustenance
Management
TEI
5 S
ROAD MAP
Flow Manufacturing
Quality
Management
Inventory
Management ,
Material handling
& Control
TPM

CII-Cluster Program for “Operational Excellence”
0 1 2 3 4 5 6 7 8 9 10 11 12 13 14 15 16 17 18 19 20 21 22 23 24
1. Re-Training Knowledge Mgt
2. Training Modules Holding Gains
3. SOP for Sustenance
1. Cellular Manufacturing Through put time reduction
2. Low Cost automation Stress / fatigue reduction
3. Line Balancing Consistency in Qty & Quality
1. Q C / QA Online Inspection
2. SOP Creation & Adherence Zero Defects at each stage
3. Corrective actions & Preventive Action Reduction in In-process rejection
4. Poka-Yoke Zero Defects at Customer end
5. Calibration Cost of Poor Quality Reduction
1. Mapping of Inventory ZERO Non moving
2. Receipt , Storage , Handling & Control Container reduction and standardization
3. RACK reduction Forklift reduction / Elimination
4. FIFO ( First Produced First Out ) WIP reduction
5. SMED Change-over time reduction
1. Step 1 , 2 ,3 OEE Improvement
2. Greening The Production System Improved Environemnet Performace
1. Kaizen Employee Involvement
2. QCC + QC story Employee Satisfaction Score
3. 7 QC tools Participation Kaizen / QCC / CFT/SIT
1. Basic 5 S 5 S Score
2. Red Tag Campaign Zero red tag items
3. Safety Safety Frequency / Severity , No. of Accident free days
4. Waste Elimination Cost reduction
Time in Months : 0 1 2 3 4 5 6 7 8 9 10 11 12 13 14 15 16 17 18 19 20 21 22 23 24
Road Map for Competitiveness Godrej group of companies
Rev 1 : July 2011
Time in Months Deliverables
Sustenance
Management
TEI
5 S
ROAD MAP
Flow Manufacturing
Quality
Management
Inventory
Management ,
Material handling
& Control
TPM

Released 20K Sq. Feet Area
5S Implementation
5S – Theme – “Hospital Clean Inside – Garden Green Outside”

5S – Theme – “Hospital Clean Inside – Garden Green Outside”
Complete transformation of the Factory
5S Implementation

Implement Enablers to make work enjoyable –
Stress Free, Worry Free, Fear Free Environment
People Initiatives – TEI - Total Employee Involvement
0 1 2 3 4 5 6 7 8 9 10 11 12 13 14 15 16 17 18 19 20 21 22 23 24
1. Re-Training Knowledge Mgt
2. Training Modules Holding Gains
3. SOP for Sustenance
1. Cellular Manufacturing Through put time reduction
2. Low Cost automation Stress / fatigue reduction
3. Line Balancing Consistency in Qty & Quality
1. Q C / QA Online Inspection
2. SOP Creation & Adherence Zero Defects at each stage
3. Corrective actions & Preventive Action Reduction in In-process rejection
4. Poka-Yoke Zero Defects at Customer end
5. Calibration Cost of Poor Quality Reduction
1. Mapping of Inventory ZERO Non moving
2. Receipt , Storage , Handling & Control Container reduction and standardization
3. RACK reduction Forklift reduction / Elimination
4. FIFO ( First Produced First Out ) WIP reduction
5. SMED Change-over time reduction
1. Step 1 , 2 ,3 OEE Improvement
2. Greening The Production System Improved Environemnet Performace
1. Kaizen Employee Involvement
2. QCC + QC story Employee Satisfaction Score
3. 7 QC tools Participation Kaizen / QCC / CFT/SIT
1. Basic 5 S 5 S Score
2. Red Tag Campaign Zero red tag items
3. Safety Safety Frequency / Severity , No. of Accident free days
4. Waste Elimination Cost reduction
Time in Months : 0 1 2 3 4 5 6 7 8 9 10 11 12 13 14 15 16 17 18 19 20 21 22 23 24
Road Map for Competitiveness Godrej group of companies
Rev 1 : July 2011
Time in Months Deliverables
Sustenance
Management
TEI
5 S
ROAD MAP
Flow Manufacturing
Quality
Management
Inventory
Management ,
Material handling
& Control
TPM

Total Employee Involvement (TEI) – “Factory within Factory”
Road 21 20
20
Tool 9
11 Die Cast M/c 12
1
Utility 4
20
13 21
Road 21
C 4 -10 PS
Press Shop 6
Toilet 13
Fork Lift7 Lock 13
Lock 13
H W 9
Canteen 13
Incoming QA 8
Ma
inte
na
nce
7
GPM 15
Annealing 11
4
21
S DOG Room 20Generator
4
Garden 21
Co
il S
tora
ge
Are
a
1
Elect
Sub Station 4
Open spaceCanteen 13
Lobby 1313
Road 21Garden 21
Canteen
(Bambu) 13
DO
CK
14
Metric Assembly Line 18 QA 8
Office 18
7
Toilet 13 PKG Store 14 Powder Coating 17
Die Casting 12 Die Casting 22
Ca
rpe
nta
ry 1 Empty Space 18
Doc
k 1N2 & H2 11
Pump House 7
Sto
res
14
Co
mp
Ro
om
7
Shift
Parking
20Danaher 15 CR winding 9
KCJ winding
15
A line for S model 16
Tooling 3
PS - Stator Super Market 10 Super Market 17Pre Machining
17
Vasrnish 9
Fabricatio
n 4
2Weld 10 Yahotech 16
Loading/Unloading 19GPM / HVAC Assembly Line 18
14
Kce Winding 15
HSD
Storage4
Annealing 11
Visitors Parking
20 25
Wa
ste
Ma
na
ge
me
nt
1
Press Shop 5
Road 21Locker room
20
Ga
rde
n 2
1
Garden 21
Coil Storage 1Garden 21
Mech Presses
Parking 20 Two Wheeler Parking 20 Bus/Car Parking 20
Ga
rde
n 2
1
FG Store 19
Ga
rde
n 2
1
Store 14
Weighing M/c 19
Decentralisation – Cell Concept
CFT Projects
Break-though Projects
Kaizen / Suggestion
Scheme
6 Sigma Projects

CII-Cluster Program for Operational Excellence
0 1 2 3 4 5 6 7 8 9 10 11 12 13 14 15 16 17 18 19 20 21 22 23 24
1. Re-Training Knowledge Mgt
2. Training Modules Holding Gains
3. SOP for Sustenance
1. Cellular Manufacturing Through put time reduction
2. Low Cost automation Stress / fatigue reduction
3. Line Balancing Consistency in Qty & Quality
1. Q C / QA Online Inspection
2. SOP Creation & Adherence Zero Defects at each stage
3. Corrective actions & Preventive Action Reduction in In-process rejection
4. Poka-Yoke Zero Defects at Customer end
5. Calibration Cost of Poor Quality Reduction
1. Mapping of Inventory ZERO Non moving
2. Receipt , Storage , Handling & Control Container reduction and standardization
3. RACK reduction Forklift reduction / Elimination
4. FIFO ( First Produced First Out ) WIP reduction
5. SMED Change-over time reduction
1. Step 1 , 2 ,3 OEE Improvement
2. Greening The Production System Improved Environemnet Performace
1. Kaizen Employee Involvement
2. QCC + QC story Employee Satisfaction Score
3. 7 QC tools Participation Kaizen / QCC / CFT/SIT
1. Basic 5 S 5 S Score
2. Red Tag Campaign Zero red tag items
3. Safety Safety Frequency / Severity , No. of Accident free days
4. Waste Elimination Cost reduction
Time in Months : 0 1 2 3 4 5 6 7 8 9 10 11 12 13 14 15 16 17 18 19 20 21 22 23 24
Road Map for Competitiveness Godrej group of companies
Rev 1 : July 2011
Time in Months Deliverables
Sustenance
Management
TEI
5 S
ROAD MAP
Flow Manufacturing
Quality
Management
Inventory
Management ,
Material handling
& Control
TPM
Adopted “GreenCo Rating System”

19Anything which is measured gets improved.
Adopted “GreenCo Rating System”
• Energy Efficiency
• Water Conservation
• Renewable Energy
• Green House Emission
• Waste Management
• Material Conservation
• Green Supply Chain
• Product Stewardship
• Life Cycle Assessment
• Other Areas
Green Company
Rating System

Energy Efficiency
20

21
Detailed Data Collection....
Periodically Load mangers installed to measure, variation in power consumption, w. r. t.,
a) Across time,
b) Cycle to cycle,
c) During changeover’s.
d) During start up & shut down, etc.
Also Measure,
# Volumetric efficiency of air compressor,
# Air leakages in the system.
# HSD consumed per kw-hr of power generated.
Periodic variance analysis and corrective action taken

22
Representative Electricity Distribution / Measurement System
HT
DGTR
41 2 3
21
M
1
M M
M
2
HT Incoming
LT Transformer
Shop wise Meters
Shop wise Distribution
Sub Distribution
Cell wise Meter
Power for Machine
M M M M
-------------------------------------------------------------
-------------------------------------------------------------
-------------------------------------------------------------
-------------------------------------------------------------
-------------------------------------------------------------
-------------------------------------------------------------
-------------------------------------------------------------
-------------------------------------------------------------This data gave us readings between two measurement Intervals

23
Development of solution – “Opportunity Matrix”
Can this be
eliminated
Alternate
process ?
Reduce
consumption
Increase
efficicency
New
technology
Use of
renewable
energy
Reduce
Variation
Use of
Exhaust
Energy
Presses
Air Compressor
Heating Furnaces
Al. Melting Furnaces
Welding Machines
Water Heating
Air Condtioning
Hydraulic Power Pack
Machines
Plant Lighting
Our Products
Source of consumption
Levers Used
Appropriate levers applied to develop the solution

24Enabled Improve – Standard Time & Reduce Lead-Time
Elimination - Processes
“1S”of Processes

Machine with Hydraulic power pack Machine with ball screw & motor
Electrical consumption reduced up to 45 % per piece.
Pay back period < 7 months
Total Machines modified in 2013 – 14 = 13 nos.
Total Machined modified in 2014 – 15 = 11 nos.
Eliminate – Hydraulic Power Packs
“1S”of Machine Parts
AfterBefore

Reduce Consumption, Increase Efficiency – Compressed Air
Air R
eceiv
er
Winding shopLow pressure –
72 points
High pressure-
07 points
Press shopLow pressure – 80
points
High pressure- 14
points
Machine shopLow pressure – 45
points
High pressure- 10
points
• Mapping of all machines , lines for pressure requirement done.
Pressure Line Mapping & Isolation

Main Air Line
Pressure- 5 Bar
Air pressure regulator
O/P Pressure- 4 Bar
Low pressure lines
Air Booster regulator
O/P Pressure- 5 Bar
Machine requires High pressure
• Consumption reduced by 170 units per day.
Consumption reduced by 6.5 % of total compressed air consumption.
Reduce Consumption, Increase Efficiency – Compressed Air
Pressure Line Mapping & Isolation
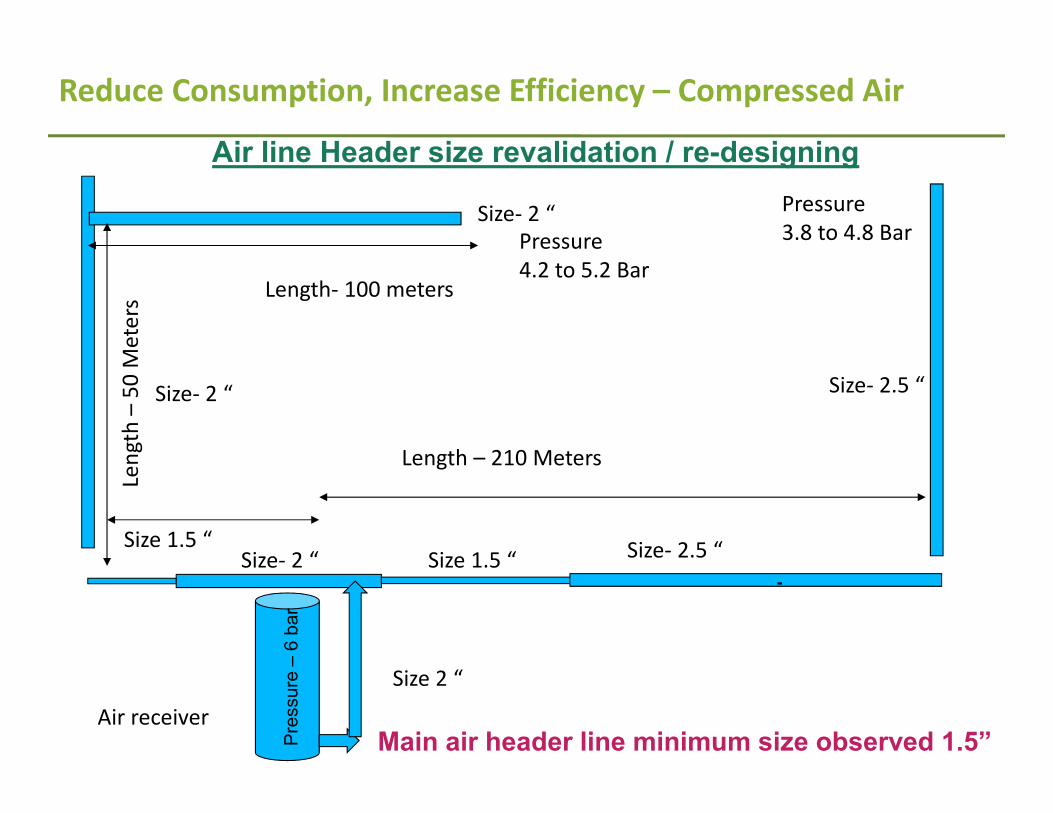
Air line Header size revalidation / re-designing
Size 2 “
Size 1.5 “Size- 2 “Size 1.5 “ Size- 2.5 “
Size- 2.5 “Size- 2 “
Size- 2 “
Length – 210 Meters
Len
gth
–5
0 M
ete
rs
Length- 100 metersP
ressure
–6 b
ar
Pressure
3.8 to 4.8 BarPressure
4.2 to 5.2 Bar
Main air header line minimum size observed 1.5” Air receiver
Reduce Consumption, Increase Efficiency – Compressed Air

Length – 250 meters
Air
pre
ssu
re –
6 b
ar
Allowing max. pressure drop- 0.5 bar
Air
pre
ssu
re-
5.5
ba
r
For maintaining drop of 0.5 bar & for distance of 250 meters
We require header line size of 4 “ size minimum.
Air receiver
End machine
Air line Header size revalidation / re-designing
Reduce Consumption, Increase Efficiency – Compressed Air

Size 2 “
Size 6 “Size 6 “
Size- 6 “Size- 6 “
Size- 6 “
Length – 210 Meters
Len
gth
–5
0 M
ete
rs
Length- 100 metersP
ressure
–5.4
bar
Pressure
4.9 to 5.1 barPressure
5.0 to 5.2 Bar
Air Receiver
Air line Header size revalidation / re-designing
Reduce Consumption, Increase Efficiency – Compressed Air

Savings achieved up to 300 units per day.
Savings achieved by 11.3 % to that of total compressed air consumption
Main air header line size changed to 6 ‘‘
Air line Header size revalidation / re-designing
Reduce Consumption, Increase Efficiency – Compressed Air

Savings achieved up to 250 units per day.
VFD Installation to Air-Compressors
Reduce Consumption, Increase Efficiency – Compressed Air

Overall Air compressor Utilization
C1 C2 C1 C2 C1 C2
5.5 bar
6.0 bar
6.0 bar
6.3 bar5.2 bar
5.5 bar5.3 bar
5.7 bar
5.3 bar
5.7 bar
5.0 bar
VFD
6.0
Ba
r
5.5
Ba
r
5.2
ba
r
Air receiver Air receiver Air receiver
Header line change VFD installed
Pressure
Transducer
Reduce Consumption, Increase Efficiency – Compressed Air

2930
2700
2400
2107
0
500
1000
1500
2000
2500
3000
3500
Compressor consumption
Air compressor in units
Over all achievement- compressor consumption reduced from
11.7 % to 6.9 % to that of total electricity consumption.
Reduce Consumption, Increase Efficiency – Compressed Air
Result – Compressed Air Conservation
March-14 March-15 March-15

Various idea generation -
Exiting Design Idea Generation
Increase Efficiency – Annealing Furnace

36
Tray Weight is 50 Kg Instead of 130 Kg.
Per Furnace capacity improvement = 4.55 MT / Day ( 19 % )
Per furnace annual cost savings ~ Rs. 15 Lacs
Increase Efficiency – Annealing Furnace

LDO fired furnace Electrical furnace
with insulation
Door Interlocked with M/c Cycle
2010 – 11
2013 – 14
2014- 15
Savings achieved up to 600 units per day in 4 furnaces
Total Al melting consumption reduction by 20 %
Increase Efficiency – Aluminium Melting Furnace

Renewable Energy
38

Solar Roof Top System- 250 KWp Capacity
Additional 500KW Capacity Solar Roof-Top Project is sanctioned
and is in Installation stage. (32% of Consumption)
Renewable Energy – Solar Roof Top Project

Implemented for
���� Varnishing Process,
���� Powder Coating process
Annual potential savings of Rs. 14.7 Lacs.
Replaced 200KW Ovens
Renewable Energy – Biomass Fired Hot-Air System

Solar Concentrator 5KW Capacity
���� Power is fed to the Grid.
���� Hot water is fed to the Boiler as preheated water
Renewable Energy – Solar Concentrator

Water Conservation
42

43
Rain Water Harvesting
Main pond
capacity -
55 Lac litres
Total capacity of all ponds = 90 Lac litres

44
Water Harvesting in Govt. Plot – Capacity- 25 Lac litre
Created trench Created check dams – 2 nos
Rain Water Harvesting - Beyond Fence
“Jalyukta Shivar Abhiyan” at Nearby Villages

45
Capacity Building – Technology absorption
One Village adopted by us for implementation of these concepts in
Year 2016 – 17.
Green House Gas Emission
46

47
Replacement of low Efficiency boilers with high efficiency boiler.
Old Boilers - Capacity 100 Kg / Hr , Efficiency – 31 – 35 % = 3 nos.
New Boiler – Capacity 300 Kg / Hr, Efficiency - 90 – 92 % = 1 nos.
Scope 1 – Diesel consumption - Boiler
Old Boiler New Boiler

Scope 1 – Replacement of LDO fired AL Melting Furnace
LDO Fired Baffco Furnace Electrical Fired AL melting Furnace
Total 6 LDO fired Al melting furnaces converted into Electrical
fired in last 3 years.48

Carbon Neutral Approach
In Lat 3 Years Total Plantation is 1,20,384 nos.
GOAL – Creating a microclimate to raise ground-water levels
by planting 500000 hardy, drought-resistant trees native to the
region by 2020.
AREA COVERED UNDER PLANTATION
o Planned : 80 Hectares
o Actual :72 hectares
49

Waste Management
50

51
Even punching scrap is handled as single piece – Scrap on Wheel
On line ‘Punching Scrap’ collection conveyor made in-house
Before After
Implemented Concept – “Scrap On Wheel”

52
70 % of Waste Management area
now converted to Car-Parking
Created simple visual codes to
indicate when to call vehicle for
disposal, Escalate the matter etc..
AfterBefore
Implemented Concept – “Scrap On Wheel”

Treated water (As per MPCB Consent) further passed
through Bio-Degradable Beds Before aeration:-
Worked with Pune Bremen Society ( Germen Technology ) for “Bio –
filtration” of water 53
Examples of Liquid waste Management

54
Bamboo floats for waste water further treatment
Examples of Liquid waste Management

“Paryavran Gaurav Puraskar- Jun 2013”
By
Maharashtra Pollution Control Board
Recognition for Liquid waste Management
External recognitions at State
Level for the plant

Material Conservation,
Recycling & Recyclability
56

• Rack Free
• Pallet Free
• No Forklift for Material Shifting
• Lean Containers
• Zero Stock in Scrap Yard
• Practice of SMED for Bottleneck Machines
• No receipt Area
57
Tools Adopted for Inventory Reduction in-turn Material
Conservation

58
Variety of Containers Removed From Shops for Material Handling
Container Mapping & Reduction

Rack Mapping & Reduction
59

60
Elimination of central store concept &
storage near usage point
Minimum Transshipment, Transport & Storage Points

61
Eliminated more than 300 Trolleys from the system & non moving items
releasing cash worth Rs 2 Cr.
BENEFITS :- Removed Buffer Equipment

62
Eliminated 4 nos. forklifts Out of 7 nos.
BENEFITS :- Removed Buffer Equipment
7 Nos.
3 Nos.

Product Stewardship
63

64
• Capability to handle efficiently various motor design
software's enabling design prediction within +/- 3%.
• Indigenously developed motors with electronic
commutation.
Technological & Infrastructural Leadership – Design
YOY we have improved hermetic motor efficiency from 70 % to 90 %
& Reduced the BOM Cost for customer up to 20%
•In-house developed software for designing winding
tools, as per given lamination profile. This capability
enabled Lawkim to be considered as design partner in
Statomat-Lawkim Joint Venture (1998 till 2008)
Design Capability at-par with those at GE / Emerson Design Centers.
1995 to 2009
Efficiency 70%
2010
Efficiency 80%
2012-13
Efficiency 85%
2013-14
Efficiency 86 %
2014-15
Efficiency 90% +

65
Extended Producer Responsibility
81% Packing is recycled
Life Cycle Assessment
66

LCA for Product
67
75% Products (Hermetic) are covered.

68
Environment Impact Reduction Initiatives based on LCA
Projects to reduce energy impact during use phase.
1. Efficiency of motor improved from 66% to 86%
during 2010-2015
2. Efficiency of motor to be improved from 86% to
90%+. In progress since 2016.
Projects to reduce energy
impact during
manufacturing stage.
1. Rotor steam bluing.
2. Casting process from
LDO to electric.
3. Centrifugal die-casting in
progress.
4. Evaporating punching
oil.
5. Double row tool to
reduce scrap.
6. Welding to stitching.
7. Logistics – Localization of
steel + Copper &
Aluminum.
8. Turning Eliminated
9. PCE Eliminated

Others
69

Piano type Roof Structure
Less heat load from roof & enhanced Natural Light in day time.

Innovation – “Flow Manufacturing”
Innovative use for In-house manufacturer of
Automated Guided Vehicle, Applied for Patent.
Alternative to forklift- Automated Guided Vehicle

Innovation - Bamboo Cycle
Use of Bamboo for structural material
to reduce carbon foot print
of making steel structure.
Completed Expedition from
Kanyakumari to Khardung la

73
Awareness creation about environment – Through Students

74
Other Unique Initiatives :-
Unique industry academia partnership since 1992

75
Biodiversity at Premises at NGCPR :-
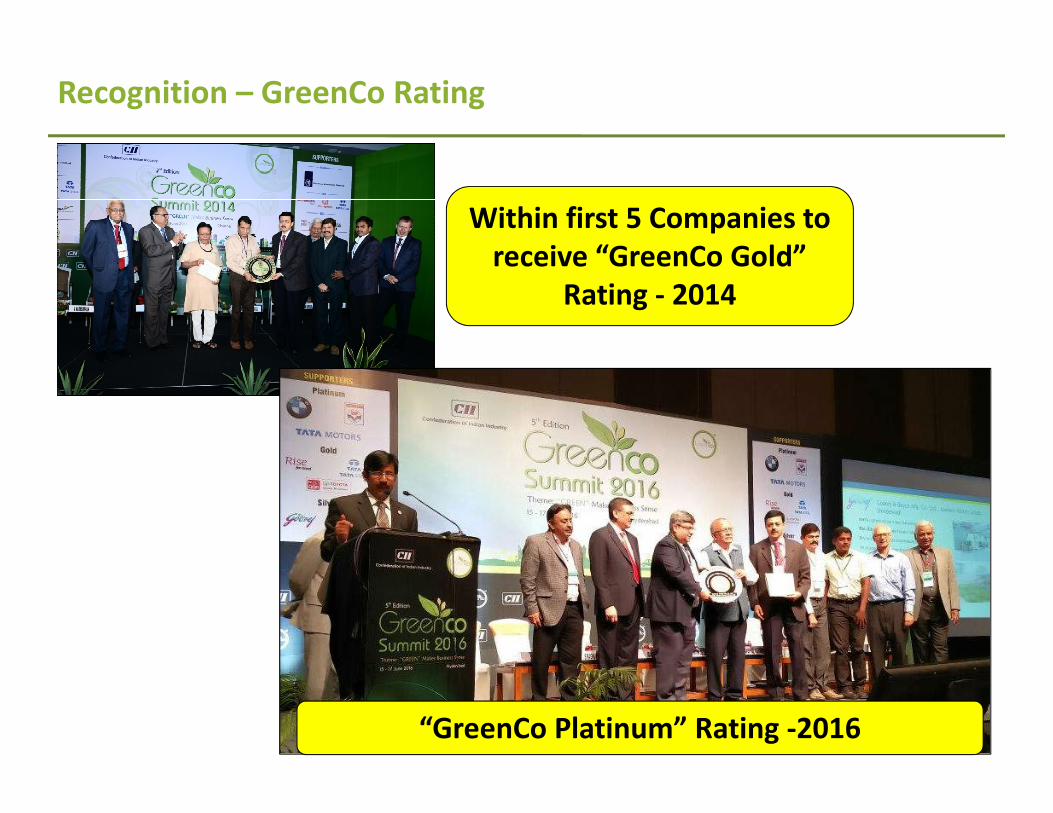
Recognition – GreenCo Rating
“GreenCo Platinum” Rating -2016
Within first 5 Companies to
receive “GreenCo Gold”
Rating - 2014

Way Forward :-
� Engage with Supply-Chain
� Continuous Capacity building programs
� Sustenance Management
Modern Plant
Practices
Greening the
Production
System