Green Buildings Market Intelligence India Country Profile
16
GREEN BUILDINGS MARKET INTELLIGENCE INDIA COUNTRY PROFILE
Transcript of Green Buildings Market Intelligence India Country Profile

GREEN BUILDINGS MARKET INTELLIGENCE
INDIA COUNTRY PROFILE

INDIA: COUNTRY SUMMARY
2
MARKET STATUS▪ Strong growth projected in the construction industry with focus on
industry, residential and transport. ▪ 70% of buildings needed by 2030 yet to be constructed.▪ Significant potential in residential construction with ‘Housing For
All’ program requiring 20 million urban and 10 million rural homes.
OTHER FACTORS
▪ Real GDP growth expectations average 7.8% a year for 2018-2023.
▪ Pick-up in private consumption and gross fixed investment from 2018 as banks' balance sheets improve.
▪ Rapid urban growth with special initiatives for developing affordable housing.
▪ Push towards scaling up green bond issuances against backdrop of rapid urban growth with encouraged private sector participation.
▪ Stress on phasing out subsidies and government intervention to encourage private sector participation.
GREEN BUILDING PROGRAMS▪ GRIHA: Indigenous rating system to
promote and certify green buildings
▪ India Green Building Council: Implements certification services and training programs
▪ LEED: Partnerships with local developers like Tata Housing, etc. to provide certifications.
▪ IFC organizes the Sustainable Housing Leadership Consortium and promotes EDGE.
CLIMATE POLICIES (NDCS)▪ Government push to have 200 million sq. meters of green certified
buildings by 2022. ▪ States beginning to build awareness and provide tax incentives and
subsidies to encourage investment in green buildings.
▪ Country wide green building policies have existed for many years but
rate of adoption has been slow due to lack of a level playing field.
Sources: EIU Country Reports: India, Global Building Information Gateway, Climate Investment Opportunity South Asia, Global Building Stock Database
MARKET GROWTH
0%
10%
20%
-
5,000
10,000
2018 2019 2020 2021 2022 2023 2024 2025
Building Stock (million m2)
Residential Office & Retail Other Commercial % new green buildings
Market through 2025 Total market Green market
Commercial USD 91 B USD 11 B
Residential USD 455 B USD 28 B
Residential units 13,000,000 810,000

Single-Family
Detached, 246
Multi-Unit Residential
, 209
Residential, 456
Commercial, 91 Office, 15
Retail, 17
Education, 17
Healthcare, 2
Hotels & Restaurants
, 23
Institutional/As…
Transport, 1
3
STRONG GROWTH PROJECTED IN ALL SECTORS WITH RESIDENTIAL AS A KEY GROWTH DRIVER
● India is at the threshold of a commercial and residential construction boom.
● 700 million sq. meters of commercial building space built over the last 10 years with 40% of the building stock that will exist in India by 2037 yet to be built.
● Government’s ‘Housing for All by 2022’ program can act as a catalyst to propel growth in residential building.
● Net Profit Margins in Real Estate higher than total Indian market: Real Estate (D) 15%, (G) 25%, and (O) 30%, Construction 7% after tax and adjusting for lease.
Sources: Niti Aayog, Government. of India, Global Building Information Gateway, Global Building Stock Database
1% 3% 5% 7% 9%
Total
Residential
Multi-Unit Residential
Single-Family Detached
Commercial
Transport
Warehouse
Institutional
Hotels & Restaurants
Healthcare
Education
Retail
Office
TOTAL MARKET SIZE, 2025 (USD BILLIONS)
MARKET GROWTH BY SUB-SECTOR (CAGR)

RAPID PROMISING GROWTH IN INDIAN GREEN MARKET
4
Green building construction is spread throughout the country but more prevalent around large Metros like New Delhi, Mumbai, Bangalore and Chennai.
Notable Green Projects include:o Hotels:
• Fairfield by Marriott• ITC Rajputana Sheraton Hotel
o Offices:• Quasitum Intelisoft India Pvt. Ltd.• Infinity Benchmark, Kolkata
o Residential:• Kolkata West International City• VBHC Bangalore
Total activity count is increasing per year.
Sources: Global Building Information Gateway.
784 Activities
0
100
200
300
400
500
600
700
20
04
20
05
20
06
20
07
20
08
20
09
20
10
20
11
20
12
20
13
20
14
20
15
20
16
Act
ivit
y C
ou
nt
Year
Data available through GBIG
+
IGBC
5.30 Billion Sq Ft of registered green
buildings
Project-level data notavailable
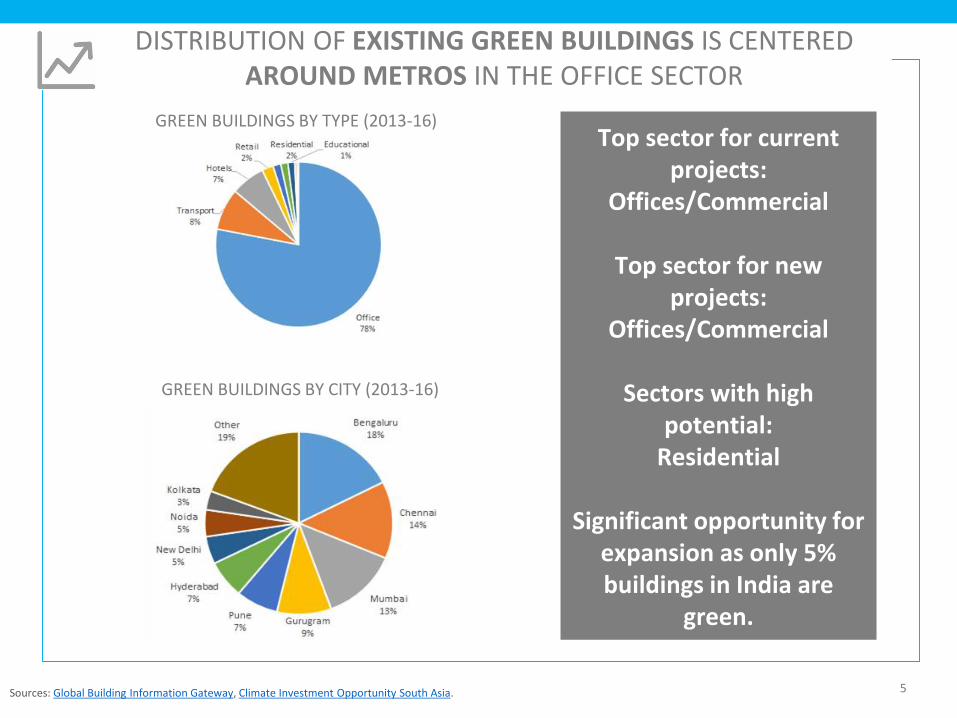
5
Top sector for current projects:
Offices/Commercial
Top sector for new projects:
Offices/Commercial
Sectors with high potential:
Residential
Significant opportunity for expansion as only 5% buildings in India are
green.
DISTRIBUTION OF EXISTING GREEN BUILDINGS IS CENTERED AROUND METROS IN THE OFFICE SECTOR
GREEN BUILDINGS BY TYPE (2013-16)
GREEN BUILDINGS BY CITY (2013-16)
Sources: Global Building Information Gateway, Climate Investment Opportunity South Asia.
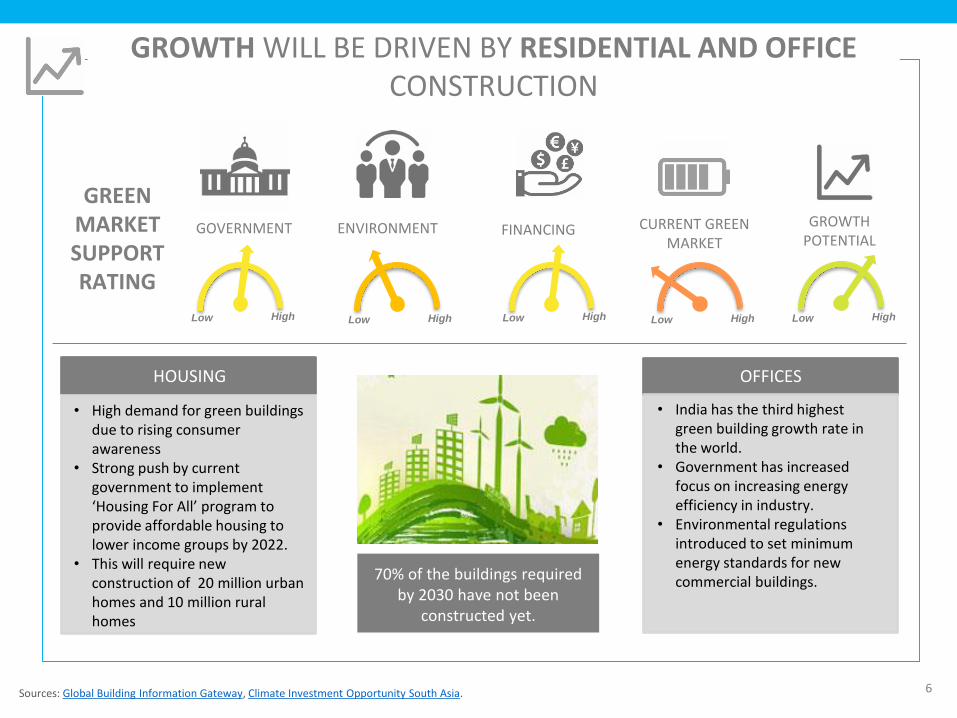
6
GROWTH WILL BE DRIVEN BY RESIDENTIAL AND OFFICE CONSTRUCTION
Low High
GREEN MARKET SUPPORTRATING
ENVIRONMENT FINANCING CURRENT GREENMARKET
GROWTHPOTENTIAL
GOVERNMENT
Low HighLow High Low HighLow High
Sources: Global Building Information Gateway, Climate Investment Opportunity South Asia.
70% of the buildings required by 2030 have not been
constructed yet.
• High demand for green buildings due to rising consumer awareness
• Strong push by current government to implement ‘Housing For All’ program to provide affordable housing to lower income groups by 2022.
• This will require new construction of 20 million urban homes and 10 million rural homes
HOUSING
• India has the third highest green building growth rate in the world.
• Government has increased focus on increasing energy efficiency in industry.
• Environmental regulations introduced to set minimum energy standards for new commercial buildings.
OFFICES

7
▪ Shortage of 20-70m units -housing 370m people.
▪ Housing market forecast to grow over $100 billion by 2017.
▪ 40% households have monthly income from Rs. 5,000 – Rs. 11,000 but no access to housing finance and home-ownership (20-25% of income for rent).
▪ Mounting congestion costs: More than 10m people in 5 cities, and over 1m in 52 cities.
URBAN HOUSING SHORTAGE RURAL HOUSING SHORTAGE
Factors taken for assessing housing shortagesUrban Housing
Shortage (million)
Rural Housing Shortage (million)
No. of nondurable houses 3 10
Shortage due to congestion 15.09 10.86
Shortage due to obsolescence 2.84 7.18
Homeless population 0.94 0.83
Total 21.87 28.87
Rural demand estimates 2X urban needs but rural is less attractive target for private sector developers in current environment.
HOUSING SHORTAGE IS LARGE AND HIGHLIGHTS THE NEED FOR AFFORDABLE HOUSING
Sources: Urban Housing Shortage (2012-17) Report of the Ministry of Housing & Urban Poverty Alleviation, Working Group Report on Rural Housing for 12th Five Year Plan (2012-17), Tewari and Rao, ADB, 2016.
Below Poverty Line (BPL), 39.3,
90%
Above Poverty Line (APL), 4.37,
10%
Economically Weaker Sections
(EWS), 10.55, 56%
Lower Income Group
(LIG), 7.41, 40%
Middle Income Group (MIG),
0.82, 4%
18.78 million
43.67 million

8
SUSTAINABLE HOUSING LEADERSHIP CONSORTIUMIS LEADING THE WAY ON GREEN HOUSING
• Commitment to make green homes mainstream.• Convened by IFC under the EU’s Eco-cities program.
Members include:
Sources: Eco-cities in India

GREEN FINANCE PROVIDES MASSIVEINVESTMENT OPPORTUNITY
9
● IFC estimates investment opportunity of $1.4T
in green buildings, with $1.25T in the
residential and $228 billion in the commercial
sector.
● Green Bonds: Key tool for Climate finance;
India has $3 billion Green Bond market as of
2016, 7th largest in the world.
● PNB Housing Finance, raised INR 5Bn from IFC,
becoming first Indian housing finance
company to issue green bonds.
● High current cost of borrowing: Indian
companies borrow at 220 basis points higher
than China.
Sources: PNB Housing, Economic Times, Bonds and Climate Change 2016: India Edition, Climate Investment Opportunity South Asia.
Only 14% of total green bond
financing in India utilized
towards low carbon buildings,
leaving significant untapped
potential.
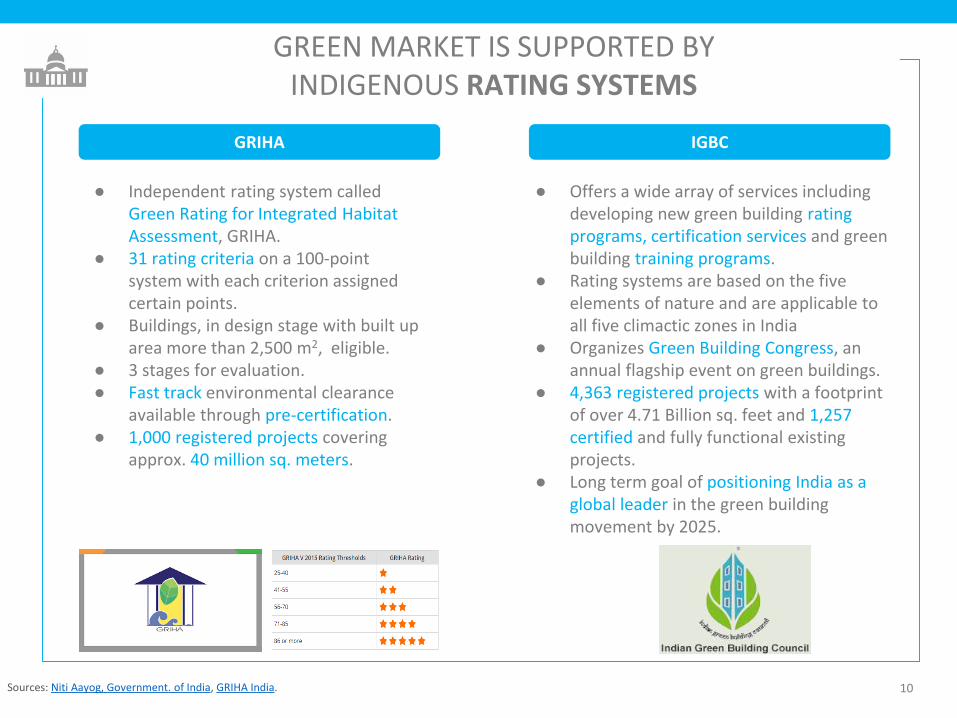
GREEN MARKET IS SUPPORTED BY INDIGENOUS RATING SYSTEMS
● Offers a wide array of services including developing new green building rating programs, certification services and green building training programs.
● Rating systems are based on the five elements of nature and are applicable to all five climactic zones in India
● Organizes Green Building Congress, an annual flagship event on green buildings.
● 4,363 registered projects with a footprint of over 4.71 Billion sq. feet and 1,257 certified and fully functional existing projects.
● Long term goal of positioning India as a global leader in the green building movement by 2025.
Sources: Niti Aayog, Government. of India, GRIHA India.
IGBC
● Independent rating system called Green Rating for Integrated Habitat Assessment, GRIHA.
● 31 rating criteria on a 100-point system with each criterion assigned certain points.
● Buildings, in design stage with built up area more than 2,500 m2, eligible.
● 3 stages for evaluation.● Fast track environmental clearance
available through pre-certification.● 1,000 registered projects covering
approx. 40 million sq. meters.
GRIHA
10

NATIONAL GREEN BUILDING CODE IS NOT WELL ENFORCED, BUT LOCAL INCENTIVES GROW THE MARKET
Sources: Niti Aayog, Government. of India, GRIHA India, IGBC 11
● Originally introduced in May 2007 BY Bureau of Energy Efficiency (BEE).
● Revised in June 2017 because of slow adoption of old code due to different jurisdictions at state and municipal levels and lack of stakeholder awareness.
● Varied approaches exist at state level -Haryana offers up to 25% additional FAR while Pimpri Chinchwad Municipal Corporation offers up to 50% discount on premium building permission charges.
● ECBC cells to be set up to coordinate State and Center level initiatives and establish level playing field.
NATIONAL CODE LOCAL INCENTIVES
● Punjab● Rajasthan● West Bengal● Uttar Pradesh● Maharashtra● Andhra Pradesh● Jharkhand● Himachal Pradesh● Pune● Harayana
List from IGBC website

12
Case studies from other countries: www.edgebuildings.com/projects/
LEARN MORE ABOUT EDGE CERTIFIED PROJECTS IN INDIA
KESAR CITY
Predicted Savings of EDGE Certification:
23% Energy Savings
24% Water Savings
71% Less Embodied Energy in Materials
Location: Ahmedabad, India
Architect Aroma Realties
Sector: Residential
No. of Units: > 1,000
Resource-efficient 2-bedroom apartments thatrely on practical strategies such as reducing thewindow size and using reflective paint toincrease efficiency. The developer is placinggreen at the center of their market strategy.
QUASITUM INTELISOFT INDIA PVT. LTD.
Predicted Savings of EDGE Certification:
33% Energy Savings
68% Water Savings
32% Less Embodied Energy in Materials
Location: Bangalore, India
Architect Fluid Space Architects
Sector: Commercial - Offices
Size: 5,000 m2
The project is projected to achieve 43% reduction intotal energy consumption. It also includes a waterconservation system with rain water harvesting.

PROJECTS CAN GET CERTIFIED THROUGH FAST, EASY, AND AFFORDABLE CERTIFICATION
13
Individual Homes/Single Family Dwelling Unit Pricing
Group Housing/Multi-Dwelling Units/Commercial Buildings Pricing
BUILT-UP AREA (SQM), EXCLUDING PARKING
0-200 (SQM) 201-350 (SOM)
351-500 (SQM) 501-750 (SQM) 751-1000 (SQM)
>1,000 (SQM)
REGISTRATION ₹ 10,000 ₹ 10,000 ₹ 15,000 ₹ 15,000 ₹ 20,000 ₹ 20,000
CERTIFICATION ₹ 20,000 ₹ 25,000 ₹ 30,000 ₹ 35,000 ₹ 50,000 ₹ 80,000
BUILT-UP AREA (SQM), EXCLUDING PARKING
0-5,000 (SQM) 5,001-50,000 (SQM) 50,001 (SQM) and Above
PRE-CERTIFICATION (DESIGN) ₹ 80,000 ₹ 80,000 ₹ 1,00,000
FINAL EDGE CERTIFICATION (CONSTRUCTION)
₹ 40,000 ₹ 40,000 + ₹ 9/ per each additional SQM above 5,000 SQM
₹ 4,50,000
TOTAL CERTIFICATION FEE ₹ 1,20,000 ₹ 1,20,000 + ₹ 9/ per each additional SQM above 5,000 SQM
₹ 5,50,000
Details and registration forms can be found on the EDGE program website: www.edgebuildings.com/certify/india/
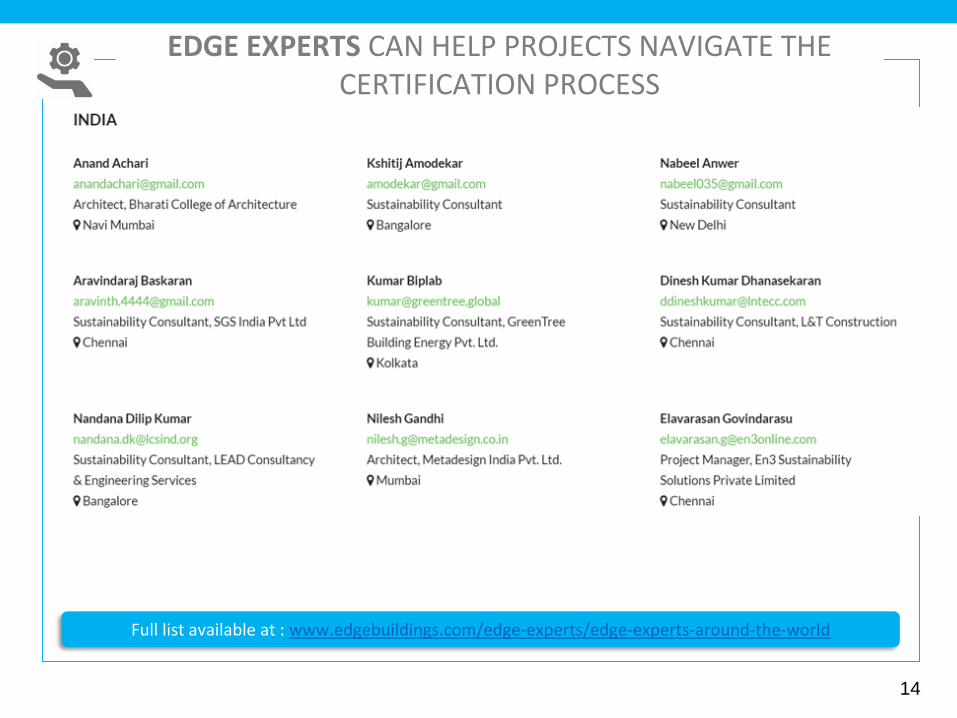
EDGE EXPERTS CAN HELP PROJECTS NAVIGATE THE CERTIFICATION PROCESS
14
Full list available at : www.edgebuildings.com/edge-experts/edge-experts-around-the-world
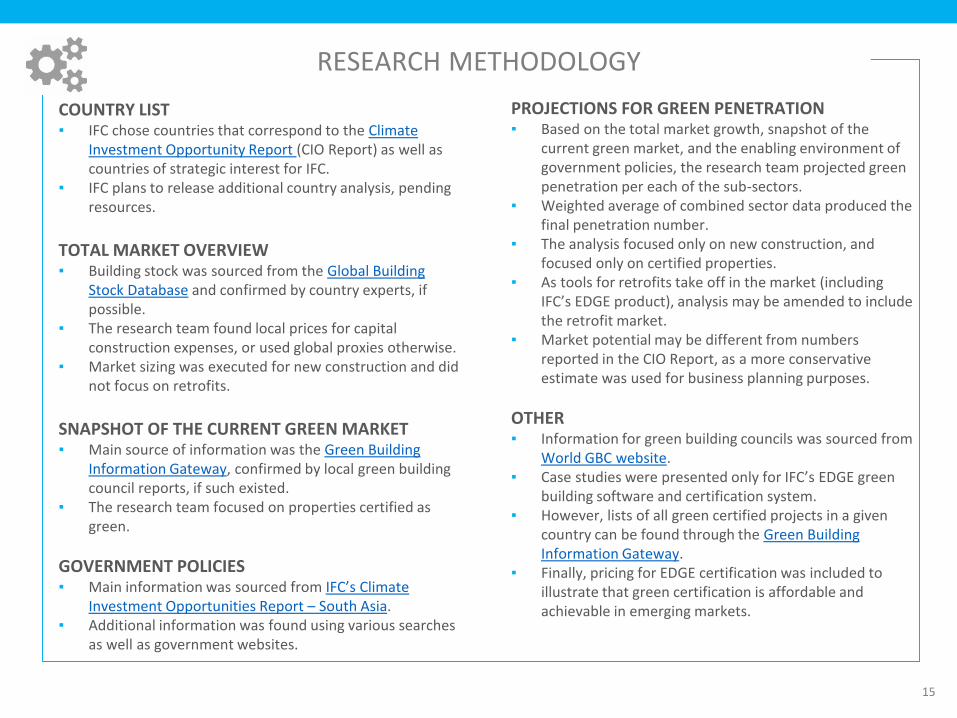
RESEARCH METHODOLOGY
15
COUNTRY LIST▪ IFC chose countries that correspond to the Climate
Investment Opportunity Report (CIO Report) as well as countries of strategic interest for IFC.
▪ IFC plans to release additional country analysis, pending resources.
TOTAL MARKET OVERVIEW ▪ Building stock was sourced from the Global Building
Stock Database and confirmed by country experts, if possible.
▪ The research team found local prices for capital construction expenses, or used global proxies otherwise.
▪ Market sizing was executed for new construction and did not focus on retrofits.
SNAPSHOT OF THE CURRENT GREEN MARKET▪ Main source of information was the Green Building
Information Gateway, confirmed by local green building council reports, if such existed.
▪ The research team focused on properties certified as green.
GOVERNMENT POLICIES▪ Main information was sourced from IFC’s Climate
Investment Opportunities Report – South Asia. ▪ Additional information was found using various searches
as well as government websites.
PROJECTIONS FOR GREEN PENETRATION▪ Based on the total market growth, snapshot of the
current green market, and the enabling environment of government policies, the research team projected green penetration per each of the sub-sectors.
▪ Weighted average of combined sector data produced the final penetration number.
▪ The analysis focused only on new construction, and focused only on certified properties.
▪ As tools for retrofits take off in the market (including IFC’s EDGE product), analysis may be amended to include the retrofit market.
▪ Market potential may be different from numbers reported in the CIO Report, as a more conservative estimate was used for business planning purposes.
OTHER▪ Information for green building councils was sourced from
World GBC website. ▪ Case studies were presented only for IFC’s EDGE green
building software and certification system. ▪ However, lists of all green certified projects in a given
country can be found through the Green Building Information Gateway.
▪ Finally, pricing for EDGE certification was included to illustrate that green certification is affordable and achievable in emerging markets.
ACKNOWLEDGEMENTS
16
DONOR ACKNOWLEDGEMENT
IFC thanks the following national donors for their generous support of the EDGE program:
the State Secretariat for Economic Affairs of Switzerland (SECO); the European Union; the Ministry of
Finance of Japan; the Hungarian Export Import Bank; the Canada Climate Change Program and the
Department of Foreign Affairs, Trade and Development Canada; the Royal Ministry of Foreign Affairs of
Denmark and the Danish Green Growth Fund; the Federal Ministry of Finance of Austria; and the
Ministry of Foreign Affairs of Finland.
In addition, IFC thanks contributors to the GEF-IFC Earth Fund Platform, and the Energy Sector
Management Assistance Program (ESMAP) of the World Bank whose support helped seed EDGE.
COLLABORATION ACKNOWLEDGEMENT
IFC thanks the Georgetown University McDonough School of Business for collaborating
on developing the market intelligence reports.
Visit www.edgebuildings.com for more information