Green Buildings and Health - DASH Home
105
Green Buildings and Health Citation MacNaughton, Piers. 2016. Green Buildings and Health. Doctoral dissertation, Harvard T.H. Chan School of Public Health. Permanent link http://nrs.harvard.edu/urn-3:HUL.InstRepos:32644538 Terms of Use This article was downloaded from Harvard University’s DASH repository, and is made available under the terms and conditions applicable to Other Posted Material, as set forth at http:// nrs.harvard.edu/urn-3:HUL.InstRepos:dash.current.terms-of-use#LAA Share Your Story The Harvard community has made this article openly available. Please share how this access benefits you. Submit a story . Accessibility
Transcript of Green Buildings and Health - DASH Home

Green Buildings and Health
CitationMacNaughton, Piers. 2016. Green Buildings and Health. Doctoral dissertation, Harvard T.H. Chan School of Public Health.
Permanent linkhttp://nrs.harvard.edu/urn-3:HUL.InstRepos:32644538
Terms of UseThis article was downloaded from Harvard University’s DASH repository, and is made available under the terms and conditions applicable to Other Posted Material, as set forth at http://nrs.harvard.edu/urn-3:HUL.InstRepos:dash.current.terms-of-use#LAA
Share Your StoryThe Harvard community has made this article openly available.Please share how this access benefits you. Submit a story .
Accessibility

GREEN BUILDINGS AND HEALTH
PIERS MACNAUGHTON
A Dissertation Submitted to the Faculty of
The Harvard T.H. Chan School of Public Health
in Partial Fulfillment of the Requirements
for the Degree of Doctor of Science
in the Department of Environmental Health
Harvard University
Boston, Massachusetts.
Date
November, 2016

ii
Dissertation Advisor: Dr. Joseph Allen, DSc, MPH Piers MacNaughton
GREEN BUILDINGS AND HEALTH
ABSTRACT
40 years of public health research on buildings has identified the indoor environmental
drivers of health and productivity. Concurrently, increased environmental awareness spurred the
green building movement with the goal of encouraging more sustainable buildings. The question
remains as to whether green buildings are also healthy buildings.
The objective of this dissertation is to investigate the impact of green buildings on health
and cognitive function in both laboratory and real-world settings, and furthermore quantify these
impacts in comparison to the potential environmental and economic costs. First, 24 participants
spent 6 work days in a controlled office environment. On different days, they were exposed to
conditions representative of Conventional (high volatile organic compound (VOC)
concentration), Green (low VOC concentration), and Green+ (low VOC concentration and
increased ventilation) office buildings. Additional conditions tested artificially elevated carbon
dioxide (CO2) levels. On average, cognitive scores were 61% higher on the Green building day
and 101% higher on the Green+ building days than on the Conventional building day
(p<0.0001). VOCs and CO2 were independently associated with cognitive scores.
Second, based on the finding of improved cognitive scores in buildings with enhanced
ventilation, the productivity benefits were compared to the environmental and economic costs of
doubling ventilation rates. The costs were less than $40 per person per year in all climate zones
investigated, while the benefits in terms of productivity exceeded $6,500 per person per year.

iii
The environmental impacts could be mitigated through the implementation of energy recovery
ventilators (ERVs).
Lastly, we conducted building assessments of 10 high-performing buildings (i.e.
buildings surpassing the ASHRAE 62.1-2010 ventilation requirement and with low VOC
concentrations) in 5 cities around the U.S. while tracking the health and productivity of office
workers in those buildings. Even among high-performing buildings, workers in green certified
buildings scored 26.4% higher on cognitive function tests than those in non-certified buildings.
Sleep Quality scores were 6.4% higher in green certified buildings, suggesting an impact of the
building on sleep quality.
We show significant benefits to cognitive function and health in green buildings through
multiple experimental approaches, driven by factors consistent with the public health literature.
iv
TABLE OF CONTENTS
ABSTRACT .................................................................................................................................... ii
TABLE OF CONTENTS ............................................................................................................... iv
LIST OF FIGURES ....................................................................................................................... vi
LIST OF TABLES ....................................................................................................................... viii
ACKNOWLEDGMENTS ............................................................................................................. ix
THESIS OVERVIEW ..................................................................................................................... 1
CHAPTER 1 - Associations of Cognitive Function Scores with Carbon Dioxide, Ventilation,
and Volatile Organic Compound Exposures in Office Workers: A Controlled Exposure Study
of Green and Conventional Office Environments ....................................................................... 3
Abstract .................................................................................................................................... 4
1.1 Introduction ....................................................................................................................... 5
1.2 Methods ............................................................................................................................. 7
1.3 Results ............................................................................................................................. 19
1.4 Discussion ........................................................................................................................ 25
1.5 Conclusion ....................................................................................................................... 29
References ............................................................................................................................. 31
CHAPTER 2 - Economic, Environmental and Health Implications of Enhanced Ventilation in
Office Buildings ........................................................................................................................ 34
Abstract .................................................................................................................................. 35
2.1 Introduction ..................................................................................................................... 37
2.2 Methods ........................................................................................................................... 40
2.3 Results ............................................................................................................................. 47
2.4 Discussion ........................................................................................................................ 51
2.5 Conclusions ..................................................................................................................... 56
Author Contributions ............................................................................................................. 57

v
Conflicts of Interest ............................................................................................................... 57
References ............................................................................................................................. 58
CHAPTER 3 - The Impact of Working in a Green Certified Building on Cognitive Function
and Health ................................................................................................................................. 62
3.1 Introduction ..................................................................................................................... 64
3.2 Methods ........................................................................................................................... 67
3.3 Results ............................................................................................................................. 76
3.4 Discussion ........................................................................................................................ 81
3.5 Conclusions ..................................................................................................................... 85
SUMMARY .................................................................................................................................. 92
REFERENCES ............................................................................................................................. 95

vi
LIST OF FIGURES
Figure 1.1 Average cognitive function scores and standard error bars by domain for the
Conventional, Green and two Green+ conditions, normalized to the Green
condition by dividing all scores by the average score during the Green
condition.
Figure 1.2 Cognitive function scores by domain and participant, and corresponding
carbon dioxide concentration in their cubicle. Each line represents the
change in an individual’s CO2 exposure and cognitive scores from one
condition to the next, normalized by the average CO2 exposure across all
participants during the Green+ conditions.
Figure 2.1 Schematics of a) a variable air volume ventilation system and b) a fan coil
unit ventilation system.
Figure 2.2 Average cognitive performance on the SMS tool of 24 participants in
a green building at 20 and 40 cfm/person of outdoor air relative to
normative data from ~70,000 people.
Figure 2.3 Observed salaries from the Bureau of Labor Statistics for common
office occupations, regressed with an exponential function. This
equation was used to interpolate salaries at the cognitive testing
percentiles.
Figure 3.1 Thermal comfort for each participant-day by building type plotted on the
psychrometric chart. The light gray region corresponds to a Percent of
People Dissatisfied (PPD) below 10%, and the dark gray region corresponds
to a PPD below 7% as derived from ASHRAE Standard 55-2010
(ASHRAE, 2010).
Figure 3.2 Boxplots of indoor environmental quality (IEQ) parameters in high-
performing, non-certified buildings and high-performing, green certified
buildings. Vent, AER, CO2, Temp, RH and Noise are measured by the
Netatmo in every workstation each day, TVOCs are measured with summa
canisters in every test space each cognitive testing day, and PM2.5 and Light
are measured by the Feng Sensor in every test space each day. An asterisk
(*) denotes that the building classifications are statistically significantly
different from each other for that IEQ parameter after adjusting for
clustering by building.
Figure 3.3 Cognitive scores and 95% confidence intervals for each domain of the SMS
tool after controlling for participant, normalized to high-performing
buildings, for participants in high-performing and high-performing, green
certified buildings.
20
24
43
46
51
75
77
78

vii
Figure 3.4 Effect of a) thermal comfort on cognitive function scores, b) yesterday’s
sleep on cognitive function scores, c) building classification on Sleep
Scores, and d) light levels on Sleep Scores, using generalized linear mixed
effect models with 95% confidence intervals, treating building and
participant as random effects. The effect size for thermal comfort is
comparing cognitive scores from tests taken by participants within the
ASHRAE Standard 55-2013 comfort zone to those without. The effect sizes
for yesterday’s sleep and light correspond to a 25% change in Sleep Score
and 300 lux change in illuminance respectively.
Figure 3.5 Environmental perceptions of lighting, temperature, air movement, humidity
and odors in high-performing, green certified and high-performing, non-
certified buildings. Participants were asked about lighting conditions at the
end of the assessment on a Likert scale ranging from Very Dissatisfied (1) to
Very Satisfied (5), and asked about the presence of temperature, air
movement, humidity and odor problems daily.
80
81

viii
LIST OF TABLES
Table 1.1 Participant demographics.
Table 1.2 Average indoor environmental conditions simulated in each room of the
TIEQ lab.
Table 1.3 Speciated VOC concentrations (μg/m3) on each study day, averaged across
rooms.
Table 1.4 Description of the cognitive domains tested.
Table 1.5 Generalized additive mixed effect models testing the effect of IEQ condition
and on cognitive scores, normalized to the “Conventional” condition, treating
participant as a random intercept.
Table 2.1 Climate and fuel costs used for model inputs. Electricity generation
fuel mix used for environmental impact assessment.
Table 2.2 Change in energy cost per occupant per year compared to conventional.
Table 2.3 Percent increase in annual CO2, SO2 and NOx emissions compared to
conventional.
Table 2.4 Number of additional cars per year on the road per building compared to
conventional.
Table 2.5 Health impacts of ventilation rate in medium office prototype building
(adapted from Fisk et al. [24]).
Table 3.1 Credit adoption rates for select optional IEQ credits in 5,490 LEED New
Construction 2009 certified buildings (USGBC, 2016).
Table 3.2 Demographic breakdown of participants in each building classification.
Table 3.3 Building characteristics of the 10 high-performing buildings included in the
study.
9
11
14
17
22
41
48
49
50
54
65
69
71

ix
ACKNOWLEDGMENTS
This dissertation would not have been possible without the help of many people at the Harvard
T.H. Chan School of Public Health and beyond. First and foremost I would like to acknowledge
my advisor, Joseph Allen, and my committee, Jack Spengler, Gary Adamkiewicz, and Brent
Coull, who were given the challenging task of training, preparing, and advising me throughout
my masters and doctoral degrees. I would also like to thank my friends and colleagues in the
Center for Health and the Global Environment who assisted with the fieldwork and analysis for
the CogFx study. Our team at Harvard benefited from strong collaborations with SUNY Upstate
Medical Center and Syracuse University, and these studies relied on volunteers willing to
dedicate their time and resources, either by providing access to their buildings or participating
themselves. Lastly, the research was funded by a gift to the Center for Health and the Global
Environment from United Technologies and my NIEHS environmental epidemiology training
grant 5T32ES007069-35.

1
THESIS OVERVIEW
The environments in which we spend time play a significant role in our overall well-
being. Given that we spend 90% of our time indoors, buildings have an outsized, and often
underappreciated, impact on our health. Over the past century, building practices have changed
contrary to the research on health in buildings and each time led to serious health consequences.
Rapidly constructed homes following World War II used new building materials that had not
properly offgassed (Gerber, 2000). The high levels of VOCs such as formaldehyde caused a
pattern of illness in occupants of these homes, even though some of the health risks of
formaldehyde had been established previously (Industrial Hygiene Research, 1945). Again in the
1970s, air exchange rates were lowered in response to higher energy prices despite 60 years of
ventilation standards that cautioned against inadequate ventilation (Persily, 2015). The resulting
health impacts, termed Sick Building Syndrome (SBS), have been rigorously documented in the
subsequent years (Redlich et al., 1997; Riesenberg et al., 1986).
More recently, another change in buildings practices arose with the inception of the green
building movement. In contrast to the examples above, it sought to improve the energy
performance of a building while simultaneously ensuring an adequate indoor environment for the
occupants. However, the fulfillment of this goal in practice has been brought into question as
these buildings became more prevalent. The public health literature generally supports that green
buildings have improved indoor environmental quality (IEQ), improved occupant perceptions,
and fewer SBS symptoms, but the studies to date mostly lack objective measurements of health,
which may cause considerable bias as participants are not blinded to their building classification
(Allen et al., 2015). These studies are also limited in their assessments of health, focusing on
acute symptomatic outcomes and ignoring chronic or worker performance outcomes.

2
This thesis is intended to address these limitations in the literature. Through two
experimental approaches, one in which participants were blinded to their building classification
and one in which participants were tested in their current building, we tested the impact of
building classification on an objective measure of worker performance – cognitive function. The
appended publications describe the methods and results of these efforts, which have the
following aims:
Paper 1
Associations of Cognitive Function Scores with Carbon Dioxide, Ventilation, and Volatile
Organic Compound Exposures in Office Workers: A Controlled Exposure Study of Green and
Conventional Office Environments
Aim 1 To simulate IEQ conditions found in Green and Conventional buildings and evaluate the
impacts on objective and subjective measures of human health and cognitive function.
Paper 2 Economic, Environmental and Health Implications of Enhanced Ventilation in Office
Buildings
Aim 2 To quantify the benefits of improved cognitive function in green buildings and compare to
environmental and economic costs
Paper 3 The Impact of Working in a Green Certified Building on Cognitive Function and Health
Aim 3
To observe IEQ conditions found in high-performing, green certified and high-performing,
non-certified buildings and evaluate the impacts on objective and subjective measures of
human health and cognitive function.

3
CHAPTER 1 - Associations of Cognitive Function Scores with Carbon Dioxide,
Ventilation, and Volatile Organic Compound Exposures in Office Workers: A Controlled
Exposure Study of Green and Conventional Office Environments
Authors
Joseph G. Allen1, Piers MacNaughton
1, Usha Satish
2, Suresh Santanam
3, Jose Vallarino
1, John
D. Spengler1
Affiliations
1 Exposure, Epidemiology & Risk Program, Department of Environmental Health, Harvard
School of Public Health, Boston, MA, USA.
2 Industrial Assessment Center, Center of Excellence, Syracuse University, Syracuse, NY, USA.
3 Psychiatry and Behavioral Sciences, SUNY-Upstate Medical School, Syracuse, NY, USA
4
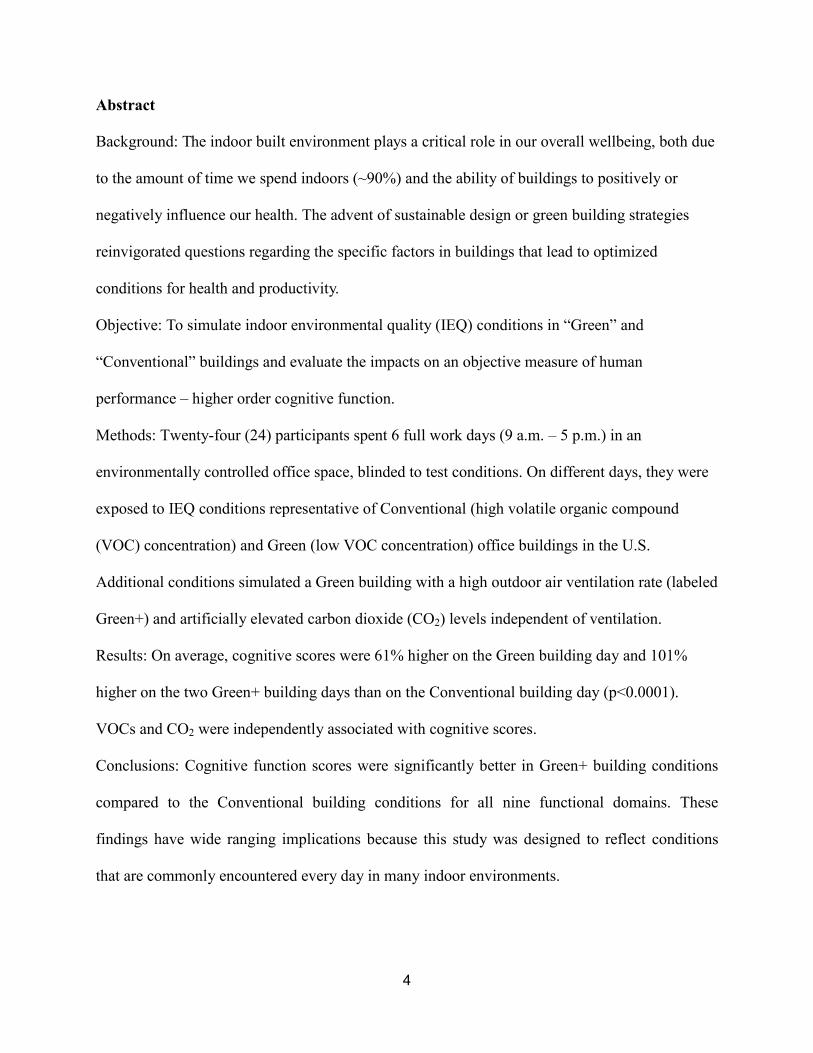
Abstract
Background: The indoor built environment plays a critical role in our overall wellbeing, both due
to the amount of time we spend indoors (~90%) and the ability of buildings to positively or
negatively influence our health. The advent of sustainable design or green building strategies
reinvigorated questions regarding the specific factors in buildings that lead to optimized
conditions for health and productivity.
Objective: To simulate indoor environmental quality (IEQ) conditions in “Green” and
“Conventional” buildings and evaluate the impacts on an objective measure of human
performance – higher order cognitive function.
Methods: Twenty-four (24) participants spent 6 full work days (9 a.m. – 5 p.m.) in an
environmentally controlled office space, blinded to test conditions. On different days, they were
exposed to IEQ conditions representative of Conventional (high volatile organic compound
(VOC) concentration) and Green (low VOC concentration) office buildings in the U.S.
Additional conditions simulated a Green building with a high outdoor air ventilation rate (labeled
Green+) and artificially elevated carbon dioxide (CO2) levels independent of ventilation.
Results: On average, cognitive scores were 61% higher on the Green building day and 101%
higher on the two Green+ building days than on the Conventional building day (p<0.0001).
VOCs and CO2 were independently associated with cognitive scores.
Conclusions: Cognitive function scores were significantly better in Green+ building conditions
compared to the Conventional building conditions for all nine functional domains. These
findings have wide ranging implications because this study was designed to reflect conditions
that are commonly encountered every day in many indoor environments.

5
1.1 Introduction
The increasing cost of energy in the 1970s led to a change in building practices throughout the
United States, as buildings were increasingly constructed to be airtight and energy efficient. This
is reflected in decreasing air exchange rates in homes and buildings. For homes, beginning
around this time period, typical air exchange rates began decreasing from approximately 1 air
change per hour (ACH) to approximately 0.5 ACH (Chan et al. 2003; Hodgson et al. 2000;
ASHRAE 2013). Homes built in the past decade are designed to be even more energy-efficient
and therefore can be even tighter (0.1 - 0.2 ACH; Allen et al. 2012; ASHRAE 2013). The 100+
year story of ventilation in buildings is more complicated, and neatly summarized recently by
Persily (2015). Persily describes the original ASHRAE 62 standard, issued in 1973, and the
many subsequent iterations (e.g. ASHRAE 62.1 applies to commercial buildings), demonstrating
the evolving nature of our understanding regarding the relationship between ventilation rate and
acceptable indoor air quality. Similar to the story with homes, commercial ventilation
requirements were lowered in the early 1980’s, largely as an energy-conservation measure
(Persily 2015).
With these design changes comes the potential for negative consequences to indoor
environmental quality (IEQ), as decreased ventilation can lead to increased concentration of
indoor pollutants. Building-related illnesses and sick building syndrome (SBS) were first
reported in the 1980s as ventilation rates decreased (Riesenberg and Arehart-Treichel 1986),
with significant annual costs and productivity losses due to health symptoms attributable to the
indoor environment (Fisk et al. 1997). A few factors of the indoor and work environment have
been found to be associated with occupant health. These include environmental measures, such
as humidity; building factors, such as ventilation rate; workspace factors, such as the presence of

6
chemical-emitting materials; and personal factors, such as job stress, allergies, and gender
(Mendell 1993; Wargocki et al. 2000; Bornehag et al. 2005; Hedge 2009; Hedge and Gaygen
2010; Nishihara 2014).
The IEQ problems that arose from conventional buildings with a tight envelope
contributed to the advent of sustainable design or “green” building rating systems (e.g. U.S.
Green Building Council’s Leadership in Energy and Environmental Design (LEED®)). These
rating systems aim to reduce the environmental footprint of buildings and improve occupant
health by providing design credits to new and existing buildings for adopting green design,
operation, and maintenance. Different levels of ratings for the building are then awarded based
on the number of acquired credits (e.g., silver, gold, platinum) (USGBC 2014). Many design
credits are aimed at energy efficiency and environmental performance, but also include
guidelines for improving ventilation and filtration, using low-emitting materials, controlling
indoor chemical and pollutant sources, improving thermal and lighting conditions, and offering
daylight views to building occupants (USGBC 2014). Compared to conventional buildings,
environmental measurements in green buildings show lower concentrations of several key
pollutants including particles, nitrogen dioxide, VOCs, and allergens (Colton et al. 2014; Jacobs
et al. 2014; Noris et al. 2013). However, these reductions generally did not extend to CO2 or air
exchange rate, demonstrating the influence of energy efficiency on green building operation and
design. Green buildings were associated with improved IEQ, and have been associated with
reductions in self-reported symptoms in people inhabiting the buildings, and with improved
productivity in home, school, and office settings (Colton et al. 2014; NRC 2007; Singh et al.
2010). However, an important limitation of these studies is the reliance on subjective outcome
measures, such as surveys, that have the potential for bias because participants are aware of their

7
status (i.e. green or control). To our knowledge, no studies have been conducted in green
buildings to date where participants are blinded to their building condition (Allen et al. 2015).
We designed this study to objectively quantify the impact of indoor environmental on
higher order cognitive function, a driver of real-world productivity in office workers. We
simulated low VOC (“Green”) and high VOC (“Conventional”) building conditions, both at the
ASHRAE standard ventilation rate. Recognizing that technological advances in mechanical
systems opens the possibility of increasing ventilation rates without sacrificing energy efficiency,
we also tested another building condition that introduced higher rates of ventilation to the Green
building condition. This condition is labeled Green+. Last, we were motivated by the recent
findings by Satish et al. that CO2 may be a direct pollutant, and not just an indicator of
ventilation (2012), and therefore estimated associations of full workday exposure to CO2 on
cognitive function holding all other variables constant.
1.2 Methods
1.2.1 Study Design
This is a study undertaken in a controlled office environment to estimate the effect of several
indoor environmental quality parameters on an objective measure of cognitive function. We
utilized a double-blinded study design that includes repeated measures of cognitive function on
the same individual, characterization of potential confounding IEQ variables, and mid-week
testing to avoid Monday/Friday effects. All participants received the same exposures on each
day, with exposures varying each day.

8
1.2.2 Study Population
24 professional-grade employees (architects, designers, programmers, engineers, creative
marketing professionals, managers) in the Syracuse area participated in a six day longitudinal
study of cognitive performance and building conditions (Table 1.1). Six additional people were
originally recruited as backups but were not enrolled in the study. Participants were recruited
through emails to local businesses. The study population was restricted to non-sensitive persons
by excluding current smokers and people with asthma (due to testing indoor air quality),
claustrophobia or schizophrenia (due to this being a laboratory experiment where participants are
required to remain in the TIEQ). The participants were relocated to the Willis H. Carrier Total
Indoor Environmental Quality (TIEQ) Laboratory at the Syracuse Center of Excellence (CoE)
for six days over the course of two weeks in November of 2014. The study protocol was
reviewed and approved by the Harvard T.H. Chan School of Public Health Institutional Review
Board. SUNY Upstate Medical and Syracuse University ceded their review to Harvard’s IRB. All
participants signed informed consent documents and were compensated $800.

9
Table 2.1 Participant demographics.
n %
Gender
Male 10 42
Female 14 58
Age
20-30 8 33
31-40 3 12
41-50 6 25
51-60 4 17
61-70 3 12
Ethnicity
White/Caucasian 22 92
Black or African American 1 4
Latino 1 4
Highest level of Schooling
High School Graduate 1 4
Some College 2 8
College Degree 13 54
Graduate Degree 8 33
Job Category
Managerial 5 21
Professional 15 63
Technical 1 4
Secretarial or Clerical 1 4
Other 2 8
Participants reported to the CoE on Tuesday, Wednesday and Thursday, at 9 a.m., for two
consecutive weeks. The CoE has two nearly identical office environments located adjacent to one
another as part of the TIEQ Lab, each with 12 cubicles. The rooms are similarly constructed and
have identical building materials (e.g., carpeting, cubicles, painting, computers). Environmental
conditions, described in the following sections, were designed to be consistent in the two rooms.
On the first day participants were randomly assigned to a cubicle in the TIEQ Lab for the
duration of the study. Participants were requested to spend the entire work day in the simulated

10
office environments performing their normal work activities. They were provided with
computers, internet access, and an area for private telephone calls and printing. A 45-minute
lunch break was given between 12:00-12:45 (Room 1) or 12:15-1:00pm (Room 2). A limited
selection of food was provided, served and eaten in a room adjacent to the two simulated office
environment rooms. Participants then returned to the simulated office environment to continue
their work. Cognitive testing was initiated at 3:00 p.m. each day, after which the participants
completed the daily surveys and left the TIEQ Lab. Participants were blinded to test conditions,
as were the analysts performing the cognitive function assessment. Participants were not given
any instructions on how to spend their time in the evenings or on the Mondays before starting the
test period.
1.2.3 Indoor Environment Simulation
The different environmental simulations in the TIEQ Lab on each day were designed to evaluate
commonly encountered conditions and guidance values (Table 1.2). The three test parameters
that were experimentally controlled were ventilation with outdoor air, CO2, and VOCs. We
selected two outdoor air ventilation rates for this study: 20 cfm/person and 40 cfm/person.
LEED® specifies that mechanically ventilated spaces must meet ventilation rates under
ASHRAE 62.1, or local equivalent, whichever is more stringent (USGBC 2014; ASHRAE
2013). Many local building codes use the previous ASHRAE standard of 20 cfm/person, which
corresponds to an indoor CO2 concentration of 945 ppm. Therefore, 20 cfm/person was the
ventilation rate we used for the Green and Conventional simulation days because it reflects the
minimum required ventilation rate for both green buildings (through LEED®) and conventional
buildings (through ASHRAE). We also sought to evaluate the impact of a doubling of that
minimum rate to 40 cfm/person (labeled Green+ days), which corresponds to an approximate

11
steady-state CO2 concentration of 550 ppm. To ensure blinding, air movement was maintained at
40 cfm per person on all study days, with 100% outdoor air ventilation used on Green+ days and
moderate and high CO2 days, and a mix of 50% outdoor air and 50% recirculated air used on the
Green and Conventional days to achieve 20 cfm outdoor air ventilation per person.
Table 1.2 Average indoor environmental conditions simulated in each room of the TIEQ lab.
Variable Day 1
Green+
Day 2
Moderate CO2
Day 3
High CO2
Day 4
Green
Day 5
Conventional
Day 6
Green+
Date 11/4 11/5 11/6 11/11 11/12 11/13
Day of the Week Tue Wed Thu Tue Wed Thu
Room 502 503 502 503 502 503 502 503 502 503 502 503
Experimental Parameters
CO2 (ppm) 563 609 906 962 1400 1420 761b
726b 969 921 486 488
Outdoor Air
Ventilation
(cfm/person)a
40 40 40 40 40 40 20 20 20 20 40 40
TVOCs (µg/m3) 43.4 38.5 38.2 28.6 32.2 29.8 48.5 43.5 506 666 55.8 14.9
Other Environmental Parameters
Temp (oC) 23.9 24.5 22.4 23.9 21.3 22.0 22.9 23.7 21.8 22.5 20.7 21.3
RH (%) 31.0 30.4 34.2 31.6 38.7 38.3 34.3 33.3 39.6 38.3 27.8 26.8
NO2 (µg/m3) 57.9 58.9 53.2 54.1 60.8 58.4 51.3 45.6 54.6 50.8 56.5 55.5
O3 (µg/m3) 3.42 21.2 14.4 13.0 1.37 0.00 6.85 238 1.71 1.37 4.11 6.85
PM2.5 (µg/m3) 2.38 3.49 3.35 2.58 2.97 2.42 1.26 1.83 1.68 1.34 1.26 1.38
Noise (dB) 51.3 49.9 49.7 48.8 52.5 48.8 49.6 48.7 51.1 48.8 50.5 49.2
Illuminance (mV) 2.95 2.70 2.89 2.83 2.31 2.04 3.11 2.93 2.74 2.51 2.39 2.28
Irradiance (mV) 9.07 8.76 9.45 9.37 6.00 6.05 9.90 9.60 8.30 8.14 6.70 6.82
a A constant air flow rate of 40 cfm/person was maintained on all study days, with 100% outdoor
air used on days 1, 2, 3, and 6, and 50% outdoor air and 50% recirculated air used to achieve an
outdoor air ventilation rate of 20 cfm/person on days 4 and 5.
b Average concentration from 2-5 p.m. was 926 ppm, but lower CO2 concentrations in the
morning hours during the approach to steady-state led to a lower average CO2 concentration.
For the assessment of the independent association of CO2 on cognitive function, outdoor
air ventilation rate held constant at 40 cfm/person while CO2 was added to the chambers to reach
three steady-state CO2 concentrations. The first target was 550 ppm (Green+, Days 1 and 6). The
second target, 945 ppm, was selected to reflect a level that would be expected at the previously

12
described ASHRAE minimum recommended ventilation rate of 20 cfm outdoor air/person. The
third target, 1400 ppm, was selected to represent a higher, but not uncommon, concentration of
CO2 found in indoor environments (1400 ppm is the maximum observed 8-hour time-weighted-
average CO2 concentration in the USEPA BASE dataset (USEPA 1998)). On Days 2 and 3,
where the independent effects of CO2 were tested, CO2 was added from a cylinder of ultra-pure
CO2 (at least 99.9999% pure) to the TIEQ Lab supply air at the rate needed to maintain
steady-state CO2 concentrations of 945 ppm and 1,400 ppm. Since CO2 concentrations are
impacted by occupancy and mixing impact concentrations, a technician monitored CO2 in real-
time and adjusted the emission rate accordingly to keep CO2 concentrations constant. During
Days 4 and 5 (Green and Conventional), injection of pure CO2 was not needed to reach the
target CO2 concentrations because of the reduced outdoor ventilation rate. A protocol was
established to ensure participant safety in the event that there were unexpected deviations. CO2
was monitored in real-time at a high-spatial resolution in the test rooms, using three different
and independently calibrated monitors. A technician seated next to the CO2 shut-off valves
monitored the CO2 concentrations during the entire test period. The protocol called for
immediately canceling of the testing if CO2 concentrations exceeded preset thresholds that
were set well-below occupational health limits (2,500 ppm; one-half of the Threshold Limit
Value set by the American Conference of Governmental Industrial Hygienists (ACGIH 2015)).
No deviations from protocol occurred during the study.
The TIEQ Lab was constructed with low-VOC materials, and low levels of VOCs were
confirmed by pre-testing (Table 1.3). To simulate a Conventional office space with higher
VOCs, we placed VOC sources in the diffuser that supplied air to each cubicle area before the
participants arrived on Day 5. We selected a target total VOC (TVOC) level of 500 μg/m3
based

13
on the LEED® Indoor Air Quality Assessment credit limit, as measured using EPA method TO-
15 (USGBC 2014). The diffusers are built into the floor of the TIEQ Lab and there were no
visible indicators of these sources for the participants to observe. We selected a mix of non-odor
sources to simulate VOC-emitting materials that are commonly found in office building and
which cover four indoor VOC source categories including building materials (56 in2 exposed
edge melamine, 56 in2 exposed edge particle board, 64 in
2 vinyl mat), adhesives [80 in
2 duct
tape, 80 in2 packing tape (exposed)], cleaning products (1 oz. multi-surface cleaner, 4 multi-
surface wipes, 144 in2 recently dry-cleaned cloth), and office supplies (4 dry erase markers, 1
open bottle of whiteout).

14
Table 1.3 Speciated VOC concentrations (μg/m3) on each study day, averaged across rooms.
Analyte Condition
Background Green+ Med. CO2 High CO2 Green Conventional Green+
VOCs
1,2,4-Trimethylbenzene 0.3 0.2 NDa 0.1 ND 0.5 0.1
2-Butanone 2.5 0.7 0.7 0.8 1.1 1.1 0.6
2-Propanol 1.0 1.2 1.1 3.1 1.2 312.5 8.2
Acetone 12.0 14.7 9.6 8.7 20.0 20.0 8.6
Benzene 0.5 0.8 0.5 0.9 0.7 0.5 0.5
Carbon disulfide 0.6 0.2 ND ND ND ND 0.1
Carbon tetrachloride ND 0.2 0.4 ND 0.2 ND ND
Chloroform ND 0.1 ND ND ND 0.1 ND
Chloromethane 1.3 1.7 1.5 1.4 1.9 1.5 1.4
Cyclohexane 0.2 0.3 0.4 0.5 0.1 0.4 0.3
Dichlorodifluoromethane 2.5 2.6 2.9 2.7 2.9 2.4 2.5
Ethyl acetate ND ND ND ND 1.0 2.0 ND
Ethylbenzene 0.3 0.4 ND 0.3 0.2 0.1 0.1
Freon 113 0.3 0.7 0.8 0.8 0.8 0.2 0.4
Heptane ND 0.3 ND 0.3 ND 257.5 6.9
Hexane 0.4 0.7 0.5 0.7 0.4 0.8 1.3
m,p-Xylene 0.8 1.5 0.4 1.0 1.0 0.7 0.7
Methylene chloride 0.5 0.3 0.6 0.5 0.3 0.4 0.4
o-Xylene 0.3 0.4 ND 0.4 0.1 0.3 0.1
Styrene 0.1 ND ND ND ND ND 0.1
Tetrachloroethene 3.7 0.9 ND ND 0.9 0.6 0.2
Tetrahydrofuran ND ND ND ND 0.2 0.1 0.2
Toluene 2.4 2.1 1.4 1.9 2.2 1.9 2.9
trans-1,2-Dichloroethene 19.0 8.8 12.6 6.2 10.3 21.8 8.7
Trichloroethene ND ND ND ND ND ND 0.2
Trichlorofluoromethane 1.3 1.2 1.6 1.4 1.5 1.1 1.2
Grand Total 50.0 40.1 35.0 31.4 46.9 626.4 45.6
Aldehydes
2,5-Dimethylbenzaldehyde ND ND ND ND ND ND ND
Acetaldehyde 1.0 3.7 3.2 3.1 5.4 7.3 2.1
Benzaldehyde ND ND ND ND ND 1.5 ND
Crotonaldehyde ND ND ND ND ND ND ND
Formaldehyde 2.4 5.9 5.5 5.4 8.9 11.7 4.4
Hexanaldehyde ND 0.8 0.8 ND 1.9 2.4 ND
Isovaleraldehyde ND ND ND ND ND ND ND
m,p-Tolualdehyde ND ND ND ND ND ND ND
n-Butyraldehyde 1.1 2.7 1.4 2.3 2.8 2.4 2.0
o-Tolualdehyde ND ND ND ND ND ND ND
Propionaldehyde ND 0.7 1.2 ND 1.4 1.6 0.6
Valeraldehyde ND ND ND ND ND ND ND
Glutaraldehyde ND 0.5 ND ND 0.4 ND ND
o-Pthalaldehyde ND 65.1 57.7 70.0 41.6 38.4 76.8
Grand Total 4.6 79.4 69.8 80.9 62.4 65.3 85.8 a Non-detect

15
1.2.4 Environmental Monitoring
The study team characterized the TIEQ Lab on each test day for a wide range of IEQ indicators:
CO2, temperature, relative humidity, barometric pressure, sound levels, VOCs, aldehydes, NO2,
O3, PM2.5, and light. Netatmo Weather Stations were installed in each cubicle to measure
temperature, humidity, carbon dioxide concentrations in parts per million (ppm), and sound
levels (in decibels) every 5 minutes for each participant. They were calibrated to 0 and 3000 ppm
of CO2 using calibration gases and validated using a calibrated TSI Q-Trak (model 7575). In
addition, the Netatmos were tested with 400 and 1000 ppm calibration gas at the end of the study
to determine if the sensors drifted during the two week period. Duplicate measures of CO2 were
collected in each room using a TSI Q-Trak model 7575 and two K-33 data loggers. Summa
canisters were used to detect overall levels of 62 common VOCs in a randomly selected
workstation in each room for each of the study days (Table 1.3). An additional sample was
collected in a third randomly selected cubicle each day. Samples were analyzed by ALS
Laboratories according to EPA method TO-15. 36 VOCs were not detected in any of the samples.
In each room a monitoring station was placed at the far end of the room from the entrance
to monitor additional IEQ parameters. The station included a) a TSI SidePak AM510 personal
aerosol monitor to measure particulate matter 2.5 microns in diameter or smaller (PM2.5) , b) an
integrated filter sample for gravimetric analysis of PM2.5 and elemental composition, c) an 8-hour
integrated active air sample (0.4 L/min flow rate) analyzed for 14 aldehydes by ALS Analytical
Laboratories using EPA method TO-11, d) a passive NO2 badge (8-hour time-weighted average;
model X-595, Assay Technology; OSHA method 182), e) a passive sampling badge for ozone O3
(8-hour time-weighted average; model X-586, Assay Technology; OSHA Method 214), and e)

16
illuminance and irradiance measures using an IL1400 radiometer/powermeter with SEL-
033/Y/W and SEL-033/F/W detectors. VOC, aldehyde, NO2, O3, and integrated PM2.5 samples
had at least one blank and one duplicate for every 10 samples. Samples were blank corrected for
analyses. All duplicate measures were within 15% of each other, and an average of the two was
used for subsequent analyses.
An ambient air monitoring system was installed on the roof of the CoE to measure PM2.5,
O3, and NO2 using the same procedures and equipment as the indoor stations to establish the
potential influence of outdoor contaminants on the indoor environment. Outdoor temperature,
humidity, solar radiation, and wind speed/direction data was obtained from the CoE weather
station located on the roof of the building. Baseline (i.e. prior to occupancy) measurements of all
IEQ parameters were collected in the TIEQ Lab one month before the actual study.
1.2.5 Cognitive Function Assessment
The cognitive assessment was performed daily using the Strategic Management Simulation
(SMS) software tool, which is a validated, computer-based test, designed to test the effectiveness
of management-level employees through assessments of higher-order decision making (Streufert
et al. 1988; Breuer et al. 2003; Satish et al. 2004). At the start of the 1.5 hour test, participants
were given a brief, 1-page description of the scenario that they were about to participate in during
the test. They were then logged onto a standardized desktop computer station at the TIEQ Lab
using a unique identifier. Participants were not allowed to use their own computers and were
instructed to turn off all other devices prior to the assessment. The simulation was then initiated.
Participants were exposed to diverse situations based on real-world equivalent challenges (e.g.
handling a township in the role of a mayor or emergency coordinator). These scenarios are
designed to capture participants’ standard response pattern. The software allows flexibility in

17
approach; participants can choose to make a decision or form a plan at any time in response to any
stimulus from the program. The absence of requirements or stated demands allows the participant
the freedom to strategize and take initiative in his or her typical cognitive style. Based on the
participant’s actions, plans, responses to incoming information, and use of prior actions and
outcomes, the SMS software computes scores for nine cognitive factors (Table 1.4).
Table 1.4 Description of the cognitive domains tested.
Cognitive Function Domaina Description
Basic Activity Level Overall ability to make decisions at all times
Applied Activity Level Capacity to make decisions that are geared toward overall goals
Focused Activity Level Capacity to pay attention to situations at hand
Task Orientation Capacity to make specific decisions that are geared toward
completion of tasks at hand
Crisis Response Ability to plan, stay prepared and strategize under emergency
conditions
Information Seeking Capacity to gather information as required from different available
sources
Information Usage Capacity to use both provided information and information that has
been gathered toward attaining overall goals
Breadth of Approach Capacity to make decisions along multiple dimensions and use a
variety of options and opportunities to attain goals
Strategy
Complex thinking parameter which reflects the ability to use well
integrated solutions with the help of optimal use of information and
planning a See Streufert et al. 1986 for detailed descriptions
A technician trained in administering this test was present to provide standardized
instructions and periodically answer any questions from participants. Parallel scenarios (i.e.,
equivalent scenarios) were used from one day to the next, which allow retesting individuals
without potential bias due to experience and learning effects (Swezey et al. 1998). Parallel
scenarios have correlation coefficients between 0.68 and 0.94 for the scores on these cognitive
function domains (Streufert et al. 1988).

18
1.2.6 Statistical Analyses
Generalized additive mixed effect models were used to test associations between environmental
exposures and cognitive function while controlling for the correlated-nature of the repeat
measures. In the model, the most specific exposure was assigned to each participant, whether it
be cubicle-level (CO2), room-level (VOCs), or lab-level (ventilation). Participant ID was treated
as a random intercept to control for confounding by individual characteristics. The residuals were
normally distributed and homoscedastic for all models (data not shown). We used penalized
splines to graphically assess linearity in the associations between environmental exposures and
cognitive scores. SMS scores are often compared to normative data from other uses of the SMS
software (e.g. Satish et al. 2012). Since we did not have access to normative data, we instead
used our study population as the reference group. Based on the analysis, cognitive scores were
normalized by Conventional (Table 1.5), Green (Figure 1.1) or Green+ (Figure 1.2) scores to
allow for comparisons across cognitive function domains, each of which has a unique scale in
their raw form. The scores were normalized for each cognitive domain by dividing all scores by
the average score during the normalizing condition. The statistical significance of our results is
not affected by normalization. Given the multiple comparisons tested in this analysis, p-values
below 0.001 were considered statistically significant according to a Bonferroni correction.
Analyses were performed using the open-source statistical package R version 3.0.0 (R Project for
Statistical Computing, Vienna, Austria).

19
1.3 Results
1.3.1 Green Building and Cognitive Function
The TVOC levels were constant at <50 µg/m3 on all study days except the Conventional building day
when levels increased to 506–666 µg/m3 depending on the room. The compounds that increased in
concentration include but are not limited to formaldehyde, benzaldehyde, acetaldehyde, heptane, and
2-propanol. Heptane and 2-propanol had the largest increases of the compounds sampled (Table
1.3). Total aldehyde concentrations were primarily driven by o-Pthalaldehyde and remained
relatively constant on all study days.
Cognitive function scores were higher in Green building conditions compared to the
Conventional building condition for all nine functional domains (Figure 1.1). On average,
cognitive scores were 61% higher on the Green building day and 101% higher on the two
Green+ building days than on the Conventional building day. The largest effects were seen for
Crisis Response, Information Usage, and Strategy, all of which are indicators of higher level
cognitive function and decision-making (Streufert 1986). For Crisis Response, scores were 97%
higher for the Green condition compared to Conventional, and 131% higher comparing Green+
and Conventional. For Information Usage, scores in the Green and Green+ conditions were
172% and 299% higher than Conventional, respectively. And for Strategy, which tests the
participants’ ability to plan, prioritize and sequence actions, the Green and Green+ day scores
were 183% and 288% higher than on the Conventional day (Table 1.5).

20
Figure 1.1 Average cognitive function scores and standard error bars by domain for the
Conventional, Green and two Green+ conditions, normalized to the Green condition by dividing
all scores by the average score during the Green condition.
The raw cognitive scores for each domain were normalized to the conventional condition
and modeled by study day controlling for participant (Table 1.5). The repeat simulation of the
Green+ day (Day 6), which was added to the study as a quality control measure, showed similar
cognitive function scores: p-values for the null hypothesis of no difference between the two days
ranging from 0.27 for Strategy (normalized scores of 3.77 and 3.98, respectively) to 0.73 for
Crisis Response (normalized scores of 2.35 and 2.27). The Green+ condition had statistically
significantly higher cognitive function scores than the Conventional condition in all domains
(p<0.0001). The Green condition had higher scores than the Conventional condition in all
domains, five of which were statistically significant.

21
Participants scored higher on the Green+ days than the Green day in eight of nine
domains, resulting in a 25% increase in scores on average when outdoor air ventilation rates
were increased. Cognitive scores were 20% higher on the Green+ days than the moderate CO2
day when CO2 levels were higher (p-value < 0.0001) and 5% higher on the moderate CO2 day
than the Green day when outdoor air ventilation was reduced (p-value = 0.12). These estimates
and p-values were produced by rerunning the “average” model in Table 1.5 with the Green
condition as the reference category (data not shown).
The model of the average scores in Table 1.5 has a high R2 value of 0.81 indicating that a
significant amount of the variability in cognitive scores is explained by these indoor environment
test conditions, leaving only 19% of the variability to be explained by all other potential intra-
personal drivers of cognitive function such as diet, previous night sleep quality, and mood. For
the specific domains of cognitive function, the R2 range from 0.03 to 0.79.

22
Table 1.5 Generalized additive mixed effect models testing the effect of IEQ condition and on cognitive scores, normalized to the 1
“Conventional” condition, treating participant as a random intercept. 2
Cognitive Domain: Estimate, [95% Confidence Interval], (p-value)
Condition Basic Activity
Level
Applied
Activity Level
Focused
Activity Level
Task
Orientation
Crisis
Response
Information
Seeking
Information
Usage
Breadth of
Approach Strategy Average
Green+
1.35 1.39 1.44 1.14 2.35 1.10 3.94 1.43 3.77 1.99
[1.28,1.43] [1.26,1.52] [1.27,1.62] [1.11,1.17] [1.91,2.78] [1.07,1.14] [3.47,4.41] [1.25,1.60] [3.40,4.14] [1.89,2.09]
(<0.0001) (<0.0001) (<0.0001) (<0.0001) (<0.0001) (<0.0001) (<0.0001) (<0.0001) (<0.0001) (<0.0001)
Moderate CO2
1.20 1.08 1.68 1.05 2.05 1.11 2.61 1.29 3.17 1.69
[1.13,1.27] [0.95,1.21] [1.51,1.85] [1.02,1.08] [1.63,2.48] [1.08,1.15] [2.15,3.07] [1.12,1.46] [2.81,3.53] [1.59,1.79]
(<0.0001) (0.23) (<0.0001) (0.0009) (<0.0001) (0.61) (<0.0001) (0.0013) (<0.0001) (<0.0001)
High CO2
0.91 0.88 0.85 1.00 1.33 1.08 1.01 0.98 0.83 0.99
[0.84,0.98] [0.75,1.01] [0.68,1.02] [0.97,1.03] [0.90,1.75] [1.05,1.12] [0.55,1.48] [0.81,1.15] [0.47,1.19] [0.89,1.09]
(0.015) (0.081) (0.087) (0.76) (0.14) (0.35) (<0.0001) (0.78) (0.36) (0.78)
Green
1.14 1.04 1.51 1.03 1.97 1.09 2.72 1.21 2.83 1.61
[1.06,1.21] [0.91,1.18] [1.34,1.68] [1.00,1.06] [1.54,2.40] [1.05,1.12] [2.26,3.19] [1.04,1.38] [2.46,3.19] [1.51,1.71]
(0.0003) (0.51) (<0.0001) (0.065) (<0.0001) (0.45) (<0.0001) (0.018) (<0.0001) (<0.0001)
Conventionala 1.00 1.00 1.00 1.00 1.00 1.00 1.00 1.00 1.00 1.00
Green+
1.37 1.33 1.52 1.15 2.27 1.11 4.04 1.50 3.98 2.03
[1.30,1.44] [1.20,1.46] [1.35,1.69] [1.12,1.19] [1.85,2.69] [1.08,1.15] [3.58,4.51] [1.33,1.67] [3.62,4.34] [1.93,2.13]
(<0.0001) (<0.0001) (<0.0001) (<0.0001) (<0.0001) (<0.0001) (<0.0001) (<0.0001) (<0.0001) (<0.0001)
R2 0.34 0.17 0.33 0.03 0.28 0.06 0.69 0.27 0.79 0.81
a Reference
3

1.3.2 Carbon Dioxide and Cognitive Function
The effect of CO2 on cognitive function scores, while holding all other parameters
constant, is depicted in Figure 1.2. Because the air in each room was not completely mixed, there
was some variability in CO2 levels between cubicles. Each line represents the change in an
individual’s CO2 exposure and cognitive scores from one condition to the next, normalized by
the average CO2 exposure across all participants during the Green+ conditions. For seven of the
nine cognitive function domains, average cognitive scores decreased at each higher level of CO2
(Table 1.5). Cognitive function scores were 15% lower for the moderate CO2 day (~945 ppm)
and 50% lower on the day with CO2 concentrations around 1400 ppm than on the two Green+
days (Table 1.5, dividing the average Green+ estimate by the moderate CO2 and high CO2
estimate respectively). The exposure-response between CO2 and cognitive function is
approximately linear across the concentrations used in this study; however, whether the largest
difference in scores is between the Green+ conditions and the moderate CO2 condition or the
moderate CO2 condition and the high CO2 condition depends on the domain (Figure 1.2).

24
Figure 1.2 Cognitive function scores by domain and participant, and corresponding carbon
dioxide concentration in their cubicle. Each line represents the change in an individual’s CO2
exposure and cognitive scores from one condition to the next, normalized by the average CO2
exposure across all participants during the Green+ conditions.

25
Ventilation rate, CO2, and TVOCs were modeled separately from study day to capture the
independent effect of each factor on cognitive function scores, averaged across all domains. A
statistically significant increase in scores was associated with ventilation rate, CO2 and TVOCs
(p<0.0001 for all three parameters). On average, a 400 ppm increase in CO2 was associated with
a 21% decrease, a 20 CFM increase in outdoor air per person was associated with an 18%
increase, and a 500 µg/m3 increase in TVOCs was associated with a 13% decrease in a typical
participant’s cognitive scores across all domains after adjusting for participant (data not shown).
While other environmental variables were not experimentally modified, some did vary over the
course of the study (Table 1.2). While there was a high degree of consistency in IEQ between the
two rooms, ozone was significantly higher in one of the chambers on the Green day. Cognitive
scores were 4% higher in the room with high ozone on this day, after accounting for baseline
cognitive performance in the two rooms. These IEQ parameters were added to the model with
the experimentally controlled variables and were not found to be significantly associated with
cognitive function at the 0.05 significance level.
1.4 Discussion
1.4.1 Green Buildings and Health
We found a significant increase in cognitive function scores when people spent a full day in a
Green building compared to an environment designed to simulate a Conventional building by
elevating VOC concentrations. The study was designed to represent typical conditions observed
in many buildings; we did not include extreme exposures or choose uncommon VOC sources.
Further, we selected our target levels of VOCs, ventilation rates and CO2 to be above and below
the standards in LEED®, ASHRAE, and EPA BASE study in order to evaluate how these

26
common standards and guidelines perform (USGBC 2014, ASHRAE 2013b, USEPA 1998). Our
findings indicate that there may be benefits to meeting the LEED® VOC guideline of 500 μg/m3
and enhancing ventilation rates beyond the minimum requirement under ASHRAE.
The “Conventional” building simulation parameters in our study were based on the
USEPA BASE study, which plausibly represent the upper end of performance for “typical”
buildings in the U.S. in the 1990s because the owners were willing to participate in the study,
introducing potential self-selection bias, and larger, “non-problem” buildings were preferentially
recruited (Persily 2004). Therefore, the extent to which BASE buildings represent typical
conventional buildings is unknown. Our findings show impacts above the 95th
percentile of CO2
(945 ppm) and the mean VOC concentration in the BASE study (450 μg/m3); however, a larger
proportion of the buildings in the BASE study would likely exceed these targets if “problem”
buildings were included in the recruitment process.
The VOC levels on the Conventional and Green/Green+ days straddle both the LEED®
TVOC guidance concentration of 500 µg/m3 and the BASE mean concentration of 450 µg/m
3. The
common VOC sources that were added to the rooms during the Conventional building day led to
increases in a range of VOCs. Previous testing with the SMS tool showed that two hours of
painting, which exposed participants to VOCs, was associated with reductions in 3 of the 5
domains investigated (Satish et al., 2013). The lower TVOC concentrations (yet larger number of
sources) in this study were associated with statistically significant decrements in decision-
making performance in 5 of the 9 domains.
1.4.2 Carbon Dioxide and Ventilation
Carbon dioxide concentration in indoor environments has long been used as an indicator
of ventilation and a proxy for indoor air quality (ASHRAE 2013). However, this conventional

27
thinking is being challenged as the evidence mounts for CO2 as a direct pollutant, not just a
marker for other pollutants (Satish et al. 2012). We found statistically significant declines in
cognitive function scores when CO2 concentrations were increased to levels that are common in
indoor spaces (approximately 950 ppm). In fact, this level of CO2 is considered acceptable
because it would satisfy ASHRAE’s ventilation rate guidance for acceptable indoor air quality.
Larger differences were seen when CO2 was raised to 1400 ppm.
Satish et al. used the SMS tool to test the effect of CO2 exposures on the cognitive
function of 22 participants, using a controlled chamber and injection of ultra-pure CO2 (Satish et
al. 2012). They reported impacts on 7 of 9 cognitive function domains with increasing CO2
concentrations. The SMS tool was also used to test the relationship between ventilation rate and
cognitive function among 16 participants (Maddalena et al. 2014). Participants scored
significantly lower on 8 of 9 domains at low ventilation rates (12.5 cfm of outdoor air/person). In
contrast to our current study, these studies had 1) a single experimental parameter; 2) half-day or
shorter exposures; 3) multiple experimental conditions per day; 4) atypical exposure targets
(2500 ppm of CO2 and 12.5 cfm outdoor air/person); and 5) primarily students and college-age
adults. Despite these differences, our study found similar changes in cognitive scores from a unit
change in CO2 or outdoor air ventilation. Associations were consistent a) in all three study
populations, indicating that knowledge workers and students are equally impacted by CO2 and
outdoor air ventilation, and b) at different exposure durations, indicating that even short
exposures are associated with cognitive function. Given the similarities in findings, there may
not be a desensitization or compensatory response from prolonged exposure. More research is
necessary to investigate the presence or lack of these responses.

28
The CO2 exposure levels used in this study are also comparable to those seen in a variety
of indoor locations. Assessment of public housing units in Boston found median CO2 levels to be
809 ppm in conventional apartments and 1204 ppm in the newly constructed LEED® platinum
apartments (Colton et al. 2014). Corsi et al. (2002) reported CO2 concentrations > 1000 ppm in
66% of 120 classrooms in Texas, and Shendell et al. (2004) measured CO2 concentrations >1000
ppm in 45% of 435 classrooms in Washington and Idaho, and reported that higher CO2
concentrations were associated with increases in student absences.
1.4.3 Strengths and Limitations
The study design has several notable strengths. These include: repeat measures of
cognitive function on the same individual for control of between-subject variability,
characterization of the TIEQ Lab for potential environmental confounders, repeat testing of the
same condition nine days apart on different days of the week, mid-week testing to avoid
potential Monday/Friday bias, participants and cognitive function analysts blinded to test
condition, and the use of an objective measure of cognitive function.
The SMS tool is an objective assessment tool, unlike self-reported metrics, and thus
less susceptible to the participant’s environmental perceptions. Extensive work has been
dedicated to testing the validity of the SMS software; correlations between scores on these tests
and other measures of productivity such as income at age and job level at age exceed 0.6
(Streufert et al. 1988). The correlations are stronger with the more strategic domains, such as
strategy, information usage, and crisis response, than domains pertaining to activity, such as
information search and activity level. The domains that were impacted the most by the exposures
in this study are the same ones that are the most closely related with other measures of
productivity (Streufert et al. 1988). Lastly, the close agreement in scores on the two Green+

29
conditions suggests that a) the study is internally valid, b) there are no learning effects associated
with the test, and c) day of the week (Tuesday v. Thursday) is not a potential confounding
variable.
The potential for confounding or effect modification by parameters measured or
otherwise is reduced by the use of the controlled environment and repeated measures on
each participant. By testing on subsequent days, it is possible that effects from one condition
were reflected in the scores on the next day. The environmental factors that were not
experimentally modified exhibited some variability due to changes in outdoor conditions and
participant behavior. In particular, ozone levels fluctuated significantly between some IEQ
conditions (Table 1.2). Environmental factors other than outdoor air ventilation, CO2 and VOCs
were not statistically significant predictors of cognitive scores, but this does not rule out the
possibility of uncontrolled confounding by these factors. The environmental conditions on each
of the study days met design criteria. During one day (Day 4), CO2 levels were lower in the
morning than the afternoon, which influenced the reported mean concentration. The CO2 levels
on this day were similar to the moderate CO2 and Conventional conditions (Day 5) during the
time leading up to and during the cognitive test (926 ppm from 2-5p.m.). This study used a
controlled environment to individually control certain contaminants. Assessments in actual
office environments are important to confirm the findings in a non-controlled setting.
1.5 Conclusion
Office workers had significantly improved cognitive function scores when working in Green and
Green+ environments compared to a Conventional one. Exposure to CO2 and VOCs at levels
found in Conventional office buildings was associated with lower cognitive scores compared to

30
levels in a Green building. Using low emitting materials, which is common practice in Green
buildings, reduces in-office VOC exposures. Increasing the supply of outdoor air not only lowers
exposures to CO2 and VOCs, but also exposure to other indoor contaminants. Green building
design that optimizes employee productivity and energy usage will require adopting energy
efficient systems and informed operating practices to maximize the benefit to human health
while minimizing energy consumption. This study was designed to reflect indoor office
environments in which large numbers of the population work every day. These exposures should be
investigated in other indoor environments, such as homes, schools and airplanes, where
decrements in cognitive function and decision-making could have significant impacts on
productivity, learning and safety.
31
References
Allen J, MacNaughton P, Laurent J, Flanigan S, Eitland E, and J Spengler. 2015. Green
Buildings and Health. Current Environmental Health Reports. 2(3): 250-258.
ACGIH. 2015. Guide to Occupational Exposure Values. American Conference of Governmental
Industrial Hygienists (ACGIH). Cincinnati, OH.
ASHRAE. 2013. 2013 ASHRAE Handbook—Fundamentals [SI Edition]. Atlanta, GA:
American Society of Heating, Refrigerating, and Air-Conditioning Engineers, Inc.
ASHRAE Standard 62.1-2013. 2013. Ventilation for Acceptable Indoor Air Quality. Atlanta, GA:
American Society of Heating, Refrigerating and Air-Conditioning Engineers, Inc.
Allen J, MacIntosh D, Saltzman L, Baker B, Matheson J, Recht J, Minegishi T, Fragala M, Myatt
T, Spengler J, Stewart J, McCarthy J. 2011. Elevated Corrosion Rates and Hydrogen
Sulfide in Homes with ‘Chinese Drywall’. Science of the Total Environment, 426: 113-
119.
Breuer K, & Satish U. 2003. Emergency Management Simulations: An Approach to the
Assessment of Decision-making Processes in Complex Dynamic Crisis Environments. In
N. A. Press (Ed.), From Modeling to Managing Security: A Systems Dynamics Approach
(J.J. G, ed). (pp. 145–156). Norway.
Colton M, MacNaughton P, Vallarino J, Kane J, Bennett-Fripp M, Spengler J, & Adamkiewicz G.
2014. Indoor Air Quality in Green Vs Conventional Multifamily Low- Income Housing.
Environmental Science & Technology, 48(14), 7833-7833.
Corsi RL, Torres VM, Sanders M, & Kinney KA. 2002. Carbon dioxide levels and dynamics in
elementary schools: results from the TESIAS study. Proceedings from Indoor Air 2002,
vol. 1.
Fisk WJ, & Rosenfeld AH. 1997. Estimates of Improved Productivity and Health from Better
Indoor Environments. Indoor Air, 7(3), 158-172. doi: 10.1111/j.1600-0668.1997.t01-1-
00002.x
Hedge A & Gaygen DE. 2010. Indoor Environment Conditions and Computer Work in an
Office. HVAC&R Research Journal, 16 (2), 123-138.
Hedge A. 2009. Indoor Environmental Quality, Health and Productivity. Environmental
Research Journal, 4 (1/2).
Jacobs DE, Ahonen E, Dixon SL, Dorevitch S, Breysse J, Smith, J, Levavi P. 2014. Moving Into
Green Healthy Housing. Journal of Public Health Management and Practice, 1. doi:
10.1097/PHH.0000000000000047

32
Maddalena R, Mendell M, Eliseeva K, Chan W, Sullivan D, Russell M, Satish U, Fish w. 2014
Effects of ventilation rate per person and per floor area on perceived air quality, sick
building syndrome symptoms, and decision-making. Indoor Air. doi: 10.1111/ina.12149
Mendell, MJ. 1993. Non‐Specific Symptoms In Office Workers: A Review And Summary Of
The Epidemiologic Literature. Indoor Air, 3(4), 227-236. doi: 10.1111/j.1600-
0668.1993.00003.x
Nishihara N, Wargocki P, Tanabe S. 2014. Cerebral blood flow, fatigue, mental effort, and task
performance in offices with two different pollution loads. Building and Environment 71:
153-164. DOI: 10.1016/j.buildenv.2013.09.018
Noris F, Adamkiewicz G, Delp W, Hotchi T, Russell M, Singer BC, Fisk WJ. 2013. Indoor
environmental quality benefits of apartment energy retrofits. Building and Environment,
68, 170-178. doi: 10.1016/j.buildenv.2013.07.003
NRC. 2007. Green schools attributes for health and learning. Washington, DC.
Persily A and Gorfain J. 2004. “Ventilation data from the Environmental Protection Agency
Building Assessment Survey and Evaluation (BASE) Study.” National Institute of
Standards and Technology, U.S. Department of Commerce. NISTIR 7145.
Persily A. 2015. Challenges in developing ventilation and indoor air quality standards: The story
of ASHRAE Standard 62. Building and Environment, 91, 61-69.
Riesenberg DE, Arehart-Treichel J. 1986. "Sick building" syndrome plagues workers, dwellers.
JAMA 255:3063-3063.
Satish U, Cleckner L, & Vasselli J. 2013. Impact of VOCs on decision making and productivity.
Intelligent Buildings International, 5(4), 213-220. doi: 10.1080/17508975.2013.812956
Satish U, Mendell MJ, Shekhar K, Hotchi T, Sullivan D, Streufert S, & Fisk, WJ. 2012. Is CO2 an
indoor pollutant? Direct effects of Low-to-moderate CO2 concentrations on human
decision-making performance. Environmental Health Perspectives, 120(12), 1671.
Satish U, Streufert S, Dewan M, & Voort S. 2004. Improvements in Simulated Real-world
Relevant Performance for Patients with Seasonal Allergic Rhinitis: Impact of Desloratadine. Allergy, 59(4), 415-420.
Shendell DG, Prill R, Fisk WJ, Apte MG, Blake D & Faulkner D. 2004. Associations between
classroom CO2 concentrations and student attendance in Washington and Idaho. Indoor
Air, 14, 333-341.

33
Singh A, Syal M, Grady SC, & Korkmaz S. 2010. Effects of green buildings on employee health
and productivity. American journal of public health, 100(9), 1665. doi: 10.2105/AJPH.2009.180687
Streufert S & Swezey R. 1986. “Complexity, managers, and organizations.” Organizational and
occupational psychology, Development Psychology Series. Academic Press. ISBN:
0126733708, 9780126733709.
Streufert S, Pogash R, & Piasecki M. 1988. Simulation-based assessment of managerial
competence: reliability and validity. Personnel Psychology, 41(3), 537-557. doi:
10.1111/j.1744-6570.1988.tb00643.x
Streufert S, Pogash RM, Gingrich D, Kantner A, Lonardi L, Severs W, Roache J. 1993. Alcohol
and Complex Functioning. Journal of Applied Social Psychology, 23(11), 847-866. doi:
10.1111/j.1559-1816.1993.tb01009.x
U.S. Green Building Council (USGBC). 2014. LEED v4 - User Guide. Washington D.C.
http://www.usgbc.org/resources/leed-v4-user-guide
U.S. Environmental Protection Agency (USEPA). 1998. Building Assessment Survey and
Evaluation. Retrieved 1/22, 2015, from http://www.epa.gov/iaq/base/study_overview.html

34
CHAPTER 2 - Economic, Environmental and Health Implications of Enhanced Ventilation
in Office Buildings
Piers MacNaughton 1,
*, James Pegues 2, Usha Satish
3, Suresh Santanam
4, John Spengler
1 and
Joseph Allen 1
1 Department of Environmental Health, Harvard T.H. Chan School of Public Health,
Landmark 409 West, 401 Park Drive Boston, MA 02115, USA;
E-Mails: [email protected] (J.S.); [email protected] (J.A.)
2 United Technologies Climate, Controls & Security, Syracuse, NY 13221, USA;
E-Mail: [email protected]
3 Psychiatry and Behavioral Sciences, SUNY-Upstate Medical School, Syracuse, NY 13210,
USA; E-Mail: [email protected]
4 Industrial Assessment Center, Biomedical and Chemical Engineering Department, Syracuse
University, Syracuse, NY 13210, USA; E-Mail: [email protected]

35
Abstract
Introduction: Current building ventilation standards are based on acceptable minimums. Three
decades of research demonstrates the human health benefits of increased ventilation above these
minimums. Recent research also shows the benefits on human decision-making performance in
office workers, which translates to increased productivity. However, adoption of enhanced
ventilation strategies is lagging. We sought to evaluate two of the perceived potential barriers to
more widespread adoption—Economic and environmental costs.
Methods: We estimated the energy consumption and associated per building occupant costs for
office buildings in seven U.S. cities, representing different climate zones for three ventilation
scenarios (standard practice (20 cfm/person), 30% enhanced ventilation, and 40 cfm/person) and
four different heating, ventilation and air conditioning (HVAC) system strategies (Variable Air
Volume (VAV) with reheat and a Fan Coil Unit (FCU), both with and without an energy
recovery ventilator). We also estimated emissions of greenhouse gases associated with this
increased energy usage, and, for comparison, converted this to the equivalent number of vehicles
using greenhouse gas equivalencies. Lastly, we paired results from our previous research on
cognitive function and ventilation with labor statistics to estimate the economic benefit of
increased productivity associated with increasing ventilation rates.
Results: Doubling the ventilation rate from the American Society of Heating, Refrigeration and
Air-Conditioning Engineers minimum cost less than $40 per person per year in all climate zones
investigated. Using an energy recovery ventilation system significantly reduced energy costs,
and in some scenarios led to a net savings. At the highest ventilation rate, adding an ERV
essentially neutralized the environmental impact of enhanced ventilation (0.03 additional cars on
the road per building across all cities). The same change in ventilation improved the performance

36
of workers by 8%, equivalent to a $6500 increase in employee productivity each year. Reduced
absenteeism and improved health are also seen with enhanced ventilation.
Conclusions: The health benefits associated with enhanced ventilation rates far exceed the per-
person energy costs relative to salary costs. Environmental impacts can be mitigated at regional,
building, and individual-level scales through the transition to renewable energy sources, adoption
of energy efficient systems and ventilation strategies, and promotion of other sustainable
policies.
Keywords: green buildings; energy and environmental costs; health; productivity

37
2.1 Introduction
Buildings account for 41% of US energy consumption, with nearly half of that energy usage
coming from the commercial sector [1]. In office buildings, over half of the end-use energy
expenditures are attributable to heating, ventilating, and cooling [2]. The environmental impact of
these energy expenditures has been well documented; greenhouse gases emitted during power
production are associated with climate change impacts including rising sea level, extreme
temperatures, and more frequent weather events [3,4]. Emissions of sulfur dioxide (SO2)
contribute to acid rain, which can damage sensitive ecosystems [5]. More important, however,
are the downstream human health effects related to these environmental impacts. Elevated
temperatures and droughts will increase the likelihood of heat-related illness and mortality [6].
Extreme weather effects also pose health and economic risks, especially in developing regions
[7]. Emissions from power plants also have several direct health effects: (1) exposure to
particulate matter, in particular SO2, increases the risk of respiratory and cardiovascular disease
and (2) nitrogen oxides (NOx) cause airway inflammation and respiratory symptoms, especially
in asthmatics [8,9].
At the building level, buildings managers are incentivized to reduce costs, which often is
achieved by reducing ventilation rates. Similar incentives are not set for optimizing the health
performance of buildings as occupant health is more difficult to characterize. Further, building
managers tend to overestimate the energy costs related to ventilation. When asked the cost per
occupant to double the ventilation rate from 20 cfm/person to 40 cfm/person and improve
filtration from a minimum efficiency reporting value (MERV) 6 to a MERV 11 filter, building
managers reported a perceived cost per occupant of $100 while the modeled estimates were
consistently below $32 per occupant for all climate zones [10]. Consultants, tenants and owners

38
also overestimated the costs of improved ventilation per occupant at $60, $115, and $80,
respectively. Owners and building managers believe that tenants do not consider indoor air
quality (IAQ) when leasing a space: 58% of respondents reported that 20% or less of their
tenants take IAQ into consideration [10]. As a result, the cost of energy is often prioritized over
IAQ and minimum required ventilation rates are met.
The guidelines that buildings operate under are by definition minimally acceptable.
ASHRAE defined its original ventilation Standard 62 as “the minimum and recommended air
quantities for the preservation of the occupants’ health, safety and well-being” [11]. In the initial
standard, the minimum ventilation requirement was 10 cfm/person. Sick building syndrome
(SBS) was first reported around the time of early standard adoption and coincided with improved
sealing of building envelopes; occupants of poor performing buildings started reporting a wide
range of symptoms including respiratory irritation, allergies, and headaches, which were later
linked to the buildup of biological and chemical pollutants in the indoor environment [12].
In response, ASHRAE has since increased minimum acceptable ventilation rates under
Standard 62.1 to approximately 20 cfm/person depending on the size and occupancy of the
rooms within the building [13]. SBS symptoms and productivity losses have still been observed
at this ventilation rate compared to higher ventilation rates. The prevalence of many SBS
symptoms, such as throat/mouth dryness, feeling generally bad or good, and difficultly thinking,
are reduced at ventilation rates above 20 cfm/person [14]. Recent research by our team also show
cognitive improvements at 40 cfm/person compared to 20 cfm/person [15]. Absenteeism,
productivity losses, and healthcare costs due to ventilation are estimated to have annual
economic impacts in the hundreds of billions of dollars in the U.S. [16]. According to this

39
analysis, a 5% change in productivity is equivalent to $125 billion in economic value based on
the annual GNP of U.S. office workers, which is equivalent to $186 billion in 2015 dollars.
Sustainable or “green” design has sought improve occupant wellbeing in buildings while
also reducing their environmental footprint. In 1990, Building Research Establishment
Environmental Assessment Methodology (BREEAM) was founded as an international
certification agency for green buildings. Three years later the Leadership in Energy and
Environmental Design (LEED) rating system was established with a similar concept, focusing on
U.S. buildings. Both agencies utilize design credits, which are subdivided into various sections,
such as energy, water, and waste. Within each section there are required credits, which typically
conform to local standards and guideline, and optional credits. To achieve a certain ranking,
designers and architects can choose which optional credits to pursue. For example, LEED offers
optional credits for both energy efficiency and increasing ventilation by 30%. In practice, the
energy efficiency credits are preferentially chosen: only 40% of the new construction and 23% of
the existing buildings rated under LEED v2009 obtained the enhanced ventilation credit. With
advances in HVAC equipment such as energy recovery ventilators (ERVs), which significantly
reduce energy use, it is possible to obtain credits for both energy efficiency and enhanced
ventilation.
There is currently a lack of consensus about whether the energy costs and environmental
impacts of increased ventilation outweigh the resulting health and productivity benefits. The
burden of all four of these factors is estimated in a standard office building at 20 cfm/person (9.4
l/s/p), 27.6 cfm/person (13.0 l/s/p) (the ventilation rate to obtain the enhanced ventilation credit with
LEED), and 40 cfm/person (18.8 l/s/p). We also test the effect of adding ERV to the higher

40
ventilation scenarios. We then compare these scenarios to place the energy, environmental, health,
and productivity factors into context.
2.2 Methods
2.2.1. Estimating Economic Costs of Enhanced Ventilation
Energy cost consequences are a function of local climate; local utility prices; building type, use
and design; local building code requirements; ventilation rate; and HVAC system design. We
used Carrier’s Hourly Analysis Program (HAP) to first calculate the annual energy consumption
in kWh for fans, motors, pumps and chillers, plus natural gas in MCF (the volume of 1000 cubic
feet (cf) of natural gas) for the hot water boilers for a range of scenarios, described in the
following paragraphs. Energy use data was converted to kBtu/year (thousand Btu/year) so
electric and gas consumption could be combined into a single value. Second, we estimated the
annual per building occupant energy costs, in US dollars, associated with these energy costs
based on local utility prices (Table 2.1) [17].
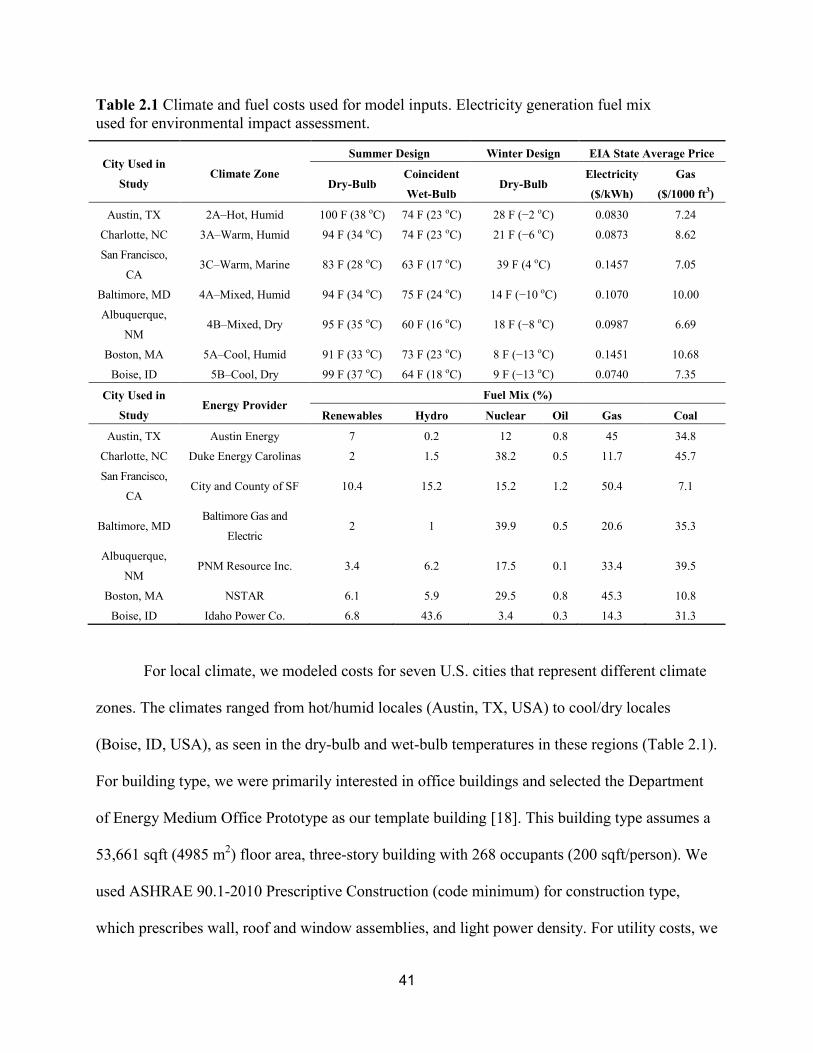
41
Table 2.1 Climate and fuel costs used for model inputs. Electricity generation fuel mix
used for environmental impact assessment.
City Used in
Study Climate Zone
Summer Design Winter Design EIA State Average Price
Dry-Bulb Coincident
Wet-Bulb Dry-Bulb
Electricity
($/kWh)
Gas
($/1000 ft3)
Austin, TX 2A–Hot, Humid 100 F (38 oC) 74 F (23 oC) 28 F (−2 oC) 0.0830 7.24
Charlotte, NC 3A–Warm, Humid 94 F (34 oC) 74 F (23 oC) 21 F (−6 oC) 0.0873 8.62
San Francisco,
CA 3C–Warm, Marine 83 F (28 oC) 63 F (17 oC) 39 F (4 oC) 0.1457 7.05
Baltimore, MD 4A–Mixed, Humid 94 F (34 oC) 75 F (24 oC) 14 F (−10 oC) 0.1070 10.00
Albuquerque,
NM 4B–Mixed, Dry 95 F (35 oC) 60 F (16 oC) 18 F (−8 oC) 0.0987 6.69
Boston, MA 5A–Cool, Humid 91 F (33 oC) 73 F (23 oC) 8 F (−13 oC) 0.1451 10.68
Boise, ID 5B–Cool, Dry 99 F (37 oC) 64 F (18 oC) 9 F (−13 oC) 0.0740 7.35
City Used in
Study Energy Provider
Fuel Mix (%)
Renewables Hydro Nuclear Oil Gas Coal
Austin, TX Austin Energy 7 0.2 12 0.8 45 34.8
Charlotte, NC Duke Energy Carolinas 2 1.5 38.2 0.5 11.7 45.7
San Francisco,
CA City and County of SF 10.4 15.2 15.2 1.2 50.4 7.1
Baltimore, MD Baltimore Gas and
Electric 2 1 39.9 0.5 20.6 35.3
Albuquerque,
NM PNM Resource Inc. 3.4 6.2 17.5 0.1 33.4 39.5
Boston, MA NSTAR 6.1 5.9 29.5 0.8 45.3 10.8
Boise, ID Idaho Power Co. 6.8 43.6 3.4 0.3 14.3 31.3
For local climate, we modeled costs for seven U.S. cities that represent different climate
zones. The climates ranged from hot/humid locales (Austin, TX, USA) to cool/dry locales
(Boise, ID, USA), as seen in the dry-bulb and wet-bulb temperatures in these regions (Table 2.1).
For building type, we were primarily interested in office buildings and selected the Department
of Energy Medium Office Prototype as our template building [18]. This building type assumes a
53,661 sqft (4985 m2) floor area, three-story building with 268 occupants (200 sqft/person). We
used ASHRAE 90.1-2010 Prescriptive Construction (code minimum) for construction type,
which prescribes wall, roof and window assemblies, and light power density. For utility costs, we

42
utilized the state average utility prices for each city in the model, using the Energy Information
Administration electric and gas prices as of the date of this study.
For ventilation rate we modeled three rates, starting with the baseline condition as the
ASHRAE Standard 62–2001 default minimum ventilation rate of 20 cfm/person of outdoor air.
The 2001 edition of the standard was chosen for the baseline to be representative of existing
building stock. Second, we calculated the outdoor airflow rate for the template building to obtain
the LEED enhanced ventilation credit. The credit requires a ventilation rate 30% higher than
ASHRAE Standard 62.1-2010, which is dependent on the occupancy and floor area of the
building. For the template building this yields an approximate ventilation rate of 27.6
cfm/person. Last, we modeled the costs of enhancing ventilation to a doubling of the ASHRAE
Standard 62-2001 minimum (40 cfm/person) based on findings of significant health and
productivity benefits reported for this ventilation rate.
For the HVAC strategy, we used two air distribution systems that are typical for office
buildings—variable air volume (VAV) and fan coil unit (FCU) systems. Both VAV and FCU are
mature technologies with equal adoption by new and old buildings. For each system, we also
evaluated the energy costs with and without an ERV to determine if an ERV mitigates the effects
of increased ventilation rates.
A schematic of a typical VAV reheat system is provided in the Supplemental Information
(Figure 2.1). This is a common HVAC application for offices that use a central station VAV air
handling unit (AHU). Cooling is supplied to the AHU by an air-cooled chiller plant and heating
is provided by a hot-water plant. Even in existing buildings, this HVAC system is capable of
being modified to adjust the ventilation rate to 40 cfm/person, though an increase in chiller,
boiler and/or AHU capacity may be required.

43
Figure 2.1 Schematics of a) a variable air volume ventilation system and b) a fan coil unit
ventilation system.
The second system we evaluated is 4-pipe fan coils (FCU) with a dedicated outdoor air
system (DOAS) (Figure 2.1). This HVAC system is also a common application for office
buildings. The DOAS conditions outdoor ventilation air and supplies it to the FCUs, which
provide cooling and heating to rooms in the building. Similar to the VAV-reheat system, cooling is
provided by an air-cooled chiller plant and heating is provided by a hot water plant. A limitation
of the DOAS system is that it is designed for a certain ventilation rate (e.g., 20 cfm/person) and
cannot readily accommodate significantly increased ventilation rates. The FCU system also has
larger baseline energy costs compared to the VAV system for this building case study.

44
An ERV is a device that utilizes the energy in exhaust air from the building to heat or
cool outdoor ventilation air entering the building. During heating seasons the exhaust air preheats
and humidifies outside air, while the opposite happens during cooling seasons. This transfer of
both sensible and latent heat saves energy that otherwise would be exhausted from the building,
which reduces the energy that needs to be supplied by other elements of the HVAC system to
maintain a specific set temperature and humidity.
For all scenarios, thermostat set points of 75 °F (23.9 °C) for cooling and 70 °F (21.1 °C)
for heating with nighttime setbacks to 80 °F (26.7 °C) for cooling and 65 °F (18.3 °C) for
heating. Humidity was not actively controlled in the model, but typically fell in the 40%–50%
range for variable air volume (VAV) systems and 45%–60% range for fan coil unit (FCU)
systems. The potential influence of this variability in humidity on cognitive function was not
investigated.
2.2.2. Estimating Environmental Effects of Enhanced Ventilation
We used the energy usage estimates in the first part of the analysis described previously
and the U.S. Environmental Protection Agency’s (EPA) Power Profiler to calculate the emissions
for each scenario for the following air pollutants: nitrogen oxides (NOx), sulfur dioxide (SO2),
and carbon dioxide (CO2). We used the most centralized zip code and most prevalent energy
provider in each of the seven modeled cities. To provide another point of comparison, we also
converted the energy usage information into emission equivalencies using EPA’s Greenhouse
Gas Equivalencies Calculator.
We estimated the emissions equivalent for the building energy consumption in terms of
passenger vehicles per year. Passenger vehicles are defined as 2-axle 4-tire vehicles, including
passenger cars, vans, pickup trucks, and sport/utility vehicles. In 2011, the weighted average

45
combined fuel economy of cars and light trucks combined was 21.4 miles per gallon (9.1 km/L)
[19]. The average vehicle miles traveled in 2011 was 11,318 miles (18,215 km) per year. In
2011, the ratio of CO2 emissions to total greenhouse gas emissions (including carbon dioxide,
methane, and nitrous oxide, all expressed as carbon dioxide equivalents) for passenger vehicles
was 0.988 [20]. The amount of carbon dioxide emitted per gallon of motor gasoline burned is
8.89 × 10⁻³
metric tons [21].
2.2.3. Estimating Health Benefits of Enhanced Ventilation
In a previous study of ventilation and cognitive function by our study team, 24
participants were exposed to 20 and 40 cfm of outdoor air per person on different study days
[15]. At the end of each study day, they completed the Strategic Management Simulation (SMS)
cognitive test, which measures decision-making performance across nine domains: basic, applied
and focused activity level, task orientation, crisis response, information seeking and usage,
breadth of approach and strategy. In this current paper, we used the participants’ scores from our
previous study and plotted them against normative data of 70,000 previous SMS test takers to see
the percentile shift from one ventilation condition to the next (Figure 2.2).

46
Figure 2.2 Average cognitive performance on the SMS tool of 24 participants in a
green building at 20 and 40 cfm/person of outdoor air relative to normative data from
~70,000 people.
Data on salaries for various occupations was obtained from the Bureau of Labor Statistics
(BLS). The 10th, 25th, 50th, 75th and 90th percentile salaries for management, business and
financial operations, office and administrative support, computer and mathematical, architecture
and engineering, legal, and sales occupations from May 2014 were used for analyses [22]. These
occupation groups were selected to represent the U.S. office workforce and accounts for 57
million of the 135 million employments listed by BLS. Using averages weighted by the number
of employments in each occupation group, mean salaries were computed for each percentile. The
90th
percentile was missing for management and legal occupations so it was excluded from
subsequent analyses. These salaries were plotted and regressed using an exponential function
(Figure 2.3).

47
2.3 Results
2.3.1. Energy Costs and Environmental Effects of Enhanced Ventilation
Energy costs are influenced by factors such as local climate, local fuel prices, building type, use,
and design, ventilation rate and HVAC system. The modeled energy costs of enhanced
ventilation are summarized in Table 2.2. Increasing ventilation rates 30% above the ASHRAE
standard only costs $15 per occupant per year in Boston (cool, humid) and only $4–$7 per
occupant per year in Albuquerque (mixed, dry) (results for other cities across the U.S. fall within
this range). For a doubling of this minimum standard to 40 cfm/person, the costs for Boston and
Albuquerque are $40 and $20 per occupant per year, respectively.
Adding an ERV to the system largely mitigates the energy costs of increasing ventilation.
The ERV reduces the anticipated increase in energy costs by 60% when increasing ventilation to
40 cfm/person. At 30% above the ASHRAE standard, the ERV actually lead to cost reductions in
three of the seven cities compared to the 20 cfm/person condition for VAV, and seven of seven
for FCU (Table 2.2). San Francisco is a notable exception. San Francisco has moderate year-
round temperatures. When an ERV is added, fan energy increases because fans must work harder
to overcome the resistance to air flow through the ERV. In most locations this fan energy
increase is offset by larger reductions in cooling and heating energy. For San Francisco, which
also has high electricity costs compared to gas costs, the cooling and heating energy reductions
are smaller than the fan energy increase, so the net effect of adding an ERV is a small energy
cost increase. The FCU system has higher baseline energy costs and is typically more susceptible
to ventilation changes, but it also is more affected by the addition of an ERV. As ventilation rates
increase with the ERV in place, the FCU energy costs approach that of the VAV system (Table
S1).

48
Table 2.2 Change in energy cost per occupant per year compared to conventional.
Ventilation Rate Austin Charlotte San
Francisco Baltimore Albuquerque Boston Boise
Variable Air Volume
20 cfm/person $0.00 $0.00 $0.00 $0.00 $0.00 $0.00 $0.00
27.6 cfm/person $7.14 $7.29 $4.58 $10.42 $4.16 $12.03 $6.57
27.6 cfm/person +
ERV −$0.58 $0.42 $6.59 −$1.53 $3.77 −$0.82 $0.15
40 cfm/person $23.07 $23.24 $15.73 $32.36 $14.34 $37.27 $20.78
40 cfm/person +
ERV $9.37 $10.55 $17.44 $11.21 $10.05 $14.06 $7.83
Fan Coil Unit
20 cfm/person $0.00 $0.00 $0.00 $0.00 $0.00 $0.00 $0.00
27.6 cfm/person $7.31 $8.63 $8.69 $12.35 $7.77 $15.19 $9.19
27.6 cfm/person +
ERV −$0.18 −$3.46 −$0.05 −$7.29 −$0.72 −$8.35 −$6.77
40 cfm/person $19.20 $22.70 $22.94 $32.42 $20.41 $39.87 $24.13
40 cfm/person +
ERV $8.32 $5.18 $10.22 $4.01 $7.88 $5.81 $1.00
The environmental impacts follow a similar trajectory as the energy costs. The
environmental footprint of buildings can be reduced in five of the cities by increasing ventilation
by 30% while simultaneously adding an ERV (Table 2.3). The cities with the largest percentage
increase in CO2, SO2 and NOx emissions are the ones with the lowest baseline energy usage. For
example, San Francisco uses 44% less energy during the 20 cfm/person scenario than other cities
(Table S2). The large percentage increase in energy usage at 40 cfm/person actually amounts to a
small increase in emissions. At 40 cfm/person, these emissions correspond to between 6.2 and
18.9 additional cars on the road per year. Adding an ERV significantly reduces the number of
additional cars (Table 2.4). At the highest ventilation rate, adding an ERV essentially neutralizes
the environmental impact of enhanced ventilation (0.03 additional cars on the road per building
across all cities). This is driven primarily by the benefits seen in buildings with FCU systems.

49
Table 2.3 Percent increase in annual CO2, SO2 and NOx emissions compared to conventional.
Ventilation Rate Austin Charlotte San
Francisco Baltimore Albuquerque Boston Boise
Variable Air Volume
20 cfm/person 0% 0% 0% 0% 0% 0% 0%
27.6 cfm/person 14% 18% 25% 21% 17% 23% 21%
27.6 cfm/person +
ERV −1% −2% 17% −8% 0% −10% −7%
40 cfm/person 45% 55% 81% 63% 56% 67% 64%
40 cfm/person +
ERV 17% 19% 61% 13% 18% 11% 13%
Fan Coil Unit
20 cfm/person 0% 0% 0% 0% 0% 0% 0%
27.6 cfm/person 14% 16% 21% 18% 17% 19% 18%
27.6 cfm/person +
ERV −11% −19% −34% −23% −21% −26% −24%
40 cfm/person 36% 43% 56% 47% 44% 49% 46%
40 cfm/person +
ERV 0% −8% −23% −12% −10% −15% −14%
These results are dependent on the fuel mix in each city. Cities that rely primarily on
combustion-based energy sources have larger environmental impacts. For example, 58% of the
energy in Boise comes from renewables, hydro, or nuclear sources, compared to only 27.6% in
Albuquerque (Table 2.1). The template building in Boise under 20 cfm/person of ventilation
contributes to 3% less CO2 emissions than Albuquerque despite using 36% more energy on
heating, cooling and ventilation each year.

50
Table 2.4 Number of additional cars per year on the road per building compared to conventional.
Ventilation Rate Austin Charlotte San
Francisco Baltimore Albuquerque Boston Boise
Variable Air Volume
20 cfm/person 0.0 0.0 0.0 0.0 0.0 0.0 0.0
27.6 cfm/person 4.6 5.1 1.9 6.3 4.6 5.3 5.5
27.6 cfm/person +
ERV −0.5 −0.6 1.3 −2.5 0.0 −2.4 −1.7
40 cfm/person 14.5 15.7 6.2 18.8 14.6 15.6 16.7
40 cfm/person +
ERV 5.6 5.6 4.7 3.9 4.7 2.6 3.5
Fan Coil Unit
20 cfm/person 0.0 0.0 0.0 0.0 0.0 0.0 0.0
27.6 cfm/person 5.0 5.9 3.5 7.2 6.6 6.1 6.7
27.6 cfm/person +
ERV −4.0 −6.9 −5.3 −9.2 −8.2 −8.2 −9.1
40 cfm/person 13.2 15.5 9.0 18.9 17.3 15.8 17.6
40 cfm/person +
ERV 0.1 −3.0 −3.6 −4.8 −4.0 −4.7 −5.2
2.3.2. Productivity Gains from Enhanced Ventilation
Figure 2.2 depicts the cognitive performance of the participants in our previous research
on ventilation and decision-making performance [15]. These office workers performed above
average in all domains. When ventilation was increased from 20 cfm/person to 40 cfm/person
(the Green and Green + IEQ conditions respectively from that study), the participants increased
from the 62nd percentile to the 70th percentile on average across all domains. Larger impacts
were seen in basic activity, information usage, breadth of approach, strategy and crisis response
than the other domains. When these percentiles were compared to the distribution of office
worker salaries, they corresponded to a salary of $57,660 and $64,160 respectively, a difference
of $6500 (Figure 2.3). When the occupational data was subsetted to management occupations,
the difference in salaries at these percentiles was $15,500.

51
Figure 2.3 Observed salaries from the Bureau of Labor Statistics for common office
occupations, regressed with an exponential function. This equation was used to interpolate
salaries at the cognitive testing percentiles.
2.4 Discussion
Our motivation for this analysis stemmed from the observation that the public health benefits of
enhanced ventilation have been researched and described for several decades, and our own recent
research observed significant improvements in decision-making performance for office workers
with enhanced ventilation, yet when we reviewed the prevalence of the selection of the enhanced
ventilation credit in the leading green building rating system (LEED), we found that enhanced
ventilation credit was pursued in only 40% of new buildings and 23% of existing buildings [15].
We hypothesized that one of the key barriers to more widespread adoption was the
corresponding energy costs associated with increasing ventilation rates.
We found that the additional costs per occupant for enhancing ventilation rates were quite
low; too low, in fact, to be a barrier for more widespread adoption. These costs are trivial (less

52
than $40/year in the worst case scenario) when compared to the large improvements in cognitive
function (greater than $6000/year) from increased ventilation. In our analysis, we examined the
impact of including an ERV to offset energy usage and costs. As expected, energy usage costs
dropped significantly with the use of these ERV systems in all U.S. cities. Most importantly,
enhancing ventilation to 30% above the minimum, when paired with an ERV, led to cost savings
in three of the seven cities in our model for VAV and seven of seven for FCU.
These findings are in agreement with Hamilton et al. that estimated annual costs from
enhanced ventilation to be < $32 per person per year. In addition, they found cost perception may
be a barrier to enhancing ventilation, despite the analysis that shows the actual costs to be low
[10]. While the costs are low compared to productivity benefits, they do comprise a significant
portion of building management budgets. The split incentive system, whereby building managers
are responsible for energy costs while tenants are responsible for the cost of their employees, is a
barrier to adoption as tenants cannot simply implement ventilation changes themselves. In
addition, the health benefits of enhanced ventilation are not well-understood by most tenants as
of yet.
The environmental costs represent another potential barrier to adoption of higher
ventilation rates. While these costs are real, especially when magnified by all buildings in the
U.S., the per building environmental impact on greenhouse gas emissions is not as impactful as
the estimated benefits. These environmental impacts can be offset at three levels: individual,
building, and system level. Pursuing other design features that promote alternative transportation
options for individuals can reduce the environmental impacts from the building overall
(incentivizing biking, preferred parking for electric cars, public transportation access). On a
building-level, similar to the energy cost analysis, when ERVs are used the overall effect can be

53
a net reduction in greenhouse gas emissions for the building. The environmental impacts can be
reduced further through the use of more energy efficient HVAC systems, and, in new buildings,
incorporation of advanced air distribution systems that deliver ventilation when and where it is
needed to raise the effective ventilation per person, as opposed to the current approach of whole-
building ventilation [23]. Last, on a systems-level, in cities with a greater percentage of use of
non-combustion energy sources there is a lower environmental cost associated with enhancing
ventilation.
The energy and environmental impacts are offset by the dramatic positive impacts that
enhanced ventilation has on human health and productivity. In our recent study of office
workers, when we mapped raw test scores onto normative data we found an eight percentile
increase in decision-making performance when ventilation was increased from 20 cfm/person to
40 cfm/person, corresponding to a $6500 change in a typical office worker’s productivity. This is
a conservative estimate of productivity gains and economic costs. First, the analysis in this paper
only investigates cognitive impacts while in the office. The impacts of ventilation on other
domains of health are well documented in the literature and lead to significant economic costs
[24]. The risk of sick leave, illness, influenza and pneumonia are all elevated at lower ventilation
rates and have additional productivity impacts (Table 2.5).

54
Table 2.5 Health impacts of ventilation rate in medium office prototype building (adapted
from Fisk et al. [24]).
Reference Outcome Ventilation Rate (cfm/Person)
Relative Risk Low High
Milton et al. [25] Short term sick leave 12.9 25.8 1.5
Brundage et al. [28] Illness all years 4.5 30 1.5
Brundage et al. [28] Illness 1983 data 4.5 30 1.9
Drinka et al. [29] Illness 48 120 2.2
Drinka et al. [29] Influenza 48 120 4.7
Knibbs et al. [30] Influenza 15 45 3.1
Knibbs et al. [30] Rhinovirus 15 45 2.1
Knibbs et al. [30] TB 15 45 3.3
Hoge et al. [31] Pneumonia 20.4 30 2.0
Stenberg et al. [32] SBS symptoms 8.5 42.4 5.0
With respect to sick leave, the cost per occupant is estimated to be an extra $400 each
year at reduced ventilation rates [25]. The same study found this impact alone to dwarf energy
costs by a factor of six among corporate workers. Second, as outdoor CO2 levels and
temperatures rise as a result of climate change, the energy usage and IEQ of poor and high
performing buildings will become increasingly disparate [26]. Third, our analysis only accounts
for the direct costs associated with salaries; the employer cost for employee compensation is
approximately 30% higher when considering benefits [22]. As higher paid positions have more
expensive benefits, the reduction in costs to the company will be higher than estimated in this
analysis. Fourth, the testing occurred in a LEED platinum building with low chemical
concentrations. Even larger cognitive deficits were observed when chemicals were added to the
space [15]. Enhanced ventilation in buildings with poor IAQ will lead to larger productivity
gains than what was seen in this green environment. Lastly, the cognitive domains that have the
highest correlations with other measures of productivity such as education level, salary at age,
and number of employees supervised were the ones that had the largest improvements at higher

55
ventilation rates [27]. The participants shifted from the 46.5th percentile to the 57th percentile on
the information usage, strategy, and crisis response domains.
These findings indicate that standard HVAC design and operation are not optimal for
occupant health and decision making. New building construction should include ERVs and
systems that can provide modifiable ventilation rates depending on outdoor air conditions. They
should also invest in other ventilation strategies such as advanced air distribution systems and
improved filtration, which reduces contaminants that may cause cognitive impacts. Green building
architects and designers, which have the goal of improving occupant wellbeing while
simultaneously reducing their environmental impact, should be particularly cognizant of
ventilation strategies that can optimize these two factors. Credit-based rating systems should
revisit their design requirements and properly incentivize
these approaches.
Many existing buildings, on the other hand, have HVAC systems that are designed for a
specific ventilation rate and may not be easily modified to increase ventilation rates. This limits
the ability of building managers to make changes to the ventilation rate, even in light of the
evidence presented in this paper. This limitation is similar for ERVs, which may not be easily
installed into some existing systems.
Our analysis focused on one office type—the Department of Energy “Medium Office
Type” template—and may not be applicable to other building types. In addition, this research
and our previous research on cognitive function did not explicitly investigate thermal conditions,
which may have independent productivity impacts. However, the modeling is straightforward
and building owners for all buildings types could replicate our analysis for their specific building
to estimate indoor conditions, energy costs, and environmental impacts. Last, energy costs

56
fluctuate, but in our analysis model inputs are based on local costs and energy fuel mix as of the
date that this manuscript was submitted. Any changes to the fuel mix or costs will change our
estimated costs. Regardless, variation in the overall energy costs per occupant will be minor
relative to their employment costs.
Several assumptions were made to derive the economic benefits of improved ventilation.
First, we assume that the population of knowledge workers that took the cognitive testing was
representative of the U.S. office workforce. 20% of that group held management positions
compared to 12% in the BLS data, and 60% had professional occupations compared to 50% in
the BLS data. Second, we assume a one percentile change in cognitive function corresponds to a
one percentile change in value as an employee (e.g., someone who scores in the 62nd
percentile is
salaried at the 62nd percentile). Previous work with the SMS tool has shown high correlations
(>0.6) between cognitive scores and salary [27]. Third, this analysis demonstrates the
competitive advantage to be gained by improving ventilation in comparison to workforce at
large. As improvements to ventilation are adopted by a larger percentage of buildings, there will
be an equilibration of wages to account for a generally more productive workforce.
2.5 Conclusions
The public health benefits of enhanced ventilation far exceed the per occupant economic costs in
U.S. cities. Even with conservative estimates, the increased productivity of an employee is over
150 times greater than the resulting energy costs. Environmental costs are also relatively minor,
but should be offset by the incorporation of energy recovery systems, advanced ventilation
strategies, and other green building design strategies.

57
Author Contributions
Pegues is an engineer at United Technologies Building and Industrial Systems and conducted the
initial energy analysis for this study. The remaining environmental and public health analyses
and interpretation of the energy modeling were conducted by MacNaughton. Satish helped with
the productivity analysis. The paper was written by MacNaughton and Allen. All authors
reviewed the final manuscript.
Conflicts of Interest
The authors declare no conflict of interest.

58
References
1. EIA. How Much Energy is Consumed in Residential and Commercial Buildings in the
United States; U.S. Energy Information Administration: Washington DC, U.S., 2015.
2. EIA. Commercial Buildings Energy Consumpton Survey; U.S. Energy Information
Administration: Washington DC, U.S., 2008.
3. Godlee, F. Climate change. BMJ 2014, 349, doi:10.1136/bmj.g5945.
4. Church, J.A. How fast are sea levels rising? Science 2001, 294, 802–803.
5. Abelson, P.H. Effects of SO2 and NOx Emissions. Science 1984, 226, 1263,
doi:10.1126/science.226.4680.1263.
6. Anderson, G.B.; Bell, M.L. Heat Waves in the United States: Mortality Risk during Heat Waves
and Effect Modification by Heat Wave Characteristics in 43 U.S. Communities. Environ.
Health Perspect. 2011, 119, 210–218.
7. Cooney, C.M. Managing the Risks of Extreme Weather: IPCC Special Report. Environ.
Health Perspect. 2012, 120, doi:10.1289/ehp.120-a58.
8. Spengler, J.D.; Sexton, K. Indoor Air Pollution: A Public Health Perspective. Science 1983,
221, 9–17.
9. Levy, J.I.; Baxter, L.K.; Schwartz, J. Uncertainty and Variability in Health-Related
Damages from Coal-Fired Power Plants in the United States. Risk Anal. 2009, 29, 1000–
1014.
10. Hamilton, M.; Rackes, A.; Gurian, P.L.; Waring, M.S. Perceptions in the U.S. building
industry of the benefits and costs of improving indoor air quality. Indoor Air 2015,
doi:10.1111/ina.12192.

59
11. Standard 62–73, Standards for Natural and Mechanical Ventilation; American Society for
Heating, Refrigeration, Air-Conditioning Engineers, Inc: Atlanta, U.S., 1973.
12. Redlich, C.A.; Sparer, J.; Cullen, M.R. Sick-building syndrome. Lancet 1997, 349, 1013–
1016.
13. Persily, A. Challenges in developing ventilation and indoor air quality standards: The story
of ASHRAE Standard 62. Build. Environ. 2015, 91, 61–69.
14. Wargocki, P.; Wyon, D.P.; Sundell, J.; Clausen, G.; Franger, P.O. The effects of outdoor air
supply rate in an office on perceived air quality, Sick Building Syndrome (SBS) symptoms
and productivity. Indoor Air 2000, 10, 222–236.
15. Allen, J.; MacNaughton, P.; Satish U.; Santanam, S.; Vallarino, J.; Spengler J. Associations
of Cognitive Function Scores with Carbon Dioxide, Ventilation, and Volatile Organic
Compound Exposures in Office Workers: A Controlled Exposure Study of Green and
Conventional Office Environments. Environ. Health Perspect. DOI: 10.1289/ehp.1510037
16. Fisk, W.J.; Rosenfeld, A.H. Estimates of Improved Productivity and Health from Better
Indoor Environments. Indoor Air 1997, 7, 158–172.
17. EIA. State Electricity Profiles; U.S. Energy Information Administration: Washington DC,
U.S., 2015.
18. DoE. Commercial Prototype Buildings Models, B.E.C. Program, Editor: Washington DC,
U.S., 2014. Available online: https://www.energycodes.gov/commercial-prototype-building-
models (accessed August 23rd, 2015).
19. FHWA. Highway Statistics 2011; Office of Highway Policy Information, Federal Highway
Administration: Washington DC, U.S., 2013.

60
20. EPA. Inventory of U.S. Greenhouse Gas Emissions and Sinks: 1990–2011; U.S.
Environmental Protection Agency: Washington DC, U.S., 2013.
21. EPA; DoT. Light-Duty Vehicle Greenhouse Gas Emission Standards and Corporate Average
Fuel Economy Standards, Final Rule. Federal Registry, 2010. Part II. Available online:
http://www.gpo.gov/fdsys/pkg/FR-2010-05-07/pdf/2010-8159.pdf (accessed on September
3rd, 2015).
22. BLS. Occupational Employment Statistics; Bureau of Labor Statistics: Washington DC,
U.S., 2014.
23. Melikov, A.K. Advanced air distribution: Improving health and comfort while reducing
energy use. Indoor Air 2015, doi:10.1111/ina.12206.
24. Fisk, W.J.; Olli, S.; David, F.; Yu, J.H. Economizer system cost effectiveness: Accounting
for the influence of ventilation rate on sick leave. In Proceedings of the Healthy Buildings
2003 Conference, Singapore, 7–11 December 2003.
25. Milton, D.K.; Glencross, P.M.; Walters, M.D. Risk of Sick Leave Associated with Outdoor
Air Supply Rate, Humidification, and Occupant Complaints. Indoor Air 2000, 10, 212–221.
26. Holmes, S.; Reinhart, C. Assessing future climate change and energy price scenarios:
Institutional building investment. Build. Res. Inf. 2013, 41, 209–222.
27. Streufert, S.; Pogash, R.; Piasecki, M. Simulation-Based Assessment of Managerial
Competence: Reliability and Validity. Personnel Psychol. 1988, 41, 537–557.
28. Brundage, J.; Scott, R.M; Lednar, W.; Smith, D.; Miller, R. Building-Associated Risk of
Febrile Acute Respiratory Diseases in Army Trainees. JAMA 1988, 259, 2108-2112

61
29. Drinka, P.; Krause, P.; Schilling, M.; Miller B.; Shult, P.; Gravenstein, S. Report of an
outbreak: Nursing home architecture and influenza-A attack rates, J. Am Geriatric Society
1996, 44, 910-913.
30. Knibbs, L.; Morawska, L.; Bell, S.; Grzybowski, P. Room ventilation and the risk of
airborne infection transmission in 3 health care settings within a large teaching hospital.
Association for Professionals in Infection Control and Epidemiology 2011, 10, 866-872.
31. Hoge, C.W.; Reichler, M.R.; Dominiguez, E.A.; Bremer, J.C.; Mastro, T.D.; Hendricks,
K.A.; Musher, D.M.; Elliott, J.A.; Facklam, R.R.; Breiman, R.F. An epidemic
pneumococcal disease in an overcrowded, inadequately ventilated jail. New England
Journal of Medicine 1994, 331, 643-648.
32. Stenberg, B.; Eriksson, N.; Hoog, J.; Sundell, J.; Wall, S. The sick building syndrome (SBS)
in office workers. A case-referent study of personal, psychosocial and building-related risk
indicators. International Journal of Epidemiology 1994, 23, 1190-1197.

62
CHAPTER 3 - The Impact of Working in a Green Certified Building on Cognitive
Function and Health
Authors
Piers MacNaughton1, Usha Satish
2, Jose Guillermo Cedeno Laurent
1, Skye Flanigan
1, Jose
Vallarino1, Brent Coull
3, John D. Spengler
1, Joseph G. Allen
1
Affiliations
1 Department of Environmental Health, Harvard T.H. Chan School of Public Health, Boston,
MA, USA
2 Psychiatry and Behavioral Sciences, SUNY-Upstate Medical School, Syracuse, NY, USA
3 Department of Biostatistics, Harvard T.H. Chan School of Public Health, Boston, MA, USA

63
Abstract
Thirty years of public health research have demonstrated that improved indoor environmental
quality is associated with better health outcomes. Recent research has demonstrated an impact of
the indoor environment on cognitive function. We recruited 109 participants from 10 high-
performing buildings (i.e. buildings surpassing the ASHRAE Standard 62.1-2010 ventilation
requirement and with low total volatile organic compound concentrations) in five U.S. cities. In
each city, buildings were matched by week of assessment, tenant, type of worker and work
functions. A key distinction between the matched buildings was whether they had achieved green
certification. Workers were administered a cognitive function test of higher order decision-
making performance twice during the same week while indoor environmental quality parameters
were monitored. Workers in green certified buildings scored 26.4% higher on cognitive function
tests than those in non-certified buildings, controlling for annual earnings, job category and level
of schooling. Thermal comfort and the previous night’s sleep quality were predictors of cognitive
function scores. Sleep Scores were 6.4% higher for participants in green certified buildings,
suggesting an impact of the building on sleep quality that evening. We describe a holistic
“buildingomics” approach for examining the complexity of factors in a building that influence
human health.
Keywords: Green Certification, Office Buildings, Cognitive Function, Indoor Environmental
Quality, Buildingomics

64
3.1 Introduction
Thirty years of public health science and building science have demonstrated that buildings play
a key role in shaping our health [1-5]. Buildings have the capacity to create conditions that are
harmful to health or conducive to health: they determine our exposure to outdoor pollutants, by
either facilitating entry of particles of outdoor origin indoors, or acting as a barrier and removing
them through enhanced filtration [6]; they govern exposure to chemicals of concern, such as
volatile organic compounds (VOCs), flame retardants and polyfluorinated compounds, which
can be ubiquitous or nonexistent, depending on the decisions we make regarding building
materials and products [7, 8]; buildings either protect us from noise or contribute to the problem
through the introduction of indoor sources, poor noise insulation, or poor acoustical design [9,
10]; they can induce eye strain or improve alertness through impacts on circadian rhythm,
depending on the lighting system [11, 12]; buildings can protect us during heat events, or create
environments that magnify the problem through solar heat gain [13, 14]; and buildings can either
wall us off from nature or connect us to it [15, 16].
The scientific literature around buildings and health has identified the foundations of a
healthy building including factors such as ventilation, air quality, thermal comfort, noise and
lighting, and this body of research has served as the basis for green certification standards to
define their indoor environmental quality (IEQ) guidelines. A review of leading, global green-
building standards - LEED New Construction 2009, Green Star Office v3, BREEAM New
Construction 2012, BCA Green mark for new non-residential buildings v4.1 2013, and DGNB
New Office v2012 - demonstrates the approach of these certification standards toward IEQ. All
of the rating systems offer credits for thermal comfort, indoor air quality (IAQ) and lighting; all
but LEED NC 2009 have credits for acoustics; and Green STAR v3 and LEED NC 2009 have
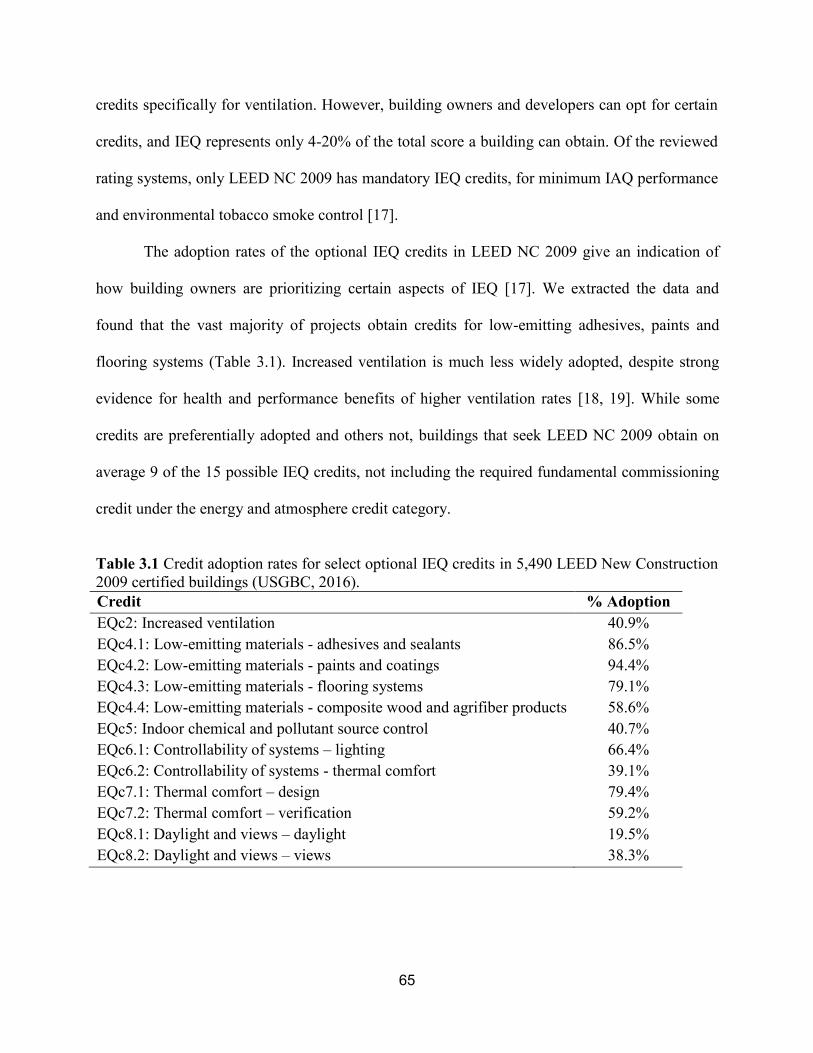
65
credits specifically for ventilation. However, building owners and developers can opt for certain
credits, and IEQ represents only 4-20% of the total score a building can obtain. Of the reviewed
rating systems, only LEED NC 2009 has mandatory IEQ credits, for minimum IAQ performance
and environmental tobacco smoke control [17].
The adoption rates of the optional IEQ credits in LEED NC 2009 give an indication of
how building owners are prioritizing certain aspects of IEQ [17]. We extracted the data and
found that the vast majority of projects obtain credits for low-emitting adhesives, paints and
flooring systems (Table 3.1). Increased ventilation is much less widely adopted, despite strong
evidence for health and performance benefits of higher ventilation rates [18, 19]. While some
credits are preferentially adopted and others not, buildings that seek LEED NC 2009 obtain on
average 9 of the 15 possible IEQ credits, not including the required fundamental commissioning
credit under the energy and atmosphere credit category.
Table 3.1 Credit adoption rates for select optional IEQ credits in 5,490 LEED New Construction
2009 certified buildings (USGBC, 2016).
Credit % Adoption
EQc2: Increased ventilation 40.9%
EQc4.1: Low-emitting materials - adhesives and sealants 86.5%
EQc4.2: Low-emitting materials - paints and coatings 94.4%
EQc4.3: Low-emitting materials - flooring systems 79.1%
EQc4.4: Low-emitting materials - composite wood and agrifiber products 58.6%
EQc5: Indoor chemical and pollutant source control 40.7%
EQc6.1: Controllability of systems – lighting 66.4%
EQc6.2: Controllability of systems - thermal comfort 39.1%
EQc7.1: Thermal comfort – design 79.4%
EQc7.2: Thermal comfort – verification 59.2%
EQc8.1: Daylight and views – daylight 19.5%
EQc8.2: Daylight and views – views 38.3%
66
The literature suggests that these credits translate into improved IEQ. Our previous
review of green buildings and health identified 17 studies and found that, overall, occupants
report better IEQ and fewer health problems in these buildings compared to non-certified
buildings. These studies found lower levels of VOCs, formaldehyde, allergens, nitrogen dioxide,
and particulate matter in green buildings, which have been separately shown to impact health.
Six of the reviewed studies tracked the health of occupants in addition to IEQ, and all six found
improvements in the green buildings [20]. These include reduced asthma and allergy symptoms
in offices [21]; reduced respiratory symptoms, fewer sick building symptoms, and better self-
reported well-being in public housing [22-24]; and fewer medical errors and decreased mortality
in hospitals [25]. Of these studies, Newsham et al. used an approach similar to this study by
recruiting green and conventional office building pairs and measuring IEQ. They found an
improvement in IEQ, a reduction in symptoms, and better reported sleep quality in the green
buildings [26]. A follow up paper by Colton et al. published since the time of our review found
that in addition to fewer asthma symptoms, hospital visits and school absences were reduced in
the green certified public housing development [27]. Comparisons of buildings in poor condition
to green buildings provide an opportunity to see the biggest potential effect, but may falsely
attribute benefits to certification.
As part of our efforts to determine the factors that drive better human health in buildings,
we previously conducted a study in a controlled setting to investigate several IEQ factors –
ventilation, CO2, and VOCs – and their impact on cognitive function scores. We found
significant impacts on human decision-making performance related to all three of these factors
(Allen et al., 2015). Others have also found independent effects of ventilation, CO2 and VOCs on
cognitive function and other physiological responses at levels commonly found in indoor

67
environments [19, 28-31]. In this current study, we looked at buildings that are high-performing
across these indicators of IEQ and investigated the potential for additional benefits of green
certification on cognitive function, environmental perceptions, and health.
3.2 Methods
3.2.1 Study Design - Overview
Workers from 10 office buildings in five U.S. cities (two buildings per city) were recruited to
participate in a week-long assessment. 12 participants were initially recruited from each building.
Participants completed surveys about their health and environmental perceptions and took a
cognitive test on the Tuesday and Thursday of the assessment. All buildings were high-
performing buildings, defined as buildings surpassing the ASHRAE Standard 62.1-2010
minimum acceptable per person ventilation requirement and with low (<250 μg/m3) TVOC
concentrations; however, six of the buildings were green certified via the LEED certification
framework while the remaining four were not [32].
3.2.2 Participant and Building Recruitment
The building assessments took place in urban areas of the following cities: Boston,
Massachusetts (9/29/2015-10/2/2015); Washington DC (10/26/2015-10/30/2015); Denver,
Colorado (11/9/2015-11/13/2015); San Jose, California (11/30/2015-12/4/2015); and Los
Angeles, California (12/14/2015-12/18/2015 and 2/1/2016-2/5/2016). In each city, the buildings
were matched strictly by tenant and loosely by age and size (Table 3.3). In the first four cities,
the buildings were also matched by the dates of assessment, and the buildings were recruited
such that one building was LEED-certified and the other not. The goal of matching was to select
two high-performing buildings in each city that were as similar to each other as possible with the

68
key distinction being that one pursued LEED certification. In the last city, Los Angeles, two
green certified buildings were recruited and the assessments occurred on different dates due to an
earlier enrolled building dropping out of the study prior to the assessment; a second building was
subsequently recruited. The study team visited each building prior to the assessment to: 1)
perform a an initial assessment of the heating, ventilation and air conditioning (HVAC) systems,
2) ensure that the building classification as high-performing was valid, and 3) recruit
participants.
After obtaining permission from the building owner, building management and tenant, 12
participants were recruited to participate in a five day health assessment in each building. Final
participant numbers by building are presented in Table 3.3. As mentioned previously, the same
tenant was used in each city to ensure similar work functions, and all of the companies employ
primarily knowledge workers (i.e. administrative, professional, technical and managerial
positions). Asthmatics were excluded during recruitment. We did not restrict recruitment to
select areas of each building to limit potential selection bias. The study protocol was reviewed
and approved by the Harvard T.H. Chan School of Public Health Institutional Review Board. All
participants signed informed consent documents and were compensated $100.

69
Table 3.2 Demographic breakdown of participants in each building classification.
High-Performing
Green Certified
High-Performing
Non-Certified
Number of Participants1
69 40
Gender
Male 55% 54%
Female 45% 46%
Age
20-30 39% 28%
31-40 21% 33%
41-50 21% 15%
51-60 18% 15%
61-70 1% 8%
Ethnicity
White/Caucasian 70% 56%
Black or African American 6% 10%
Asian 7% 8%
Latino 7% 13%
Other 9% 13%
Highest level of Schooling
High School Graduate 0% 10%
Some College 12% 26%
College Degree 63% 49%
Graduate Degree 25% 15%
Job Category
Managerial 22% 10%
Professional 45% 54%
Technical 6% 18%
Secretarial or Clerical 18% 15%
Other 9% 3%
Total Annual Earnings
<$50,000 34% 13%
$50,000-$75,000 21% 41%
$75,000-$100,000 10% 21%
$100,000-$150,000 27% 18%
>$150,000 7% 8% 1 Includes 2 participants in green certified buildings and 1 in non-
certified buildings who did not complete the baseline survey

70
3.2.3 Building Assessment
The building assessment consisted of three parts. First, the study team conducted an inspection of
the building systems along with the building engineers from each facility. The study team
recorded the type and condition of the systems, how they are typically operated, and the
frequency of building commissioning tasks such as changing the filters. Second, the study team
characterized each test space. The test spaces were defined by the unique ventilation zones in
which the participants were located. The baseline assessment of the test spaces characterized the
building, office and cleaning materials in the space; the air supply and exhaust strategies; and the
environmental controls such as operable windows and thermostat set points. On each cognitive
testing day, a separate assessment was conducted of the ventilation rates, noises, odors and
occupancy in each test space. Lastly, the building manager was provided a survey asking about
general building information, building policies, and utility costs. All elements of the building
assessment were adapted from the EPA BASE study [33]. These elements were designed to
assess the building as a whole rather than just the IEQ of the participant’s workstations.

71
Table 3.3 Building characteristics of the 10 high-performing buildings included in the study.
City Type Size (sq. ft) Year of
Construction
Type/Year of
Certification1
Ventilation
Strategy2
Number of
Participants
Boston Non-Certified <50,000 1929 NA CV, RC 12
Boston Certified <50,000 1929 LEED EB v3
Platinum in 2012 VAV, SP 12
DC Non-Certified >500,000 1935 NA VAV, RC 11
DC Certified >500,000 1917 LEED EB v3
Gold in 2010 CV, SP 12
Denver Non-Certified 50,000-100,000 1938 NA CV, RC 8
Denver Certified 50,000-100,000 1938 LEED CI v3
Silver in 2011 CV, RC 12
San Jose Non-Certified 50,000-100,000 1971 NA CV, RC 9
San Jose Certified >500,000 1934 LEED EB v3
Gold in 2015 VAV, RC 12
Los Angeles Certified <50,000 1953 LEED EB v3
Platinum in 2013 VAV, RC 11
Los Angeles Certified <50,000 1929 LEED EB v4
Platinum in 2016 VAV, RC 10
1 EB = Existing Buildings, CI = Commercial Interiors
2 CV = Constant Volume, VAV = Variable Air Volume, SP = Single pass with energy recovery ventilator, RC =
Partial recirculation with reheat
3.2.4 Environmental Assessment
A complete characterization of the IEQ in each test space was conducted on each
cognitive testing day. Each participant was outfitted with a Netatmo Weather Station (Netatmo,
Boulogne-Bellancourt) in their cubicle to measure temperature, humidity, carbon dioxide
concentrations in parts per million (ppm), and sound levels (in decibels) every 5 minutes for each
participant. The units were tested with 400 and 1000 ppm CO2 calibration gas before and after
the field campaign. If the sensor had drifted, the CO2 data was adjusted first by the offset from
the 400 ppm reading and second by a scaling factor to match the 1000 ppm reading of the
instrument to 1000 ppm. This process corrected both the intercept and slope of the collected data

72
to match experimentally derived values. The CO2 data was then used to produce ventilation (cfm
of outdoor air per person) and air exchange rates (ACH) for each participant-day of the study.
For ventilation rate, the 90th
percentile CO2 concentration during occupied hours was taken as the
steady-state concentration of CO2 using the method described by Ludwig et al., and for air
exchange rate, the decays curves of CO2 were analyzed using the tracer gas method described in
ASTM Standard E741-11 [34, 35]. Briefly, when test spaces changed from fully occupied to
unoccupied, the rate of decay of occupant generated CO2 can be used to estimate air exchange
rates using the validated methodology set forth by ASTM.
Air sampling was performed for 62 common VOCs and 14 common aldehydes in each
building in the test space with the most participants present during each cognitive testing day.
VOCs were collected using summa canisters according to EPA method TO-15. Aldehydes were
collected on an 8-hour integrated active air sample (0.4 L/min flow rate) according to EPA
method TO-11. ALS Analytical Laboratories conducted the analyses of these samples
(Cincinnati, OH). 25 VOCs and four aldehydes were not detected in any of the samples. Each
test space was also equipped with at least one commercial sensor package (FengSensor,
Tsinghua University, Beijing) to measure the same parameters as the Netatmo as well as light
levels in lux and particulate matter less than 2.5 μm in diameter (PM2.5) in μg/m3. These sensors
were installed on the first day of the assessment (Monday) and collected on the final day of the
assessment (Friday).
3.2.5 Health Assessment
Participants were provided a Basis Peak Watch (Basis an Intel Company, San Francisco)
for the duration of the assessment, which tracked the participants’ heart rate, skin temperature,
galvanic skin response, physical activity (i.e. steps and calorie expenditure) and sleep patterns

73
(i.e. sleep duration, tossing and turning, number of interruptions). The participants also
completed a series of questionnaires over the course of the study. The first was a baseline survey
about their perceptions of their work environment and health. The second survey was completed
each study day at the end of the workday, a total of five times for each participant, which asked
about their environment and whether they experienced any of 19 sick building syndrome (SBS)
symptoms on that day. A follow-up survey was completed on the final day of the study asking
questions about the previous week, such as satisfaction with noise, lighting, thermal comfort and
odors in their cubicle. These surveys were adapted from the EPA BASE study as well and used
in our previous research on green buildings [30, 33].
Cognitive function was assessed using the Strategic Management Simulation (SMS)
software on Tuesday and Thursday at approximately 15:00. The participants completed two
different scenarios to avoid potential learning effects, and the frequency of each scenario was
balanced between green certified and non-certified buildings. The SMS tool is a validated,
computer-based test that measures higher-order decision making ability across nine domains of
cognitive function, ranging from basic activity levels to strategy. The SMS tool has been
extensively described in the literature [36-38]. Briefly, the SMS tool immerses the participant in
a 1.5 hour long real-life scenario, where they have to respond to several plot lines that emerge
over the course of the simulation. These plot lines are validated for content and designed to
capture cognitive functions representative of productivity in the real world. They are given the
flexibility to approach the simulation in their own thinking style, with no stated demands and a
wide breadth of available responses. The types of decisions and plans the participant makes and
the events to which they link these actions are processed by the software through a series of
algorithms that compute scores for each domain. The SMS study team is blinded to the building

74
status (green certified vs. non-certified). Participants’ cognitive function scores on Tuesday and
Thursday were, on average, highly consistent. More detailed methodology about the cognitive
testing is described elsewhere [19, 29, 39].
3.2.6 Statistical Methods
The IEQ data collected in this study experienced building-level clustering, which was
accounted for with hierarchical statistical tests. Two-sample t-tests with clustered data were used
to test for significant differences in IEQ between green certified and non-certified buildings. For
analyses of participant outcomes, such as cognitive function and sleep, the data was additionally
clustered by the repeated measurements on each participant. Generalized linear mixed effect
models were used to model the associations between building classification and these outcomes,
treating participant ID and building ID as a random effect:
𝐶𝑜𝑔. 𝑆𝑐𝑜𝑟𝑒𝑖,𝑗,𝑘 = 𝛽1 + 𝛽2 ∗ (𝐺𝑟𝑒𝑒𝑛 𝐶𝑒𝑟𝑡𝑖𝑓𝑖𝑒𝑑) + 𝑏1𝑖 + 𝑏2𝑖,𝑘 + 𝑒𝑖,𝑗,𝑘 (1)
where Cog.Scorei,i,k is the average cognitive score for subject i on day j in building k, normalized
to the non-certified, high-performing buildings; β1 is the fixed intercept; β2 is the fixed effect of
high-performing, certified buildings compared to high-performing, non-certified buildings; b1i is
the random effect of intercept for subject i; and b2i,k is the random effect of intercept for building
k. Additional models were run with the following variables: job category, annual earnings, level
of schooling and thermal comfort as indicator variables and previous night’s sleep as a
continuous variable. The residuals were normally distributed and homoscedastic for all models.
We used penalized splines to graphically assess linearity in the associations between continuous
variables and outcome measures.
The SMS tool provides raw scores for nine domains of cognitive function. To allow
comparisons between domains, the cognitive function scores were normalized to scores in the

75
non-certified building by dividing each score by the average score in the non-certified buildings
in that domain, as has been done in previous studies using the SMS test [39]. The average
cognitive score is an average score across the nine domains. Thermal comfort is a binary variable
that reflects whether or not a participant was within the thermal comfort zone specified by
ASHRAE Standard 55-2004 on any particular day of the assessment [40] (Figure 3.1). Relative
humidity and temperature from the Netatmo were entered in the Fanger thermal comfort
equations to estimate whether the percent of people dissatisfied with the thermal conditions
would exceed 10% [41]. We assume constant radiant temperatures (same as dry bulb
temperature), air velocities (0.15 m/s), metabolic rates (1 met), and clothing (1 clo) between
participants.
Figure 3.1 Thermal comfort for each participant-day by building type plotted on the
psychrometric chart. The light gray region corresponds to a Percent of People Dissatisfied (PPD)
below 10%, and the dark gray region corresponds to a PPD below 7% as derived from ASHRAE
Standard 55-2010 (ASHRAE, 2010).

76
To assess sleep, we developed an index to characterize each night of sleep across three
well-known indicators of sleep quality: sleep duration, tossing and turning, and number of
interruptions. It was calculated using data from the Basis Watch for each night of sleep the
participants had during the assessment according to equation (2):
𝑆𝑙𝑒𝑒𝑝 𝑆𝑐𝑜𝑟𝑒 = 100% ∙𝑆𝑙𝑒𝑒𝑝.𝐷𝑢𝑟𝑎𝑡𝑖𝑜𝑛
420− 10% ∙
𝑇𝑜𝑠𝑠.𝑇𝑢𝑟𝑛
85− 10% ∙
𝑁𝑢𝑚.𝐼𝑛𝑡
4 (2)
where Sleep.Duration is the number of minutes the participant spent sleeping between 9PM and
9AM the following day, Toss.Turn is the number of minutes during which the watch registered
motion via the accelerometer (the maximum Toss.Turn in this study was 85), and Num.Int is the
number of times during a night of sleep that the sleep activity changed from asleep to awake and
then back to asleep (the maximum Num.Int in this study was 4). If the participant slept for longer
than 420 minutes, or 7 hours, the first term was capped at 100%. Nights when the watch was not
worn or worn improperly were removed from the analysis, resulting in a total sample size of 260
nights, 100 of which preceded a cognitive testing day. The average Sleep Score was 83.1% with
a standard deviation of 19.7%. Analyses were performed using the open-source statistical
package R version 3.2.0 (R Project for Statistical Computing, Vienna, Austria).
3.3 Results
The non-certified buildings and green certified buildings had similar air quality; the low CO2,
low TVOC and high ventilation rates indicate that the buildings were high-performing at the time
of the assessment (Figure 3.2). The ventilation rates exceeded the ASHRAE 62.1-2010 standard
for 84% of participants, which could mitigate the buildup of airborne contaminants. The green
certified buildings were on average brighter (374 lux vs. 163 lux), louder (51.8 dB vs. 48.9 dB),
and drier (38.4% vs. 45.9%) than the non-certified buildings; however, only the difference in

77
relative humidity was statistically significant (Figure 3.2). Differences in humidity may be driven
by the ventilation strategies in the green certified buildings, which more frequently had variable
air volume ventilation systems.
Figure 3.2 Boxplots of indoor environmental quality (IEQ) parameters in high-performing, non-
certified buildings and high-performing, green certified buildings. Vent, AER, CO2, Temp, RH
and Noise are measured by the Netatmo in every workstation each day, TVOCs are measured
with summa canisters in every test space each cognitive testing day, and PM2.5 and Light are
measured by the Feng Sensor in every test space each day. An asterisk (*) denotes that the
building classifications are statistically significantly different from each other for that IEQ
parameter after adjusting for clustering by building.
Between-subject analyses were necessary to compare participants in different building
classifications. Table 3.2 shows the demographic information for the participants in each
building classification: the matching criteria resulted in the two groups having similar job
classifications, gender and ages. The green certified buildings had a slightly larger percentage of
white/Caucasian participants and participants with a college or graduate degree. These buildings
also had more participants at both the lower and higher end of the range of annual earnings. We
added these variables as predictors to the cognitive function models to test if they influenced
baseline cognitive abilities, and none of these predictors were statistically significantly

78
associated with cognitive function scores or influenced the effect estimate of building
classification.
The impact of building classification on each domain of cognitive function is summarized
in Figure 3.3. On average, participants in the high-performing, green certified buildings scored
26.4% higher on the SMS cognitive test than those in the high-performing, non-certified
buildings (p-value < 0.001). Cognitive scores were statistically significantly higher for 7 of the 9
domains with the largest impacts on crisis response, applied and focused activity level and
strategy. No differences in scores were seen for basic activity level or information seeking. For
the average scores, the model’s R2 was 0.28, indicating that 28% of the variability in cognitive
function scores is explained by the building classification alone.
Figure 3.3 Cognitive scores and 95% confidence intervals for each domain of the SMS tool after
controlling for participant, normalized to high-performing buildings, for participants in high-
performing and high-performing, green certified buildings.
79
Of the IEQ parameters assessed in the buildings, the largest differences were seen for
relative humidity. The non-certified buildings were more frequently outside the ASHRAE
Standard 55 thermal comfort zone than the green certified buildings due to their higher
humidities (Figure 3.1). Both building classifications had participant-days where the building
was too cold to comply with ASHRAE Standard 55. After controlling for building classification,
participants within the thermal comfort zone scored 5.4% higher on the SMS cognitive tests than
those without (Figure 3.4).
Previous night’s sleep was also associated with cognitive function scores. A 25%
increase in Sleep Scores was associated with a 2.8% increase in cognitive function scores. Sleep
quality was influenced by day-time exposures in the office: participants in the green certified
buildings had 6.4% higher Sleep Scores than those in the non-certified buildings. This may be in
part a result of higher light levels in the green buildings; a 300 lux increase in illuminance during
the day was associated with a 2.9% increase in Sleep Scores that night. However, these findings
are not statistically significant (Figure 3.4).

80
Figure 3.4 Effect of a) thermal comfort on cognitive function scores, b) yesterday’s sleep on
cognitive function scores, c) building classification on Sleep Scores, and d) light levels on Sleep
Scores, using generalized linear mixed effect models with 95% confidence intervals, treating
building and participant as random effects. The effect size for thermal comfort is comparing
cognitive scores from tests taken by participants within the ASHRAE Standard 55-2013 comfort
zone to those without. The effect sizes for yesterday’s sleep and light correspond to a 25%
change in Sleep Score and 300 lux change in illuminance respectively.
In addition to improved cognitive function scores, participants in green certified buildings
reported better environmental perceptions and fewer symptoms than those in non-certified
buildings. Participants in green certified buildings were generally more satisfied with daylighting
and electrical lighting in their workspace, and less frequently reported the temperature being too
hot or too cold, the air movement being too much or too little, the air being too dry or too humid,
and the presence of chemical, tobacco and other odors (Figure 3.5). These perceptions are linked
to the monitored IEQ in the spaces. For example, relative humidities were 15.9% higher when

81
participants reported the air was too humid. Lastly, participants in the non-certified buildings
reported 0.5 (30%) more symptoms each day than those in the green certified buildings.
Figure 3.5 Environmental perceptions of lighting, temperature, air movement, humidity and
odors in high-performing, green certified and high-performing, non-certified buildings.
Participants were asked about lighting conditions at the end of the assessment on a Likert scale
ranging from Very Dissatisfied (1) to Very Satisfied (5), and asked about the presence of
temperature, air movement, humidity and odor problems daily.
3.4 Discussion
Previous research by our team, and others, has identified IAQ as a key driver of cognitive
function. In particular, CO2, TVOCs, and ventilation all have independent impacts on cognitive
function, even at levels deemed to be acceptable by the relevant codes and standards [19, 28, 29,
39]. Many office buildings on the market now fit the classification as high-performing by
surpassing the ASHRAE Standard 62.1 ventilation requirement and having low TVOC
concentrations (<250 μg/m3). The findings of this study indicate that even among high-
performing buildings that meet these IEQ criteria, additional benefits to cognitive function and
health may be achieved by seeking green building certification. Participants in high-performing,
green certified buildings had 26.4% higher cognitive function scores and 6.4% higher Sleep

82
Scores than participants in the high-performing, non-certified buildings even after controlling for
annual earnings, job categories, and level of schooling.
While most IEQ parameters were similar between the two types of buildings, thermal
comfort indicators differed and were a significant determinant of cognitive function. The green
certified buildings were generally less humid than the non-certified buildings, and as a result a
larger proportion of participants in these buildings were in the thermal comfort zone defined by
ASHRAE 55 (Figure 3.1). Participants outside this thermal comfort zone scored 5.4% lower on
the cognitive simulations. The detriments to cognitive function align with previous research on
thermal conditions and performance. In a review of 24 papers, Seppänen et al. found that work
performance was optimized at temperatures within the ASHRAE Standard 55 zone, and that the
benefits were seen using various different indicators of cognitive function ranging from simple
cognitive tests to objectively reported work performance [42]. The impacts on the SMS tool
indicate that high order decision-making is also affected by these exposures.
Not surprisingly, our study identified the previous night’s sleep as a driver of cognitive
function. More interesting is that better sleep quality was associated with better lighting
conditions in the building. This is biologically plausible, considering previous research linking
exposure to daylighting or blue-enriched lighting before sleep to sleep repression. Warmer light
colors, such as those at dusk, trigger the body to release melatonin, which has a fatiguing effect,
and late-night screen use can delay or suppress the release of melatonin [43]. Similarly, a larger
contrast between daytime light exposures and nighttime light exposures leads to a larger
amplitude in daily melatonin secretion cycles [44]. Daylighting and blue-enriched lighting during
the day helps align the body’s circadian rhythm and improve sleep quality at night [12]. This
effect was observed in our study: brighter lighting in the office during the day was associated

83
with higher Sleep Scores at night, and participants in the green certified buildings, which were
generally brighter, had 6.4% higher Sleep Scores than those in the non-certified buildings. This
finding supports previous research by Newsham et al. on sleep quality in green buildings [26].
Investigating real-world office buildings, as opposed to a simulated environment, posed
several limitations on the study. First, the case-control study design required between-subject
comparisons. To minimize baseline differences in cognitive function, we matched the buildings
by tenant and job categories. Adding annual earnings, level of education, and job category to our
models did not influence the effect size of building classification on cognitive function scores,
nor were these factors statistically significantly associated with cognitive scores. Second, the
environmental conditions were variable between buildings and could not be modified by the
study team. The variability in exposures also limits the ability for the factors we did measure to
produce a quantifiable effect. Third, missing data for some outcomes, such as sleep, reduced the
power of those analyses. Fourth, while the sample size of participants was sufficiently powered,
factors that vary on building level, such as ventilation system type, have a sample size of 10 and
were underpowered. With this sample size we were not able to identify which individual green
credits were drivers of better performance, nor were we able to obtain the same level of building-
related design data from the non-certified buildings (precisely because they did not go through
the certification process). As such, it is possible that green certification in our study may simply
be a proxy for more relevant indicators of building performance. Fifth, we assessed the IEQ of
the workstations of our participants, which may not be representative of the building as a whole.
During our building assessment, we did not observe major differences in building systems,
operation or maintenance for areas of the building in which we did not have participants. As the
buildings were all high-performing, the results of the study may not be representative of

84
conventional or problem buildings. In addition, the study population is representative of the
general population of knowledge workers and may not be generalizable to other worker
populations.
The findings in this study hint at the complexity of understanding all of the building
related factors that can influence human health and performance. The measured IEQ variables
only accounted for part of the impact of green certification on productivity and health. Other
aspects of the green certification process – such as commissioning of building systems, 3rd
party
reviews of IEQ performance, and the commitment to sustainability and health of owners and
building managers – may play a role in how occupants perceive and perform in a building. Here,
we advocate for a holistic, “buildingomics” approach. Omics research describes efforts to
understand the totality of a given research field, currently best exemplified by genomics research
and the ambitious undertaking of the Human Genome Project. This has spurred a set of related –
omics research areas: transcriptomics, proteomics, metabolomics, epigenomics. And, in the field
of exposure science, the relatively new and equally challenging efforts to characterize human
exposures over the course of a person’s lifetime – the exposome [45]. We now propose
“buildingomics” to capture the complexity of the research of health in buildings.
“Buildingomics” is the totality of factors in indoor environments that influence human health,
well-being and productivity of people who work in those spaces. The primary challenge is that
buildings serve a variety of purposes and the potential exposures span several fields of study;
thus multi-disciplinary teams that include building scientists, exposure scientists,
epidemiologists, toxicologists, materials scientists, architects, designers, and social/behavioral
scientists are necessary to characterize all the building-related factors that influence health in
buildings.

85
3.5 Conclusions
Our findings show that in high-performing buildings additional benefits to health and
productivity may be obtained through green certification. In a sample of 10 high-performing
buildings, participants in green certified buildings had 26.4% higher cognitive function scores,
better environmental perceptions and fewer symptoms than those in high-performing, non-
certified buildings. The benefits of working in a green certified building extended beyond
working hours: participants in green certified buildings had 6.4% higher Sleep Scores than those
in non-certified ones. These outcomes were partially explained by IEQ factors, including thermal
conditions and lighting, but the findings suggest that the benefits of green certification standards
go beyond measureable IEQ factors. We describe the need for a holistic, “buildingomics”
approach to studying the drivers of human health and performance in buildings.
Acknowledgements
We would like to acknowledge our partners who allowed our team to investigate the impact of
buildings on their employees and tenants. We thank both the study participants and field staff for
volunteering their time. We also thank the reviewers of this manuscript for their thoughtful
comments that have strengthened the paper. This research was supported by a gift from United
Technologies to the Center for Health and the Global Environment at the Harvard T.H. Chan
School of Public Health. United Technologies was not involved in the recruitment of buildings
or participants, data collection, data analysis, data presentation, or drafting of the manuscript.
Mr. MacNaughton’s time was supported by NIEHS environmental epidemiology training grant
5T32ES007069-35.
86
References
[1] Wargocki, P., D. Wyon, J. Sundell, G. Clausen, and P.O. Fanger. 2000. The effects of
outdoor air supply rate in an office on perceived air quality, Sick Building Syndrome
(SBS) symptoms and productivity. Indoor Air-International Journal Of Indoor Air
Quality And Climate, 10(4): p. 222-236.
[2] Spengler, J.D. and K. Sexton. 1983. Indoor Air Pollution: A Public Health Perspective.
Science, 221(4605): p. 9-17.
[3] Weschler, C.J. 2009. Changes in indoor pollutants since the 1950s. Atmospheric
Environment, 43(1): p. 153-169.
[4] Mendell, M.J., W.J. Fisk, K. Kreiss, H. Levin, D. Alexander, W.S. Cain, J.R. Girman, C.J.
Hines, P.A. Jensen, D.K. Milton, L.P. Rexroat, and K.M. Wallingford. 2002. Improving
the Health of Workers in Indoor Environments: Priority Research Needs for a National
Occupational Research Agenda. American Journal of Public Health, 92(9): p. 1430-
1440.
[5] Spengler, J. Indoor air quality handbook, ed. J.F. McCarthy, J.M. Samet, and J.D. Spengler.
2001, New York: McGraw-Hill.
[6] Rudd, A. Ventilation system effectiveness and tested indoor air quality impacts, ed. D.
Bergey, et al. 2014: U.S. Department of Energy, Energy Efficiency & Renewable Energy,
Building Technologies Office.
[7] Allen, J.G., M.D. McClean, H.M. Stapleton, and T.F. Webster. 2008. Linking PBDEs in
House Dust to Consumer Products using X-ray Fluorescence. Environmental Science &
Technology, 42(11): p. 4222-4228.
87
[8] Dodson, R.E., L.J. Perovich, A. Covaci, N. Van Den Eede, A.C. Ionas, A.C. Dirtu, J.G.
Brody, and R.A. Rudel. 2012. After the PBDE phase-out: a broad suite of flame
retardants in repeat house dust samples from California. Environmental science &
technology, 46(24): p. 13056.
[9] Heakyung, C.Y. 2000. Differences in performance with different background sound and
ambient noise in three open office plans. The Journal of the Acoustical Society of
America, 108: p. 2632.
[10] Jahncke, H. 2012. Open-plan office noise: the susceptibility and suitability of different
cognitive tasks for work in the presence of irrelevant speech. Noise &Amp, 14(61): p.
315-320.
[11] Stone, P.T. 2009. A model for the explanation of discomfort and pain in the eye caused by
light. Lighting Research & Technology, 41(2): p. 109-121.
[12] Viola, A.U., L.J.M. James Lm Fau - Schlangen, D.-J. Schlangen Lj Fau - Dijk, and D.J.
Dijk. 2008. Blue-enriched white light in the workplace improves self-reported alertness,
performance and sleep quality. (0355-3140 (Print)).
[13] Hatvani-Kovacs, G., M. Belusko, N. Skinner, J. Pockett, and J. Boland. 2016. Drivers and
barriers to heat stress resilience. Science of the Total Environment.
[14] Park, J. Heat Stress and Human Capital Production (Job Market Paper), in JOB MARKET
PAPER - Unpublished Manuscript, Harvard University Economics Department, H.
University, Editor. 2016.
[15] Ulrich, R.S. 1984. View through a Window May Influence Recovery from Surgery. Science,
224(4647): p. 420-421.
[16] Wilson, E.O. Biophilia. 1986: President and Fellows of Harvard College.

88
[17] Da Silva, N.A.F., P. Wargocki, and K.W. Tham. Building certification schemes and the
quality of indoor environment, in Technical University of Denmark, Department of Civil
Engineering. 2015, DTU Civil Engineering Report R335.
[18] MacNaughton, P., J. Pegues, U. Satish, S. Santanam, J.D. Spengler, and J. Allen. 2015.
Economic, Environmental and Health Implications of Enhanced Ventilation in Office
Buildings. International Journal of Environmental Research and Public Health, 12.
[19] Maddalena, R., M.J. Mendell, K. Eliseeva, W.R. Chan, D.P. Sullivan, M. Russell, U. Satish,
and W.J. Fisk. 2015. Effects of ventilation rate per person and per floor area on perceived
air quality, sick building syndrome symptoms, and decision-making. Indoor Air, 25(4):
p. 362-370.
[20] Allen, J.G., P. MacNaughton, J.G.C. Laurent, S.S. Flanigan, E.S. Eitland, and J.D. Spengler.
2015. Green Buildings and Health. Current Environmental Health Reports, 2(3): p. 250-
258.
[21] Singh, A., M. Syal, S.C. Grady, and S. Korkmaz. 2010. Effects of green buildings on
employee health and productivity. American journal of public health, 100(9): p. 1665.
[22] Colton, M., P. MacNaughton, J. Vallarino, J. Kane, M. Bennett-Fripp, J. Spengler, and G.
Adamkiewicz. 2014. Indoor Air Quality in Green Vs Conventional Multifamily Low-
Income Housing. Environmental Science & Technology, 48(14): p. 7833-7833.
[23] Breysse, J., D.E. Jacobs, W. Weber, S. Dixon, C. Kawecki, S. Aceti, and J. Lopez. 2011.
Health Outcomes and Green Renovation of Affordable Housing. Public Health Reports,
126(Suppl 1): p. 64-75.

89
[24] Jacobs, D.E., E. Ahonen, S.L. Dixon, S. Dorevitch, J. Breysse, J. Smith, A. Evens, D.
Dobrez, M. Isaacson, C. Murphy, L. Conroy, and P. Levavi. 2014. Moving Into Green
Healthy Housing. Journal of Public Health Management and Practice: p. 1.
[25] Thiel, C.L., K.L. Needy, R. Ries, D. Hupp, and M.M. Bilec. 2014. Building design and
performance: A comparative longitudinal assessment of a Children's hospital. Building
and Environment, 78: p. 130-136.
[26] Newsham, G., B. Birt, C. Arsenault, L. Thompson, J. Veitch, S. Mancini, A. Galasiu, B.
Gover, I. Macdonald, and G. Burns. Do green buildings outperform conventional
buildings? Indoor environment and energy performance in North American offices, in
National Research Council Canada. Research Report; no. RR-329. 2012, National
Research Council Canada.
[27] Colton, M., J.G. Laurent, P. MacNaughton, J. Kane, M. Bennett-Fripp, J. Spengler, and G.
Adamkiewicz. 2015. Health Benefits of Green Public Housing: Associations With
Asthma Morbidity and Building-Related Symptoms. (1541-0048 (Electronic)).
[28] Satish, U., L. Cleckner, and J. Vasselli. 2013. Impact of VOCs on decision making and
productivity. Intelligent Buildings International, 5(4): p. 213-220.
[29] Satish, U., M.J. Mendell, K. Shekhar, T. Hotchi, D. Sullivan, S. Streufert, and W.J. Fisk.
2012. Is CO2 an indoor pollutant? Direct effects of Low-to-moderate CO2 concentrations
on human decision-making performance. Environmental Health Perspectives, 120(12):
p. 1671.
[30] MacNaughton, P., J. Spengler, J. Vallarino, S. Santanam, U. Satish, and J. Allen. 2016.
Environmental perceptions and health before and after relocation to a green building.
Building and Environment, 104: p. 138-144.

90
[31] Vehvilainen, T., H. Lindholm H Fau - Rintamaki, R. Rintamaki H Fau - Paakkonen, A.
Paakkonen R Fau - Hirvonen, O. Hirvonen A Fau - Niemi, J. Niemi O Fau - Vinha, and J.
Vinha. 2015. High indoor CO concentrations in an Office Environment Increases the
Transcutaneous CO Level and Sleepiness during Cognitive Work. (1545-9632
(Electronic)).
[32] ASHRAE. 2016. Standard 62.1-2016 -- Ventilation for Acceptable Indoor Air Quality.
American Society for Heating, Refrigeration, and Air-Conditioning Engineers, Inc.
[33] EPA. Building Assessment Survey and Evaluation. 1998 [cited 2015 1/22]; Available from:
http://www.epa.gov/iaq/base/study_overview.html.
[34] Ludwig, J., J. McCarthy, B. Baker, R. Caron, and D. Hanson. 2000. A Review of Selected
Methodologies to Determine Outdoor Air Ventilation Rates in BASE Study Buildings.
Air and Waste Management Assoc Conference.
[35] ASTM. Standard Test Method for Determining Air Change in a Single Zone by Means of a
Tracer Gas Dilution. 2011, ASTM International.
[36] Streufert, S., R. Pogash, and M. Piasecki. 1988. Simulation-based assessment of managerial
competence: Reliability and validity. Personnel Psychology, 41(3): p. 537-557.
[37] Satish, U., S. Streufert, M. Dewan, and S. Voort. 2004. Improvements in Simulated Real-
world Relevant Performance for Patients with Seasonal Allergic Rhinitis: Impact of
Desloratadine. Allergy, 59(4): p. 415-420.
[38] Breuer, K. and U. Satish. Emergency Management Simulations: An Approach to the
Assessment of Decision-making Processes in Complex Dynamic Crisis Environments, in
From Modeling to Managing Security: A Systems Dynamics Approach (J.J. G, ed). , N.A.
Press, Editor. 2003: Norway. p. 145–156.

91
[39] Allen, J.G., P. MacNaughton, S. Santanam, U. Satish, and J. Spengler. 2015. Associations
of Cognitive Function Scores with Carbon Dioxide, Ventilation, and Volatile Organic
Compound Exposures in Office Workers: A Controlled Exposure Study of Green and
Conventional Office Environments. Environmental Health Perspectives, 123(10).
[40] ASHRAE. 2010. Standard 55-2010 -- Thermal Environmental Conditions for Human
Occupancy. American Society for Heating, Refrigeration, and Air-Conditioning
Engineers, Inc.
[41] Fanger, P.O. Analysis and Applications in Environmental Engineering. 1970, New York:
McGraw-Hill Book Company.
[42] Seppänen, O., J.F. William, and L.-G. Quanhong. Effect of temperature on task performance
in office environment, in 5th International Conference on Cold Climate Heating,
Ventilating and Air Conditioning. 2006: Moscow, Russia.
[43] Lockley, S.W., C.A. Brainard Gc Fau - Czeisler, and C.A. Czeisler. 2003. High sensitivity
of the human circadian melatonin rhythm to resetting by short wavelength light. (0021-
972X (Print)).
[44] Takasu, N.N., S. Hashimoto, Y. Yamanaka, Y. Tanahashi, A. Yamazaki, S. Honma, and K.-
i. Honma. 2006. Repeated exposures to daytime bright light increase nocturnal melatonin
rise and maintain circadian phase in young subjects under fixed sleep schedule. American
Journal of Physiology - Regulatory, Integrative and Comparative Physiology, 291(6): p.
R1799-R1807.
[45] Rappaport, S.M. 2010. Implications of the exposome for exposure science. (1559-064X
(Electronic)).

92
SUMMARY
The findings of this dissertation are clear: green buildings outperform non-certified or
conventional buildings in terms of occupant cognitive function and health. In a controlled
laboratory environment, several key environmental parameters were isolated and shown to
impact cognitive function. Participants scored 61% higher on cognitive function tests when
VOCs were reduced from over 500 μg/m3 to less than 100 μg/m
3. Increasing outdoor air
ventilation rates in the low VOC environment from 20 cfm/person to 40 cfm/person led to an
additional 25% improvement in cognitive function scores. A significant portion of the benefit of
increased ventilation is attributable to lower CO2 levels. Independent of ventilation, CO2 was
shown to impact cognitive function scores. While holding outdoor air ventilation at 40
cfm/person, CO2 was added to the environment to reach a steady-state CO2 concentration
consistent with the 20 cfm/person scenario. Participants scored 20% higher on cognitive tests at
the low CO2 concentration than at the higher CO2 concentration. CO2, as a proxy for ventilation,
was also shown to impact heart rate and self-reported symptoms in a subsequent publication
from this study. On average, participants had 43% more symptoms (p-value = 0.019) and a 2
bpm higher heart rate (p-value < 0.001) for a 1000 ppm increase in indoor CO2 concentration
(MacNaughton et al., 2016).
The benefits of green buildings are not fully encapsulated in these IEQ factors. Indeed,
the mandatory credit on ventilation in LEED 2009 specifies the ASHRAE minimally acceptable
ventilation rate, and credits for higher ventilation rates and low emitting materials are optional
and adopted by 40.9% and 58.6%-94.4% of new building respectively. However, the benefits of
green certification extend beyond these factors. In a sample of 10 buildings with high ventilation
rates and low VOC concentrations, participants in green certified ones scored 26.4% higher on

93
cognitive tests and had 6.4% higher Sleep Quality scores. The difference in performance is partly
attributed to thermal comfort and better lighting, but much of the effect is unexplained. This is
the basis for Buildingomics, which advocates for an exhaustive evaluation of the indoor
environment in order to identify all the factors that influence performance and health. These
types of evaluations will be necessary to understand the complex relationships between built
environments and occupants.
Given the evidence shown in this dissertation and in the past 30 years of public health
literature on buildings and health, it is evident that green buildings should be adopted
preferentially over non-certified buildings. However, practitioners may cite economic and
environmental barriers to designing and operating green buildings. A group of 1,423 developers,
building owners, and tenants estimated the cost of constructing a green building to be 17%
higher than a conventional building (WBCSD, 2007). In actuality, the cost margins of green
construction are approximately 2%, according to an assessment of 33 green buildings. On the
other hand, green buildings are, on average, 25-30% more energy efficient than conventional
buildings, leading to a short return on cost margins and downstream environmental benefits
(Kats et al., 2003). Importantly, in the operation phase of green buildings, energy efficiency can
be obtained without compromising the indoor environment. In chapter 2 of this dissertation, we
found energy use on ventilation to be essentially the same when 40 cfm of outdoor air per person
is supplied with an ERV compared to when 20 cfm of outdoor air per person is supplied without
an ERV. This change in ventilation rate correlates with a $6,500 productivity gain per occupant
per year. By design, green buildings are better for the environment and occupant health. During
operation, they can provide healthy indoor environments while simultaneously being more

94
energy efficient than conventional buildings. The savings on energy and benefits to productivity
can overcome the small marginal investment in opting for green certification.
In the past, the public health literature has served to steer practitioners, retroactively,
away from building practices that lead to adverse health. For the first time in history, the
academic literature on building design and operation is generally supportive of current
commercial building practices. With this confluence of stakeholders, the opportunity to push the
healthy building agenda is upon us. The buildings of today will be the buildings of the next 50
years or longer, so academics and practitioners alike must leverage the existing evidence on
buildings and health to define the next generation of healthy buildings.

95
REFERENCES
Allen, J. G., MacNaughton, P., Laurent, J. G. C., Flanigan, S. S., Eitland, E. S., & Spengler, J. D.
(2015). Green Buildings and Health. Current Environmental Health Reports, 2(3), 250-
258. doi: 10.1007/s40572-015-0063-y
Gerber, D. (2000). Baubiologie in Theorie und Praxis. Heimatshutz Patrimoine, 95(3).
Industrial Hygiene Research, L. (1945). Formaldehyde, its toxicity and potential dangers.
Washington: U. S. Govt. print. off.
Kats, G., Alevantis, A., Mills, E., & Perlman, J. (2003). The Costs and Financial Benefits of
Green Buildings: A Report to California's Sustainable Building Task Force.
MacNaughton, P., Spengler, J., Vallarino, J., Santanam, S., Satish, U., & Allen, J. (2016).
Environmental perceptions and health before and after relocation to a green building.
Building and Environment, 104, 138-144. doi:
http://dx.doi.org/10.1016/j.buildenv.2016.05.011
Persily, A. (2015). Challenges in developing ventilation and indoor air quality standards: The
story of ASHRAE Standard 62. Building and Environment(91), 61-67.
Redlich, C. A., Sparer, J., & Cullen, M. R. (1997). Sick-building syndrome. The Lancet,
349(9057), 1013-1016. doi: http://dx.doi.org/10.1016/S0140-6736(96)07220-0
Riesenberg, D. E., & Arehart-Treichel, J. (1986). "Sick building" syndrome plagues workers,
dwellers. JAMA, 255(22), 3063-3063. doi: 10.1001/jama.1986.03370220021005
WBCSD. (2007). Energy Efficiency in Buildings: Business Realities and Opportunities: World
Business Council for Sustainable Development.