Green, blue or black, but washing–What company ...
22
Vol:.(1234567890) Environment, Development and Sustainability (2022) 24:4024–4045 https://doi.org/10.1007/s10668-021-01602-x 1 3 Green, blue or black, but washing–What company characteristics determine greenwashing? Silvia Ruiz‑Blanco 1 · Silvia Romero 2 · Belen Fernandez‑Feijoo 1 Received: 20 August 2020 / Accepted: 19 June 2021 / Published online: 29 June 2021 © The Author(s) 2021 Abstract The purpose of this paper is to study what are the characteristics that make firms less or more prone to greenwashing. We collect data from sustainability disclosures of the S&P top 100 companies, to investigate the determinants of greenwashing. We use content anal- ysis to measure the level of reporting of the companies. We define the “greenwashing” variable as the difference between what the company says it does in terms of commitment to sustainability, and what the company actually does as evaluated by external parties (Bloomberg ESG scores). Our results show that companies in environmentally sensitive industries greenwash less than their counterparts in other industries, as well as companies following the GRI guidelines. Companies that issue a sustainability report and assure it greenwash less than those that do not do it. Contrary to our intuition, companies in indus- tries with close proximity and high visibility greenwash more than their counterparts. A limitation of the paper is the inclusion in the sample of data from one country. Our findings have implications for policy-makers, particularly in Europe, where some European states have already regulated on green issues reporting and lately on blue issues. It might be interesting to consider both the industry effect and the relevance of reporting mechanisms when developing regulation and policies in order to improve the quality of sustainability reporting. We contribute to literature by proposing a new quantitative measure to assess greenwashing practices, to better understand the effect of industry and reporting mecha- nisms on greenwashing. Keywords Greenwashing · Sustainability · Reporting · ESG scores · Stakeholder · GRI * Belen Fernandez-Feijoo [email protected] Silvia Ruiz-Blanco [email protected] Silvia Romero [email protected] 1 ECOBAS, Faculty of Economics and Business, University of Vigo, Lagoas Marcosende s/n, 36310 Vigo, Spain 2 Montclair State University, 1 Normal Ave, Montclair, NJ 07043, USA
Transcript of Green, blue or black, but washing–What company ...
Vol:.(1234567890)
Environment, Development and Sustainability (2022) 24:4024–4045https://doi.org/10.1007/s10668-021-01602-x
1 3
Green, blue or black, but washing–What company characteristics determine greenwashing?
Silvia Ruiz‑Blanco1 · Silvia Romero2 · Belen Fernandez‑Feijoo1
Received: 20 August 2020 / Accepted: 19 June 2021 / Published online: 29 June 2021 © The Author(s) 2021
AbstractThe purpose of this paper is to study what are the characteristics that make firms less or more prone to greenwashing. We collect data from sustainability disclosures of the S&P top 100 companies, to investigate the determinants of greenwashing. We use content anal-ysis to measure the level of reporting of the companies. We define the “greenwashing” variable as the difference between what the company says it does in terms of commitment to sustainability, and what the company actually does as evaluated by external parties (Bloomberg ESG scores). Our results show that companies in environmentally sensitive industries greenwash less than their counterparts in other industries, as well as companies following the GRI guidelines. Companies that issue a sustainability report and assure it greenwash less than those that do not do it. Contrary to our intuition, companies in indus-tries with close proximity and high visibility greenwash more than their counterparts. A limitation of the paper is the inclusion in the sample of data from one country. Our findings have implications for policy-makers, particularly in Europe, where some European states have already regulated on green issues reporting and lately on blue issues. It might be interesting to consider both the industry effect and the relevance of reporting mechanisms when developing regulation and policies in order to improve the quality of sustainability reporting. We contribute to literature by proposing a new quantitative measure to assess greenwashing practices, to better understand the effect of industry and reporting mecha-nisms on greenwashing.
Keywords Greenwashing · Sustainability · Reporting · ESG scores · Stakeholder · GRI
* Belen Fernandez-Feijoo [email protected]
Silvia Ruiz-Blanco [email protected]
Silvia Romero [email protected]
1 ECOBAS, Faculty of Economics and Business, University of Vigo, Lagoas Marcosende s/n, 36310 Vigo, Spain
2 Montclair State University, 1 Normal Ave, Montclair, NJ 07043, USA
4025Green, blue or black, but washing–What company characteristics…
1 3
1 Introduction
Corporate social responsibility (CSR) refers to the integration of sustainability issues into the business strategy, and to keep an open-to-dialogue attitude with the firms’ stake-holders (European Commission 2001). CSR is a multilayered concept that sometimes is interchangeably used with sustainability (Strand, Freeman and Hockerts, 2015) or with corporate citizenship (World Bank, 2017). Research on CSR has been approached from different perspectives, and there is an important stream of literature that focuses on the symbolic (talk, self-serving), and substantive (walk, cause-serving) approach to CSR (e.g. Donia, Ronen, Tetrault Sirsly, and Bonaccio, 2019; Schons and Steinmeier, 2016; Shabana and Ravlin, 2016). The sustainability report is a tool that serves for both a sym-bolic and a substantive reporting purpose. A symbolic approach occurs when the aim of the report is to improve the company’s image and positively influence the readers about the firm (Bebbington, Larrinaga and Moneva, 2008; Marquis and Qian, 2014). This concept is also referred to as impression management (Brennan et al., 2009). On the contrary, under a substantive approach, the sustainability report intends to truly com-municate to the stakeholders, the economic, social and environmental impacts of the activities of the firm (Merkl-Davis and Brennan, 2011).
Given that the commitment to sustainability is not always directly observed, the sustainability report is the communication instrument that allows interested parties to assess the company’s levels of engagement in CSR. If there is symbolic communica-tion and no substantive actions on environmental issues, greenwashing occurs (Lyon and Maxwell, 2011). This paper responds to Lyon and Montgomery’s, (2015) call on the need to redirect academic research to greenwashing: “We call for research that identi-fies and catalogues the varieties of greenwash, draws on extant social science to theo-rize and model their mechanisms, and measures their impacts” (p.224). Although this is not a novel notice signaling the research gap (Deegan, 2002), it is a topic yet to be approached.
The aim of this paper is to better understand the greenwashing phenomenon. Green-washing is a complex term. However, all definitions coincide on the existence of a dif-ference between two behaviors: symbolic and substantive actions (Walker and Wan, 2012; Donia and Tetrault Sirsly, 2016); reputational intention and real sustainability performance (Steiner, Geissler, Schreder and Zenk, 2018); symbolic communication and non-substantive actions (Lyon and Maxwell, 2011), fake and real behavior (Del-mas and Burbano, 2011); or low CSR performance and a high communication standards (Contreras-Pacheco and Claasen, 2017). Given that these two behaviors are not always directly observable, \we define greenwashing as the distance between what is reported, based on the firms’ discourse, and the company’s commitment to sustainability, deter-mined by an externally established sustainability performance ratio. In doing so, we identify the existence of greenwashing and study what are the characteristics that make firms less or more prone to it.
Our results show that companies in environmentally sensitive industries (ESI) green-wash less at a global, environmental, and social levels, as well as companies follow-ing the GRI guidelines. Furthermore, companies in non-ESI or not following the GRI guidelines have over two times more probability of greenwashing than companies in ESI or following GRI. Companies that issue a sustainability report which includes assur-ance, greenwash less at a global level than those with no assurance. Contrary to our intuition, companies in industries with close proximity and high visibility green wash
4026 S. Ruiz-Blanco et al.
1 3
more than their counterparts at all levels. Regarding evolution, there are significantly more companies greenwashing at global and environmental levels in recent years.
We contribute to literature by proposing a new quantitative measure to assess green-washing practices, to better understand the effect of industry and reporting mechanisms on greenwashing. The industry effect depends on the balance between two counterpart strengths: Legitimation needs and stakeholder pressure. Reporting mechanisms can reduce the gap between what companies report and their actual actions and might facilitate a more effective assessment of greenwashing practices by the stakeholders. The paper is structured as follows. In Sect. 2 we discuss the definition of greenwashing. In Sect. 3 we develop the hypotheses. We then present the methodology followed by the results, discussion, and conclusions.
2 Greenwashing
Greenwashing has increased recently (Kim and Lyon, 2015) and it is becoming an alarm-ing universal behavior (Delmas and Burbano, 2011), not only imputable to firms. There are multiple agents engaged in greenwashing. Among them, Lyon and Montgomery, (2015) identify for-profit organizations, governments and politicians, research organizations, inter-national organizations (e.g. United Nations, World Bank), NGOs, and social and environ-mental movements. There is no generally accepted definition of greenwashing. It is a con-fusing concept that may be described and understood differently by different participants (Seele and Gatti, 2017).
Ingram and Fraizer (1980) and Wiseman, (1982) lay the grounds for a stream of research that focuses on the firms’ behavior and defines greenwashing as the gap between symbolic and substantive actions (Walker and Wan, 2012; Donia and Tetrault Sirsly, 2016). In a similar way, Steiner et al., (2018) contrast reputational intention and real sustainabil-ity performance, suggesting that, at least partially, it could be justified by the “incongru-ent explicit and implicit sustainability orientation of its executives” (p.1002). Lyon and Maxwell, (2011) suggest that greenwashing occurs when there is symbolic communica-tion, but no substantive actions on environmental issues. This behavior results on a firm’s strategy to improve legitimacy by signaling a fake behavior (Aragón-Correa, Marcus, and Hurtado-Torre 2016; Delmas and Burbano, 2011). Mahoney, Thorne, Cecil and LaGore, (2013) add a key point to the greenwashing conceptualization, when they consider it as a selective (not necessarily false) positive disclosure to impress stakeholders and mislead them. Khalil and O’sullivan (2017) qualify this behavior as hypocrite and deceptive. Fur-thermore, Contreras-Pacheco and Claasen, (2017) posit that companies that present an inconsistency between a low CSR performance and a high communication standard (e.g. level of reporting quality, transparency, etc.) are candidates to greenwashing. From a philo-logical perspective, Crilly, Hansen and Crollo (2016) conclude on the effect of linguistic style when analyzing the stakeholders’ perception of the sustainability information issued by companies.
Previous literature has focused on the determinants of greenwashing. Roulet and Tou-boul, (2015) report that larger size, less profitability and less risk-aversion determine the firms’ characteristics that increase the greenwashing trend. Similarly, Kim and Lyon, (2015) conclude that when companies are growing, they tend to greenwash; however, the scrutiny of external stakeholders softens this trend. They also conclude on the dissuasive effect of regulation on greenwashing. Aragón-Correa et al., (2016) find that the top 100
4027Green, blue or black, but washing–What company characteristics…
1 3
international firms present higher disclosure and lower performance than other companies do in the same industries (the control sample). There are also relevant institutional issues when analyzing greenwashing; cultural and national facts are related to the likelihood of greenwashing actions (Roulet and Touboul, 2015). There are two trends to be stressed when conceptualizing greenwashing (Lyon and Maxwell, 2011). The broad trend includes all sustainability issues, environmental, social and economic, under the concept of green-washing. The more specific trend applies the concept of greenwashing only to environ-mental issues, and the concept of bluewashing to social issues (Chen and Chang, 2013). The intentionality of the action is also important for the definition, and several authors talk about greenwashing only when a clear intention to mislead exists (Bowen and Aragon-Correa, 2014; Nyilasy, Gangadharbatla and Paladino, 2012). Moreover, like in the Volk-swagen emissions affaire, greenwashing may vary from a deliberated soft description, to a complete farce (Lyon and Montgomery, 2015). A third point that is sometimes highlighted is the existence of a claim. Without it, Seele and Gatti, (2017) posit that greenwashing is, at least, questionable. To complete the scenario, greenwashing may be considered as an outcome of stakeholders’ perceptions about divergences between sustainable behavior and sustainability communication (Palazzo and Scherer, 2006). Based on these elements, Seele and Gatti, (2017, p.248) define greenwashing as: “… a co-creation of an external accusation toward an organization with regard to presenting a misleading green message.” The authors consider necessary “the accusation element in the definition of greenwash-ing, because greenwashing cannot be understood without its perception in the eye of the beholder” (p.248). On the other hand, due to the subjective nature of perceptions, the iden-tification of real greenwashing is a challenge for stakeholders. Academics are to contribute to enlighten this issue.
Greenwashing effects have been approached from different perspectives. For instance, Schons and Steinmeier, (2016) analyze the link between the CSR actions taken by firms and their financial performance. Their results indicate that the actions taken towards sus-tainability are perceived differently depending on the stakeholder group (low or high stake-holder proximity). Interestingly enough, they report on the difficulty that low-proximity stakeholders have, in order to identify symbolic and substantive actions. They use the expression from Shakespeare’s The Merchant of Venice: not all that glitters is gold. From a marketing perspective, Lin, Lobo and Leckie, (2017) consider greenwashing as the associa-tion of a firm to a non-existing green functionality of the products they offer. These authors highlight the negative consequences of this practice on the green market, prompting a skep-tical attitude of consumers. Greenwashing is risky (Kim, Fairclough, and Dibrell, 2017), but it is also a perceptional issue that can be manipulated and changed with impression management. Kim et al., (2017) study the relationship between the managerial approach to environmental issues and the ownership structure of the firm, namely family business. Their results suggest higher levels of greenwashing in non-family firms. The authors sug-gest that the former are long-term oriented and therefore more committed to environmental preservation. Wang et al., (2018) compare CSR performance (using Bloomberg and KLD databases) and the readability of CSR reports of a sample of US companies. They find that higher performing companies use highly readable narrative to disclose their CSR achieve-ments. Lower performance companies use complex language in order to confuse and miti-gate negative reactions from readers. The authors use disaggregated measures of social and environmental activities. They conclude that CSR report readability is positively related to social performance, but they do not find significant association between readability and environmental performance, suggesting that social information may be easier to manipu-late than the environmental one.
4028 S. Ruiz-Blanco et al.
1 3
Lyon and Montgomery, (2015) present a deep analysis of the state of the art regarding greenwashing. Although they follow the environmental trend for the greenwashing con-ceptualization, their analysis can also be applicable with a broader approach. They center their debate in the three main disciplines in which what they call misleading communica-tion appears. These disciplines are organization theory, “integrating more nuanced mod-els of human cognition with theories of organizational behavior and collective action” through stakeholders groups (pp.242-243); economics, providing “an opening for an inter-disciplinary dialogue on deception that will produce valuable new insights” (p.242); and marketing, examining “the persuasive role of visual rhetoric and semiotics” (p.242). The authors identify a non-exhaustive list of greenwashing behaviors such as selective disclo-sure; empty green claims and policies; dubious certifications and labels; co-opted NGO endorsements/partnerships; ineffective public voluntary programs; misleading narrative and discourse; and misleading visual imagery. They also analyze the lack of trust produced by greenwashing in society, as well as the not-so-clear expected benefits of greenwashing for companies. They show that previous research has concluded on a neutral or negative effect. As mentioned before, there are two current trends when considering greenwashing. The first one applies this concept to the differences rising when sustainability (environ-mental, social and economic) communication and CSR performance are compared. The second one only considers environmental issues under the notion of greenwashing. Fur-thermore, a specific term for these differences between communication and behavior on social issues has been coined bluewashing. This paper focuses on those two more relevant issues, according to previous literature, environmental and social. Despite the approach of this paper, and given that to the best of our knowledge, there is no specific term for differ-ences on economic issues linked to sustainability, we coin a new word, blackwashing, to name differences between communication and behavior on economic issues.
3 Hypotheses development
The multilevel conceptualization in management (Bies, Bartunek, Fort. and Zald 2007; Hitt, Beamish, Jackson and Mathieu, 2007) has been applied to CSR by Frynas and Ste-phens, (2015). They categorize CSR as “… an umbrella term for a variety of concepts and practices” (p.485). The CSR conceptualization varies among different national and industry contexts and it also changes over time. Frynas and Stephens, (2015) define three theoretical levels of analysis to better understand CSR research. The macro-level is domi-nated by the institutional theory (Kolk and Perego, 2010; Simnett, Vanstraelen and Chua, 2009), based on which companies behave in a similar way as their counterparts within their environment. Hence, the institutional environment conditions the isomorphic CSR behavior of companies. According to this theory, there is a macro-level background, dif-ferent in each country and/or industry, which has to be considered when researching on CSR issues. Thus, the institutional environment, or macro-level, affects the firms’ strategy, behavior and communication on sustainability. The second level, or meso-level, is mostly represented by the stakeholder theory. Under this theory, it is expected a two-way relation-ship between a firm and its stakeholders: the later will influence the former and vice versa. Thus, the stakeholder ecosystem, or meso-level, will affect the firms’ strategy, behavior and communication on sustainability. Finally, the micro-level, at an individual plane, assumes that individuals are relevant in shaping CSR. The scarce literature that has applied this approach to CSR, used the agency theory to explain the role of the top management team

4029Green, blue or black, but washing–What company characteristics…
1 3
on the definition of the company’s CSR policy (Barnea and Rubin, 2010; Faleye and Tra-han, 2011). Thus, individuals within the firm, or micro-level, affect the firms’ strategy, behavior and communication on sustainability.
The multilevel approach, understood as multi-theoretical approach, is also used when explaining sustainability reporting (Chen and Robert 2010; Soobaroyen and Mahadeo, 2016; Lokuwaduge and Heenetigala, 2017). Each theory explains the sustainability report-ing behavior and strategies of the companies from a different perspective, applying a dif-ferent approach. Jointly, these theories offer a holistic panorama to understanding the rationale behind the decision companies make to voluntarily report on their sustainability impacts, and how to do it. In sum, the decision of a firm to report on the environmen-tal, social, and economic impact of its activity might be influenced by, among others, the institutional context, the pressure of stakeholders, the company’s need to be legitimized by society, and even by individual circumstances and characteristics of employees exerting a formal or informal authority and leadership within the company.
We use a multi-theoretical approach in this paper. Sustainability reports are a legitima-tion instrument used by companies to respond to their and the society’s needs (Cho, Freed-man, and Patten, 2012; Cho and Patten, 2007). Companies identify their key stakeholders in order to assess what the society expects from them. The desired (and designed) relation-ship between the company and their stakeholders is the base on which the firm’s legitimacy is build (Gray and Bebbington, 2000). The need for legitimation of the companies as well as the pressure exerted by the stakeholders lead companies to use their CSR disclosures to screen a reputable image and a positive impression (Holder-Webb, Cohen, Nath and Wood, 2009), avoiding any negative impact (Hahn and Lülfs, 2014; Lougee and Wallace, 2008). Thus, the final intention of CSR disclosure is to modify the stakeholders’ perceptions. If companies are involved in greenwashing, they might use CSR communication to present an image that exceeds the true CSR performance, and by those means distort the reality. These companies assume the risk of being punished by society if they are discovered (Bansal and Clelland, 2004; Kim et al., 2017; Seele and Gatti, 2017). The assumption of a certain reputational risk might indicate that the likelihood of being discovered is low and that the cost of greenwashing is lower than the cost of being truthful when reporting their impacts. From a pragmatic point of view, without ethical considerations, greenwashing pays if legit-imacy gains outweigh the costs, including the named reputational risk. The assessment of the reputational risk is the key element in the decision-making process of greenwashing (Bebbington et al., 2008). It is assumed that the risk depends on the stakeholders’ capa-bility to assess CSR performance and compare it with CSR disclosure. Thus, companies with higher pressure from their stakeholders have higher reputational risk and therefore fewer incentives to present distorted CSR information. Marquis et al., (2016) refer to selec-tive disclosure as a form of greenwashing. The authors measure selective disclosure by the difference between the symbolic and the substantive transparency, using the Trucost dataset. Selective disclosure appears when a company discloses more of their less harmful indicators and less of their more harmful indicators. Using a sample of 4750 companies in 45 countries, they find less greenwashing in environmentally damaging companies. This effect is even stronger in those environmentally damaging companies under scrutiny (e.g. intergovernmental environmental organizations; normative pressure). Higher pressure can be represented by visibility and stakeholder proximity. Walker and Wan, (2012) report that in visible polluting firms there is a negative financial effect of greenwashing. This effect increases the risk of being punished and may be dissuasive for greenwashing. Consumer proximity (Cheng and Chang 2013; Schons and Steinmeier, 2016) or high visibility (Del-mas and Montes-Sancho, 2010) are also deterrent factors of greenwashing.
4030 S. Ruiz-Blanco et al.
1 3
Based on our previous analysis, we propose our first set of hypotheses:
H1 There is less greenwashing among firms that belong to an environmentally sensitive industry than among their counterparts in other industries.
H2 There is less greenwashing among firms that belong to an industry with close-proxim-ity to customers or with high visibility than among their counterparts in other industries.
Signaling as well as voluntary disclosure theories present an economic-based ground to understand why sustainability reporting is a legitimacy tool. Stiglitz, (2000) posits that “there are important asymmetries of information, and the extent of information asym-metries is affected by actions of firms and individuals” (p.1441). Standards and guide-lines reduce the reporting-performance gap (Adams, 2004). According to signaling theory (Spence, 1973), the better-informed agents (managers) use the signal to reduce the infor-mation asymmetry with the less-informed ones (stakeholders) and legitimize their activ-ity. Given this theory and following the concepts expressed by Connelly et al., (2011), managers in companies engaged in sustainability signal the unobservable (quality of their commitment to sustainability) with the observable information reported to reduce informa-tion asymmetry. Different signals are used. The observable information is usually chan-neled through a sustainability report, such as stand-alone or integrated report; following a reporting standard (e.g. GRI guidelines); or enhancing the quality of the information dis-closed (e.g. external assurance statement). All of them are considered mechanisms to man-age CSR communication and to reduce information asymmetry. Therefore, it is expected that companies that use these mechanisms to communicate their CSR performance are less prone to engage in greenwashing. Following this rationale, we posit our second set of hypotheses as follows:
H3 There is less greenwashing among firms issuing sustainability reports than among their counterparts presenting sustainability information within the annual reports.
H4 There is less greenwashing among firms following GRI guidelines than among their counterparts not following them.
H5 There is less greenwashing among firms that assure their sustainability reports than among their counterparts that do not.
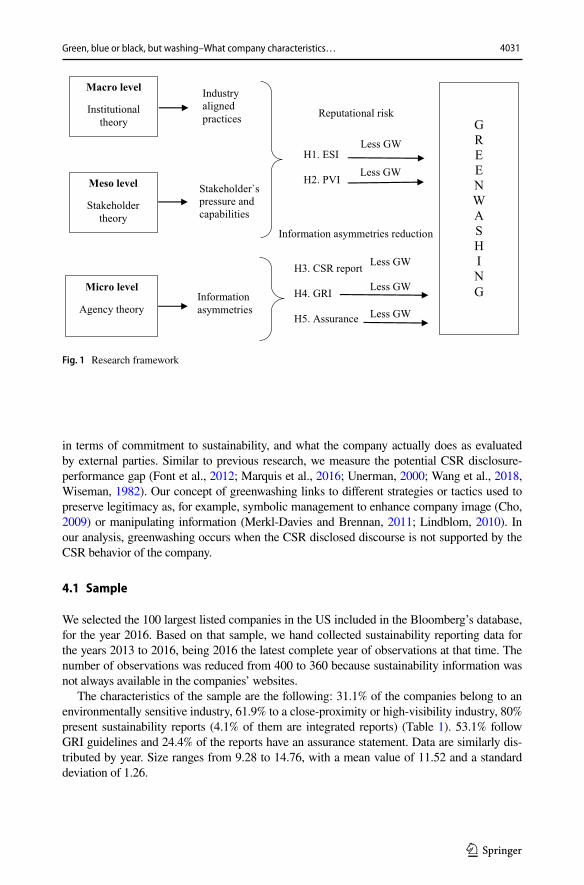
Figure 1 represents our research framework.
4 Methodology
The repeated intentional use of words containing social and environmental weight might be used to increase the signal, with the purpose of modifying readers’ perceptions, enhancing the image (facade) of the firm, and increasing its legitimacy. This strategy of creating con-fusion in the addressees of sustainability information is supported by the lack of sufficient information disclosed to the stakeholders (Busch and Hoffmann, 2009; Lyon and Maxwell, 2011). We use the term greenwashing as a distortion of the signal. To test our hypotheses we define the “greenwashing” variable as the difference between what the company says it does
4031Green, blue or black, but washing–What company characteristics…
1 3
in terms of commitment to sustainability, and what the company actually does as evaluated by external parties. Similar to previous research, we measure the potential CSR disclosure-performance gap (Font et al., 2012; Marquis et al., 2016; Unerman, 2000; Wang et al., 2018, Wiseman, 1982). Our concept of greenwashing links to different strategies or tactics used to preserve legitimacy as, for example, symbolic management to enhance company image (Cho, 2009) or manipulating information (Merkl-Davies and Brennan, 2011; Lindblom, 2010). In our analysis, greenwashing occurs when the CSR disclosed discourse is not supported by the CSR behavior of the company.
4.1 Sample
We selected the 100 largest listed companies in the US included in the Bloomberg’s database, for the year 2016. Based on that sample, we hand collected sustainability reporting data for the years 2013 to 2016, being 2016 the latest complete year of observations at that time. The number of observations was reduced from 400 to 360 because sustainability information was not always available in the companies’ websites.
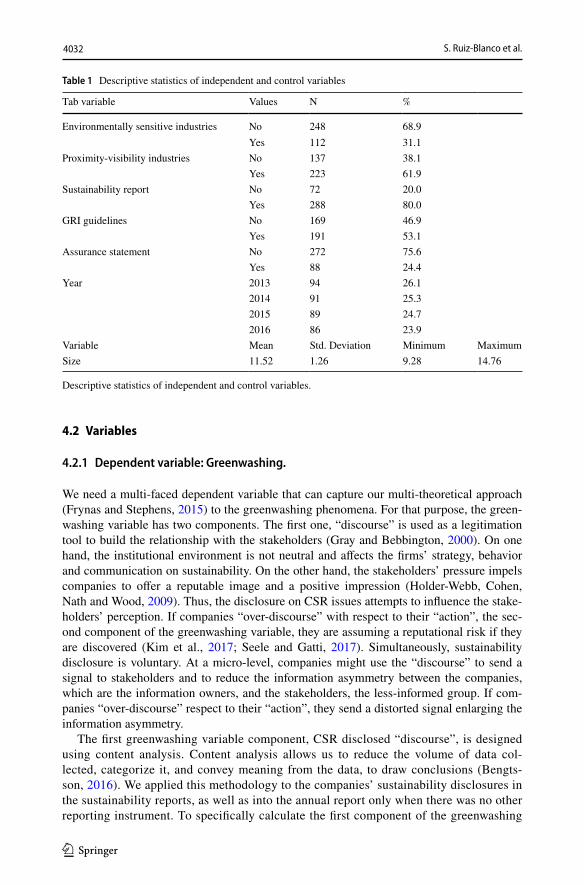
The characteristics of the sample are the following: 31.1% of the companies belong to an environmentally sensitive industry, 61.9% to a close-proximity or high-visibility industry, 80% present sustainability reports (4.1% of them are integrated reports) (Table 1). 53.1% follow GRI guidelines and 24.4% of the reports have an assurance statement. Data are similarly dis-tributed by year. Size ranges from 9.28 to 14.76, with a mean value of 11.52 and a standard deviation of 1.26.
Information asymmetries reduction
Macro level
Institutional theory
Meso level
Stakeholder theory
Micro level
Agency theory Information asymmetries
Stakeholder`s pressure and capabilities
Industry aligned practices
Less GW
Less GW
Reputational risk
H3. CSR report
H4. GRI
H5. Assurance
G R E E N W A S H I N G
H1. ESI
H2. PVI
Less GW
Less GW
Less GW
Fig. 1 Research framework
4032 S. Ruiz-Blanco et al.
1 3
4.2 Variables
4.2.1 Dependent variable: Greenwashing.
We need a multi-faced dependent variable that can capture our multi-theoretical approach (Frynas and Stephens, 2015) to the greenwashing phenomena. For that purpose, the green-washing variable has two components. The first one, “discourse” is used as a legitimation tool to build the relationship with the stakeholders (Gray and Bebbington, 2000). On one hand, the institutional environment is not neutral and affects the firms’ strategy, behavior and communication on sustainability. On the other hand, the stakeholders’ pressure impels companies to offer a reputable image and a positive impression (Holder-Webb, Cohen, Nath and Wood, 2009). Thus, the disclosure on CSR issues attempts to influence the stake-holders’ perception. If companies “over-discourse” with respect to their “action”, the sec-ond component of the greenwashing variable, they are assuming a reputational risk if they are discovered (Kim et al., 2017; Seele and Gatti, 2017). Simultaneously, sustainability disclosure is voluntary. At a micro-level, companies might use the “discourse” to send a signal to stakeholders and to reduce the information asymmetry between the companies, which are the information owners, and the stakeholders, the less-informed group. If com-panies “over-discourse” respect to their “action”, they send a distorted signal enlarging the information asymmetry.
The first greenwashing variable component, CSR disclosed “discourse”, is designed using content analysis. Content analysis allows us to reduce the volume of data col-lected, categorize it, and convey meaning from the data, to draw conclusions (Bengts-son, 2016). We applied this methodology to the companies’ sustainability disclosures in the sustainability reports, as well as into the annual report only when there was no other reporting instrument. To specifically calculate the first component of the greenwashing
Table 1 Descriptive statistics of independent and control variables
Descriptive statistics of independent and control variables.
Tab variable Values N %
Environmentally sensitive industries No 248 68.9Yes 112 31.1
Proximity-visibility industries No 137 38.1Yes 223 61.9
Sustainability report No 72 20.0Yes 288 80.0
GRI guidelines No 169 46.9Yes 191 53.1
Assurance statement No 272 75.6Yes 88 24.4
Year 2013 94 26.12014 91 25.32015 89 24.72016 86 23.9
Variable Mean Std. Deviation Minimum MaximumSize 11.52 1.26 9.28 14.76

4033Green, blue or black, but washing–What company characteristics…
1 3
variable, we downloaded the reports, and used “RapidMiner” to separate the linguis-tic sentences. We then identified the words used in the report, considering the target concept phrases selected based on previous research (Michelon, Pilonato and Ricceri, 2015; Romero, Ruiz and Fernandez-Feijoo, 2019). We based the target concept phrases on the social and environmental categories of the GRI framework. This selection rep-resents a wide spectrum of terms and words of extended use in the disclosures on CSR (Table 2). To measure CSR disclosed discourse we use Beretta and Bozzolan’s, (2004) accuracy construct. This construct is a weighted disclosure score assessing sentences with monetary values weight 3, with numerical values weight 2 and textual sentences weight 1 (Michelon et al., 2015). It reflects the exactness of the discourse, going from the less precise (text) through a more precise measure (quantitative) to the most precise one represented by monetarization. CSR disclosed discourse is the ratio between the total amount of the weighted sentences and the total number of sentences in the report. Its value is standardized from 0 to 1.
To measure the second component of our greenwashing variable, “action”, we use the Bloomberg ESG scores following previous literature (Aragón-Hurtado et al. 2016; García et al 2019; Nollet et al., 2016; Taylor et al., 2018; Wang et al., 2018). This data-base is extensively used for research as it covers a wide range of concepts representing the companies’ sustainability behavior. The information provided by what is known as the Bloomberg terminal is described as follows:
The scores section provides a snapshot of ESG scores, rankings, and ratings from Bloomberg and third party ratings agencies, so you can gain proprietary and outside perspectives on a company’s ESG risks. You can assess how effective a company’s ESG strategies are based on data from Bloomberg and other contrib-utors that evaluate company performance in the context of sustainability issues. (Bloomberg, 2018, 4).
Table 2 Corporate Social Responsibility concepts
Corporate Social Responsibility terms used in the content analysis. This selection represents a wide spec-trum of terms and words of extended use in the disclosures on CSR.
Environmental Social - Labor Social – Human rights Social - Society
Material Employment Discrimination Public policyEnergy Labor Freedom of association CorruptionWater Labor relations Collective bargaining Anti-competitive behaviorBiodiversity Labor management Child labor ComplianceEmission Employee Forced labor SocietyEffluent Employee health Compulsory labor Impact societywaste Employee safety Security Local communitiesclimate Training Indigenous rightscompliance Education Human rightstransport Diversityenvironment Equal opportunityenvironmental initiatives Equal remunerationenvironmental assessment Labor practices
Employee grievance
4034 S. Ruiz-Blanco et al.
1 3
The Bloomberg ESG Scorecard “rates and classifies performance of companies or portfolios” (Novethic, 2013 29). Huber and Comstock, (2017) resume the scores con-struction. It starts with the CSR information disclosed by the company. Then, 120 envi-ronmental, social and governance indicators are checked by means of direct contact with the company and other public sources. Missing information is penalized. Based on this procedure, we conclude that:
ESG scores = Information disclosed by the firm ± adjustments based on other infor-mation sources.
Hence, the ESG scores represent what companies really do on environmental, social and governance issues.
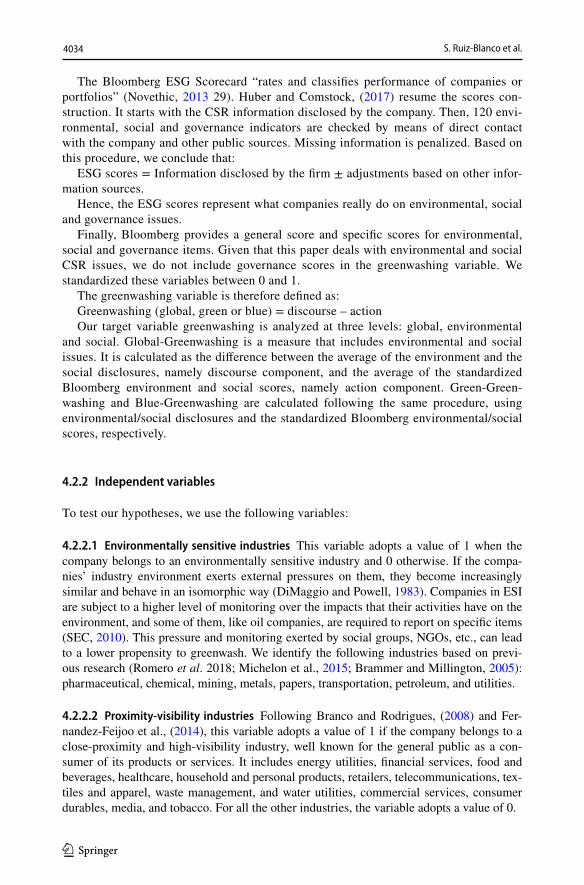
Finally, Bloomberg provides a general score and specific scores for environmental, social and governance items. Given that this paper deals with environmental and social CSR issues, we do not include governance scores in the greenwashing variable. We standardized these variables between 0 and 1.
The greenwashing variable is therefore defined as:Greenwashing (global, green or blue) = discourse – actionOur target variable greenwashing is analyzed at three levels: global, environmental
and social. Global-Greenwashing is a measure that includes environmental and social issues. It is calculated as the difference between the average of the environment and the social disclosures, namely discourse component, and the average of the standardized Bloomberg environment and social scores, namely action component. Green-Green-washing and Blue-Greenwashing are calculated following the same procedure, using environmental/social disclosures and the standardized Bloomberg environmental/social scores, respectively.
4.2.2 Independent variables
To test our hypotheses, we use the following variables:
4.2.2.1 Environmentally sensitive industries This variable adopts a value of 1 when the company belongs to an environmentally sensitive industry and 0 otherwise. If the compa-nies’ industry environment exerts external pressures on them, they become increasingly similar and behave in an isomorphic way (DiMaggio and Powell, 1983). Companies in ESI are subject to a higher level of monitoring over the impacts that their activities have on the environment, and some of them, like oil companies, are required to report on specific items (SEC, 2010). This pressure and monitoring exerted by social groups, NGOs, etc., can lead to a lower propensity to greenwash. We identify the following industries based on previ-ous research (Romero et al. 2018; Michelon et al., 2015; Brammer and Millington, 2005): pharmaceutical, chemical, mining, metals, papers, transportation, petroleum, and utilities.
4.2.2.2 Proximity‑visibility industries Following Branco and Rodrigues, (2008) and Fer-nandez-Feijoo et al., (2014), this variable adopts a value of 1 if the company belongs to a close-proximity and high-visibility industry, well known for the general public as a con-sumer of its products or services. It includes energy utilities, financial services, food and beverages, healthcare, household and personal products, retailers, telecommunications, tex-tiles and apparel, waste management, and water utilities, commercial services, consumer durables, media, and tobacco. For all the other industries, the variable adopts a value of 0.

4035Green, blue or black, but washing–What company characteristics…
1 3
4.2.2.3 Sustainability report This variable adopts a value of 1 if the company discloses the sustainability information using a stand-alone or an integrated report, 0 if it presents the sustainability information within the annual report.
4.2.2.4 GRI guidelines It represents the use of the GRI guidelines. Although there is not a generally accepted reporting model for CSR information, the GRI framework is the most extensively used one (Moneva, Archel, and Correa, 2006), and it was found associ-ated with higher quality of sustainability information (Rankin, Windsor and Wahyuni, 2011). It adopts a value of 1 when the report follows these guidelines and 0 otherwise.
4.2.2.5 Assurance statement It has been linked to CSR information quality (Kuruppu and Milne, 2009; Hąbek and Wolniak, 2016). It indicates if the report has been assured by a third party (value 1) or not (value 0).
4.2.3 Control variables
4.2.3.1 Size Large companies have higher reputational risk than smaller ones in presenting a distorted image, and they might try to adjust the CSR information to their performance in CSR. We use the logarithm of total assets to measure this variable.
4.2.3.2 Year It adopts 4 values to indicate the fiscal year of the report.
4.3 Model
We test our hypotheses by running three linear regressions, for each of the three depend-ent variables. Given that our data set is not affected by autocorrelation and heterosce-dasticity, Ordinary Least Squares (OLS) is an appropriated tool to test the effect of the independent and control variables on the dependent variables. OLS minimizes the sum of the squares in the difference between the observed dependent variable (GW) and the estimated predicted values based on the linear relationships of the independent and con-trol variables. The model is stated as follows:
where GW represents each of the greenwashing dependent variables in each of the three models; β0, is the intercept or constant of the model; βj = 1 to 7 is the coefficient of each explanatory variable; and ε is the random measurement error.
5 Results
5.1 Descriptive statistics of Greenwashing variables
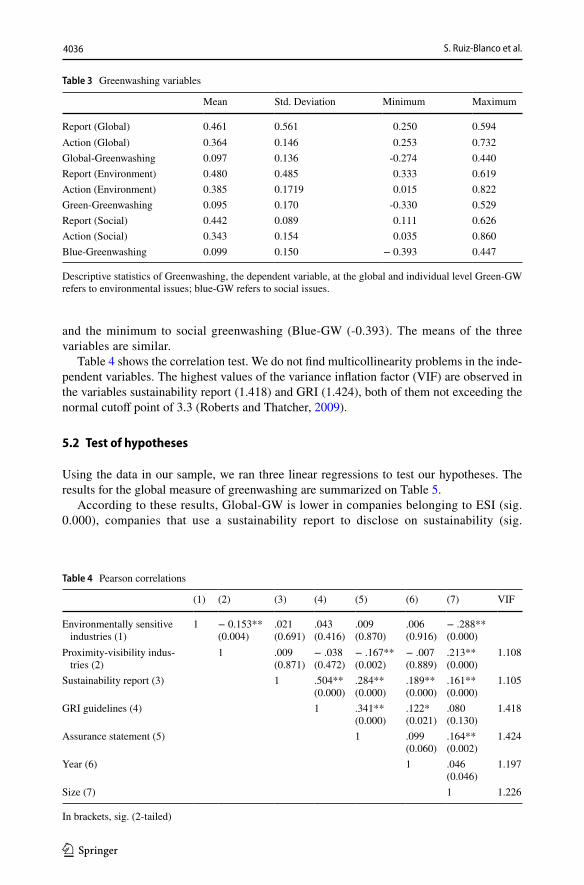
The sample is composed of 360 company-year reports. Table 3 shows the descriptive statistics of Greenwashing, the dependent variable, at the global and individual level. The maximum value corresponds to environmental greenwashing (Green-GW) (0.529)
GW = �0 + �1ESI + �2PVI + �3SR + �4GRI + �5AS + �6Size + �7Year + �
4036 S. Ruiz-Blanco et al.
1 3
and the minimum to social greenwashing (Blue-GW (-0.393). The means of the three variables are similar.
Table 4 shows the correlation test. We do not find multicollinearity problems in the inde-pendent variables. The highest values of the variance inflation factor (VIF) are observed in the variables sustainability report (1.418) and GRI (1.424), both of them not exceeding the normal cutoff point of 3.3 (Roberts and Thatcher, 2009).
5.2 Test of hypotheses
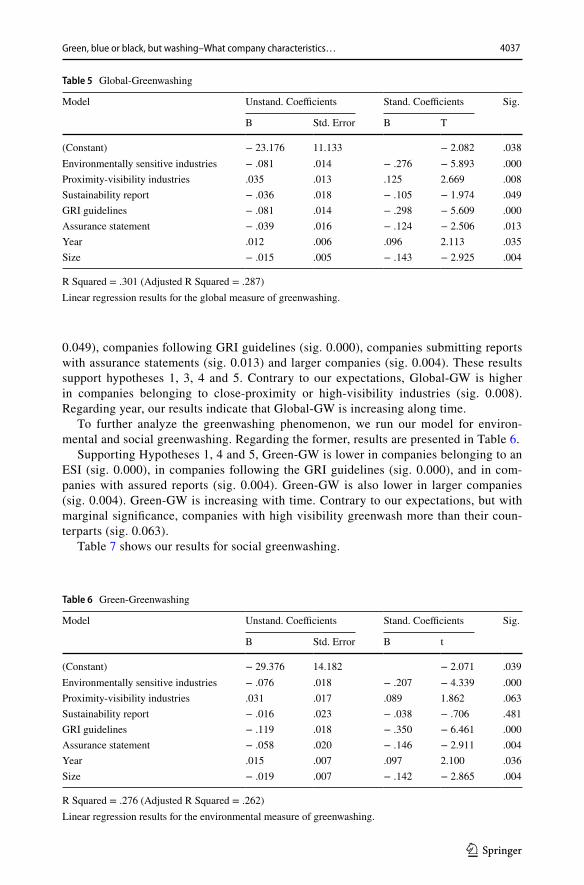
Using the data in our sample, we ran three linear regressions to test our hypotheses. The results for the global measure of greenwashing are summarized on Table 5.
According to these results, Global-GW is lower in companies belonging to ESI (sig. 0.000), companies that use a sustainability report to disclose on sustainability (sig.
Table 3 Greenwashing variables
Descriptive statistics of Greenwashing, the dependent variable, at the global and individual level Green-GW refers to environmental issues; blue-GW refers to social issues.
Mean Std. Deviation Minimum Maximum
Report (Global) 0.461 0.561 0.250 0.594Action (Global) 0.364 0.146 0.253 0.732Global-Greenwashing 0.097 0.136 -0.274 0.440Report (Environment) 0.480 0.485 0.333 0.619Action (Environment) 0.385 0.1719 0.015 0.822Green-Greenwashing 0.095 0.170 -0.330 0.529Report (Social) 0.442 0.089 0.111 0.626Action (Social) 0.343 0.154 0.035 0.860Blue-Greenwashing 0.099 0.150 − 0.393 0.447
Table 4 Pearson correlations
In brackets, sig. (2-tailed)
(1) (2) (3) (4) (5) (6) (7) VIF
Environmentally sensitive industries (1)
1 − 0.153**(0.004)
.021(0.691)
.043(0.416)
.009(0.870)
.006(0.916)
− .288**(0.000)
Proximity-visibility indus-tries (2)
1 .009(0.871)
− .038(0.472)
− .167**(0.002)
− .007(0.889)
.213**(0.000)
1.108
Sustainability report (3) 1 .504**(0.000)
.284**(0.000)
.189**(0.000)
.161**(0.000)
1.105
GRI guidelines (4) 1 .341**(0.000)
.122*(0.021)
.080(0.130)
1.418
Assurance statement (5) 1 .099(0.060)
.164**(0.002)
1.424
Year (6) 1 .046(0.046)
1.197
Size (7) 1 1.226
4037Green, blue or black, but washing–What company characteristics…
1 3
0.049), companies following GRI guidelines (sig. 0.000), companies submitting reports with assurance statements (sig. 0.013) and larger companies (sig. 0.004). These results support hypotheses 1, 3, 4 and 5. Contrary to our expectations, Global-GW is higher in companies belonging to close-proximity or high-visibility industries (sig. 0.008). Regarding year, our results indicate that Global-GW is increasing along time.
To further analyze the greenwashing phenomenon, we run our model for environ-mental and social greenwashing. Regarding the former, results are presented in Table 6.
Supporting Hypotheses 1, 4 and 5, Green-GW is lower in companies belonging to an ESI (sig. 0.000), in companies following the GRI guidelines (sig. 0.000), and in com-panies with assured reports (sig. 0.004). Green-GW is also lower in larger companies (sig. 0.004). Green-GW is increasing with time. Contrary to our expectations, but with marginal significance, companies with high visibility greenwash more than their coun-terparts (sig. 0.063).
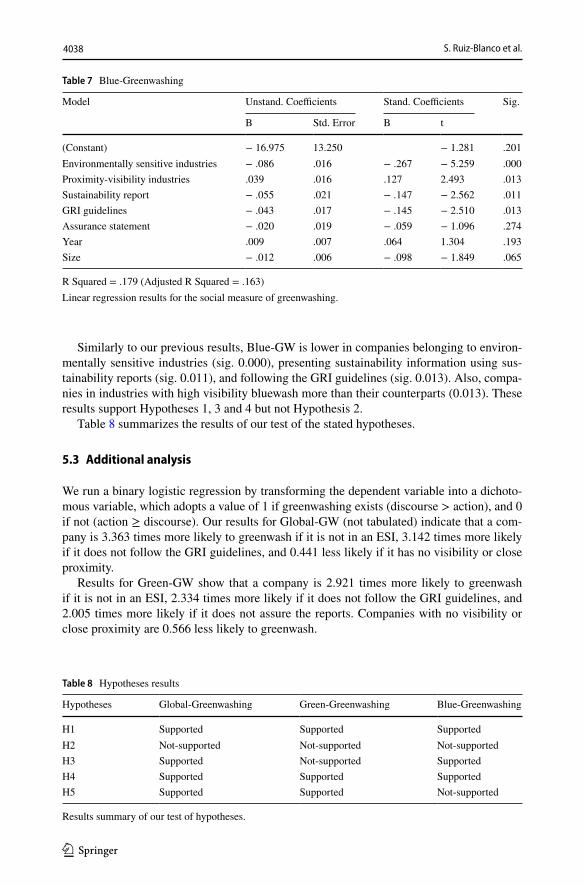
Table 7 shows our results for social greenwashing.
Table 5 Global-Greenwashing
R Squared = .301 (Adjusted R Squared = .287)Linear regression results for the global measure of greenwashing.
Model Unstand. Coefficients Stand. Coefficients Sig.
B Std. Error B T
(Constant) − 23.176 11.133 − 2.082 .038Environmentally sensitive industries − .081 .014 − .276 − 5.893 .000Proximity-visibility industries .035 .013 .125 2.669 .008Sustainability report − .036 .018 − .105 − 1.974 .049GRI guidelines − .081 .014 − .298 − 5.609 .000Assurance statement − .039 .016 − .124 − 2.506 .013Year .012 .006 .096 2.113 .035Size − .015 .005 − .143 − 2.925 .004
Table 6 Green-Greenwashing
R Squared = .276 (Adjusted R Squared = .262)Linear regression results for the environmental measure of greenwashing.
Model Unstand. Coefficients Stand. Coefficients Sig.
B Std. Error B t
(Constant) − 29.376 14.182 − 2.071 .039Environmentally sensitive industries − .076 .018 − .207 − 4.339 .000Proximity-visibility industries .031 .017 .089 1.862 .063Sustainability report − .016 .023 − .038 − .706 .481GRI guidelines − .119 .018 − .350 − 6.461 .000Assurance statement − .058 .020 − .146 − 2.911 .004Year .015 .007 .097 2.100 .036Size − .019 .007 − .142 − 2.865 .004
4038 S. Ruiz-Blanco et al.
1 3
Similarly to our previous results, Blue-GW is lower in companies belonging to environ-mentally sensitive industries (sig. 0.000), presenting sustainability information using sus-tainability reports (sig. 0.011), and following the GRI guidelines (sig. 0.013). Also, compa-nies in industries with high visibility bluewash more than their counterparts (0.013). These results support Hypotheses 1, 3 and 4 but not Hypothesis 2.
Table 8 summarizes the results of our test of the stated hypotheses.
5.3 Additional analysis
We run a binary logistic regression by transforming the dependent variable into a dichoto-mous variable, which adopts a value of 1 if greenwashing exists (discourse > action), and 0 if not (action ≥ discourse). Our results for Global-GW (not tabulated) indicate that a com-pany is 3.363 times more likely to greenwash if it is not in an ESI, 3.142 times more likely if it does not follow the GRI guidelines, and 0.441 less likely if it has no visibility or close proximity.
Results for Green-GW show that a company is 2.921 times more likely to greenwash if it is not in an ESI, 2.334 times more likely if it does not follow the GRI guidelines, and 2.005 times more likely if it does not assure the reports. Companies with no visibility or close proximity are 0.566 less likely to greenwash.
Table 7 Blue-Greenwashing
R Squared = .179 (Adjusted R Squared = .163)Linear regression results for the social measure of greenwashing.
Model Unstand. Coefficients Stand. Coefficients Sig.
B Std. Error B t
(Constant) − 16.975 13.250 − 1.281 .201Environmentally sensitive industries − .086 .016 − .267 − 5.259 .000Proximity-visibility industries .039 .016 .127 2.493 .013Sustainability report − .055 .021 − .147 − 2.562 .011GRI guidelines − .043 .017 − .145 − 2.510 .013Assurance statement − .020 .019 − .059 − 1.096 .274Year .009 .007 .064 1.304 .193Size − .012 .006 − .098 − 1.849 .065
Table 8 Hypotheses results
Results summary of our test of hypotheses.
Hypotheses Global-Greenwashing Green-Greenwashing Blue-Greenwashing
H1 Supported Supported SupportedH2 Not-supported Not-supported Not-supportedH3 Supported Not-supported SupportedH4 Supported Supported SupportedH5 Supported Supported Not-supported
4039Green, blue or black, but washing–What company characteristics…
1 3
Finally, for Blue-GW, companies in not ESI are 2.186 more likely to greenwash, and 2,926 more likely if they do not report in specific formats (stand-alone or integrated report). Companies with low visibility or close proximity are 0.566 less likely to green-wash than their counterparts with high visibility.
6 Discussion
We find a significant and negative association between greenwashing (social, environmen-tal and global) in companies belonging to environmentally sensitive industries, which sup-ports H1. This association is confirmed in the additional analysis applied to greenwashing as a binary variable. These results are consistent with companies looking for legitimacy, and in line with previous studies documenting higher quality of reports within this group of companies (Kim et al., 2017; Marquis et al., 2016; Walker and Wan, 2012).
Contrary to our expectations in H2 and to Schons and Steinmeier’s, (2016) results, we find a positive and significant association between greenwashing and companies belonging to a close-proximity or high-visibility industry, at the three levels. Thus, H2 is not sup-ported. Aragon-Correa et al., (2016) conclude that top international companies are more likely to report on environmental issues without improving environmental sustainability, searching legitimacy by an open disclosure of their activities. As for our result, this issue might indicate that proximity or visibility might not be strong enough to overcome the incentives for greenwashing. Firms in this group might leverage on their visibility or prox-imity to their stakeholders to make-up their image. These relationship characteristics would make it easier for companies to approach their stakeholders and manipulate their percep-tions. The strategy of selling themselves as sustainable pays, and, given that they are well known, they are trusted. In other words, their reputational risk is not as high as expected. If we assume that the risk depends on the stakeholders’ capability to compare CSR disclosure and performance, companies in a close-proximity or high-visibility industry might expect a low likelihood of being discovered and little punishment (Bansal and Clelland, 2004; Seele and Gatti, 2017). Results from the additional analysis applied to greenwashing as a binary variable confirm this association.
At the global level, H3 is supported: there is less greenwashing among firms issuing sustainability reports than among their counterparts presenting sustainability information within the annual reports. There is a cost involved in producing sustainability reports and it seems that only companies with real commitment to sustainability are willing to invest in it. On the other hand, companies actively greenwashing may be reporting with the mini-mum cost, just within the financial statements. At the green level, the statistics outcome shows no significance, and we cannot conclude on the effects of the variables on green-GW. Given that there are some mandatory disclosures regarding environmental issues, companies might be including them in their annual reports, which homogenize the dif-ferent instruments used for disclosure. At the blue level, results are similar to those of the global greenwashing, confirming the significant and negative association.
There is less greenwashing among companies following the GRI guidelines, which sup-ports H4. This result, also in line with previous research on the quality of reports (Rankin et al., 2011), highlights the importance of developing standards to guide meaningful sus-tainability disclosures. Complementing H4, our results partially support H5, stating that firms assuring their sustainability information greenwash less, at a global and green level. We find no evidence at the blue level, which might be due to the fact that social issues are
4040 S. Ruiz-Blanco et al.
1 3
less developed and their reporting is not so extensively required as the environmental ones. In fact, the origin of the greenwashing concept is green.
7 Conclusions
The objective of this paper is to better understand the greenwashing phenomenon and ana-lyze what are the characteristics that make firms less or more prone to it. To this aim, we define greenwashing as the difference between what companies say they do, “discourse” component, and what they do, “action” component. We approach greenwashing at three levels, global, environmental and social, by defining three variables: Global-GW, Green-GW and Blue-GW. Blackwashing, the proposed term for economic greenwashing issues, has not been analyzed because of the lack of performance indicators in the Bloomberg database.
Greenwashing is a multi-faced concept that should be analyzed under a multi-theoretical approach. Institutional theory, at the macro-level, establishes similar behaviors within an industry. Hence, companies face greenwashing with different attitudes, deferring or sup-porting it, depending on the industry. The classification we do in this paper, identifying environmental sensitive and close-proximity/high-visibility industries, confirms an oppo-site attitude that these two industry groups have, regarding greenwashing. It seems that belonging to a certain industry signals a certain greenwashing behavior. Consequently, there is a macro-level effect that could signal opposite approaches towards greenwashing. We conclude that the macro-level is not enough to accurately explain the role that institu-tional theory plays to understand greenwashing.
The industry grouping we propose is based on a stakeholder typology. Previous litera-ture links the meso-level and the stakeholder theory, assessing the effect of the stakeholder ecosystem on firms’ strategies, for instance, behavior and communication on sustainabil-ity. Companies identify their key stakeholders and, based on them, they build their legiti-macy, considering what the society, in general, and their main stakeholders, specifically, expect from them. Hence, at the meso-level, the pressure exerted by stakeholders and their capability to assess the companies’ behaviors should be included for the reputational risk assessment. It is a key element to understand greenwashing. Green greenwashing is the factor most extensively analyzed, probably because in recent years different groups have become aware of the effect of human actions on nature. The general public has currently a high level of sensitivity on environmental topics, and environmental issues provoke great pressure on firms. In fact, green greenwashing has direct consequences on the firm’s repu-tation and image. Furthermore, most countries in the world have at least minimum rules to report on these environmental issues. At a meso-level, environmental stakeholder pres-sure is an accurate deterrent of greenwashing. Also, greenwashing by high-visible or close-proximity companies compensates the effect on their reputational risk of being discovered. A possible explanation is that the likelihood of being discovered is low, or that the cost of greenwashing is lower than the cost of accurately reporting. Another possible explanation is that their visibility or proximity might facilitate the manipulation of the stakeholders’ perceptions, making it easier for companies greenwashing to create a reputable image and a clean impression. Further research is needed to improve the effect of stakeholder pressure on companies’ behavior and to increase stakeholder capability to assess “the greenwashing phenomenon”. The role played by regulation to bridge this gap, as observed for environ-mental issues, should also be approached.
4041Green, blue or black, but washing–What company characteristics…
1 3
The micro-level analysis, linked to agency theory and also affecting entrepreneurial decisions made by individuals, presents a theoretical support to understand greenwashing. To the best of our knowledge, there is no previous research on the association between greenwashing and sustainability information disclosed. Based on our results, less informa-tion asymmetries are associated to less greenwashing. Hence, reporting mechanisms that reduce information asymmetries also reduce greenwashing. Sustainability reports, GRI guidelines, and external assurance, help the top management team to manage stakeholder expectations and fulfill claims for higher transparency. In accordance to the signaling and voluntary disclosure theories, voluntary reports are the signal managers (better-informed party) use to communicate with stakeholders (less-informed party). Reporting mechanisms are also legitimation mechanisms, creating a communication channel between firms and stakeholders. Future research should consider other reporting mechanisms to confirm this relationship.
Additional research might be interesting in order to overcome the limitations of our study, such as the fact that our sample has only data from the USA and the results may not be generalized to other countries. We are aware that greenwashing is an abstract con-struct that cannot be directly measured or observed. Hence, we use proxies based on previ-ous literature. This means that different results might be obtained using other estimators. However, our contribution to the greenwashing research is threefold. First, we propose a new quantitative measure to assess greenwashing practices. For that purpose, we convert the concept behind the most extensively applied definition of greenwashing to a formula. Second, we present a theoretical framework to hypothesize and better understand the effect of counterpart strengths acting at the institutional environment (macro and meso-level) on greenwashing. On one hand, the need of legitimation might boost greenwashing, and, on the other hand, the stakeholder pressure might restrain it. The balance of these strengths in each industry will determine the level of greenwashing. Finally, although reporting mecha-nisms have been extensively criticized (Boiral, 2013; Cho, Laine, Roberts and Rodrigue, 2015; 2018; Michelon et al., 2015), our results show that they are capable of reducing the gap between what a company communicates and what they do. Giving more monitoring mechanisms to the stakeholders will facilitate a more effective assessment of greenwashing practices. Besides, these mechanisms might have deterrent effects.
Practical implications of our research can be highlighted. For policy-makers, we rein-force Wang et al., (2018) demand of regulation to improve the narratives of CSR reporting. Given that some European states have already regulated on green and to some extent blue reporting issues, further literature might consider both the industry effect and the relevance of reporting mechanisms that improve the quality of sustainability reporting. For academ-ics, we are signalling future research avenues under a multi-theoretical framework.
Funding This work was supported by ECOBAS (Economic and Business Administration for Society), Grant ED431E 2018/02 (Consellería de Educación, Universidade e Formación Profesional, Xunta de Galicia).
Open Access This article is licensed under a Creative Commons Attribution 4.0 International License, which permits use, sharing, adaptation, distribution and reproduction in any medium or format, as long as you give appropriate credit to the original author(s) and the source, provide a link to the Creative Com-mons licence, and indicate if changes were made. The images or other third party material in this article are included in the article’s Creative Commons licence, unless indicated otherwise in a credit line to the material. If material is not included in the article’s Creative Commons licence and your intended use is not permitted by statutory regulation or exceeds the permitted use, you will need to obtain permission directly from the copyright holder. To view a copy of this licence, visit http:// creat iveco mmons. org/ licen ses/ by/4. 0/.
4042 S. Ruiz-Blanco et al.
1 3
References
Adams, C. A. (2004). The ethical, social and environmental reporting-performance portrayal gap. Account-ing. Auditing and Accountability Journal, 17(5), 731–757.
Aragón-Correa, J. A., Marcus, A., & Hurtado-Torres, N. (2016). The natural environmental strategies of international firms: Old controversies and new evidence on performance and disclosure. Academy of Management Perspectives, 30(1), 24–39.
Bansal, P., & Clelland, I. (2004). Talking trash: legitimacy, impression management, and unsystematic risk in the context of the natural environment. Academy of Management Journal, 47(1), 93–103.
Barnea, A., & Rubin, A. (2010). Corporate social responsibility as a conflict between shareholders. Journal of Business Ethics, 97(1), 71–86.
Bebbington, J., Larrinaga, C., & Moneva, J. M. (2008). Corporate social reporting and reputation risk man-agement. Accounting, Auditing and Accountability Journal, 21(3), 337–361.
Bengtsson, M. (2016). How to plan and perform a qualitative study using content analysis. NursingPlus Open, 2, 8–14.
Beretta, S., & Bozzolan, S. (2004). A framework for the analysis of firm risk communication. The Interna-tional Journal of Accounting, 39(3), 265–288.
Bies, R. J., Bartunek, J. M., Fort, T. L., & Zald, M. N. (2007). Corporations as social change agents: Indi-vidual, interpersonal, institutional, and environmental dynamics. Academy of Management Review, 32, 788–793.
Bloomberg (2018) Help page. Environmental, Social & Governance Analysis. Bloomberg terminal. [Accessed 8th November 2018]
Boiral, O. (2013). Sustainability reports as simulacra? A counter-account of A and A+ GRI reports. Accounting, Auditing and Accountability Journal, 26(7), 1036–1071.
Bowen, F., & Aragon-Correa, J. A. (2014). Greenwashing in corporate environmentalism research and prac-tice: The importance of what we say and do. Organization & Environment, 27, 107–112.
Brammer, S., & Millington, A. (2005). Corporate reputation and philanthropy: An empirical analysis. Jour-nal of Business Ethics, 61(1), 29–44.
Branco, M. C., & Rodrigues, L. L. (2008). Factors influencing social responsibility disclosure by Portu-guese companies. Journal of Business Ethics, 83(4), 685–701.
Brennan, N. M., Guillamon-Saorin, E., & Pierce, A. (2009). Methodological Insights: Impression manage-ment: developing and illustrating a scheme of analysis for narrative disclosures–a methodological note. Accounting, Auditing and Accountability Journal, 22(5), 789–832.
Busch, T., & Hoffmann, V. H. (2009). Ecology-driven real options: An investment framework for incor-porating uncertainties in the context of the natural environment. Journal of Business Ethics, 90(2), 295–310.
Chen, Y., & Chang, C. (2013). Greenwash and green trust: the mediation effects of green consumer confu-sion and green perceived risk. Journal of Business Ethics, 114, 489–500.
Chen, J. C., & Roberts, R. W. (2010). Toward a more coherent understanding of the organization society relationship: A theoretical consideration for social and environmental accounting research. Journal of Business Ethics, 97(4), 651–665.
Cho, C. H. (2009). Legitimation strategies used in response to environmental disaster: A French case study of Total SA’s Erika and AZF incidents. European Accounting Review, 18(1), 33–62.
Cho, C. H., & Patten, D. M. (2007). The role of environmental disclosures as tools of legitimacy: A research note. Accounting, Organizations and Society, 32(7–8), 639–647.
Cho, C. H., Freedman, M., & Patten, D. M. (2012). Corporate disclosure of environmental capital expendi-tures: A test of alternative theories. Accounting, Auditing and Accountability Journal, 25(3), 486–507.
Cho, C. H., Laine, M., Roberts, R. W., & Rodrigue, M. (2015). Organized hypocrisy, organizational façades, and sustainability reporting. Accounting, Organizations and Society, 40, 78–94.
Cho, C. H., Laine, M., Roberts, R. W., & Rodrigue, M. (2018). The frontstage and backstage of corporate sustainability reporting: Evidence from the Arctic National Wildlife Refuge Bill. Journal of Business Ethics, 152(3), 865–886.
European Commission (2001) Green paper: promoting a European framework for Corporate Social Respon-sibility. Available at: europa.eu/rapid/press-release_DOC-01-9_en.pdf (accessed 8/11/2018)
Connelly, B. L., Certo, S. T., Ireland, R. D., & Reutzel, C. R. (2011). Signaling theory: A review and assess-ment. Journal of Management, 37(1), 39–67.
Contreras-Pacheco, O. E., & Claasen, C. (2017). Fuzzy reporting as a way for a company to greenwash: perspectives from the Colombian reality. Problems and Perspectives in Management, 15(2), 526–536.
4043Green, blue or black, but washing–What company characteristics…
1 3
Crilly, D., Hansen, M., & Zollo, M. (2016). The grammar of decoupling: A cognitive-linguistic perspec-tive on firms’ sustainability claims and stakeholders’ interpretation. Academy of Management Journal, 59(2), 705–729.
Deegan, C. (2002). Introduction: the legitimizing effect of social and environmental disclosures – a theoreti-cal foundation. Accounting, Auditing and Accountability Journal, 15(3), 282–311.
Delmas, M. A., & Burbano, V. C. (2011). The drivers of greenwashing. California Management Review, 54(1), 64–87.
Delmas, M. A., & Montes-Sancho, M. J. (2010). Voluntary agreements to improve environmental quality: Symbolic and substantive cooperation. Strategic Management Journal, 31(6), 575–601.
DiMaggio, P., & Powell, W. W. (1983). The iron cage revisited: Collective rationality and institutional iso-morphism in organizational fields. American Sociological Review, 48(2), 147–160.
Donia, M. B. L., & Tetrault Sirsly, C. A. (2016). Determinants and consequences of employee attributions of corporate social responsibility as substantive or symbolic. European Management Journal, 34(3), 232–242.
Donia, M. B. L., Ronen, S., Tetrault Sirsly, C., & Bonaccio, S. (2019). CSR by any other name? The dif-ferential impact of substantive and symbolic CSR attributions on employee outcomes. Journal of Busi-ness Ethics, 157(2), 503–523.
Faleye, O., & Trahan, E. (2011). Labor-Friendly Corporate Practices: Is What is Good for Employees Good for Shareholders? Journal of Business Ethics, 101(1), 1–27.
Fernandez-Feijoo, B., Romero, S., & Ruiz, S. (2014). Effect of stakeholders’ pressure on transparency of sustainability reports within the GRI framework. Journal of Business Ethics, 122(1), 53–63.
Font, X., Walmsley, A., Cogotti, S., McCombes, L., & Häusler, N. (2012). Corporate social responsibility: The disclosure–performance gap. Tourism Management, 33(6), 1544–1553.
Frynas, J. G., & Stephens, S. (2015). Political corporate social responsibility: Reviewing theories and set-ting new agendas. International Journal of Management Reviews, 17(4), 483–509.
García, F., González-Bueno, J., Oliver, J., & Riley, N. (2019). Selecting Socially Responsible Portfolios: A Fuzzy Multicriteria Approach. Sustainability, 11(9), 2496.
Gray, R., & Bebbington, J. (2000). Environmental accounting, managerialism and sustainability: Is the planet safe in the hands of business and accounting? Advances in Environmental Accounting and Man-agement, 1, 1–44.
Hąbek, P., & Wolniak, R. (2016). Assessing the quality of corporate social responsibility reports: the case of reporting practices in selected European Union member states. Quality & Quantity, 50(1), 399–420.
Hahn, R., & Lülfs, R. (2014). Legitimizing negative aspects in GRI-oriented sustainability reporting: A qualitative analysis of corporate disclosure strategies. Journal of Business Ethics, 123(3), 401–420.
Hitt, M. A., Beamish, P. W., Jackson, S. E., & Mathieu, J. E. (2007). Building theoretical and empirical bridges across levels: multilevel research in management. Academy of Management Journal, 50, 1385–1399.
Holder-Webb, L., Cohen, J. R., Nath, L., & Wood, D. (2009). The supply of corporate social responsibility disclosures among US firms. Journal of Business Ethics, 84(4), 497–527.
Huber BM, Comstock M (2017) ESG Reports and Ratings: What They Are, Why They Matter. https:// corpg ov. law. harva rd. edu/ 2017/ 07/ 27/ esg- repor ts- and- ratin gs- what- they- are- why- they- matter/ [Accessed 12th February 2020]
Ingram, R. W., & Frazier, K. B. (1980). Environmental Performance and Corporate Disclosure. Journal of Accounting Research, 18(2), 614–622.
Khalil, S., & O’sullivan P, . (2017). Corporate social responsibility: Internet social and environmental reporting by banks. Meditari Accountancy Research, 25(3), 414–446.
Kim, E. H., & Lyon, T. P. (2015). Greenwash vs Brownwash: Exaggeration and Undue Modesty in Corpo-rate Sustainability Disclosure. Organization Science, 26(3), 705–723.
Kim, J., Fairclough, S., & Dibrell, C. (2017). Attention, action, and greenwash in family-influenced firms? Evidence from polluting industries. Organization & Environment, 30(4), 304–323.
Kolk, A., & Perego, P. (2010). Determinants of the adoption of sustainability assurance statements: An international investigation. Business Strategy and the Environment, 19(3), 182–198.
Kuruppu, S., & Milne, M. J. (2009). Assuring stakeholder confidence. Chartered Accountants Journal, 88(9), 45–47.
Lin, J., Lobo, A., & Leckie, C. (2017). Green brand benefits and their influence on brand loyalty. Marketing Intelligence and Planning, 35(3), 425–440.
Lindblom, C. K. (2010). The implications of organizational legitimacy for corporate social performance and disclosure. In R. Gray, J. Bebbington, & S. Gray (Eds.), Social and environmental accounting: Devel-oping the field (pp. 51–63). Los Angeles: Sage.
4044 S. Ruiz-Blanco et al.
1 3
Lokuwaduge, C. S. D. S., & Heenetigala, K. (2017). Integrating environmental, social and governance (ESG) disclosure for a sustainable development: an Australian study. Business Strategy and the Envi-ronment, 26(4), 438–450.
Lougee, B., & Wallace, J. (2008). The corporate social responsibility (CSR) trend. Journal of Applied Cor-porate Finance, 20(1), 96–108.
Lyon, T. P., & Maxwell, J. W. (2011). Greenwash: Corporate environmental disclosure under threat of audit’. Journal of Economics and Management Strategy, 20(1), 3–41.
Lyon, T. P., & Montgomery, A. W. (2015). The means and end of greenwash. Organization & Environment, 28(2), 223–249.
Mahoney, L. S., Thorne, L., Cecil, L., & LaGore, W. (2013). A research note on standalone corpo-rate social responsibility reports: signaling or greenwashing? Critical Perspectives in Accounting, 24(4–5), 350–359.
Marquis, C., & Qian, C. (2014). Corporate social responsibility reporting in China: Symbol or sub-stance? Organization Science, 25(1), 127–148.
Marquis, C., Toffel, M. W., & Zhou, Y. (2016). Scrutiny, norms, and selective disclosure: A global study of greenwashing. Organization Science, 27(2), 483–504.
Merkl-Davies, D. M., & Brennan, N. M. (2011). A conceptual framework of impression management: new insights from psychology, sociology and critical perspectives. Accounting and Business Research, 41(5), 415–437.
Michelon, G., Pilonato, S., & Ricceri, F. (2015). CSR reporting practices and the quality of disclosure: An empirical analysis. Critical Perspectives on Accounting, 33, 59–78.
Moneva, J. M., Archel, P., & Correa, C. (2006). GRI and the camouflaging of corporate unsustainability. Accounting Forum, 30(2), 121–137.
Nollet, J., Filis, G., & Mitrokostas, E. (2016). Corporate social responsibility and financial performance: A non-linear and disaggregated approach. Economic Modelling, 52, 400–407.
Novethic (2013) Overview of ESG rating agencies. https:// www. novet hic. com/ filea dmin/ user_upload/tx_ausynovethicetudes/pdf_complets/2013_overview_ESG_rating_agencies.pdf. [Accessed 12th February 2020]
Nyilasy, G., Gangadharbatla, H., & Paladino, A. (2012). Greenwashing: A consumer perspective. Eco-nomics and Sociology, 5(2), 116–123.
Palazzo, G., & Scherer, A. G. (2006). Corporate legitimacy as deliberation: A communicative frame-work. Journal of Business Ethics, 66, 71–88.
Rankin, M., Windsor, C., & Wahyuni, D. (2011). An investigation of voluntary corporate greenhouse gas emissions reporting in a market governance system: Australian evidence. Accounting, Auditing and Accountability Journal, 24(8), 1037–1070.
Roberts, N., & Thatcher, J. B. (2009). Conceptualizing and testing formative constructs: Tutorial and annotated example. ACM SIGMIS Database, 40(3), 9–39.
Romero, S., Ruiz, S., & Fernandez-Feijoo, B. (2019). Sustainability reporting and stakeholder engage-ment in Spain: Different instruments, different quality. Business Strategy and the Environment, 28(1), 221–232.
Roulet, T. J., & Touboul, S. (2015). The intentions with which the road is paved: Attitudes to liberalism as determinants of greenwashing. Journal of Business Ethics, 128(2), 305–320.
Schons, L., & Steinmeier, M. (2016). Walk the talk? How symbolic and substantive CSR actions affect firm performance depending on stakeholder proximity. Corporate Social Responsibility and Envi-ronmental Management, 23(6), 358–372.
SEC (2010) Securities and Exchange Commission 17 CFR Parts 210, 211, 229, and 249 [Release Nos. 33-8995; 34-59192; FR-78; File No. S7-15-08] RIN 3235-AK00. Modernization of Oil and Gas Reporting.
Seele, P., & Gatti, L. (2017). Greenwashing revisited: In search of a typology and accusation-based defi-nition incorporating legitimacy strategies. Business Strategy and the Environment, 26(2), 239–252.
Shabana, K. M., & Ravlin, E. C. (2016). Corporate social responsibility reporting as substantive and symbolic behavior: A multilevel theoretical analysis. Business and Society Review, 121(2), 297–327.
Simnett, R., Vanstraelen, A., & Chua, W. F. (2009). Assurance on sustainability reports: An interna-tional comparison. Accounting Review, 84(3), 937–967.
Soobaroyen, T., & Mahadeo, J. D. (2016). Community disclosures in a developing country: Insights from a neo-pluralist perspective. Accounting, Auditing and Accountability Journal, 29(3), 452–482.
Spence, M. (1973). Job market signaling. Quarterly Journal of Economics, 87, 355–374.Steiner, G., Geissler, B., Schreder, G., & Zenk, L. (2018). Living sustainability, or merely pretending?
From explicit self-report measures to implicit cognition. Sustainability Science, 13(4), 1001–1015.
4045Green, blue or black, but washing–What company characteristics…
1 3
Stiglitz, J. E. (2000). The contributions of the economics of information to twentieth century economics. Quarterly Journal of Economics, 115, 1441–1478.
Strand, R., Freeman, R. E., & Hockerts, K. (2015). Corporate social responsibility and sustainability in Scandinavia: An overview. Journal of Business Ethics, 127(1), 1–15.
Taylor, J., Vithayathil, J., & Yim, D. (2018). Are corporate social responsibility (CSR) initiatives such as sustainable development and environmental policies value enhancing or window dressing? Corpo-rate Social Responsibility and Environmental Management, 25(5), 971–980.
Unerman, J. (2000). Reflections on quantification in corporate social reporting content analysis. Accounting Auditing and Accountability Journal, 13(5), 667–680.
Walker, K., & Wan, F. (2012). The Harm of symbolic actions and green-washing: Corporate actions and communications on environmental performance and their financial implications. Journal of Business Ethics, 109(2), 227–242.
Wang, Z., Hsieh, T. S., & Sarkis, J. (2018). CSR performance and the readability of CSR reports: Too good to be true? Corporate Social Responsibility and Environmental Management, 25(1), 66–79.
Wiseman, J. (1982). An evaluation of environmental disclosures made in corporate annual reports. Account-ing, Organizations and Society, 7(1), 53–63.
World Bank (2017) Corporate Governance. The Foundation For Corporate Citizenship and Sustain-able businesses, available at: http:// docum ents. world bank. org/ curat ed/ en/ 41971 14836 92776 758/ pdf/ 111747- WP- IFC- UNGC- broch ure. pdf [Accessed 8th November 2018]
Publisher’s Note Springer Nature remains neutral with regard to jurisdictional claims in published maps and institutional affiliations.