Greek prison policy between the hammer and the...
19
2 nd Annual Conference of the Max Planck Partner Group for Greek prison policy between the hammer and the anvil 17-19 th September 2015, University of Sarajevo’s Faculty of Criminalistics, Criminology and Security Studies Effi Lambropoulou Panteion University of Social & Political Sciences, Dpt. Sociology, Athens/Greece
Transcript of Greek prison policy between the hammer and the...

2nd Annual Conference of the Max Planck Partner Group for
Greek prison policy between the hammer and the anvil
17-19th September 2015, University of Sarajevo’s Faculty of Criminalistics,
Criminology and Security Studies
Effi LambropoulouPanteion University of Social & Political Sciences,
Dpt. Sociology, Athens/Greece

Outline of the situation 1
• One of the lowest crime and prisoner rates in Europe
• Methods: a)Short sentences b) suspension, conversion, and conditional release: “cryptoamnesty”• What are the methods today? • The limits
for suspension, conversion and parole decrease from time to time, and more lenient regulations for early release because of work
• The upper level of pre-trial detention was reduced from 18 to 12 months for felonies
2

Outline 2
• And some other alternatives:
- Efforts for expanding the implementation of community service, restoration and mediation programmes and electronic monitoring/home detention
• Emergency measures for early release
• Need for improvements and reforms stop with the issuing of laws or
• reforms very slow 3

4
“Stock” prison population in time series (1980‒2015)
Source: ICPS/WPB 2014; ELSTAT Prison Statistics, Table E27, G01A, G12 online; Ministry of Justice, March 2014, May 2015, unpublished.
YEARSTOCK
Total Prison
population
incl. Pretrial
detainees
ELSTAT
STOCK
Convicted
Prisoners
at the end
of the year
ELSTAT
STOCK
Pretrial
detainees at
the end of
the year
ELSTAT
Per
100,000
resident
population
Convicted
& Pretrial
detainees -
ELSTAT
& WPB
Per 100,000
resident
population
Pretrial
detainees
ELSTAT &
WPB
Pretrial in %
related to
total stock
1980 3135 2472 663 33 7 21,1
1985 3383 2372 1011 35 10 29,9
1990 5133 3537 1596 52 16 31,1
1995 5811 3825 1986 55 19 34,2
2000 6003 3786 2217 70 20 36,9
2005 9871 6795 2481 90 22 25,1
2010 11364 7823 3541 102 31 31,2
2013 13147 10043 3104 120 28 23,6
2014* 12728 10002 2726 117 25 21,4
2015* 10726 99

Prisoners convicted and on remand, stock (1980‒2014)
5
Source: ELSTAT, Prison Statistics 1980-1996, Table G1; since 1998, Table G1a available online; Ministry of Justice 2014, unpublished.

Prisons 1
• 33 public correctional facilities
• nominal prison capacity 9,886 prisoners
• occupancy level rises to 134% (as of 01.09.2013), corresponding to the median prison population rate in Europe, but of the highest in Greek prison history.
6
Prisons 2
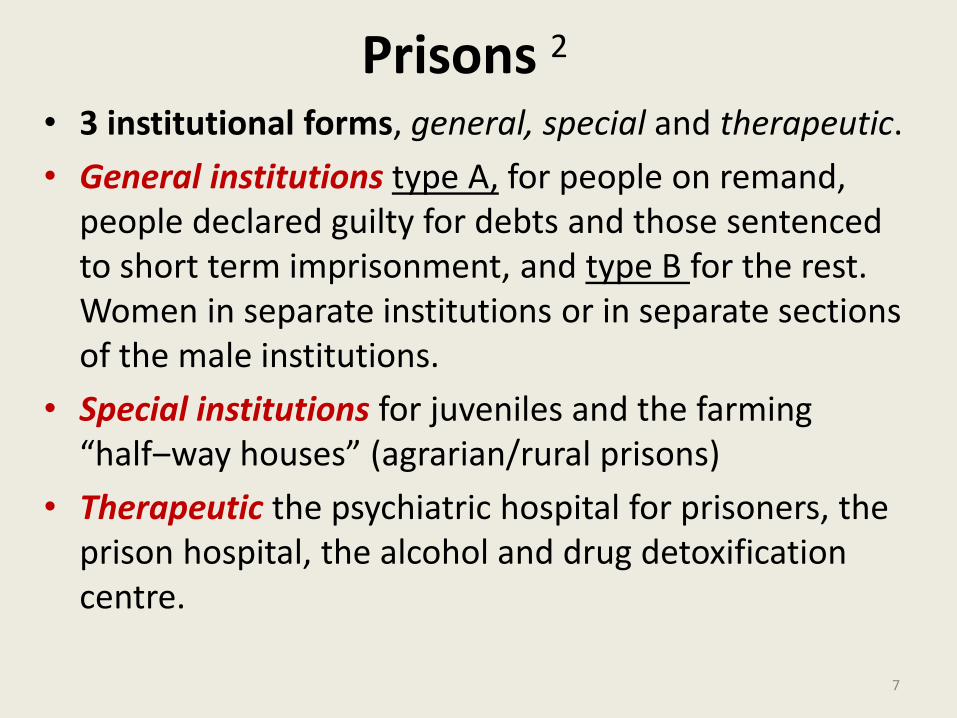
• 3 institutional forms, general, special and therapeutic.
• General institutions type A, for people on remand, people declared guilty for debts and those sentenced to short term imprisonment, and type B for the rest. Women in separate institutions or in separate sections of the male institutions.
• Special institutions for juveniles and the farming “half‒way houses” (agrarian/rural prisons)
• Therapeutic the psychiatric hospital for prisoners, the prison hospital, the alcohol and drug detoxification centre.
7

Convicted prisoners (stock) in % according to their serving sentence in time series (1980-2014)
Year
1-12months 1-5 years 5-20 years Life
1980 16,5 48,1 28,9 6,5
1990 10,3 47,2 36,8 5,7
1996 7,7 24,3 51,8 16,2
2003 11,0 17,6 62,0 9,5
2006 14,5 19,4 57,1 9,0
2011 16,8 11,5 62,0 9,7
2014 2,3 7,4 80,0 10,3
Prisoners in % according to serving sentence
(stock)
8
Source: ELSTAT, Prison Statistics 1980, 1990, 1996 Table: G1; Ministry of Justice 2003-2012; 2014, unpublished.

Prisoners convicted & on remand according to crime
9Source: ELSTAT, Criminal Justice Statistics 1980–1995, Table B4; 2000-2009, Table B4 available online.
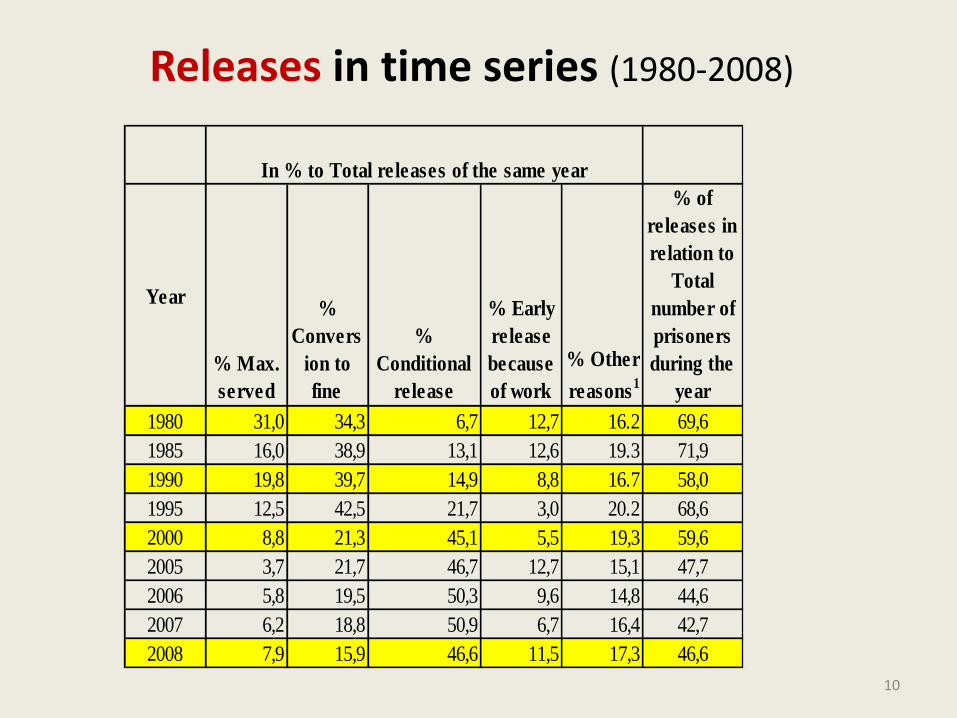
Releases in time series (1980-2008)
Year
% Max.
served
%
Convers
ion to
fine
%
Conditional
release
% Early
release
because
of work
% Other
reasons1
% of
releases in
relation to
Total
number of
prisoners
during the
year
1980 31,0 34,3 6,7 12,7 16.2 69,6
1985 16,0 38,9 13,1 12,6 19.3 71,9
1990 19,8 39,7 14,9 8,8 16.7 58,0
1995 12,5 42,5 21,7 3,0 20.2 68,6
2000 8,8 21,3 45,1 5,5 19,3 59,6
2005 3,7 21,7 46,7 12,7 15,1 47,7
2006 5,8 19,5 50,3 9,6 14,8 44,6
2007 6,2 18,8 50,9 6,7 16,4 42,7
2008 7,9 15,9 46,6 11,5 17,3 46,6
In % to Total releases of the same year
10

Releases (1980-2008)
Source: ELSTAT, Prison Statistics 19801996, Table II; 1998‒2008, Table E24 available online.
11
Challenges 1
Health care
- Medical personnel
Contemporary situation:
financial cuts, tremendous staff shortages
- Health situation of prisoners
National Health System
12

Challenges 2
Prison violence • CPT: “inter-prisoner violence appeared to be
on the rise”
• the lack of staff in prisons impede the efforts to maintain effective control, as stronger groups of prisoners exercise their powers unchecked over other inmates
13

Challenges 3
Prison guards
• 1990: 3 prisoners for every prison guard
• 1996: 3.1 to 1
• 2000: 4.7 to 1
• 2008: 4.8 to 1
• March 2014: 6.3 to 1 (1,955)
• May-June 2015: 4.9 to 1 (2,170)
10,726 prisoners; 1,822 perimeter security guards
14
Challenges 4
Prison violence • In 2009 prison establishments of type C were
introduced
• for high risk offenders:
prisoners serving life sentences or long sentences over 10 years and are considered to be especially dangerous for the smooth life in prison.
• In July 2009, the first C-unit started operating in a closed prison and in August 2014, a whole facility.
• In April 2015 the new government abolished the relevant laws and this type of prisons.
15

Conclusions 1
• Greek governments have tried to control the changing prison situation (overcrowding, etc.), with successivechanges in legislation that
• have proven ineffective in the long run
• leading to strong criticism by judges and prosecutors
16
Conclusions 2
• They continue to insist on them
• They avoid the support of modern prison management and technological innovations
• Role of experts and criminologists isolated and limited, with few exceptions:
- “moral panic”, “discrimination” “social exclusion” rhetoric
- with the media playing a significant role
17

Open Issues• Humane treatment: Good practice
The overall efforts of the whole prison staff to overcome shortages and face adequately the rapidly changing situation with good will and understanding.
• The strengths can be turned to weaknesses
“Cui plus licet quam par est, plus vult quam licet” (PubliliusSyrus)
A person allowed more than is right, wants more than is allowed.
• Loose and humanitarian prison management must be associated with training, professionalism, accountability and ensuring self-esteem of personnelin order to support prisoners. 18

Hvala vam
Thank you
19