
Greed & Fear (the Asset Credit Divergence) 20140710
13
Christopher Wood [email protected] +852 2600 8516 Thursday, 10 July 2014 Page 1 The asset-credit divergence Rotterdam The title of the new Asia Maxima quarterly is “Delirium”. It describes the false euphoria in financial markets characterised by an extreme lack of volatility. This is most evident in the foreign exchange market where volatility has sunk to record lows. JPMorgan’s Global FX Volatility Index has fallen from a recent high of 11.77 in mid-2013 to a record low of 5.29 on 3 July and is now 5.45 (see Figure 1). But the same trend of declining volatility is also clear in the world of stocks and bonds. The CBOE S&P500 Volatility Index (VIX) is down from a peak of 80.86 in November 2008 to 10.32 on 3 July, the lowest level since February 2007. While the Merrill Lynch Option Volatility Estimate (MOVE), which measures the volatility in the US Treasury bond market, has also declined from 117.9 in July 2013 to 52.74 at the end of June. Figure 1 JPMorgan Global FX Volatility Index Source: CLSA, Bloomberg Figure 2 Global syndicated lending Note: Leveraged share = Share of leveraged loans in total syndicated loan signings. Source: Dealogic, BIS 84 th Annual Report One way of interpreting this is that central banks in the developed world have succeeded in persuading investors that interest rates will stay very low for a very long time. It is also this confidence in the continuation of low interest rates which has resulted in the chief feature of current markets. That is a growing ‘reach for yield’ as investors buy ever more complex debt securities, often with leverage, to generate a greater return. This process, which has been aptly 3 6 9 12 15 18 21 24 27 1992 1993 1994 1995 1996 1997 1998 1999 2000 2001 2002 2003 2004 2005 2006 2007 2008 2009 2010 2011 2012 2013 2014 JPMorgan Global FX Volatility Index 0 5 10 15 20 25 30 35 40 45 50 0 100 200 300 400 500 600 700 800 900 2005 2006 2007 2008 2009 2010 2011 2012 2013 2014 (US$bn) (%) Leveraged Investment grade Leveraged share (RHS)
-
Upload
hans-widjaja -
Category
Documents
-
view
83 -
download
2
description
CLSA Report Asian Banking Crises
Transcript of Greed & Fear (the Asset Credit Divergence) 20140710

Christopher Wood [email protected] +852 2600 8516
Thursday, 10 July 2014 Page 1
The asset-credit divergence Rotterdam The title of the new Asia Maxima quarterly is “Delirium”. It describes the false euphoria in financial markets characterised by an extreme lack of volatility. This is most evident in the foreign exchange market where volatility has sunk to record lows. JPMorgan’s Global FX Volatility Index has fallen from a recent high of 11.77 in mid-2013 to a record low of 5.29 on 3 July and is now 5.45 (see Figure 1). But the same trend of declining volatility is also clear in the world of stocks and bonds. The CBOE S&P500 Volatility Index (VIX) is down from a peak of 80.86 in November 2008 to 10.32 on 3 July, the lowest level since February 2007. While the Merrill Lynch Option Volatility Estimate (MOVE), which measures the volatility in the US Treasury bond market, has also declined from 117.9 in July 2013 to 52.74 at the end of June.
Figure 1 JPMorgan Global FX Volatility Index
Source: CLSA, Bloomberg
Figure 2 Global syndicated lending
Note: Leveraged share = Share of leveraged loans in total syndicated loan signings. Source: Dealogic, BIS 84th Annual Report
One way of interpreting this is that central banks in the developed world have succeeded in persuading investors that interest rates will stay very low for a very long time. It is also this confidence in the continuation of low interest rates which has resulted in the chief feature of current markets. That is a growing ‘reach for yield’ as investors buy ever more complex debt securities, often with leverage, to generate a greater return. This process, which has been aptly
3
6
9
12
15
18
21
24
27
1992
1993
1994
1995
1996
1997
1998
1999
2000
2001
2002
2003
2004
2005
2006
2007
2008
2009
2010
2011
2012
2013
2014
JPMorgan Global FX Volatility Index
0
5
10
15
20
25
30
35
40
45
50
0
100
200
300
400
500
600
700
800
900
2005 2006 2007 2008 2009 2010 2011 2012 2013 2014
(US$bn) (%)Leveraged
Investment grade
Leveraged share (RHS)
Christopher Wood [email protected] +852 2600 8516
Thursday, 10 July 2014 Page 2
described as a ‘yield bubble’, is to GREED & fear a direct consequence of more than five years of zero interest rates and unconventional monetary policy. It can be chronicled by the continuing revival of risky lending practices, which were discredited in the 2008 financial crisis and which the BIS has again warned against in its latest just published annual report (BIS 84th Annual Report, 29 June 2014). The BIS annual report notes, for example, that in the syndicated loan market credit granted to lower-rated leveraged borrowers (leverage loans) exceeded 40% of new global signings for much of 2013, which was much higher than during the pre-crisis period from 2005 to mid-2007 (see Figure 2).
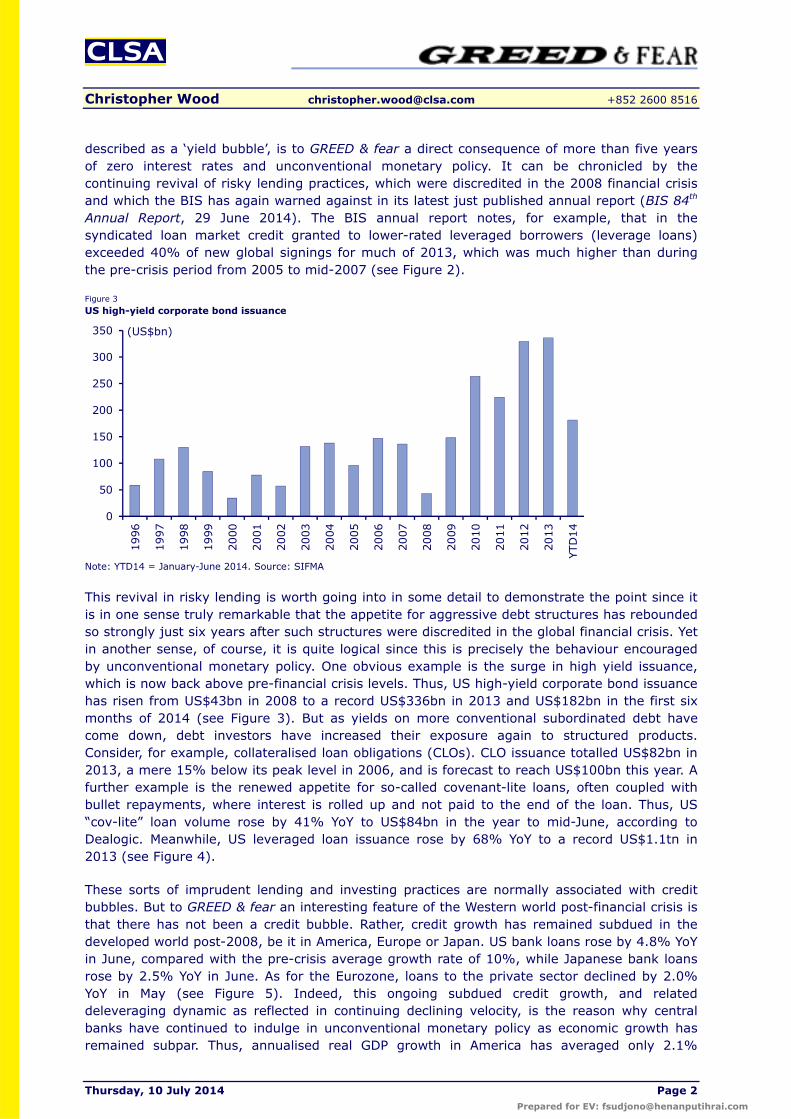
Figure 3 US high-yield corporate bond issuance
Note: YTD14 = January-June 2014. Source: SIFMA
This revival in risky lending is worth going into in some detail to demonstrate the point since it is in one sense truly remarkable that the appetite for aggressive debt structures has rebounded so strongly just six years after such structures were discredited in the global financial crisis. Yet in another sense, of course, it is quite logical since this is precisely the behaviour encouraged by unconventional monetary policy. One obvious example is the surge in high yield issuance, which is now back above pre-financial crisis levels. Thus, US high-yield corporate bond issuance has risen from US$43bn in 2008 to a record US$336bn in 2013 and US$182bn in the first six months of 2014 (see Figure 3). But as yields on more conventional subordinated debt have come down, debt investors have increased their exposure again to structured products. Consider, for example, collateralised loan obligations (CLOs). CLO issuance totalled US$82bn in 2013, a mere 15% below its peak level in 2006, and is forecast to reach US$100bn this year. A further example is the renewed appetite for so-called covenant-lite loans, often coupled with bullet repayments, where interest is rolled up and not paid to the end of the loan. Thus, US “cov-lite” loan volume rose by 41% YoY to US$84bn in the year to mid-June, according to Dealogic. Meanwhile, US leveraged loan issuance rose by 68% YoY to a record US$1.1tn in 2013 (see Figure 4).
These sorts of imprudent lending and investing practices are normally associated with credit bubbles. But to GREED & fear an interesting feature of the Western world post-financial crisis is that there has not been a credit bubble. Rather, credit growth has remained subdued in the developed world post-2008, be it in America, Europe or Japan. US bank loans rose by 4.8% YoY in June, compared with the pre-crisis average growth rate of 10%, while Japanese bank loans rose by 2.5% YoY in June. As for the Eurozone, loans to the private sector declined by 2.0% YoY in May (see Figure 5). Indeed, this ongoing subdued credit growth, and related deleveraging dynamic as reflected in continuing declining velocity, is the reason why central banks have continued to indulge in unconventional monetary policy as economic growth has remained subpar. Thus, annualised real GDP growth in America has averaged only 2.1%
0
50
100
150
200
250
300
350
1996
1997
1998
1999
2000
2001
2002
2003
2004
2005
2006
2007
2008
2009
2010
2011
2012
2013
YTD
14
(US$bn)

Christopher Wood [email protected] +852 2600 8516
Thursday, 10 July 2014 Page 3
between 2Q09 and 1Q14, while in the Eurozone it has been only 0.7% during the same period (see Figure 6).
Figure 4 US leveraged loan issuance
Note: Data up to 9 July 2014. Source: Bloomberg
Figure 5 US, Japan and Eurozone bank loan growth
Source: Federal Reserve, Bank of Japan, ECB
Figure 6 US and Eurozone real GDP growth
Source: CLSA, Datastream
0
200
400
600
800
1,000
1,200
2002
2003
2004
2005
2006
2007
2008
2009
2010
2011
2012
2013
YTD
14
(US$bn)
(10)
(5)
0
5
10
15
Jan
98Sep
98
May
99
Jan
00Sep
00
May
01
Jan
02Sep
02
May
03
Jan
04Sep
04
May
05
Jan
06Sep
06
May
07
Jan
08Sep
08
May
09
Jan
10Sep
10
May
11
Jan
12Sep
12
May
13
Jan
14
(%YoY) US Eurozone Japan
(8)
(6)
(4)
(2)
0
2
4
6
2000
2001
2002
2003
2004
2005
2006
2007
2008
2009
2010
2011
2012
2013
2014
(% YoY) Eurozone real GDP growthUS real GDP growth

Christopher Wood [email protected] +852 2600 8516
Thursday, 10 July 2014 Page 4
The resulting paradox is to GREED & fear perhaps best highlighted by research done of late by the Institute of International Finance (see IIF reports: Capital Markets Monitor, April and May 2014 issues). This research has focused on the divergent trend since the crisis in the developed world between the credit-to-GDP ratio and what the IIF describes as the asset-to-GDP ratio, which is defined as household wealth or assets to nominal GDP. This shows that the asset-to-GDP ratio has shown a large positive deviation of nine percentage points from its long-term trend in the G7 world based on IIF data. By contrast the credit-to-GDP ratio has shown a contrasting trend. The G7 credit-to-GDP ratio, which includes all lending to the non-financial private sector, has collapsed since the crisis to eight percentage points below its long-term trend, down from a positive deviation of over 10 percentage points in mid-2009.
The Achilles’ heel in the system is, therefore, exposed by the divergent trend between asset prices and credit growth in the developed markets. The obvious conclusion from this is that there is a growing risk that asset prices are becoming increasingly disconnected from the realities of the underlying economy. A similar chart to the one shown in the IIF report highlighting the relevant divergent trends is shown below (see Figure 7). It should be noted that the data is based on the BIS’s long-term series on credit to the private sector and the central banks’ flow of funds data on household assets.
Figure 7 G7 credit-to-GDP gap and asset-to-GDP gap
Note: The gaps measure deviations of the credit and asset to GDP ratios from their long-term trends. Credit includes lending to the non-financial private sector. Assets are total household assets. Source: CLSA, BIS, Datastream, CEIC Data, IIF
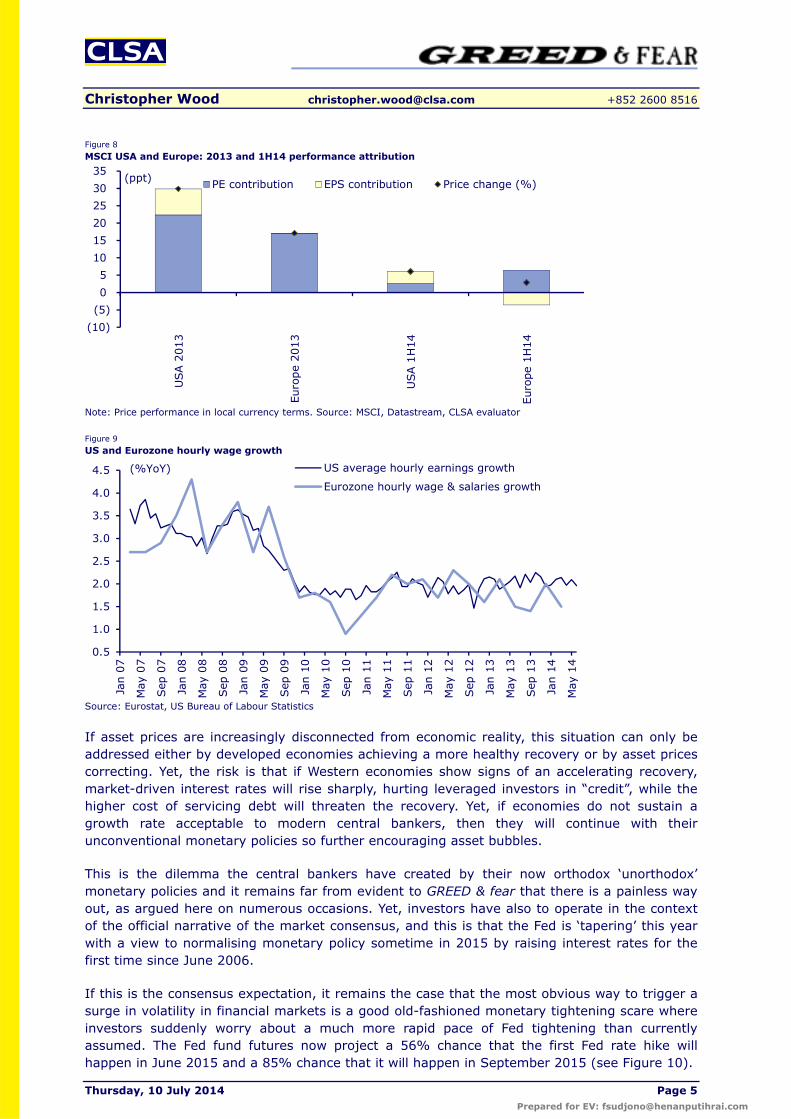
The above is interesting to GREED & fear because it provides a conceptual framework to help understand what is going on in a world of quantitative easing where it has become increasingly evident in recent years that the rich or ‘asset owners’ have continued to be the chief beneficiaries of such unorthodox monetary policies. Thus, in the world of equities, multiple expansion not earnings has been the chief driver of equity gains in America and Europe in recent years, whereas wages have remained subdued. On this point, price-earnings ratio expansion contributed to an estimated 75% of the gains in the US stock market last year and 43% so far in 2014, and accounted for all the gains in Europe in both 2013 and 1H14 (see Figure 8). By contrast, US average hourly earnings rose by only 2.0%YoY in June, while Eurozone hourly wages rose by just 1.5%YoY in 1Q14 (see Figure 9). Similarly, in the world of fixed-income capital gains and related yield compression have been driven by the leverage employed in carry trades, leverage only available in a post-financial crisis world to the affluent.
-10
-5
0
5
10
15
-50
-40
-30
-20
-10
0
10
20
30
40
50
2000 2002 2004 2006 2008 2010 2012 2014
(ppt) G7 household asset-to-GDP gapG7 credit-to-GDP gap (RHS)
(ppt)
Christopher Wood [email protected] +852 2600 8516
Thursday, 10 July 2014 Page 5
Figure 8 MSCI USA and Europe: 2013 and 1H14 performance attribution
Note: Price performance in local currency terms. Source: MSCI, Datastream, CLSA evaluator
Figure 9 US and Eurozone hourly wage growth
Source: Eurostat, US Bureau of Labour Statistics
If asset prices are increasingly disconnected from economic reality, this situation can only be addressed either by developed economies achieving a more healthy recovery or by asset prices correcting. Yet, the risk is that if Western economies show signs of an accelerating recovery, market-driven interest rates will rise sharply, hurting leveraged investors in “credit”, while the higher cost of servicing debt will threaten the recovery. Yet, if economies do not sustain a growth rate acceptable to modern central bankers, then they will continue with their unconventional monetary policies so further encouraging asset bubbles.
This is the dilemma the central bankers have created by their now orthodox ‘unorthodox’ monetary policies and it remains far from evident to GREED & fear that there is a painless way out, as argued here on numerous occasions. Yet, investors have also to operate in the context of the official narrative of the market consensus, and this is that the Fed is ‘tapering’ this year with a view to normalising monetary policy sometime in 2015 by raising interest rates for the first time since June 2006.
If this is the consensus expectation, it remains the case that the most obvious way to trigger a surge in volatility in financial markets is a good old-fashioned monetary tightening scare where investors suddenly worry about a much more rapid pace of Fed tightening than currently assumed. The Fed fund futures now project a 56% chance that the first Fed rate hike will happen in June 2015 and a 85% chance that it will happen in September 2015 (see Figure 10).
(10)(5)05
101520253035
USA
201
3
Euro
pe 2
013
USA
1H
14
Euro
pe 1
H14
PE contribution EPS contribution Price change (%)(ppt)
0.5
1.0
1.5
2.0
2.5
3.0
3.5
4.0
4.5
Jan
07
May
07
Sep
07
Jan
08
May
08
Sep
08
Jan
09
May
09
Sep
09
Jan
10
May
10
Sep
10
Jan
11
May
11
Sep
11
Jan
12
May
12
Sep
12
Jan
13
May
13
Sep
13
Jan
14
May
14
(%YoY) US average hourly earnings growth
Eurozone hourly wage & salaries growth

Christopher Wood [email protected] +852 2600 8516
Thursday, 10 July 2014 Page 6
Figure 10 Fed funds rate probability based on Fed funds futures
Source: CME Group FedWatch
On this point, as mentioned before here, there is a growing possibility that wage pressures in a structurally constrained US labour market could trigger just such a tightening scare. In this respect, it is also the case that history shows that there is a well-established tendency for financial markets to test a new Fed chairman in the first few months in office. Given the almost eerie sense of calm, if not complacency, hanging over markets as reflected in record low volatility measures, the suspicion is rising that such a test may be approaching.
Figure 11 Unemployed Americans who found jobs or leaving the labour force
Note: Data measures the labour force status flows from "unemployed" to "employed" or from "unemployed" to "not in labour force". Source: Bureau of Labour Statistics
And the point to note here is that such a tightening in the US labour market remains possible, if not probable, if America’s declining labour-force participation ratio is structural, not cyclical. This declining participation rate has attracted ever growing focus in recent years with more unemployed Americans leaving the workforce than found a job in 49 out of the past 50 months (see Figure 11). It has also remained the subject of a lively debate among economists about whether this phenomenon is cyclical or structural. Yellen, an academic economist specialising in the labour market, remains firmly of the view that it is cyclical. Yet, many others, including GREED & fear, are more persuaded by the argument that it is structural as America has entered the European dynamic, where rising government benefits reduce the incentive to work at the lower end of the labour market.
0
5
10
15
20
25
30
35
0.00 0.25 0.50 0.75 1.00 1.25 1.50 1.75 2.00
(%) 17-Jun-15 16-Sep-15 31-Oct-15
1.2
1.4
1.6
1.8
2.0
2.2
2.4
2.6
2.8
3.0
3.2
1990
1991
1992
1993
1994
1995
1996
1997
1998
1999
2000
2001
2002
2003
2004
2005
2006
2007
2008
2009
2010
2011
2012
2013
2014
(m) Unemployed leaving labour force
Unemployed found jobs

Christopher Wood [email protected] +852 2600 8516
Thursday, 10 July 2014 Page 7
If this sounds a dry academic subject, it has become critically important for markets. For if the declining participation rate is indeed structural, then there is less slack in the labour market than the Fed currently believes, which means, more than five years into an economic recovery in America, that sooner or later wages should get traction. Yet in the last US jobs data while the payroll data surged by 288,000 jobs average hourly earnings growth slowed from 2.1%YoY in May to 2.0%YoY in June (see Figure 12).
Figure 12 US increase in nonfarm payrolls and average hourly earnings growth
Source: CLSA, US Bureau of Labour Statistics
If this traction is not yet really visible from the all-important average hourly earnings growth data, such evidence should be forthcoming in the not too distant future if the structural argument is correct. If so, it could have significant market impact in the context of ultra-low volatility, where leverage has been piled on in the world of credit in the pursuit of yield. And the impact will be all the greater precisely because Mrs Yellen is so committed to the cyclical view. This is the most probable way there can be a monetary tightening scare in America. But to GREED & fear it is far from evident that it requires an acceleration in US economic growth which for now at least remains in the same annualised range of 2-2.5% it has been in since the recovery began in 2009.
Meanwhile, GREED & fear remains unconvinced that such a sign of rising wage pressures in the US would signal the sudden transition from a deflationary era to an inflationary one. For an interest-rate hike at the short end, or even the perception that monetary tightening is coming much sooner than previously expected, and any resulting related back up in long-term interest rates, is likely to prove deflationary in the sense that an economy like America’s with continuing high debt levels will prove ultra-sensitive to the impact of higher interest rates, as was demonstrated last year in terms of the US housing market’s stalling in the face of higher mortgage rates.
The consequence of all of the above is that any monetary tightening scare, or related ‘inflation scare’, is likely again to prove short lived. In this sense, evidence of rising wages pressures, if such a development occurs, will likely turn out to be ‘late cycle’ confirmation that the US economic recovery, which began in 2009, is nearing its end, not its beginning.
And in such a macroeconomic context a dove like Yellen will want to accelerate quantitative easing, not end it. That is unless there starts to be more vocal opposition from within the Fed, from Congress and from the executive arm of the federal government to what by now should be seen as the obvious negative consequences of what has been aptly described by CLSA’s Australian bank analyst Brian Johnson as ‘QE-ternity’ (see CLSA research Australian banks – G.O.A.T.: Are they really the greatest of all time?, 2 June 2014).
1.0
1.5
2.0
2.5
3.0
3.5
4.0
-1,000
-800
-600
-400
-200
0
200
400
600
Feb
07
Jun
07
Oct
07
Feb
08
Jun
08
Oct
08
Feb
09
Jun
09
Oct
09
Feb
10
Jun
10
Oct
10
Feb
11
Jun
11
Oct
11
Feb
12
Jun
12
Oct
12
Feb
13
Jun
13
Oct
13
Feb
14
Jun
14
('000) (%YoY)Increase in US nonfarm payrolls (LHS)Average hourly earnings growth for private employees

Christopher Wood [email protected] +852 2600 8516
Thursday, 10 July 2014 Page 8
Still, if this would be a development to applaud, it also remains unlikely. Much more likely is that in such a context the policy-making establishment, otherwise known as the Davos crowd, will look to expand quantitative easing with the result that the distinction between monetary policy and fiscal policy will become ever more blurred. For, with the Fed already owning 23% of outstanding Treasury bonds and buying over 70% of net Treasury debt issuance since the beginning of 2013 (see Figure 13), without seemingly nasty inflationary ramifications, QE advocates in a continuing low growth world will be tempted to argue again that central banks should buy all government debt and simply cancel it. And indeed such argument is a logical conclusion for those who, unlike GREED & fear, believe in QE.
Figure 13 Fed buying of US Treasuries and increase in Treasury debt outstanding
Note: Fed buying data up to 2 July. Treasury debt outstanding data up to June 2014. Source: Federal Reserve, SIFMA
Meetings in London and Europe over the past week indicate rising optimism on Japan. This makes sense given growing evidence that the Topix has of late risen without the yen going down (see Figure 14), hopefully breaking the stock market’s correlation with a weak yen in place since 2005. Thus, the correlation between the Topix and the yen has been 0.94 since 2005, compared with a correlation of 0.51 so far this year (see Figure 15).
Figure 14 Topix and Yen/US$
Source: Bloomberg
(200)
0
200
400
600
800
1,000
1,200
1,400
1,600
1,800
2009 2010 2011 2012 2013 2014
(US$bn) Fed buying of US Treasuries
Increase in Treasury debt outstanding
100
101
102
103
104
105
1,100
1,120
1,140
1,160
1,180
1,200
1,220
1,240
1,260
1,280
1,300
1,320
Jan-14 Feb-14 Mar-14 Apr-14 May-14 Jun-14 Jul-14
Topix Yen/US$ (RHS)

Christopher Wood [email protected] +852 2600 8516
Thursday, 10 July 2014 Page 9
Figure 15 Topix and Yen/US$
Source: Bloomberg
Meanwhile, it is also a positive that share buyback announcements continue. This week Casio announced 3.16% buyback and the cancellation of 3.58% of outstanding share (or 98% of its Treasury stock). The announcement resulted in a 7.5% rise in Casio’s share price on Tuesday (see Figure 16).
Getting Japanese corporates to announce share buybacks is certainly a lot easier for Prime Minister Shinzo Abe than structural reform of the labour market, and also likely to have much more near term positive impact on the Japanese stock market.
Figure 16 Casio Computer share price
Source: Datastream
GREED & fear added to Indonesia’s weighting in the Asia Pacific ex-Japan relative-return portfolio in yesterday’s flash (see GREED & fear – flash, 9 July 2014) because of Jakarta governor Jokowi’s apparent win in Wednesday’s presidential election. GREED & fear says apparent because the result is still yet to be officially confirmed. This will not occur until 21-22 July. While opponent Prabowo Subianto has not yet officially conceded, with the seeming victory a relatively close 4-5% based on exit polls (see Figure 17).
70
80
90
100
110
120
130
500
700
900
1,100
1,300
1,500
1,700
1,900
2004 2005 2006 2007 2008 2009 2010 2011 2012 2013 2014
Topix Yen/US$ (RHS)
1,000
1,100
1,200
1,300
1,400
1,500
1,600
Jan 14 Feb 14 Mar 14 Apr 14 May 14 Jun 14 Jul 14
(Yen) Casio Computer share price

Christopher Wood [email protected] +852 2600 8516
Thursday, 10 July 2014 Page 10
Figure 17 Quick count survey results (Jokowi-Kalla vs Prabowo-Hatta)
Source: Various polls
A Jokowi victory is, clearly, the preferred outcome for financial markets. But it is a shame that the victory has not been more decisive. It is also a pity that Jokowi’s support in parliament will not be greater due to the incompetence of the election campaign conducted by the PDI-P party during April’s parliamentary campaign. As a result, Jokowi controls only 207 or 37% of the 560 parliamentary seats.
All this means this week’s election is nothing like the Indian landslide victory achieved by Narendra Modi in India. Still it is significant nonetheless since Jokowi undoubtedly represents a new face in Indonesian politics in a country badly in need of some new faces. Still that the “old faces” can still get traction is clear from the extent to which Prabowo reduced Jokowi’s lead during the five-week election campaign. Thus, Jokowi’s lead in surveys narrowed from around 15% in May to an average of 7.6% in early July. Indeed with negative campaigning ridiculing him as a “puppet” and a “closet Christian”, Jokowi felt compelled to make a quite visit to Mecca last weekend to demonstrate his religious affiliation.
The hope must be that this relatively turbulent campaign will have hardened Jokowi up for the challenges of running Indonesia. What the market wants to see, in particular, is less public money spent on energy subsidies and more on infrastructure. Under this fiscal year’s revised budget an estimated Rp150tn will be spent on infrastructure and Rp350tn on energy subsidies. But the official Jokowi goal is to phase out all energy subsidies over a four-year period.
The other point of focus will be whether Jokowi will be able to change existing policies to encourage renewed exploration activity in the oil and gas area. Remember that Indonesia is on course, on present trends, to become a net importer of oil, gas and coal by 2017. That has ominous medium-term implications for the current account. While in the short term the current account picture also looks potentially vulnerable given that credit growth in aggregate has remained surprisingly strong. Thus, Indonesian bank credit rose by 17.4%YoY in May, though down from 21.4%YoY at the end of 2013 (see Figure 18).
Much of the above is easily fixable in theory. But Indonesia is not a straightforward play so investors are advised not to take anything for granted. This situation contrasts with India where there is a happy coincidence that the economic cycle was bottoming out anyway just at the same time as the most pro-business, pro investment political leader in the world today was elected in a landslide victory.
5.6%4.8%
3.2%
5.4%6.7%
4.9%6.7%
1.9%
-4.1%
-0.3%-1.1%
-2.2%
-6%
-4%
-2%
0%
2%
4%
6%
8%

Christopher Wood [email protected] +852 2600 8516
Thursday, 10 July 2014 Page 11
Figure 18 Indonesia bank credit growth and nominal GDP growth
Source: CLSA, CEIC Data, Bank Indonesia
Figure 19 China nominal GDP growth and PPI inflation
Source: CLSA, CEIC Data
In meetings with investors over the past week, GREED & fear has the sense that investors have either bought “old China” stories for a trade or are looking for an excuse to do so. The best reason to do this is that PPI deflation has moderated for three months in a row. Thus, China PPI deflation has slowed from 2.3%YoY in March to 1.1%YoY in June, the smallest deflation since April 2012. And PPI, as discussed here before, is closely correlated to nominal GDP growth (see Figure 19).
This suggests that recent “mini stimulus” or “stealth stimulus” measures, call it whatever you want, have created some cyclical momentum. In this respect GREED & fear would not be surprised if the MSCI China outperforms this quarter. Still GREED & fear is not going to play this trade and will maintain the Underweight in the Asia Pacific ex-Japan relative-return portfolio. The aim, in theory at least, is to do relative-return asset allocation on a six-month view and GREED & fear’s base case is that such outperformance is unlikely to continue for six months if the residential property market continues to correct, as is now the case, with the latest evidence coming from China Reality Research’s property monthly released this week (see CRR report Property Monthly: Indicators worsen, listcos outperform, 8 July 2014). Thus, the average selling price at the 120 CRR-tracked residential projects fell 0.4%MoM in June, compared with the 0.1%MoM drop recorded in April and May (see Figure 20). While residential sales in 12 big mainland cities declined by 28%YoY in June, and are 23% lower than the average monthly sales of the previous three years (see Figure 21).
0
5
10
15
20
25
30
35
40
2003 2004 2005 2006 2007 2008 2009 2010 2011 2012 2013 2014
Indonesia bank credit growthNominal GDP growth
(%YoY)
135791113151719212325
-10
-8
-6
-4
-2
0
2
4
6
8
10
12
2002 2003 2004 2005 2006 2007 2008 2009 2010 2011 2012 2013 2014
(%YoY) (%YoY)
China Producer Price Index (PPI) inflation
Nominal GDP growth (RHS)

Christopher Wood [email protected] +852 2600 8516
Thursday, 10 July 2014 Page 12
Figure 20 CRR Property Price Index
Note: Based on average selling prices at the 120 for-sale residential projects in 40+ 2nd and 3rd tier cities tracked by CRR. Source: China Reality Research (CRR)
Figure 21 Change in average daily residential sales in 12 big mainland cities
Note: Adjusted to show Jan-Feb combined growth. Source: City-level Real Estate Information Centres, CRR
But GREED & fear is assuming that the central government will continue for now to allow a market-driven correction in the residential property market, the biggest domestic sector accounting for an estimated 12% of GDP and an even bigger share if related sectors such as cement, construction machinery and steel are included. Cement, steel and construction sales account for 4% of GDP.
-6%
-4%
-2%
0%
2%
4%
6%
8%
10%
-0.8%-0.6%-0.4%-0.2%0.0%0.2%0.4%0.6%0.8%1.0%1.2%
Jan-
11
Mar
-11
May
-11
Jul-
11
Sep
-11
Nov
-11
Jan-
12
Mar
-12
May
-12
Jul-
12
Sep
-12
Nov
-12
Jan-
13
Mar
-13
May
-13
Jul-
13
Sep
-13
Nov
-13
Jan-
14
Mar
-14
May
-14
(%MoM) (%YoY)%MoM %YoY (RHS)
-100%
-50%
0%
50%
100%
150%
Jan-
09M
ar-0
9M
ay-0
9Ju
l-09
Sep
-09
Nov
-09
Jan-
10M
ar-1
0M
ay-1
0Ju
l-10
Sep
-10
Nov
-10
Jan-
11M
ar-1
1M
ay-1
1Ju
l-11
Sep
-11
Nov
-11
Jan-
12M
ar-1
2M
ay-1
2Ju
l-12
Sep
-12
Nov
-12
Jan-
13M
ar-1
3M
ay-1
3Ju
l-13
Sep
-13
Nov
-13
Jan-
14M
ar-1
4M
ay-1
4
Change in average daily residential salesin 12 big mainland cities
(%YoY)

Christopher Wood [email protected] +852 2600 8516
Thursday, 10 July 2014 Page 13
Research subscriptions To change your report distribution requirements, please contact your CLSA sales representative or email us at [email protected]. You can also fine-tune your Research Alert email preferences at https://www.clsa.com/member/tools/email_alert/.
Key to CLSA/CAST investment rankings: BUY: Total stock return (including dividends) expected to exceed 20%; O-PF: Total expected return below 20% but exceeding market return; U-PF: Total expected return positive but below market return; SELL: Total expected return to be negative. For relative performance, we benchmark the 12-month total forecast return (including dividends) for the stock against the 12-month forecast return (including dividends) for the market on which the stock trades. • We define as “Double Baggers” stocks we expect to yield 100% or more (including dividends) within three years. ©2014 CLSA Limited (for research compiled by non-Taiwan analyst(s)) and/or Credit Agricole Securities Taiwan Co., Ltd (for research compiled by Taiwan analyst(s)). Note: In the interests of timeliness, this document has not been edited. The analyst/s who compiled this publication/communication hereby state/s and confirm/s that the contents hereof truly reflect his/her/their views and opinions on the subject matter and that the analyst/s has/have not been placed under any undue influence, intervention or pressure by any person/s in compiling such publication/communication. CLSA group of companies (excluding CLSA Americas, LLC) (“CLSA”), Credit Agricole Securities Taiwan Co., Ltd. (“CA Taiwan”), CLSA/CA Taiwan's analysts and/or their associates do and from time to time seek to establish business or financial relationships with companies covered in their research reports. As a result, investors should be aware that CLSA and/or such individuals may have one or more conflicts of interests that could affect the objectivity of this report. Regulations or market practice of some jurisdictions/markets prescribe certain disclosures to be made for certain actual, potential or perceived conflicts of interests relating to research reports and such details are available at www.clsa.com/member/research_disclosures/. Disclosures therein include the position of CLSA, CLSA Americas, LLC and CA Taiwan only and do not reflect those of CITIC Securities International Company Limited, Credit Agricole Corporate & Investment Bank and/or their respective affiliates. If investors have any difficulty accessing this website, please contact [email protected] or +852 2600 8111. If you require disclosure information on previous dates, please contact [email protected] IMPORTANT: The content of this report is subject to and should be read in conjunction with the disclaimer and CLSA's Legal and Regulatory Notices as set out at www.clsa.com/disclaimer.html, a hard copy of which may be obtained on request from CLSA Publications or CLSA Compliance Group (18/F, One Pacific Place, 88 Queensway, Hong Kong, telephone +852 2600 8888) and/or CA Taiwan Compliance (27/F, 95, Section 2 Dun Hua South Road, Taipei 10682, Taiwan, telephone +886 2 2326 8188). 01/01/2014