Greatly Increased Use of Fly Ash in Hydraulic Cement ... · Greatly Increased Use of Fly Ash in...
59
Greatly Increased Use of Fly Ash in Hydraulic Cement Concrete (HCC) for Pavement Layers and Transportation Structures - Volume I Final Report to Research Consortium led by Purdue University and funded by FHWA (March 2012) Prepared by Karthik H. Obla, PhD, PE, Colin L. Lobo and Haejin Kim, PhD Prime Award No. DTFGH61-09-H-00005 Subaward No. 4108-30885 The National Ready Mixed Concrete Association (NRMCA) was involved in 2 phases of this project. Phase I – Fly ash Use Survey The purpose of this phase is to evaluate the past, current and future trends of use of fly ash in concrete and restrictions to its use. The American Coal Ash Association 1 (ACAA) conducts an annual survey of fly ash production and use. Typically on an annual basis out of the 70 million tons of fly ash generated, about 40% is beneficially utilized. Out of the fly ash that is beneficially used about 50% is used in cement and concrete applications. Table 1a has been developed based on fly ash use as reported by ACAA, slag cement use as reported by the Slag Cement Association 2 and cement use as reported by the US Geological Survey 3 . Ready mixed concrete production is estimated from cement shipments reported by USGS. Several other assumptions as stated in Table 1a are made to derive the fly ash volume used in ready mixed concrete. Table 1a shows that even though concrete volume had decreased, fly ash and fly ash+slag cement use had steadily increased and stood at 12% and 16% respectively of the total cementitious content in 2008. These percentages should not be confused to percent of cementitious materials used in typical concrete mixtures. Even though ready mixed concrete forms the single largest market for fly ash it can still offer the largest potential for increased fly ash utilization. There is a large body of research and literature 4- 6 on the development and use of High-Volume Fly Ash (HVFA) concrete but actual use still is much lower. In order to clarify some of the assumptions and corroborate the findings made in Table 1a a survey of ready mixed concrete producers was conducted to determine: 1. Average amounts of cement, fly ash, slag cement, and silica fume used in a cubic yard of ready mixed concrete. This will serve as a bench mark for future comparisons. 2. Differences between the percent of supplementary cementitious materials (SCM) use between companies 3. Primary reasons for not using more fly ash. This will help devise programs for enhancing fly ash use in ready mixed concrete.
Transcript of Greatly Increased Use of Fly Ash in Hydraulic Cement ... · Greatly Increased Use of Fly Ash in...

Greatly Increased Use of Fly Ash in Hydraulic Cement Concrete (HCC) for Pavement Layers and Transportation
Structures - Volume I
Final Report to Research Consortium led by Purdue University and funded by FHWA (March 2012)
Prepared by
Karthik H. Obla, PhD, PE, Colin L. Lobo and Haejin Kim, PhD
Prime Award No. DTFGH61-09-H-00005 Subaward No. 4108-30885
The National Ready Mixed Concrete Association (NRMCA) was involved in 2 phases of this project.
Phase I – Fly ash Use Survey The purpose of this phase is to evaluate the past, current and future trends of use of fly ash in concrete and restrictions to its use. The American Coal Ash Association1 (ACAA) conducts an annual survey of fly ash production and use. Typically on an annual basis out of the 70 million tons of fly ash generated, about 40% is beneficially utilized. Out of the fly ash that is beneficially used about 50% is used in cement and concrete applications. Table 1a has been developed based on fly ash use as reported by ACAA, slag cement use as reported by the Slag Cement Association2 and cement use as reported by the US Geological Survey3. Ready mixed concrete production is estimated from cement shipments reported by USGS. Several other assumptions as stated in Table 1a are made to derive the fly ash volume used in ready mixed concrete. Table 1a shows that even though concrete volume had decreased, fly ash and fly ash+slag cement use had steadily increased and stood at 12% and 16% respectively of the total cementitious content in 2008. These percentages should not be confused to percent of cementitious materials used in typical concrete mixtures. Even though ready mixed concrete forms the single largest market for fly ash it can still offer the largest potential for increased fly ash utilization. There is a large body of research and literature4-
6 on the development and use of High-Volume Fly Ash (HVFA) concrete but actual use still is much lower. In order to clarify some of the assumptions and corroborate the findings made in Table 1a a survey of ready mixed concrete producers was conducted to determine:
1. Average amounts of cement, fly ash, slag cement, and silica fume used in a cubic yard of ready mixed concrete. This will serve as a bench mark for future comparisons.
2. Differences between the percent of supplementary cementitious materials (SCM) use between companies
3. Primary reasons for not using more fly ash. This will help devise programs for enhancing fly ash use in ready mixed concrete.
The survey was based on excel and is reproduced in Appendix A.1. The survey findings are as follows: Survey Respondents A total of 57 companies/divisions responded constituting total ready mixed concrete production in 2010-11 (12 months) of 35 million yd3 which was 13% of total production for that period. The breakdown of survey respondents is: 53% of the companies produced less than 250,000 yd3, 32% between 250,000 and 1 million yd3, and 16% of the companies produced more than 1 million yd3. The average reported production per respondent was 610,000 yd3. Table 1b shows the minimum, maximum and percentile breakdown of production amounts. The respondents cover a broad range of production. Use of SCMs About 98% of the companies had used fly ash in some of their concrete over that time period. It does not mean that fly ash was used in all the concrete produced. Similarly 61% of the companies had used slag cement and 39% of the companies used silica fume. 9% of the companies used blended cement. 61% of the companies reported using blended cement and/or more than one SCM but not necessarily in the same concrete mixture. Quantity of SCMs used The average reported portland cement consumption was 457 lb per yd3 produced; blended cement was 2.7 lb/yd3; fly ash was 83 lb/yd3; slag cement was 18 lb/yd3; silica fume was 0.2 lb/yd3. These numbers do not reflect typical concrete mixture proportions being used. Rather for each specific material (for example slag cement) they are arrived at by dividing the total material consumed annually by all respondents by the total annual concrete produced by all respondents. In the discussions below the fly ash and total SCM was calculated after assuming that the blended cement had on average 70% portland cement, 10% fly ash, and 30% total SCM (this includes the 10% fly ash). Table 1b shows the minimum, maximum and percentile breakdown of portland cement, fly ash and total SCM used. Figure 1 shows the cumulative distribution function of the total SCM use. When the 20th and 80th percentile numbers are compared it is clear that there is a 2-3 times increase in the amount of fly ash and total SCM used between companies. SCM Use by company size No trends can be observed in average portland cement, and/or SCM usage when companies are differentiated based on their production levels. Table 1c shows the average portland cement, fly ash, and total SCM consumption for companies producing less than 250,000 yd3, between 250,000 and 1 million yd3, and over 1 million yd3. The averages for “all” production are also provided. The average portland cement content was consistently around 455 lb/ yd3 and average total SCM content was consistently around 102 lb/yd3. Smaller producers used more slag cement as compared to fly ash but this may be a result of the regional availability and companies responding to the survey. Breakdown of concrete production based on SCM use Producers were asked to state how much of their production was with straight portland cement etc. It is not clear how many companies were tracking these numbers; therefore there is some
uncertainty associated with responses to this question. Data analysis reveals that 34% of all ready mixed concrete produced was with straight portland cement; 2.2% with blended cement only, 56% with fly ash as the only SCM, 5.1% with slag cement as the only SCM, 0.1% was with silica fume as the only SCM, and 2.8% was with more than one SCM (ternary mixtures). Reasons that limit use of fly ash Producers were asked to rank the reasons for not substantially increasing the use of fly ash with “1” being extremely important and “6” being least important. Table 1d illustrates the average ratings. Restrictive specifications and concrete performance issues ranked as the most important reasons (average rating of 2.5), followed by customer objection (2.9), variable fly ash properties (3.9) and finally fly ash availability and use of other SCMs (4.6). Lack of fly ash availability may be a localized concern in some areas. Use of other SCMs is not considered as an important reason. Use of other SCMs like slag cement also helps improve concrete performance and makes concrete more sustainable. In a slightly different way of analyzing these data, producer rankings 1, and 2 were compiled together as “strongly agree”, 3-4 were termed “agree” and 5-6 were termed “neutral”. Table 1d illustrates that by this approach the rankings are the same as before with restrictive specifications and performance issues ranked as the most important reasons for limiting use. There was no correlation between how producers responded to this question and their production numbers, and/or extent of SCM use. Opportunities for Increasing the use of fly ash Producers were also asked to list the various opportunities that exist to substantially increase the use of fly ash. Individual comments from the survey are captured in Appendix A.2. A vast majority of them listed education of specifiers and owners on the benefits of use of SCMs as the most important reason; some of them listed cost and performance issues such as setting time and early age strength; a few listed lack of availability but that might again be a localized phenomenon. Conclusions If the overall average SCM use increases to the currently reported 80th percentile level in Table 1b that would lead to an increase in SCM use from 102 lb to 144 lb per cubic yard produced, i.e. an increase of 42 lb. If all of this increase is attributed to increase in fly ash use and if the annual ready mixed concrete production were to recover to the pre 2008 recession level of 460 million yd3 that would increase the beneficial use of fly ash by an additional 14 million tons. This represents an increase of fly ash utilization from 40%, currently, to 61%. For all ready mixed concrete produced SCM use will then constitute 26% of the total cementitious content as opposed to the current levels of 18%. In order to accomplish this, it is suggested that a series of seminars with the target audience of specifying engineers, contractors and concrete producers be conducted with the following goals:
1. Replace specification restrictions on SCM dosages with concrete performance requirements.
2. Share laboratory/field data showing acceptable concrete performance with higher amounts of SCMs
3. Share best practices for successfully incorporating higher amounts of SCMs and achieving concrete performance requirements
It may be useful to include presentations by concrete producers who are already at the 80% percentile in terms of use of SCMs. Phase II – Development of an Activation Energy Database and Strength-Maturity Relationship One of the primary reasons provided for not using HVFA concrete is its slower setting characteristics and rate of strength development, especially at early ages. This can be addressed to some extent through the effective use of chemical admixtures and proportions and characteristics of other ingredients when developing and producing concrete mixtures. In an earlier research study7 it was clearly shown that even though laboratory or field cured measured strengths at early ages of HVFA concrete mixtures are low the actual strengths in the structure is higher. This is because the greater mass of concrete in most structures entraps more heat generated by the hydration reactions of cementitious materials. Higher in-place concrete temperatures allow for faster rate of strength gain in the structure than indicated by strength of standard-cured or field-cured cylinders.
Maturity techniques have been developed and used to predict the concrete strength in the structure. The strength of in-place concrete in the structure is estimated by monitoring its temperature history over time, calculating the accumulated maturity, and by obtaining an estimated strength from the pre-determined strength-maturity relationship that is unique to that set of materials and the mixture. Maturity concepts are well established for concrete mixtures containing only portland cement. Not much work has been done with HVFA concrete mixtures containing chemical admixtures. The Arrhenius and Nurse-Saul maturity functions are commonly used to calculate the maturity index. The Arrhenius maturity function is considered to be more accurate and it requires the use of a mixture-specific activation energy to yield accurate results. Activation energy parameters for HVFA have not been established to any degree of accuracy. This phase of the project therefore focuses on developing an activation energy database comprising of typical fly ashes and portland cements used commercially. The activation energy quantifies the temperature sensitivity of the concrete mixture. The activation energy of each of the concrete mixture is established using the procedure outlined in ASTM C1074-118. Trial Concrete Mixtures The physical and chemical properties of the three fly ashes and the two cements used in this study are provided in Table 2. An ASTM C4948 Type F polycarboxylate based super plasticizer and a Type C accelerating admixture were used. Before starting on the activation energy testing several trial mixtures were prepared to finalize the most optimal HVFA concrete mixture combination that will yield adequate early age strengths and workability. Table 3 shows the concrete mixture proportions and test results:
• Mixture 1 is the control mixture with low alkali Type I cement (Cement A) and no fly ash.

• Mixture 2 is the HVFA concrete mixture containing 50% fly ash (fly ash FAA) designed to attain higher early age strength by using a low w/cm (low mixing water content and high cementitious content). Mixture 2 attained about 3000 psi at 2 days and 3800 psi at 4 days. This rate of strength gain is adequate for most applications. Mixture 2 could be used for vertical elements but it was determined that the consistency was very sticky. This was likely due to the high paste volume and the use of a low water content and high HRWRA. Mortar mixtures were evaluated by varying proportions to improve the workability. To improve this in Mixture 3 cement replacement with fly ash was done on a volume basis while maintaining the total paste volume equal to that of the control concrete Mixture 1. This led to the development of HVFA Mixture 3.
• Mixture 3 is a HVFA mixture. The fly ash was at 50% volume of total cementitious (approximately 40% by weight). Mixture 3 had a lower mixing water content and HRWR admixture dosage level than Mixture 2 and similar workability. Comparing the strength at early age of 2 and 4 days of this mixture to Mixture 2 it is clear that the fly ash does not appear to be contributing much to strength gain. At a 45°F curing temperature (by placing the cylinders in a refrigerator maintained at 45°F) the 2 day compressive strengths was 1700 psi.
• Mixture 4 is a modification of Mixture 3 by using 30 oz/cwt of a Type C non-chloride accelerating admixture. This caused an increase in the 2 and 4 day strengths for concrete cured at 73°F and at the 45°F curing temperature, compared to Mixture 3.
• In Mixture 5 a Type III cement from a different source replaced the Type I cement used in Mixture 4. Using the Type III cement yielded a significantly higher compressive strengths for specimens cured at 73°F and at 45°Fas indicated in Table 3. The measured strengths at early age of Mixture 5 are even higher than the control Mixture 1. The use of a Type III cement and higher dosage of a Type C accelerating admixture will increase materials cost and may only be necessary in fast-track construction applications.
Experimental work for Determination of Activation Energy (AE) In this portion of the study, for determining the activation energy of HVFA mixtures, mortar mixtures were used by proportioning the mortar to have a fine aggregate-to-cement ratio equal to the coarse aggregate-to-cement ratio of the concrete. This is as recommended in ASTM C1074. The mortar mixture with 50% fly ash is equivalent to concrete Mixture 4 (Table 3) since it yielded acceptable early age strengths. Variables Table 4 summarizes the variables for the 14 mortar mixtures used in the determination of the activation energy. The variables were as follows:
• Two portland cements – Cement B (low alkali) and Cement C (high alkali); • Three fly ashes – Fly ash A (Class F, low calcium); Fly ash B (Class F, intermediate
calcium), and Fly ash C (Class C, high calcium); • Fly ash quantity - 35% and 50% of cementitious materials by volume;
The w/cm of the mortar mixtures was varied – the w/cm of the control mixture was 0.43; and 0.39 and 0.34 for the 35% and 50% fly ash mixtures, respectively. Procedures

Mortar mixtures were mixed and the cubes were molded in accordance with ASTM C1099. Mortar cubes were conditioned in lime-saturated water baths maintained at 3 different temperatures - 45°F, 73°F, 100°F. All ingredient materials for mortar mixtures were conditioned at the respective temperatures for 24 hours before mixing. For the 73°F condition, the standard curing room was used; for the higher temperature, the specimens were stored in a room maintained at 100°F; and for the 45°F condition, the specimens were stored in a refrigerator maintained at that temperature. A total of 18 cubes were made for each batch – two 2 in. cubes at each of 7 test ages, 1 cube with embedded temperature sensor, and 3 extra cubes. A temperature sensor placed in the water bath as a back-up record of curing temperature. Compressive strength was measured at equivalent ages (73°F) of early age (less than 1 day), 1, 2, 4, 8, 16, 32 days. This should not be confused with chronological test ages. Equivalent age represents the age at a reference curing temperature (73°F) that results in the same maturity as under the actual curing temperature. To estimate the chronological test age for the temperature conditions of 45°F and 100°F, an initial approximation of activation energy based on past experience was used. The early age (less than 1 day) was chosen by estimating when a compressive strength in the range of 600-1000 psi would be achieved. Typically this strength level is attained at an equivalent age of 12 hours and was used as a starting point. Results and Discussion Tables 5a-c summarize the mortar mixture proportions and test results of fresh mortar mixtures with the low alkali cement at curing temperatures 73°F, 100°F and 45°F, respectively. Tables 6a-c summarizes the mortar compressive strength results of corresponding mixtures. Figure 2, 3, 4 illustrate the compressive strength test results of low alkali cement mixtures conditioned in 73°F, 100°F, and 45°F respectively. In the following discussion, the fly ash quantity in the mixtures is on the basis of volume of cementitious materials. From Figure 2 (73°F) the following observations are made:
1. The control mixture, Mix 1, had the fastest rate of strength gain at early age as expected and the rate slowed considerably by 16 days.
2. For the fly ash mixtures with 35% fly ash, the faster rate of strength gain at early ages was evident with the FAA fly ash. The strength of this mixture exceeded that of the control mixture by 18 days. The strength of the mixtures with fly ashes FAB and FAC exceeded that of the control mixture after 80 days. Later age strength for the fly ash mixtures is ranked from highest to lowest with fly ashes FAA, FAB and FAC.
3. For the mixtures with 50% fly ash, there was little difference between the mixtures at early ages. These mixtures had a slower rate of strength gain compared to the control mixture and exceeded it by 28 days. Ranking later age strength followed the same trend for highest to lowest: FAA, FAB and FAC.
4. Two of the mixtures (0.43PC and 0.34FAA50) had to be repeated because the early age strength measured exceeded the target range of 600-1000 psi. The repeat mixtures (0.43PC-R and 0.34FAA50-R) show compressive strength test results very close to the original mixtures thus confirming good repeatability.
Figure 3 illustrates strength curves for mortars maintained at 100°F. The strength of 35% and 50% fly ash mixtures exceeded that of the control mixture within 4-6 days. The mixture with the

FAA fly ash had higher later age strength than the mixtures with the FAB and FAC fly ashes. The higher curing temperature caused an accelerated rate of strength development for the fly ash mixtures compared to the control mixture. Later age (>90 days) data shows the fly ash mixtures had a mortar strength almost 3000 to 4000 psi higher than the control mixture. Ultimate strengths of the fly ash mixtures appear to be less affected by higher temperature compared to the control mixture without fly ash. Figure 4 illustrates strength curves for mortars maintained at 45°F. The strength of the 35% FAA and FAC mixtures exceeded the control mixture after 1 year. The strength of the50% FAC and FAA mixture exceeded that of the control mixture after 200 days and 1 year respectively. Both the FAB mixtures were lagging behind the control even after 1 year. The lower curing temperature resulted in a slower rate of strength development for the fly ash mixtures as compared to the control mixture. Tables 5d-f summarize the mortar mixture proportions and test results of fresh mortar mixtures with the high alkali cement at curing temperatures 73°F, 100°F and 45°F, respectively. Tables 6d-f summarizes the mortar compressive strength results of corresponding mixtures. Figure 5, 6, 7 illustrate the compressive strength test results of high alkali cement mixtures conditioned in 73°F, 100°F, and 45°F respectively. In the following discussion, the fly ash quantity in the mixtures is on the basis of volume of cementitious materials. From Figure 5 (73°F) the following observations are made:
1. The control mixture had the fastest rate of strength gain at early age as expected and the rate slowed considerably by 8 days
2. For the fly ash mixtures with 35% fly ash, the faster rate of strength gain at early ages was evident with the FAA fly ash. The strength of this mixture exceeded that of the control mixture by 33 days. The strength of the mixtures with fly ashes FAB and FAC exceeded that of the control mixture after 45 days. Later age strength for the fly ash mixtures is ranked from highest to lowest with fly ashes FAA, FAB and FAC.
3. For the 50% fly ash dosage the FAA and FAB fly ash mixtures showed a faster strength gain and had exceeded the control mixture by 25 days. The FAC mixture had exceeded the control by about 90 days. Later age data shows the FAA, FAB mixtures with a better strength gain as compared to FAC mixture.
4. One mixture (0.43PC) had to be repeated because the early age strength measured exceeded the target range of 600-1000 psi. The repeat mixtures (0.43PC-R) shows compressive strength test results very close to the original mixtures thus confirming good repeatability
Figure 6 illustrates strength curves for mortars maintained at 100°F. The strength of 35% FAA and FAC mixtures had exceeded the control mixture by 11 days. The 35% FAB mixture also exceeded the control mixture by 16 days. Later age strength for the fly ash mixtures is ranked from highest to lowest with fly ashes FAA, FAC and FAB. All of the 50% fly ash mixtures exceeded the control mixture by 7 days and by 90 days had over 2000 psi higher strength as compared to the control mixture.

Figure 7 illustrates strength curves for mortars maintained at 45°F. Even after 1 year all of the fly ash mixtures were lagging behind the control mixture. In some of the mortar mixtures the dosage of the Type F HRWRA used considerably exceeded the manufacturer’s recommended dosage. This caused some retardation. These mixtures were repeated. It was decided, however, that the strengths measured were appropriate to use in the analysis. More details of the repeated mixtures are discussed in Appendix B. Charts in Appendix C illustrate different comparisons of the mortar test results. The following conclusions can be drawn from those plots:
1. A cross-over effect is observed in these charts, where the later age strengths of the specimens cured at cooler temperatures are higher than that of specimens cured at warmer temperatures. This effect is observed for the control 0.43PC, and to a lesser extent for the 0.39FAA35 and 0.39FAB35 mixtures. It was not observed for the rest of the fly ash mixtures even when testing was extended to over 1 year.
2. For the control 0.43PC mixture the strengths of the specimens cured at 43°F exceeded that of specimens cured at 73°F after 80 days. For all the fly ash mixtures even after 400 days of curing at 43°F the strengths were similar to the 28 day strengths of specimens cured at 73°F.
3. Alkali content of fly ash does not seem to influence the rate of strength development of fly ash mixtures. The high and low alkali cement mixtures for the control as well as the fly ash mixtures showed similar strengths at different curing temperatures except for the 0.39FAA35 and 0.39FAB35 mixtures cured at cooler temperatures, in which case the high alkali cement mixtures showed higher strengths.
Determination of Activation Energy The Activation Energy (AE) was determined for all 14 mixtures - 7 with low alkali cement and 7 with high alkali cement. For each mixture after the completion of the mortar cube testing the compressive strength and equivalent age data at each of the three temperatures were fitted with a hyperbolic function in accordance with ASTM C1074. The hyperbolic function is
1
Where: S = average cube compressive strength at age t, t = test age, Su = limiting strength, t0 = age when strength development is assumed to begin, and k = rate constant The solver process of Microsoft Excel software was used to calculate the best-fit values of Su, t0, and k through a regression analysis. For each mixture the rate constants were plotted against temperature and fitted with the Arrhenius equation, from which the AE was estimated. Using the
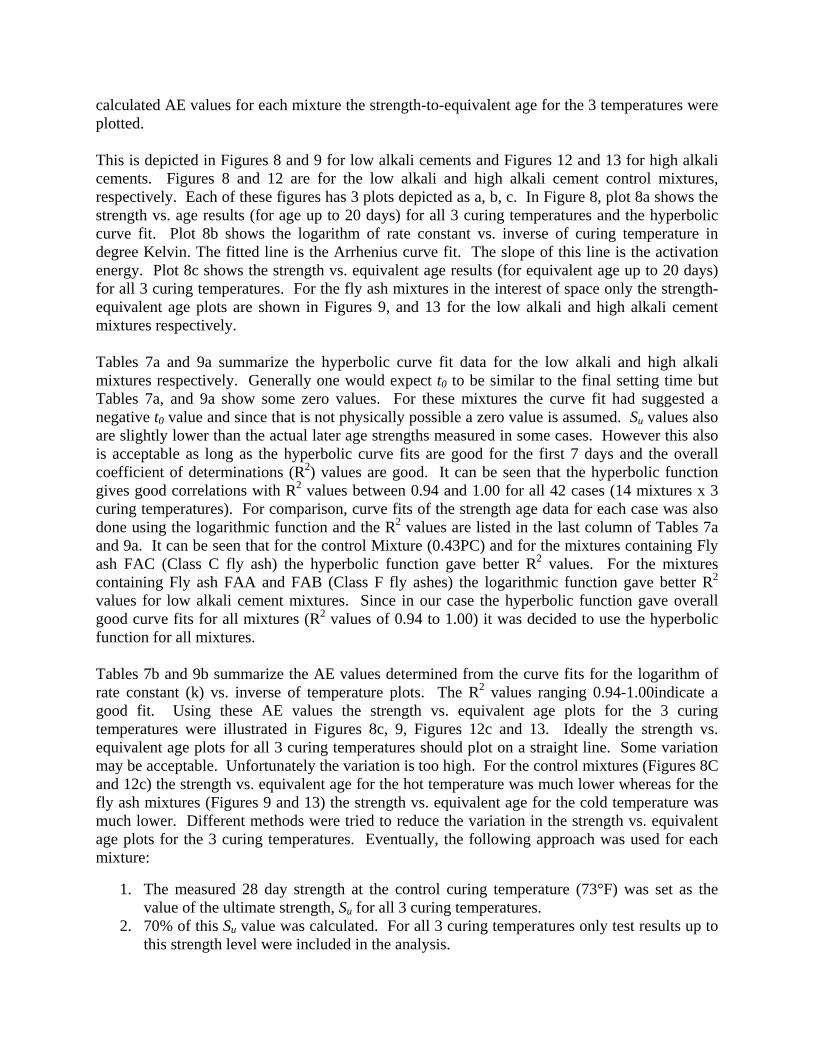
calculated AE values for each mixture the strength-to-equivalent age for the 3 temperatures were plotted. This is depicted in Figures 8 and 9 for low alkali cements and Figures 12 and 13 for high alkali cements. Figures 8 and 12 are for the low alkali and high alkali cement control mixtures, respectively. Each of these figures has 3 plots depicted as a, b, c. In Figure 8, plot 8a shows the strength vs. age results (for age up to 20 days) for all 3 curing temperatures and the hyperbolic curve fit. Plot 8b shows the logarithm of rate constant vs. inverse of curing temperature in degree Kelvin. The fitted line is the Arrhenius curve fit. The slope of this line is the activation energy. Plot 8c shows the strength vs. equivalent age results (for equivalent age up to 20 days) for all 3 curing temperatures. For the fly ash mixtures in the interest of space only the strength-equivalent age plots are shown in Figures 9, and 13 for the low alkali and high alkali cement mixtures respectively. Tables 7a and 9a summarize the hyperbolic curve fit data for the low alkali and high alkali mixtures respectively. Generally one would expect t0 to be similar to the final setting time but Tables 7a, and 9a show some zero values. For these mixtures the curve fit had suggested a negative t0 value and since that is not physically possible a zero value is assumed. Su values also are slightly lower than the actual later age strengths measured in some cases. However this also is acceptable as long as the hyperbolic curve fits are good for the first 7 days and the overall coefficient of determinations (R2) values are good. It can be seen that the hyperbolic function gives good correlations with R2 values between 0.94 and 1.00 for all 42 cases (14 mixtures x 3 curing temperatures). For comparison, curve fits of the strength age data for each case was also done using the logarithmic function and the R2 values are listed in the last column of Tables 7a and 9a. It can be seen that for the control Mixture (0.43PC) and for the mixtures containing Fly ash FAC (Class C fly ash) the hyperbolic function gave better R2 values. For the mixtures containing Fly ash FAA and FAB (Class F fly ashes) the logarithmic function gave better R2 values for low alkali cement mixtures. Since in our case the hyperbolic function gave overall good curve fits for all mixtures (R2 values of 0.94 to 1.00) it was decided to use the hyperbolic function for all mixtures. Tables 7b and 9b summarize the AE values determined from the curve fits for the logarithm of rate constant (k) vs. inverse of temperature plots. The R2 values ranging 0.94-1.00indicate a good fit. Using these AE values the strength vs. equivalent age plots for the 3 curing temperatures were illustrated in Figures 8c, 9, Figures 12c and 13. Ideally the strength vs. equivalent age plots for all 3 curing temperatures should plot on a straight line. Some variation may be acceptable. Unfortunately the variation is too high. For the control mixtures (Figures 8C and 12c) the strength vs. equivalent age for the hot temperature was much lower whereas for the fly ash mixtures (Figures 9 and 13) the strength vs. equivalent age for the cold temperature was much lower. Different methods were tried to reduce the variation in the strength vs. equivalent age plots for the 3 curing temperatures. Eventually, the following approach was used for each mixture:
1. The measured 28 day strength at the control curing temperature (73°F) was set as the value of the ultimate strength, Su for all 3 curing temperatures.
2. 70% of this Su value was calculated. For all 3 curing temperatures only test results up to this strength level were included in the analysis.

3. t0, k, and AE values were determined using the best fit with the hyperbolic function discussed earlier. The log of rate constant (k) was plotted against inverse of temperature and this slope of this fitted line is reported as the estimate of the activation energy.
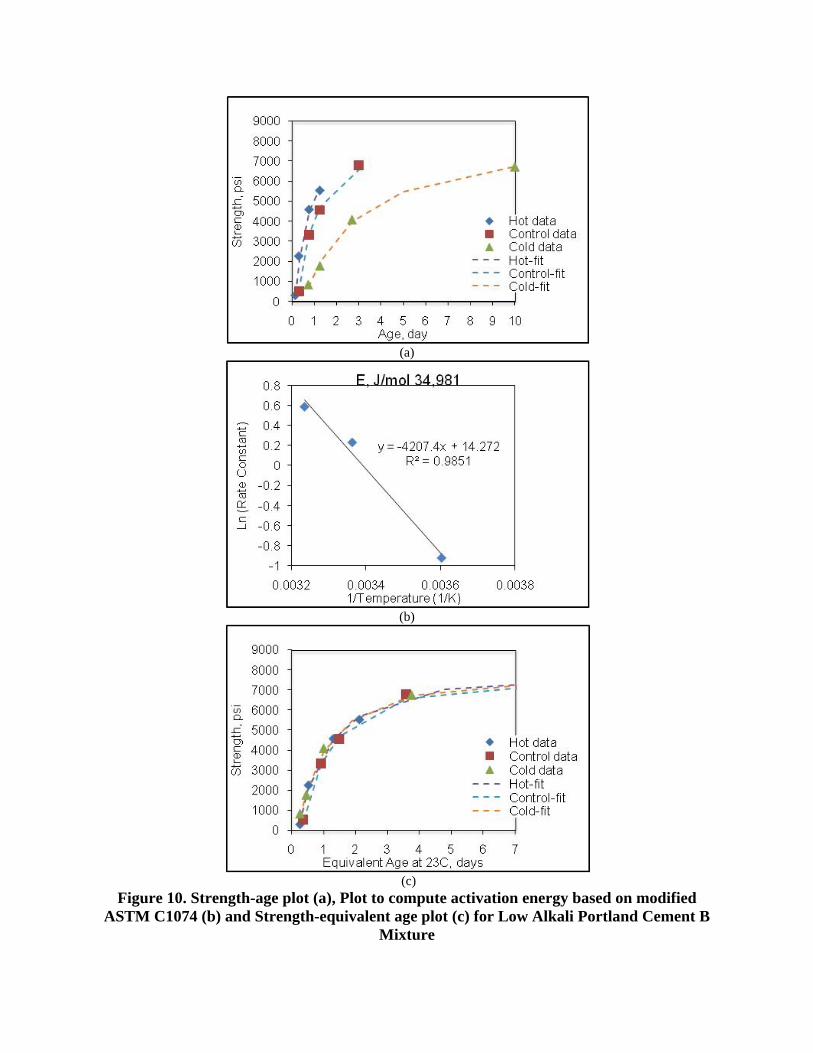
The above process is depicted in Figures 10 and 11 for low alkali cements and Figures 14 and 15 for high alkali cements. Figures 10 and 14 are for the low alkali and high alkali cement control mixtures, respectively. Each of these figures has 3 plots depicted as a, b, c. In Figure 10, Plot 10a illustrates the strength vs. age results for all 3 curing temperatures and the hyperbolic curve fit to the data. Only strength test results up to 70% of the Su value were used in the analysis. Plot 10b plots the logarithm of rate constant (k) vs. inverse of curing temperature in degree Kelvin and the line fit. The slope of this line is used to calculate the activation energy. Plot 10c shows the strength vs. equivalent age results (for equivalent age up to 7 days) for all 3 curing temperatures. For the fly ash mixtures in the interest of space only the strength-to-equivalent age plots are illustrated in Figures 11 and 15 for the low alkali and high alkali cement mixtures respectively. Using the modified analysis, Tables 8a and 10a summarize the hyperbolic curve fit data for the low alkali and high alkali mixtures, respectively. The values of t0 determined from this analysis are more reasonable than those in Table 7a with the prior analysis.. The values of Su are lower than the actual measured later age strengths. However this was considered to be acceptable as long as the hyperbolic curve fits are good for the first 7 days and the overall coefficient of determinations (R2) values are good. It can be seen that the hyperbolic function indicate a good fit with R2 values between 0.91 and 1.00 for all 42 cases. Table 8b and 10b summarize the activation energy values determined from the curve fits from the plots of the logarithm of rate constant (k) vs. inverse of temperature. Using these derived values of activation energy, the strength vs. equivalent age plots for the 3 curing temperatures were drawn (Figures 10c, 11, and Figures 14c and 15). It can be seen that with this modified analysis the curves for 3 different curing temperatures converge together as should be expected. Significance of the Activation Energy Values Calculated For any concrete mixture the rate of strength development increases as concrete temperature increases. The activation energy values provide a relative indicator of the rate of hydration and strength gain characteristics of cementitious systems dependent on temperature. A higher value of the activation energy has a lower rate of strength gain at lower temperature and this rate increases as temperature rises. Lower values of activation energy indicate that the cementitious materials are less temperature sensitive. This can be observed in age conversion factors calculated from the AE of the various mixes listed in Table 8b and 10b. Age conversion factors of a mixture at a specific temperature can be seen as the ratio of strength of that mixture at that temperature to the strength at a reference (datum) temperature, which is commonly 73°F. So for the low alkali 0.43PC mixture (Table 8b) at 41°F the strength is only 40% of the strength at 73°F which means that in order to attain the 2 day strength at 73°F one would have to cure the specimen at 41°F for 5 days (2/0.40). The low alkali 0.43PC mix had an AE of 34,981 J/mol. The fly ash mixtures made with low alkali cement have up to 50% higher AE values. For the 0.39FAA35 mixture at 41°F the strength is only 24% of the strength at 73°F which means that in order to attain the 2 day strength at 73°F one would have to cure the specimen at 41°F for 8.3

days. The AE values of mixtures made with the high alkali cement in general were lower for the 0.39FAA35 and 0.39FAB35 mixtures; for the rest of the mixtures it was similar. The AE values were up to 25% higher for the 50% low alkali cement fly ash mixtures and 50% higher for the 50% high alkali cement fly ash mixtures when compared to their respective control mixtures. No particular trends between AE values and cement or fly ash properties could be discerned. The age conversion factor is used to convert the temperature history of the concrete in the field into an equivalent age at 73°F and based on a predetermined strength-equivalent age relationship the strength is estimated. Development of Concrete Strength-Maturity Relationship Concrete testing was conducted on the 50% fly ash (by volume) mixtures with low and high CaO fly ash in conjunction with low and high alkali cements (total of 4 concrete mixtures). Table 11 shows the mixture proportions and test results. Mixtures 1 and 2 used low alkali cement (Cement B) and were the concrete equivalents of mortar Mixtures 0.34FAA50 and 0.34FAC50 respectively in Table 5a. Therefore they will be referred to as 0.34FAA50LAC, and 0.34FAC50LAC respectively. Mixtures 3 and 4 used high alkali cement (Cement C) and were the concrete equivalents of mortar mixtures 0.34FAA50 and 0.34FAC50 respectively in Table 5d. Therefore they will be referred to as 0.34FAA50HAC, and 0.34FAC50HAC respectively. Concrete slump (ASTM C143), temperature (C1064), density (C138), air content (C231), and compressive strength (C39) was measured. The w/cm was 0.34 for all the mixtures and a target concrete slump of 4 to 8 in. was attained through the use of a HRWR. All concrete mixtures were non air entrained. A 30 oz/cwt of a non-chloride Type C accelerating admixture was also used. The water content from the admixture was subtracted from the mixing water. Two concrete cylinders (4 in. x 8 in.) were tested in compression at equivalent ages of 1, 2, 4, 7, 14, 28 days and temperature was monitored in one additional cylinder. As noted in the mortar mixtures the concrete mixtures containing fly ash FAA required a higher Type F admixture dosage as compared to the concrete mixtures containing fly ash FAC. But the admixture dosages were not excessive (<10 oz/cwt. as compared to 20 to 32 oz/cwt for corresponding mortar mixtures). The two concrete mixtures with high alkali cement had higher strengths compared to the two mixtures with the low alkali cement at all ages except at 1 day. The 1 day strength of the 0.34FAC50HAC mixture was 161 psi indicating severe retardation of that mixture. For both cement types the concrete mixtures containing the high CaO fly ash showed higher strengths at all ages except at 1 day. Figure 16a-d illustrates the strength vs. equivalent age at 73°F for the four concrete mixtures with the hyperbolic curve fit (indicated as best-fit within the figure). The equivalent age was calculated by the Arrhenius equation with the selected AE value obtained from the mortar study. The R2 values were higher than 0.95. The best fit equations for the 4 mixtures are provided below: 0.34FAA50LAC: 6774 . .
. .
0.34FAC50LAC: 9608 . .
. .

0.34FAA50HAC: 9125 . . . .
0.34FAC50HAC: 10423 . .
. .
Where t = equivalent age at 73.4°F (23°C). The above best fit equations can be used predicting in-place compressive strengths using maturity if the corresponding mixtures are used. A temperature sensor is recorded inside the structure. The time, and temperature data recorded is converted to equivalent at 73.4°F using the AE for that mixture. Using the above concrete Strength-Maturity equation the strength is predicted. Acknowledgements The authors would like to extend their sincere thanks to Mr. Soliman Ben-Barka and Mr. Stuart Sherman who conducted the test program at the NRMCA Research Laboratory and Mr. Colin L. Lobo, Ph.D., P.E. for his review of this report. The authors would like to thank WR Grace, Boral Materials Technologies Inc., and Separation Technologies LLC for the materials provided. Funding for the study was provided by the Federal Highway Administration through a research consortium led by Purdue University.

References
1. US Slag Cement Shipments, Slag Cement Association, http://www.slagcement.org/News/Shipments.html
2. ACAA Coal Combustion Product (CCP) Production & Use Survey Report, American Coal Ash Association, http://www.acaa-usa.org/
3. Cement Statistics and Information, US Geological Survey, http://minerals.usgs.gov/minerals/pubs/commodity/cement/
4. Sivasundaram, V., Carette, G. G., and Malhotra, V. M., “Properties of Concrete Incorporating Low Quantity of Cement and High Volumes of Low-Calcium Fly Ash,” Fly Ash, Silica Fume, Slag, and Natural Pozzolans in Concrete—Proceedings, Third International Conference, SP-114, V. M. Malhotra, ed., American Concrete Institute, Farmington Hills, MI, 1989, pp. 45-71.
5. Naik, T. R., and Singh, S. S., “Superplasticized Structural Concrete Containing High Volumes of Class C Fly Ash,” ASCE Journal of Energy Engineering, V. 117, No. 2, Aug. 1991, pp. 87-95.
6. Obla, Karthik, Hill, Russell, and Martin Ross, “HVFA Concrete – An Industry Perspective”, Concrete International, Vol. 25, No. 8, 2003, pp. 49-54.
7. Obla K., Upadhyaya S., Goulias D., Schindler A.K., and Carino N., “New Technology Based Approach to Advance Higher Volume Fly ash Concrete with Acceptable Performance,” Final Report, August 2008, http://www.nrmca.org/research_engineering/Lab.htm
8. ASTM C39, C138, C143, C231, C494, C1064, C1074, Annual Book of ASTM Standards, Vol. 4.02, Concrete and Aggregates, ASTM International, www.astm.org.
9. ASTM C109, C185, C1437, Annual Book of ASTM Standards, Vol. 4.01, Cement; Lime; and Gypsum, ASTM International, www.astm.org.

Table 1a Fly Ash and Slag Cement Use in Ready Mixed Concrete (RMC)
Year RMC Volume PC FA FA SL FA+SL PC FA SL
(Million
yd3) (Million
tons) (Million
tons) (%) (Million tons) (%) (lb/yd3) (lb/yd3) (lb/yd3)
2001 406.1 91.4 11.0 10.5 2.6 13.1 450 54 13 2003 404.3 91.0 11.1 10.6 3.3 13.8 450 55 17 2005 458.3 103.1 13.5 11.3 3.9 14.5 450 59 17 2006 456.8 102.8 13.7 11.4 4.0 14.8 450 60 18 2007 414.6 93.3 12.4 11.4 3.7 14.8 450 60 18 2008 351.7 79.1 11.4 12.2 3.3 15.8 450 65 19
Note. PC= Portland cement, FA= Fly ash, SL = Slag cement Assumptions: 75% of all cement (including blended cement) is used in RMC - blended cement is 2.5% of total cement consumption (USGS) and assumed to contain 30% SCM on average Fly ash use is derived from ACAA survey. Ready mixed concrete is assumed to consume 88% of the value reported under Concrete/Concrete Products /Grout of the ACAA survey and 10% of the value reported under Blended Cement/ Raw Feed for Clinker of the ACAA survey Slag use is determined from the Slag Cement Association use reports

Table 1b Percentile Breakdown, Average, Minimum, and Maximum Amounts of Concrete Production, Fly ash and SCM Use Survey Participants 20%ile 50%ile 80%ile Average Min Max Annual Concrete Volume, yd3 58,547 197,535 733,356 610,400 13,000 5,216,519 Annual fly ash used, lb/yd3 39 75 100 83 0 170 Annual SCM used, lb/yd3 62 94 144 102 28 198 Annual fly ash used, % 7 13 18 15 0 27 Annual SCM used, % 12 17 24 18 3 33 Table 1c Average Portland Cement, fly ash, SCM usage based on Company Production Levels
<250,000 yd3 250 to 1 Million yd3 >1 Million yd3 All Annual portland cement used, lb/yd3 451 466 454 457 Annual fly ash used, lb/yd3 62 86 85 83 Annual SCM used, lb/yd3 106 99 104 102 Table 1d Analysis of Company Responses of Causes Preventing Increased Use of Fly ash
Causes Avg. Rating Strongly Agree Agree Neutral
Fly ash supply - not available or inconsistent 4.6 14% 18% 68% Fly ash properties are variable 3.9 18% 38% 45% Use other SCMs (slag, etc) 4.6 16% 20% 64% Concrete performance issues - setting time, strength gain, etc 2.5 52% 36% 13%
Specifications restrict use 2.5 57% 29% 14% Customers object to use 2.9 38% 48% 14%

Table 2 Chemical and Physical Characteristics of Portland Cements and Fly ashes Item Cement A Cement B Cement C FA-A FA-B FA-C
NRMCA Sample ID 143 078 067 FAA FAB FAC
Silicon oxide (SiO2), % 20.59 19.49 19.34 60.5 53.38 38.71
Aluminum oxide (Al2O3), % 4.76 4.93 5.95 29.1 19.05 19.15
Iron oxide (Fe2O3), % 1.96 3.74 1.94 2.9 4.8 6.49
Sum of SiO2, Al2O3, Fe2O3, % 92.5 77.23 64.35
Calcium oxide (CaO), % 63.77 64.24 62.3 0.7 15.09 23.51
Magnesium oxide (MgO), % 2.68 1.04 2.93 - 3.09 5.29
Sulfur trioxide (SO3), % 3 3.18 3.89 0 0.63 1.36
Sodium Oxide (Na2O), % 0.13 0.19 0.24 0.12 0.65 1.64
Potassium Oxide (K2O), % 0.25 0.36 1.06 0.64 1.03 0.58
Loss of Ignition, % 2.61 2.34 1.46 1.3 0.28 0.3
Fineness 45�m sieve, % retained - - - 27.2 27.23 12.3
Blaine (Specific Surface) m2/kg 379 388 369 - - -
Relative Density 3.15 3.15 3.15 2.14 2.47 2.63 Strength Activity Index with Portland Cement at 7 days, % Control
- - - 80.4 84.6 84
Strength Activity Index with Portland Cement at 28 days, % Control
- - - 88.5 102.7 -
Water Requirement, % Control - - - 100.4 93.8 93
Autoclave Expansion % - - - -0.06 -0.01 0.03
Total Alkali (as Na2O eq), % 0.29 0.42 0.94 0.54 1.33 2.02
Available Alkali (as Na2O), % - - - 0.50 0.61 -
Tricalcium Silicate (C3S), % 60 66 53 - - -
Dicalcium silicate (C2S), % 14 6 16 - - -
Tricalcium Aluminate (C3A), % 9 7 12 - - - Tetracalcium Aluminoferrite (C4AF), % 6 11 6 - - -
FAA = Sample Source: Brandon shore, MD; FAB = Sample Source: Big Brown, TX (from Boral); FAC = Sample Source: Muskogee (from Lafarge through Purdue). Cement A, B, and C were supplied by W.R. Grace
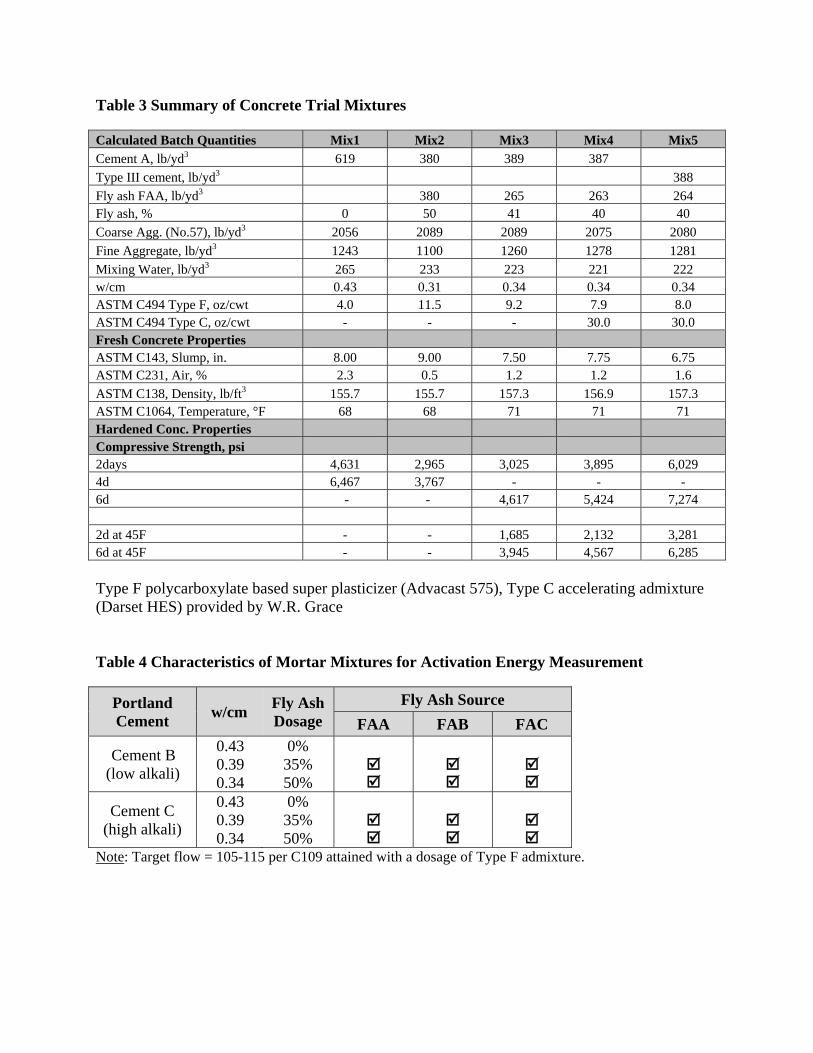
Table 3 Summary of Concrete Trial Mixtures
Calculated Batch Quantities Mix1 Mix2 Mix3 Mix4 Mix5 Cement A, lb/yd3 619 380 389 387 Type III cement, lb/yd3 388 Fly ash FAA, lb/yd3 380 265 263 264 Fly ash, % 0 50 41 40 40 Coarse Agg. (No.57), lb/yd3 2056 2089 2089 2075 2080 Fine Aggregate, lb/yd3 1243 1100 1260 1278 1281 Mixing Water, lb/yd3 265 233 223 221 222 w/cm 0.43 0.31 0.34 0.34 0.34 ASTM C494 Type F, oz/cwt 4.0 11.5 9.2 7.9 8.0 ASTM C494 Type C, oz/cwt - - - 30.0 30.0 Fresh Concrete Properties ASTM C143, Slump, in. 8.00 9.00 7.50 7.75 6.75 ASTM C231, Air, % 2.3 0.5 1.2 1.2 1.6 ASTM C138, Density, lb/ft3 155.7 155.7 157.3 156.9 157.3 ASTM C1064, Temperature, °F 68 68 71 71 71 Hardened Conc. Properties Compressive Strength, psi 2days 4,631 2,965 3,025 3,895 6,029 4d 6,467 3,767 - - - 6d - - 4,617 5,424 7,274
2d at 45F - - 1,685 2,132 3,281 6d at 45F - - 3,945 4,567 6,285
Type F polycarboxylate based super plasticizer (Advacast 575), Type C accelerating admixture (Darset HES) provided by W.R. Grace
Table 4 Characteristics of Mortar Mixtures for Activation Energy Measurement
Portland Cement w/cm Fly Ash
Dosage Fly Ash Source
FAA FAB FAC
Cement B (low alkali)
0.43 0.39 0.34
0% 35% 50%
Cement C (high alkali)
0.43 0.39 0.34
0% 35% 50%
Note: Target flow = 105-115 per C109 attained with a dosage of Type F admixture.

Table 5a Summary of Mortar Test Result @ Control-73ºF (Low alkali cement) Batch Quantities Mix1 Mix2 Mix3 Mix4 Mix5 Mix6 Mix7 Mix1R Mix5R
0.43PC 0.39FAA35 0.39FAB35 0.39FAC35 0.34FAA50 0.34FAB50 0.34FAC50 0.43PC-R 0.34FAA50-R
Cement B, lb/yd3 620 454 444 439 384 373 368 620 384
Fly ash, lb/yd3 0 166 187 198 261 292 307 0 261
Fly ash, % by Mass 0 26.8 29.6 31.1 40.5 43.9 45.5 0 40.5
Fly ash, % by Vol. 0 35 35 35 50 50 50 0 50
Fine Aggregate, lb/yd3 2060 2060 2060 2060 2060 2060 2060 2060 2060
Mixing Water, lb/yd3 266 242 246 248 219 226 229 266 219
w/cm 0.43 0.39 0.39 0.39 0.34 0.34 0.34 0.43 0.34
ASTM C494 Type F, oz/cwt 4.0 5.8 4.9 2.7 18.0 4.0 2.6 4.0 18.0
ASTM C494 Type C, oz/cwt - - - - 30.0 30.0 30.0 - 30.0
Fresh Mortar Properties
ASTM C1437, Flow, % 114 105 112 106 112 106 112 107 107
ASTM C185, Density, lb/ft3 138.2 137.1 134.6 136.3 137.2 133.5 138.1 138 139.5
ASTM C185, Air, % 7.7 8.6 10.8 7.3 6.4 9.8 7.1 6.1 4.9
Note: FAA, FAB, FAC are different fly ash sources Table 5b Summary of Mortar Test Result @ Hot-100ºF (Low alkali cement) Batch Quantities Mix8 Mix9 Mix10 Mix11 Mix12 Mix13 Mix14
0.43PC 0.39FAA35 0.39FAB35 0.39FAC35 0.34FAA50 0.34FAB50 0.34FAC50
Cement B, lb/yd3 620 454 444 439 384 373 368
Fly ash, lb/yd3 0 166 187 198 261 292 307
Fly ash, % by Mass 0 26.8 29.6 31.1 40.5 43.9 45.5
Fly ash, % by Vol. 0 35 35 35 50 50 50
Fine Aggregate, lb/yd3 2060 2060 2060 2060 2060 2060 2060
Mixing Water, lb/yd3 266 242 246 248 219 226 229
w/cm 0.43 0.39 0.39 0.39 0.34 0.34 0.34
ASTM C494 Type F, oz/cwt 4.0 9.6 4.0 2.7 19.8 4.0 2.6
ASTM C494 Type C, oz/cwt - - - - 30.0 30.0 30.0
Fresh Mortar Properties
ASTM C1437, Flow, % 108 107 109 114 106 105 115
ASTM C185, Density, lb/ft3 137.2 136.7 134.9 137.9 139 134.5 139.2
ASTM C185, Air, % 6.7 8.9 10.6 6.2 5.2 9.1 6.3
Note: FAA, FAB, FAC are different fly ash sources
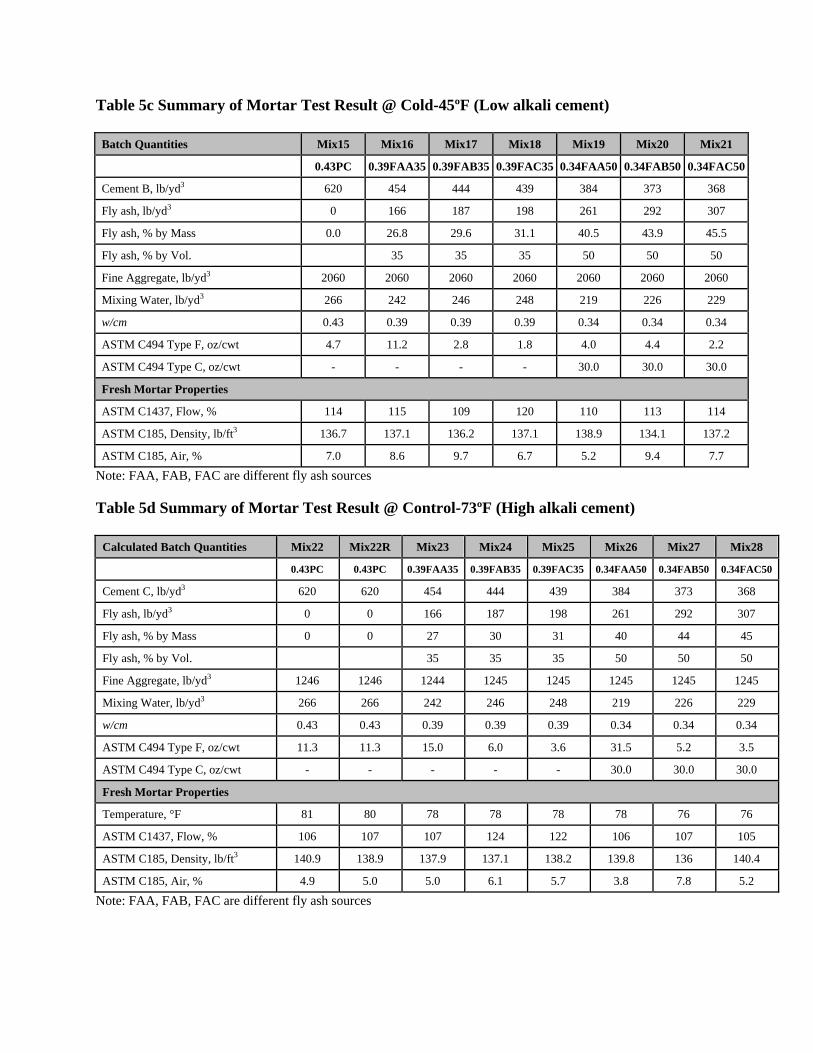
Table 5c Summary of Mortar Test Result @ Cold-45ºF (Low alkali cement) Batch Quantities Mix15 Mix16 Mix17 Mix18 Mix19 Mix20 Mix21
0.43PC 0.39FAA35 0.39FAB35 0.39FAC35 0.34FAA50 0.34FAB50 0.34FAC50
Cement B, lb/yd3 620 454 444 439 384 373 368
Fly ash, lb/yd3 0 166 187 198 261 292 307
Fly ash, % by Mass 0.0 26.8 29.6 31.1 40.5 43.9 45.5
Fly ash, % by Vol. 35 35 35 50 50 50
Fine Aggregate, lb/yd3 2060 2060 2060 2060 2060 2060 2060
Mixing Water, lb/yd3 266 242 246 248 219 226 229
w/cm 0.43 0.39 0.39 0.39 0.34 0.34 0.34
ASTM C494 Type F, oz/cwt 4.7 11.2 2.8 1.8 4.0 4.4 2.2
ASTM C494 Type C, oz/cwt - - - - 30.0 30.0 30.0
Fresh Mortar Properties
ASTM C1437, Flow, % 114 115 109 120 110 113 114
ASTM C185, Density, lb/ft3 136.7 137.1 136.2 137.1 138.9 134.1 137.2
ASTM C185, Air, % 7.0 8.6 9.7 6.7 5.2 9.4 7.7
Note: FAA, FAB, FAC are different fly ash sources
Table 5d Summary of Mortar Test Result @ Control-73ºF (High alkali cement)
Calculated Batch Quantities Mix22 Mix22R Mix23 Mix24 Mix25 Mix26 Mix27 Mix28
0.43PC 0.43PC 0.39FAA35 0.39FAB35 0.39FAC35 0.34FAA50 0.34FAB50 0.34FAC50
Cement C, lb/yd3 620 620 454 444 439 384 373 368
Fly ash, lb/yd3 0 0 166 187 198 261 292 307
Fly ash, % by Mass 0 0 27 30 31 40 44 45
Fly ash, % by Vol. 35 35 35 50 50 50
Fine Aggregate, lb/yd3 1246 1246 1244 1245 1245 1245 1245 1245
Mixing Water, lb/yd3 266 266 242 246 248 219 226 229
w/cm 0.43 0.43 0.39 0.39 0.39 0.34 0.34 0.34
ASTM C494 Type F, oz/cwt 11.3 11.3 15.0 6.0 3.6 31.5 5.2 3.5
ASTM C494 Type C, oz/cwt - - - - - 30.0 30.0 30.0
Fresh Mortar Properties
Temperature, °F 81 80 78 78 78 78 76 76
ASTM C1437, Flow, % 106 107 107 124 122 106 107 105
ASTM C185, Density, lb/ft3 140.9 138.9 137.9 137.1 138.2 139.8 136 140.4
ASTM C185, Air, % 4.9 5.0 5.0 6.1 5.7 3.8 7.8 5.2
Note: FAA, FAB, FAC are different fly ash sources

Table 5e Summary of Mortar Test Result @ Hot-100ºF (High alkali cement)
Calculated Batch Quantities Mix29 Mix30 Mix31 Mix32 Mix33 Mix34 Mix35
0.43PC 0.39FAA35 0.39FAB35 0.39FAC35 0.34FAA50 0.34FAB50 0.34FAC50
Cement C, lb/yd3 620 454 444 439 384 373 368
Fly ash, lb/yd3 166 187 198 261 292 307
Fly ash, % by Mass 0.0 26.8 29.6 31.1 40.5 43.9 45.5
Fly ash, % by Vol. 35 35 35 50 50 50
Fine Aggregate, lb/yd3 1246 1245 1245 1245 1245 1245 1245
Mixing Water, lb/yd3 266 242 246 248 219 226 229
w/cm 0.43 0.39 0.39 0.39 0.34 0.34 0.34
ASTM C494 Type F, oz/cwt 4.0 16.1 4.0 2.8 45.3 4.0 6.0
ASTM C494 Type C, oz/cwt - - - - 30.0 30.0 30.0
Fresh Mortar Properties
Temperature, °F 98 97 94 97 87 95 93
ASTM C1437, Flow, % 107 107 119 114 105 106 117
ASTM C185, Density, lb/ft3 139.4 139.1 137.8 140 139.1 139.4 140.4
ASTM C185, Air, % 4.9 4.1 5.7 4.4 4.3 5.4 5.2
Note: FAA, FAB, FAC are different fly ash sources Table 5f Summary of Mortar Test Result @ Cold-45ºF (High alkali cement)
Calculated Batch Quantities Mix36 Mix37 Mix38 Mix39 Mix40 Mix41 Mix42
0.43PC 0.39FAA35 0.39FAB35 0.39FAC35 0.34FAA50 0.34FAB50 0.34FAC50
Cement C, lb/yd3 620 454 444 439 384 373 368
Fly ash, lb/yd3 166 187 198 261 292 307
Fly ash, % by Mass 0.0 26.8 29.6 31.1 40.5 43.9 45.5
Fly ash, % by Vol. 35 35 35 50 50 50
Fine Aggregate, lb/yd3 1246 1245 1245 1245 1245 1245 1245
Mixing Water, lb/yd3 266 242 246 248 219 226 229
w/cm 0.43 0.39 0.39 0.39 0.34 0.34 0.34
ASTM C494 Type F, oz/cwt 6.7 11.5 8.3 1.9 28.8 4.4 2.2
ASTM C494 Type C, oz/cwt - - - - 30.0 30.0 30.0
Fresh Mortar Properties
Temperature, °F 67 63 66 64 72 67 64
ASTM C1437, Flow, % 106 105 105 122 108 112 114
ASTM C185, Density, lb/ft3 137.8 138 133.9 135.7 137.5 132.7 136.6
ASTM C185, Air, % 5.9 7.5 8.3 7.4 5.8 10.0 7.8
Note: FAA, FAB, FAC are different fly ash sources
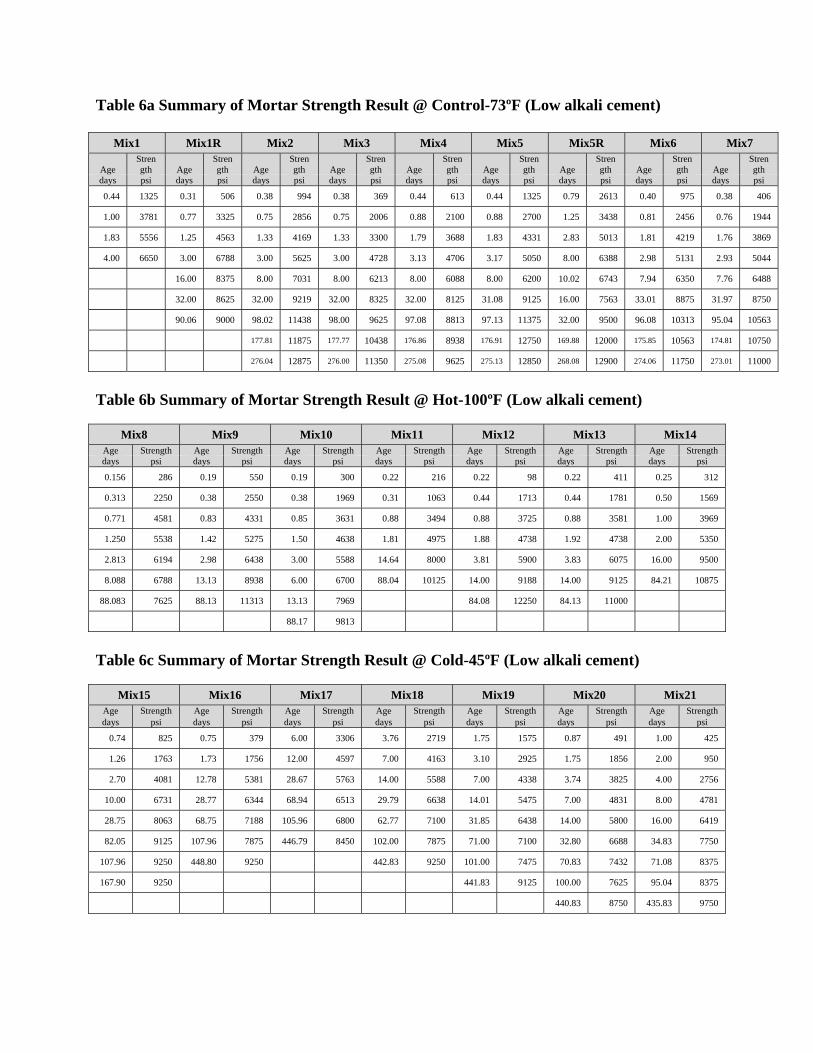
Table 6a Summary of Mortar Strength Result @ Control-73ºF (Low alkali cement)
Mix1 Mix1R Mix2 Mix3 Mix4 Mix5 Mix5R Mix6 Mix7
Age Strength Age
Strength Age
Strength Age
Strength Age
Strength Age
Strength Age
Strength Age
Strength Age
Strength
days psi days psi days psi days psi days psi days psi days psi days psi days psi
0.44 1325 0.31 506 0.38 994 0.38 369 0.44 613 0.44 1325 0.79 2613 0.40 975 0.38 406
1.00 3781 0.77 3325 0.75 2856 0.75 2006 0.88 2100 0.88 2700 1.25 3438 0.81 2456 0.76 1944
1.83 5556 1.25 4563 1.33 4169 1.33 3300 1.79 3688 1.83 4331 2.83 5013 1.81 4219 1.76 3869
4.00 6650 3.00 6788 3.00 5625 3.00 4728 3.13 4706 3.17 5050 8.00 6388 2.98 5131 2.93 5044
16.00 8375 8.00 7031 8.00 6213 8.00 6088 8.00 6200 10.02 6743 7.94 6350 7.76 6488
32.00 8625 32.00 9219 32.00 8325 32.00 8125 31.08 9125 16.00 7563 33.01 8875 31.97 8750
90.06 9000 98.02 11438 98.00 9625 97.08 8813 97.13 11375 32.00 9500 96.08 10313 95.04 10563
177.81 11875 177.77 10438 176.86 8938 176.91 12750 169.88 12000 175.85 10563 174.81 10750
276.04 12875 276.00 11350 275.08 9625 275.13 12850 268.08 12900 274.06 11750 273.01 11000
Table 6b Summary of Mortar Strength Result @ Hot-100ºF (Low alkali cement)
Mix8 Mix9 Mix10 Mix11 Mix12 Mix13 Mix14 Age Strength Age Strength Age Strength Age Strength Age Strength Age Strength Age Strength days psi days psi days psi days psi days psi days psi days psi
0.156 286 0.19 550 0.19 300 0.22 216 0.22 98 0.22 411 0.25 312
0.313 2250 0.38 2550 0.38 1969 0.31 1063 0.44 1713 0.44 1781 0.50 1569
0.771 4581 0.83 4331 0.85 3631 0.88 3494 0.88 3725 0.88 3581 1.00 3969
1.250 5538 1.42 5275 1.50 4638 1.81 4975 1.88 4738 1.92 4738 2.00 5350
2.813 6194 2.98 6438 3.00 5588 14.64 8000 3.81 5900 3.83 6075 16.00 9500
8.088 6788 13.13 8938 6.00 6700 88.04 10125 14.00 9188 14.00 9125 84.21 10875
88.083 7625 88.13 11313 13.13 7969 84.08 12250 84.13 11000
88.17 9813
Table 6c Summary of Mortar Strength Result @ Cold-45ºF (Low alkali cement)
Mix15 Mix16 Mix17 Mix18 Mix19 Mix20 Mix21 Age Strength Age Strength Age Strength Age Strength Age Strength Age Strength Age Strength days psi days psi days psi days psi days psi days psi days psi
0.74 825 0.75 379 6.00 3306 3.76 2719 1.75 1575 0.87 491 1.00 425
1.26 1763 1.73 1756 12.00 4597 7.00 4163 3.10 2925 1.75 1856 2.00 950
2.70 4081 12.78 5381 28.67 5763 14.00 5588 7.00 4338 3.74 3825 4.00 2756
10.00 6731 28.77 6344 68.94 6513 29.79 6638 14.01 5475 7.00 4831 8.00 4781
28.75 8063 68.75 7188 105.96 6800 62.77 7100 31.85 6438 14.00 5800 16.00 6419
82.05 9125 107.96 7875 446.79 8450 102.00 7875 71.00 7100 32.80 6688 34.83 7750
107.96 9250 448.80 9250 442.83 9250 101.00 7475 70.83 7432 71.08 8375
167.90 9250 441.83 9125 100.00 7625 95.04 8375
440.83 8750 435.83 9750

Table 6d Summary of Mortar Strength Result @ Control-73ºF (High alkali cement)
Mix22 Mix22R Mix23 Mix24 Mix25 Mix26 Mix27 Mix28 Age Strength Age Strength Age Strength Age Strength Age Strength Age Strength Age Strength Age Strengthdays psi days psi days psi days psi days psi days psi days psi days psi
1.0 5259 0.55 1413 0.55 1206 0.55 1150 0.55 419 0.55 400 0.55 1056 0.57 269
2.0 6063 0.95 4500 0.95 3294 1.03 3300 1.01 2133 0.95 2631 0.95 2638 0.95 1425
4.0 6750 3.00 6188 3.00 4750 3.00 5063 3.04 4375 4.15 5069 4.17 5125 4.21 5325
8.0 7613 8.00 7344 8.02 6663 8.03 6222 8.00 6106 8.00 5944 8.01 6388 8.04 6150
22.2 8250 16.00 7438 16.00 7338 16.00 6969 16.00 7031 15.97 6925 15.98 7475 16.00 6431
31.9 8313 40.04 8250 40.01 8688 40.10 8125 40.07 7813 34.01 8438 34.03 8500 34.07 7438
223.6 9650 204.21 9500 106.09 9750 106.07 8813 100.05 8500
204.24 9400
Table 6e Summary of Mortar Strength Result @ Hot-100ºF (High alkali cement)
Mix29 Mix30 Mix31 Mix32 Mix33 Mix34 Mix35 Age Strength Age Strength Age Strength Age Strength Age Strength Age Strength Age Strength days psi days psi days psi days psi days psi days psi days psi
0.33 1335 0.38 1556 0.30 1156 1.08 2968 0.96 3006 0.50 2106 0.31 474
0.75 5088 0.93 3863 0.98 3781 1.25 4350 1.25 3588 1.00 3794 0.50 1631
3.00 6444 3.00 5306 2.00 4575 2.27 5050 2.29 4719 2.00 4950 1.25 4281
5.96 6906 5.99 6100 4.13 5313 5.02 6231 5.14 6044 4.98 6706 2.26 6038
12.22 7156 13.18 8125 8.13 6413 11.26 7360 10.06 8813 8.01 8000 5.08 7500
93.02 8375 27.06 8250 20.19 8375 20.04 9750 15.96 9250 10.03 8688
93.11 8875 92.10 9563 92.08 10750 72.09 10188
Table 6f Summary of Mortar Strength Result @ Cold-45ºF (High alkali cement)
Mix36 Mix37 Mix38 Mix39 Mix40 Mix41 Mix42 Age Strength Age Strength Age Strength Age Strength Age Strength Age Strength Age Strength days psi days psi days psi days psi days psi days psi days psi
1.73 2069 1.77 1513 2.00 1575 2.19 1169 1.75 869 1.85 1363 2.01 875
2.99 4281 3.06 3275 4.00 3225 5.02 2950 3.02 2038 3.74 3238 3.99 2713
5.00 6038 6.90 5000 8.00 4856 8.90 4025 7.01 3944 7.50 4944 7.99 4725
11.06 7390 13.00 6363 17.06 5738 17.06 4674 13.98 4669 15.06 5319 16.03 5194
28.79 8000 29.84 6738 33.06 6438 62.15 6063 31.91 5144 32.18 6050 33.81 6288
82.05 9375 68.79 7188 68.94 7313 397.80 7500 71.04 6181 71.01 6506
390.80 10375 398.80 8125 396.80 8000 392.80 8250 391.80 8000

Table 7a Strength vs Age Curve Fit Parameters for Low Alkali Cement Mixtures based on ASTM C1074
Mixture ID Curing Condition
t0 (hr)
Su (psi)
k (hr-1)
R2 – Hyperbolic*
R2 – Log age+
0.43PC Hot-97F 3.4 7,361 2.533 1.00 0.79 Control-76F 6.2 8,953 1.097 1.00 0.89
Cold-40F 9.5 9,390 0.290 1.00 0.96 0.39FAA35 Hot-98F 0.0 10,781 0.636 0.97 0.98
Control-76F 0.0 11,797 0.282 0.96 0.99 Cold-41F 0.0 8,775 0.107 0.98 0.98 0.39FAB35 Hot-97F 0.1 9,391 0.569 0.97 0.98
Control-75F 0.0 10,440 0.242 0.97 0.99 Cold-41F 0.0 7,872 0.107 0.94 0.98 0.39FAC35 Hot-97F 3.5 9,667 0.659 0.98 0.98
Control-75F 1.9 9,172 0.327 0.99 0.96 Cold-41F 0.0 8,750 0.117 0.97 0.96 0.34FAA50 Hot-98F 0.0 12,115 0.310 0.97 0.99
Control-76F 0.0 12,258 0.194 0.95 1.00 Cold-45F 0.0 8,342 0.141 0.97 0.98 0.34FAB50 Hot-97F 0.0 11,038 0.388 0.99 0.99
Control-75F 0.0 10,785 0.273 0.97 0.99 Cold-45F 11.0 8,121 0.220 0.98 0.95 0.34FAC50 Hot-98F 4.6 10,826 0.592 1.00 0.97
Control-75F 0.0 10,759 0.254 0.98 0.98 Cold-43F 19.6 9,496 0.130 0.99 0.95 * Coefficient of Determination for Hyperbolic strength age function + Coefficient of Determination for Strength log-age function Table 7b Activation Energies Determined for Low Alkali Cement Mixtures based on ASTM C1074
Mixture ID R2 Activation Energy (J/mol) Age Conversion Factor 41°F 59°F 73°F 95°C 113°C
0.43PC 1.00 48,837 0.28 0.58 1.00 2.17 3.95 0.39FAA35 0.99 40,273 0.35 0.63 1.00 1.89 3.10 0.39FAB35 0.98 37,421 0.37 0.66 1.00 1.81 2.86 0.39FAC35 1.00 39,760 0.35 0.64 1.00 1.88 3.06 0.34FAA50 0.95 18,847 0.61 0.81 1.00 1.35 1.70 0.34FAB50 0.94 13,685 0.70 0.86 1.00 1.24 1.47 0.34FAC50 0.96 34,835 0.40 0.67 1.00 1.74 2.66

Table 8a Strength vs Age Curve Fit Parameters for Low Alkali Cement Mixtures based on modified ASTM C1074 approach
Mixture ID Curing Condition
t0 (hr)
Su (psi)
k (hr-1)
R2 – Hyperbolic*
R2 – Log age+
0.43PC Hot-97F 3.2 8,500 1.802 1.00 1.00 Control-76F 6.4 8,500 1.263 1.00 1.00
Cold-40F 12.2 8,500 0.399 1.00 0.99 0.39FAA35 Hot-98F 2.8 9,000 1.241 0.98 0.99
Control-76F 3.7 9,000 0.681 0.98 0.99 Cold-41F 4.3 9,000 0.124 0.99 1.00 0.39FAB35 Hot-97F 2.7 8,100 0.980 0.98 0.99
Control-75F 6.2 8,100 0.586 0.98 0.99 Cold-41F 0.0 8,100 0.105 0.96 0.99 0.39FAC35 Hot-97F 4.4 8,000 1.073 1.00 1.00
Control-75F 5.6 8,000 0.504 0.99 0.99 Cold-41F 15.1 8,000 0.167 1.00 0.99 0.34FAA50 Hot-98F 0.0 8,900 0.628 0.98 0.97
Control-76F 0.0 8,900 0.430 0.99 0.98 Cold-45F 0.0 8,900 0.123 0.97 0.99 0.34FAB50 Hot-97F 3.3 8,500 0.835 0.99 0.99
Control-75F 3.7 8,500 0.575 1.00 1.00 Cold-45F 10.9 8,500 0.205 0.99 0.99 0.34FAC50 Hot-98F 5.4 8,500 1.000 1.00 0.98
Control-75F 6.6 8,500 0.563 1.00 1.00 Cold-43F 20.9 8,500 0.161 1.00 0.95 * Coefficient of Determination for Hyperbolic strength age function + Coefficient of Determination for Strength log-age function Table 8b Activation Energies for Low Alkali Cement Mixtures based on modified ASTM C1074 approach
Mixture ID R2 Activation Energy (J/mol)
Age Conversion Factor 41°F 59°F 73°F 95°C 113°C
0.43PC 1.00 34,981 0.40 0.67 1.00 1.74 2.67 0.39FAA35 0.99 53,717 0.24 0.55 1.00 2.34 4.53 0.39FAB35 0.98 52,384 0.25 0.55 1.00 2.29 4.36 0.39FAC35 1.00 42,890 0.32 0.62 1.00 1.97 3.34 0.34FAA50 0.95 40,886 0.34 0.63 1.00 1.91 3.16 0.34FAB50 0.94 35,328 0.39 0.67 1.00 1.75 2.70 0.34FAC50 0.96 43,592 0.32 0.61 1.00 1.99 3.41

Table 9a Strength vs Age Curve Fit Parameters for High Alkali Cement Mixtures based on ASTM C1074
Mixture ID Curing Condition
t0 (hr)
Su (psi)
k (hr-1)
R2 – Hyperbolic*
R2 – Log age+
0.43PC Hot-97F 6.6 7,583 3.655 0.96 0.79 Control-76F 8.8 8,445 1.388 0.94 0.86
Cold-43F 20.2 9,964 0.336 0.97 0.89 0.39FAA35 Hot-96F 0.0 8,386 0.681 0.95 0.98
Control-76F 0.0 8,791 0.426 0.97 0.98 Cold-43F 18.4 8,125 0.259 0.98 0.85 0.39FAB35 Hot-97F 0.0 8,620 0.537 0.96 0.97
Control-75F 0.0 8,973 0.376 0.95 0.98 Cold-43F 13.2 7,858 0.189 0.99 0.90 0.39FAC35 Hot-97F 0.0 9,238 0.507 0.96 0.96
Control-75F 5.0 8,991 0.292 0.98 0.96 Cold-44F 24.8 6,443 0.200 0.99 0.96 0.34FAA50 Hot-98F 0.0 11,053 0.329 0.97 0.98
Control-76F 0.0 9,177 0.238 0.96 0.98 Cold-44F 11.0 7,216 0.140 0.96 0.94 0.34FAB50 Hot-97F 0.0 10,621 0.434 0.98 0.97
Control-75F 0.0 9,056 0.324 0.99 0.99 Cold-44F 16.4 7,353 0.228 0.93 0.91 0.34FAC50 Hot-98F 5.5 10,167 0.677 1.00 0.93
Control-75F 11.3 8,131 0.427 0.98 0.94 Cold-43F 29.8 7,480 0.197 0.97 0.91 * Coefficient of Determination for Hyperbolic strength age function + Coefficient of Determination for Strength log-age function Table 9b Activation Energies Determined for High Alkali Cement Mixtures based on ASTM C1074
Mixture ID R2 Activation Energy (J/mol) Age Conversion Factor 41°F 59°F 73°F 95°C 113°C
0.43PC 1.00 56,945 0.22 0.53 1.00 2.46 4.96 0.39FAA35 0.98 23,213 0.54 0.77 1.00 1.44 1.92 0.39FAB35 1.00 25,167 0.52 0.75 1.00 1.49 2.03 0.39FAC35 0.95 21,991 0.56 0.78 1.00 1.42 1.86 0.34FAA50 1.00 20,457 0.58 0.79 1.00 1.38 1.78 0.34FAB50 1.00 15,294 0.67 0.84 1.00 1.27 1.54 0.34FAC50 1.00 29,127 0.46 0.72 1.00 1.59 2.27

Table 10a Strength vs Age Curve Fit Parameters for High Alkali Cement Mixtures based on modified ASTM C1074 approach
Mixture ID Curing Condition
t0 (hr)
Su (psi)
k (hr-1)
R2 – Hyperbolic*
R2 – Log age+
0.43PC Hot-97F 6.1 8,000 2.746 0.96 0.84 Control-76F 10.4 8,000 2.034 0.98 0.88
Cold-43F 31.3 8,000 0.780 1.00 0.96 0.39FAA35 Hot-96F 0.1 8,400 0.800 0.91 0.96
Control-76F 1.8 8,400 0.510 0.97 0.96 Cold-43F 20.6 8,400 0.260 1.00 0.99 0.39FAB35 Hot-97F 0.1 7,700 0.900 0.92 0.96
Control-75F 6.2 7,700 0.752 0.97 0.95 Cold-43F 18.2 7,700 0.215 0.99 0.98 0.39FAC35 Hot-97F 0.0 7,500 1.007 0.94 0.99
Control-75F 10.1 7,500 0.578 1.00 0.99 Cold-44F 10.9 7,500 0.124 0.96 0.98 0.34FAA50 Hot-98F 0.0 8,200 0.595 0.99 1.00
Control-76F 8.6 8,200 0.308 0.97 0.98 Cold-44F 0.0 8,200 0.093 0.88 0.94 0.34FAB50 Hot-97F 2.2 8,200 0.871 0.99 0.99
Control-75F 3.0 8,200 0.452 0.98 0.99 Cold-44F 13.2 8,200 0.180 0.94 0.94 0.34FAC50 Hot-98F 6.9 7,200 1.685 0.98 1.00
Control-75F 13.0 7,200 0.714 1.00 0.99 Cold-43F 33.9 7,200 0.238 0.98 0.95 * Coefficient of Determination for Hyperbolic strength age function + Coefficient of Determination for Strength log-age function Table 10b Activation Energies for High Alkali Cement Mixtures based on modified ASTM C1074 approach
Mixture ID R2 Activation Energy (J/mol)
Age Conversion Factor 41°F 59°F 73°F 95°C 113°C
0.43PC 0.98 30,897 0.44 0.71 1.00 1.63 2.38 0.39FAA35 1.00 27,395 0.49 0.73 1.00 1.54 2.16 0.39FAB35 0.93 35,635 0.39 0.67 1.00 1.76 2.72 0.39FAC35 0.98 51,982 0.25 0.56 1.00 2.28 4.31 0.34FAA50 1.00 44,695 0.31 0.60 1.00 2.03 3.51 0.34FAB50 1.00 37,781 0.37 0.65 1.00 1.82 2.89 0.34FAC50 1.00 45,843 0.30 0.60 1.00 2.07 3.63
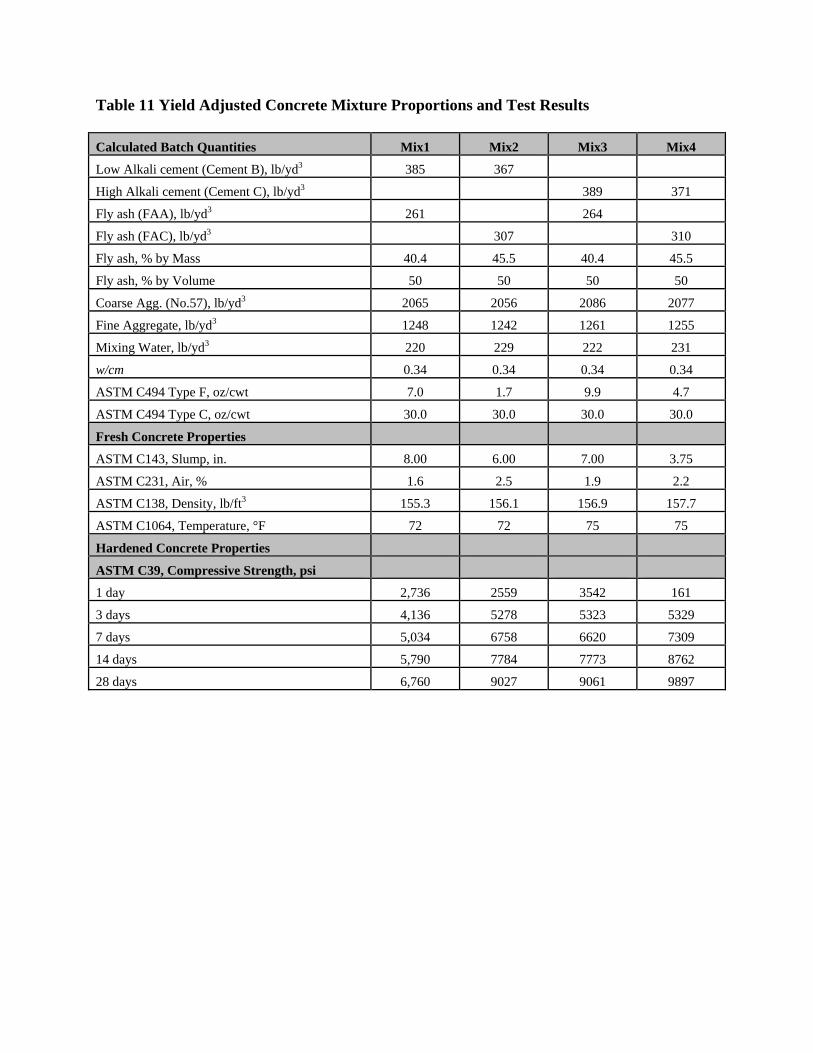
Table 11 Yield Adjusted Concrete Mixture Proportions and Test Results Calculated Batch Quantities Mix1 Mix2 Mix3 Mix4
Low Alkali cement (Cement B), lb/yd3 385 367
High Alkali cement (Cement C), lb/yd3 389 371
Fly ash (FAA), lb/yd3 261 264
Fly ash (FAC), lb/yd3 307 310
Fly ash, % by Mass 40.4 45.5 40.4 45.5
Fly ash, % by Volume 50 50 50 50
Coarse Agg. (No.57), lb/yd3 2065 2056 2086 2077
Fine Aggregate, lb/yd3 1248 1242 1261 1255
Mixing Water, lb/yd3 220 229 222 231
w/cm 0.34 0.34 0.34 0.34
ASTM C494 Type F, oz/cwt 7.0 1.7 9.9 4.7
ASTM C494 Type C, oz/cwt 30.0 30.0 30.0 30.0
Fresh Concrete Properties
ASTM C143, Slump, in. 8.00 6.00 7.00 3.75
ASTM C231, Air, % 1.6 2.5 1.9 2.2
ASTM C138, Density, lb/ft3 155.3 156.1 156.9 157.7
ASTM C1064, Temperature, °F 72 72 75 75
Hardened Concrete Properties
ASTM C39, Compressive Strength, psi
1 day 2,736 2559 3542 161
3 days 4,136 5278 5323 5329
7 days 5,034 6758 6620 7309
14 days 5,790 7784 7773 8762
28 days 6,760 9027 9061 9897

Figure 1. Percentile Distribution of SCM Used by Companies
0%
10%
20%
30%
40%
50%
60%
70%
80%
90%
100%
0% 5% 10% 15% 20% 25% 30% 35%
Percen
tile
% SCM used

(a)
(b)
Figure 2a-b. Compressive strength test results of the low alkali cement control mortar
mixture vs (a) 35% fly ash; (b) 50% fly ash All mixtures cured at Control-73°F
0
2000
4000
6000
8000
10000
12000
14000
0 2000 4000 6000 8000
Compressive
Stren
gth, psi
Time, hours
0.43PC
0.43PC‐R
0.39FAA35
0.39FAB35
0.39FAC35
0
2000
4000
6000
8000
10000
12000
14000
0 2000 4000 6000 8000
Compressive
Stren
gth, psi
Time, hours
0.43PC‐R
0.34FAA50
0.34FAB50
0.34FAC50

(a)
(b)
Figure 3a-b. Compressive strength test results of the low alkali cement control mortar
mixture vs (a) 35% fly ash; (b) 50% fly ash All mixtures cured at Hot-100°F
0
2000
4000
6000
8000
10000
12000
14000
0 500 1000 1500 2000 2500
Compressiv
e Strength, p
si
Time, hours
0.43PC
0.39FAA35
0.39FAB35
0.39FAC35
0
2000
4000
6000
8000
10000
12000
14000
0 500 1000 1500 2000 2500
Compressiv
e Strength, p
si
Time, hours
0.43PC
0.34FAA50
0.34FAB50
0.34FAC50

(a)
(b)
Figure 4a-b. Compressive strength test results of the low alkali cement control mortar
mixture vs (a) 35% fly ash; (b) 50% fly ash All mixtures cured at Cold-45°F

(a)
(b)
Figure 5a-b. Compressive strength test results of the high alkali cement control mortar
mixture vs (a) 35% fly ash; (b) 50% fly ash All mixtures cured at Control-73°F
0
2000
4000
6000
8000
10000
12000
14000
0 1000 2000 3000 4000 5000 6000
Compressive
Stren
gth, psi
Time, hours
0.43PC
0.43PC‐R
0.39FAA35
0.39FAB35
0.39FAC35
0
2000
4000
6000
8000
10000
12000
14000
0 1000 2000 3000 4000 5000 6000
Compressive
Stren
gth, psi
Time, hours
0.43PC‐R
0.34FAA50
0.34FAB50
0.34FAC50
(a)
(b)
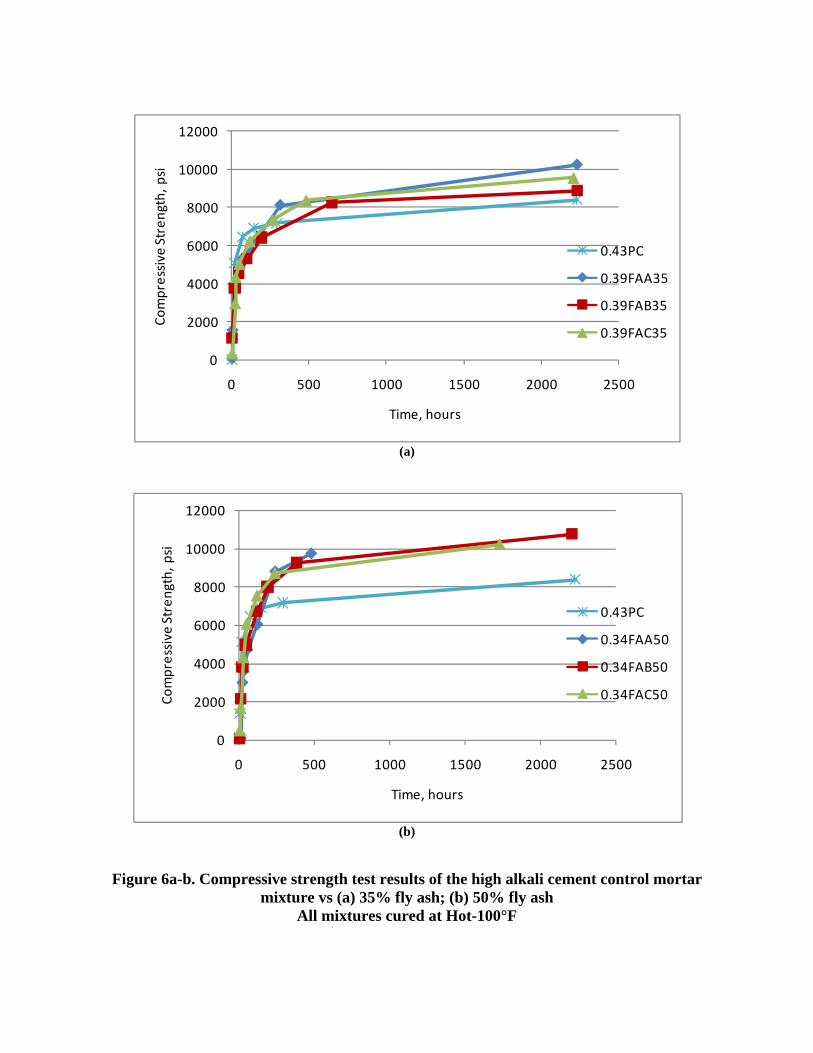
Figure 6a-b. Compressive strength test results of the high alkali cement control mortar mixture vs (a) 35% fly ash; (b) 50% fly ash
All mixtures cured at Hot-100°F
0
2000
4000
6000
8000
10000
12000
0 500 1000 1500 2000 2500
Compressive
Stren
gth, psi
Time, hours
0.43PC
0.39FAA35
0.39FAB35
0.39FAC35
0
2000
4000
6000
8000
10000
12000
0 500 1000 1500 2000 2500
Compressive
Stren
gth, psi
Time, hours
0.43PC
0.34FAA50
0.34FAB50
0.34FAC50

(a)
(b)
Figure 7a-b. Compressive strength test results of the high alkali cement control mortar
mixture vs (a) 35% fly ash; (b) 50% fly ash All mixtures cured at Cold-45°F

(a)
(b)
(c)
Figure 8. Strength-age plot (a), Plot to compute activation energy based on ASTM C1074 (b) and Strength-equivalent age plot (c) for Low Alkali Portland Cement B Mixture
y = -5874.1x + 19.898R² = 0.9982
-1.5
-1
-0.5
0
0.5
1
1.5
0.0032 0.0034 0.0036 0.0038
Ln (R
ate
Con
stan
t)
1/Temperature (1/K)
E, J/mol 48,837

(a) (b)
(c) (d)
(e) (f) Figure 9. Strength-equivalent age plot for Low Alkali Cement B Mixtures based on ASTM
C1074 (a) 0.39FAA35 (b) 0.39FAB35 (c) 0.39FAC35 (d) 0.39FAA50 (e) 0.39FAB50 (f) 0.39FAC50
(a)
(b)
(c)
Figure 10. Strength-age plot (a), Plot to compute activation energy based on modified ASTM C1074 (b) and Strength-equivalent age plot (c) for Low Alkali Portland Cement B
Mixture

(a) (b)
(c) (d)
(e) (f)
Figure 11. Strength-equivalent age plot for Low Alkali Cement B Mixtures based on modified ASTM C1074 (a) 0.39FAA35 (b) 0.39FAB35 (c) 0.39FAC35 (d) 0.39FAA50 (e)
0.39FAB50 (f) 0.39FAC50

(a)
(b)
(c)
Figure 12. Strength-age plot (a), Plot to compute activation energy based on ASTM C1074 (b) and Strength-equivalent age plot (c) for High Alkali Portland Cement Mixture

(a) (b)
(c) (d)
(e) (f) Figure 13. Strength-equivalent age plot for High Alkali Cement Mixtures based on ASTM
C1074 (a) 0.39FAA35 (b) 0.39FAB35 (c) 0.39FAC35 (d) 0.39FAA50 (e) 0.39FAB50 (f) 0.39FAC50

(a)
(b)
(c)
Figure 14. Strength-age plot (a), Plot to compute activation energy based on modified ASTM C1074 (b) and Strength-equivalent age plot (c) for High Alkali Portland Cement
Mixture

(a) (b)
(c) (d)
(e) (f) Figure 15. Strength-equivalent age plot for High Alkali Cement Mixtures based on modified ASTM C1074 (a) 0.39FAA35 (b) 0.39FAB35 (c) 0.39FAC35 (d) 0.39FAA50 (e) 0.39FAB50 (f) 0.39FAC50

(a) (b)
(c) (d)
Figure 16a-d. Compressive strength vs equivalent age plots for Concrete Mixtures (a) 0.34FAA50LAC; (b) 0.34FAC50LAC; (c) 0.34FAA50HAC; (d) 0.34FAC50HAC

Appendix A.1 Supplementary Cementitious Materials (SCM) Use Survey
As part of a funded research project on increased fly ash utilization in hydraulic cement concrete, NRMCA is tasked with conducting a survey to better understand SCM use. SCM can consist of fly ash meeting ASTMC618/AASHTO M295, slag cement meeting C989, and silica fume meeting C1240. Report portland cement conforming to ASTM C150/AASHTO M85; blended cement conforming to ASTM C595/AASHTO M240 or ASTM C1157. This survey should be completed by the concrete producer for calendar year 2011 (use 2010 data if 2011 is not available). This survey only pertains to SCM used in all concrete supplied by a ready mixed concrete producer. Do not include SCM use for non-concrete applications. You are requested to answer as many questions as possible without guessing. The data you report will be kept confidential and only the overall nationwide survey results will be shared with all survey participants and other researchers.
1 Name 2 Company/Division Name 3 Email id 4 Annual Concrete Volume (cyds) 5 Annual portland cement used (tons) 6 Annual blended cement used (tons) 7 Annual fly ash used (tons) 8 Annual slag cement used (tons) 9 Annual silica fume used (tons)
10 Breakdown percentage of concrete produced - All of it should add up to 100
10.1 Percent with portland cement only, % 10.2 Percent with blended cement only, % 10.3 Percent with fly ash, % 10.4 Percent with slag cement, % 10.5 Percent with silica fume, % 10.6 Percent with more than one SCM (ternary), %
The following questions pertain only to fly ash use
11 In your view what are the reasons why you don’t substantially increase the use of fly ash? Rank them from 1 to 6 in the order of importance with 1=most important
11.1 Fly ash supply - not available or inconsistent 11.2 Fly ash properties are variable 11.3 Use other SCMs (slag, etc) 11.4 Concrete performance issues - setting time, strength gain, etc 11.5 Specifications restrict use 11.6 Customers object to use 12 What opportunities exist to substantially increase use of fly ash? List one or more items below.
13 Comment - state any assumptions or details about reported data.
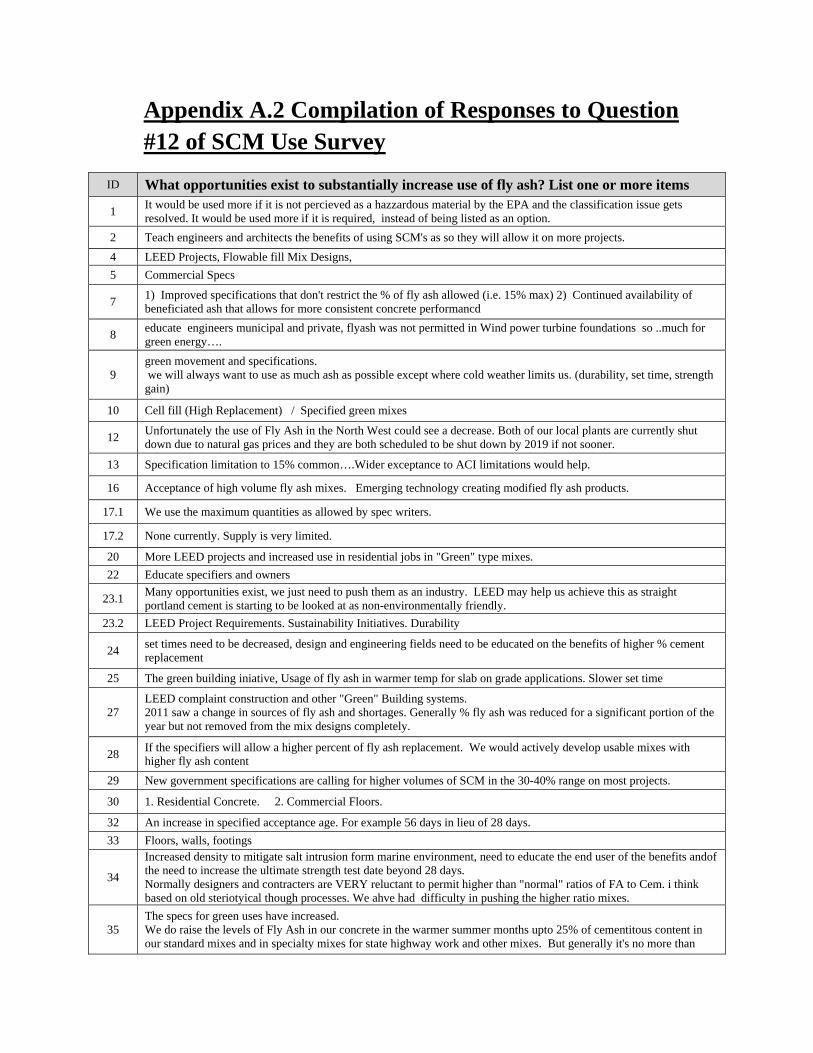
Appendix A.2 Compilation of Responses to Question #12 of SCM Use Survey
ID What opportunities exist to substantially increase use of fly ash? List one or more items
1 It would be used more if it is not percieved as a hazzardous material by the EPA and the classification issue gets resolved. It would be used more if it is required, instead of being listed as an option.
2 Teach engineers and architects the benefits of using SCM's as so they will allow it on more projects. 4 LEED Projects, Flowable fill Mix Designs, 5 Commercial Specs
7 1) Improved specifications that don't restrict the % of fly ash allowed (i.e. 15% max) 2) Continued availability of beneficiated ash that allows for more consistent concrete performancd
8 educate engineers municipal and private, flyash was not permitted in Wind power turbine foundations so ..much for green energy….
9 green movement and specifications. we will always want to use as much ash as possible except where cold weather limits us. (durability, set time, strength gain)
10 Cell fill (High Replacement) / Specified green mixes
12 Unfortunately the use of Fly Ash in the North West could see a decrease. Both of our local plants are currently shut down due to natural gas prices and they are both scheduled to be shut down by 2019 if not sooner.
13 Specification limitation to 15% common….Wider exceptance to ACI limitations would help.
16 Acceptance of high volume fly ash mixes. Emerging technology creating modified fly ash products.
17.1 We use the maximum quantities as allowed by spec writers.
17.2 None currently. Supply is very limited.
20 More LEED projects and increased use in residential jobs in "Green" type mixes. 22 Educate specifiers and owners
23.1 Many opportunities exist, we just need to push them as an industry. LEED may help us achieve this as straight portland cement is starting to be looked at as non-environmentally friendly.
23.2 LEED Project Requirements. Sustainability Initiatives. Durability
24 set times need to be decreased, design and engineering fields need to be educated on the benefits of higher % cement replacement
25 The green building iniative, Usage of fly ash in warmer temp for slab on grade applications. Slower set time
27 LEED complaint construction and other "Green" Building systems. 2011 saw a change in sources of fly ash and shortages. Generally % fly ash was reduced for a significant portion of the year but not removed from the mix designs completely.
28 If the specifiers will allow a higher percent of fly ash replacement. We would actively develop usable mixes with higher fly ash content
29 New government specifications are calling for higher volumes of SCM in the 30-40% range on most projects.
30 1. Residential Concrete. 2. Commercial Floors.
32 An increase in specified acceptance age. For example 56 days in lieu of 28 days. 33 Floors, walls, footings
34
Increased density to mitigate salt intrusion form marine environment, need to educate the end user of the benefits andof the need to increase the ultimate strength test date beyond 28 days. Normally designers and contracters are VERY reluctant to permit higher than "normal" ratios of FA to Cem. i think based on old steriotyical though processes. We ahve had difficulty in pushing the higher ratio mixes.
35 The specs for green uses have increased. We do raise the levels of Fly Ash in our concrete in the warmer summer months upto 25% of cementitous content in our standard mixes and in specialty mixes for state highway work and other mixes. But generally it's no more than

15%.
36 Educate contractors, specifiers and owners (including governmental agencies) on benefits of fly ash, dispel incorrect performance assumptions, and get specifications updated to allow for the use of more fly ash.
38 Set time with ash to be equal with all cement mixes
40 More focus on sustainability & green building. Designers yielding to the pressure of LEEDs-type projects.
41 infrastructure projects; flowable fill, CLSM, grouts ….
43 (1) Relax specification restrictions (2) Where feasible, have specifiers increase the strength acceptance age to 56 or 90 days for mixes with higher percentages of fly ash
44 Talk to more architects and engineers about the usage. Restricitive specs are the biggest reason to not include SCM.
45 Projects with severe ASR problems can utilize a higher quantity of some types of Fly Ash. As well as more backfill opportunities.
49 Reduction of concrete early strength, Reduction in Cost
50
Until there is a savings to use Fly Ash, it is going to be difficult to increase usage. Furthermore, supply has been getting tighter, and tighter, which has proven to be problematic when Fly Ash is specified in a project--we have actually had instances where supply has forced projects to be delayed until Fly Ash was available. Another issue, recently, has been with Fly Ash being on the news as part of the group of by-products the Federal EPA wants to classify as hazardous waste, customers are afraid to have Fly Ash mixes, particularly in residential applications, out of fear they will face future liability as a result.
51 Spec change is by far biggest for us. Education of specifiers and promotion of LEED?
52 New highranges designed to increase the strength efficiency of fly ash. Air entraining agents that provide a stable air content
54 Supply and consistant quality
55 The opportunities are changing gradually. The biggest problem we see is that a lot of the engineers in our area are still "old school" in the fact that they believe that straight bag mixes are the only way to make quality concrete.
56 LEED pushes for more fly ash but the Northwest availability is totally cut off between March to June due to hydroelectric power being so much cheaper than coal burned power that coal burning power plants totally shutdown.

Appendix B. Repetition of some Mortar Mixtures A close look at Table 5 indicates that the following mortar mixtures (see Table B.1) had Type F admixture dosage that was greater than 12 oz/cwt. (typical manufacturer recommended dosage is 2-7 oz/cwt.).
Table B.1 Mortar Mixtures to be Repeated
Mixture ID, Curing Condition Admixture Dosage, oz/cwt Cement type
Mix5 (0.34FAA50), 73F 18 Low alkali
Mix12 (0.34FAA50), 100F 20 Low alkali
Mix23 (0.39FAA35), 73F 15 High alkali
Mix26 (0.34FAA50), 73F 32 High alkali
Mix30 (0.39FAA35), 100F 16 High alkali
Mix33 (0.34FAA50), 100F 45 High alkali
Mix40 (0.34FAA50), 45F 29 High alkali
The following observations can be made:
1. Out of 42 mixtures 7 mixtures had Type F admixture dosages greater than 12 oz/cwt. 2. All of the 7 mixtures had fly ash FAA 3. 5 out of these 7 mixtures had high alkali cement. 4. For similar conditions the 50% FAA mix had much higher Type F dosage as compared to
the 35% FAA mix which is understandable due to the much lower water contents. 5. Higher mixing temperatures lead to slightly higher admixture dosages.
The manufacturer communicated that higher admixture dosages can be used if needed without any degradation in strength results. Nevertheless it was decided to repeat all of above mixtures except Mixture 23 and 30. Mixture 23, 30 did not excessively high dosages and at the same time it was decided that at least two mixtures for each temperature should be repeated (6 mixtures in all). The repetitions were done with the following objectives:
1. To confirm again whether the originally recorded admixture dosages were correct 2. If the recorded admixture dosages were indeed correct to confirm whether the high
admixture dosages led to poorer strength performance.
The repeat mixtures were conducted with the following criteria:
• Use a total of 12 oz/cwt type F admixture • Try to hit the lowest flow (95) that is workable to make cubes well • If flow is below 95 then, add slightly more water to hit the minimum flow (95). • Test two cubes each age at 1, 2, 4, 8, 16, 28 days (equivalent ages at 73F) - as verification
test the cubes will be tested during the business hours.

In Table B.2 the repeated mixtures’ flow values, w/cm, admixture dosages, and mix temperatures are provided along with those values for the original mixtures.
Table B.2 Fresh Mortar Properties of Repeated Mortar Mixtures
Mix Cement Curing Mix # Flow w/cm F-admix. Temp
ID Type Condition % ratio oz/cwt °F FAA50 LAC Control-75F Mix5 112 0.34 18 75
Mix5R 111 0.36 12 73
FAA50 HAC Control-75F Mix26 106 0.34 31.5 78
Mix26R 96 0.35 12 76
FAA50 LAC Hot-100F Mix12 106 0.34 (0.35+) 19.8 Not measured
Mix12R 117 0.38 12 81
FAA50 HAC Hot-100F Mix33 105 0.34 (0.36+) 45.3 87
Mix33R 91 0.40 12 88
FAA50 HAC Cold-45F Mix40 108 0.34 (0.35+) 28.8 72
Mix40R 92 0.37 12 69 LAC = Low Alkali Cement HAC = High Alkali Cement + w/cm ratio including water portion of the type F admixture The strength development for each mixture and its repeat is plotted in Figure B.1. The curing temperatures for some of the mixtures and their repeats are plotted in Figure B.2.

(a) (b)
(c) (d)
(e)
Figure B.1. Compressive strength test result of Repeated Mortar Mixture
0
2000
4000
6000
8000
10000
12000
14000
0 200 400 600 800 1000
Com
pressive Strength,psi
Time, hours
Mix5‐75F
Mix5R‐75F
0
2000
4000
6000
8000
10000
12000
0 200 400 600 800 1000
Com
pressive Strength, psi
Time, hours
Mix26‐75F
Mix26R‐75F
0
2000
4000
6000
8000
10000
12000
0 200 400 600 800 1000
Compressive Strength, psi
Time, hours
Mix12‐100F
Mix12R‐100F
0
2000
4000
6000
8000
10000
12000
0 200 400 600 800 1000
Com
pressive Strength, psi
Time, hours
Mix33‐100F
Mix33R‐100F
0
1000
2000
3000
4000
5000
6000
7000
0 200 400 600 800 1000
Com
pressive Strength, psi
Time, hours
Mix40‐45F
Mix40R‐45F

Note. Mixture 12 I-button failed to function. Mixture 14 I-button cube was in the same curing environment as
Mixture 12. (a)
(b)
Note. Mixture 40 I-button failed to function. Mixture 41 I-button cube was in the same curing environment as
Mixture 40. (c)
Figure B.2. Curing Temperature History Comparisons of Repeat Mortar and Original Mortar Mixtures
From Table B.1 and Figure B.1 the following observations can be made:
• When compared to Mixture 5 Mixture 5R had a slightly higher w/cm (0.36 vs 0.34), a lower admixture dosage (12 vs 18 oz/cwt.) and had similar flow. It is clear that for Mixture 5 the originally recorded admixture dosage was correct. As illustrated in Figure
90919293949596979899100
0 100 200 300 400Tempe
rature, F
Time, hours
Mix12R
Mix14
90919293949596979899100
0 100 200 300 400
Temperature, F
Time, hours
Mix33R
Mix33
4041424344454647484950
0 100 200 300 400
Temperature, F
Time, hours
Mix40R
Mix41
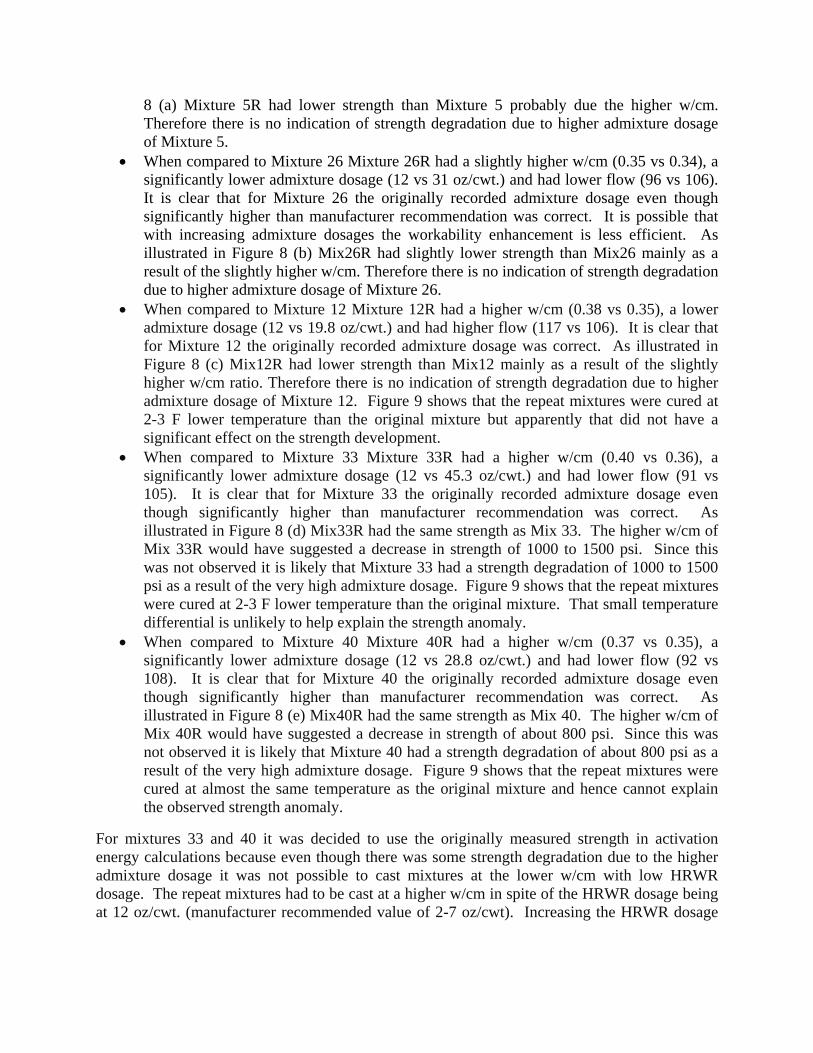
8 (a) Mixture 5R had lower strength than Mixture 5 probably due the higher w/cm. Therefore there is no indication of strength degradation due to higher admixture dosage of Mixture 5.
• When compared to Mixture 26 Mixture 26R had a slightly higher w/cm (0.35 vs 0.34), a significantly lower admixture dosage (12 vs 31 oz/cwt.) and had lower flow (96 vs 106). It is clear that for Mixture 26 the originally recorded admixture dosage even though significantly higher than manufacturer recommendation was correct. It is possible that with increasing admixture dosages the workability enhancement is less efficient. As illustrated in Figure 8 (b) Mix26R had slightly lower strength than Mix26 mainly as a result of the slightly higher w/cm. Therefore there is no indication of strength degradation due to higher admixture dosage of Mixture 26.
• When compared to Mixture 12 Mixture 12R had a higher w/cm (0.38 vs 0.35), a lower admixture dosage (12 vs 19.8 oz/cwt.) and had higher flow (117 vs 106). It is clear that for Mixture 12 the originally recorded admixture dosage was correct. As illustrated in Figure 8 (c) Mix12R had lower strength than Mix12 mainly as a result of the slightly higher w/cm ratio. Therefore there is no indication of strength degradation due to higher admixture dosage of Mixture 12. Figure 9 shows that the repeat mixtures were cured at 2-3 F lower temperature than the original mixture but apparently that did not have a significant effect on the strength development.
• When compared to Mixture 33 Mixture 33R had a higher w/cm (0.40 vs 0.36), a significantly lower admixture dosage (12 vs 45.3 oz/cwt.) and had lower flow (91 vs 105). It is clear that for Mixture 33 the originally recorded admixture dosage even though significantly higher than manufacturer recommendation was correct. As illustrated in Figure 8 (d) Mix33R had the same strength as Mix 33. The higher w/cm of Mix 33R would have suggested a decrease in strength of 1000 to 1500 psi. Since this was not observed it is likely that Mixture 33 had a strength degradation of 1000 to 1500 psi as a result of the very high admixture dosage. Figure 9 shows that the repeat mixtures were cured at 2-3 F lower temperature than the original mixture. That small temperature differential is unlikely to help explain the strength anomaly.
• When compared to Mixture 40 Mixture 40R had a higher w/cm (0.37 vs 0.35), a significantly lower admixture dosage (12 vs 28.8 oz/cwt.) and had lower flow (92 vs 108). It is clear that for Mixture 40 the originally recorded admixture dosage even though significantly higher than manufacturer recommendation was correct. As illustrated in Figure 8 (e) Mix40R had the same strength as Mix 40. The higher w/cm of Mix 40R would have suggested a decrease in strength of about 800 psi. Since this was not observed it is likely that Mixture 40 had a strength degradation of about 800 psi as a result of the very high admixture dosage. Figure 9 shows that the repeat mixtures were cured at almost the same temperature as the original mixture and hence cannot explain the observed strength anomaly.
For mixtures 33 and 40 it was decided to use the originally measured strength in activation energy calculations because even though there was some strength degradation due to the higher admixture dosage it was not possible to cast mixtures at the lower w/cm with low HRWR dosage. The repeat mixtures had to be cast at a higher w/cm in spite of the HRWR dosage being at 12 oz/cwt. (manufacturer recommended value of 2-7 oz/cwt). Increasing the HRWR dosage

any further may result in lower w/cm but the potential strength increase due to the lower w/cm is likely to be balanced by strength degradation due to the higher HRWR dosage.

Appendix C. Compressive Strength Test Results of Mortar Mixtures
(a) (b)
(c) (d)
(e)
Figure C.1 Strength-age plot with low and high alkali cement at Hot (a), Control (b), and Cold temperature (c), Strength-age plot with low alkali cement (d), strength-age plot with
high alkali cement (e) for 0.43PC Mixture

(a) (b)
(c) (d)
(e)
Figure C.2 Strength-age plot with low and high alkali cement at Hot (a), Control (b), and Cold temperature (c), Strength-age plot with low alkali cement (d), strength-age plot with
high alkali cement (e) for 0.39FAA35 Mixture
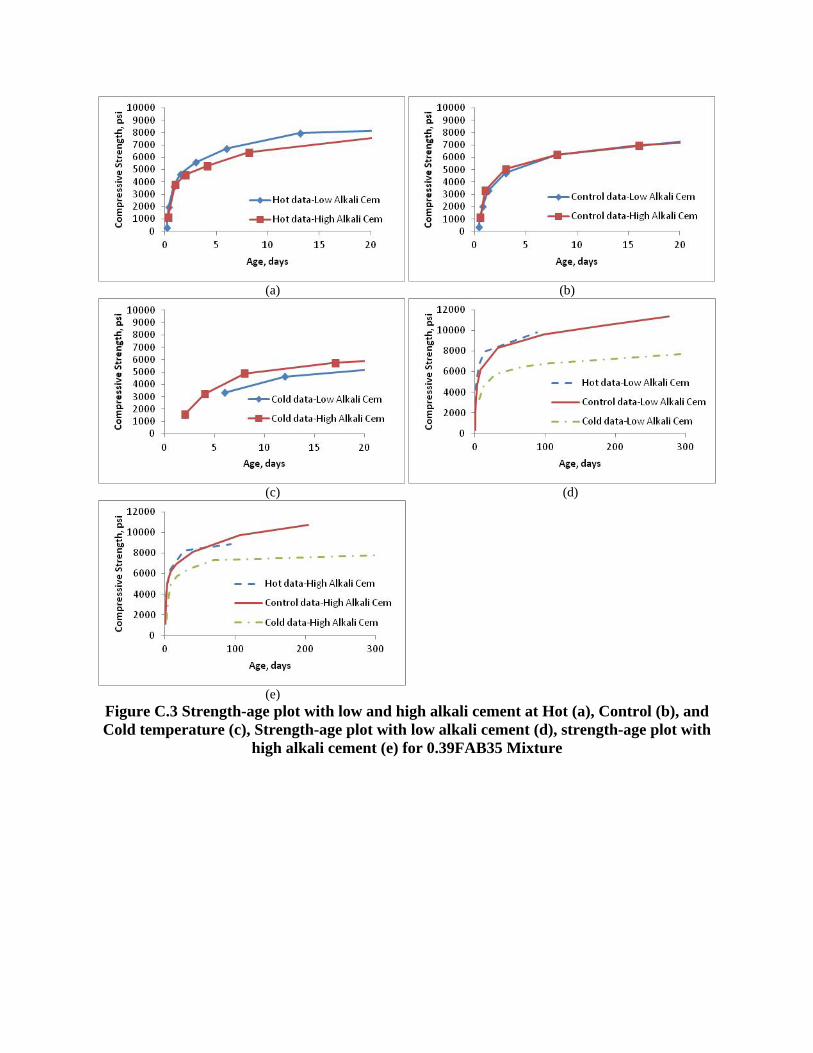
(a) (b)
(c) (d)
(e)
Figure C.3 Strength-age plot with low and high alkali cement at Hot (a), Control (b), and Cold temperature (c), Strength-age plot with low alkali cement (d), strength-age plot with
high alkali cement (e) for 0.39FAB35 Mixture

(a) (b)
(c) (d)
(e)
Figure C.4 Strength-age plot with low and high alkali cement at Hot (a), Control (b), and Cold temperature (c), Strength-age plot with low alkali cement (d), strength-age plot with
high alkali cement (e) for 0.39FAC35 Mixture

(a) (b)
(c) (d)
(e)
Figure C.5 Strength-age plot with low and high alkali cement at Hot (a), Control (b), and Cold temperature (c), Strength-age plot with low alkali cement (d), strength-age plot with
high alkali cement (e) for 0.34FAA50 Mixture
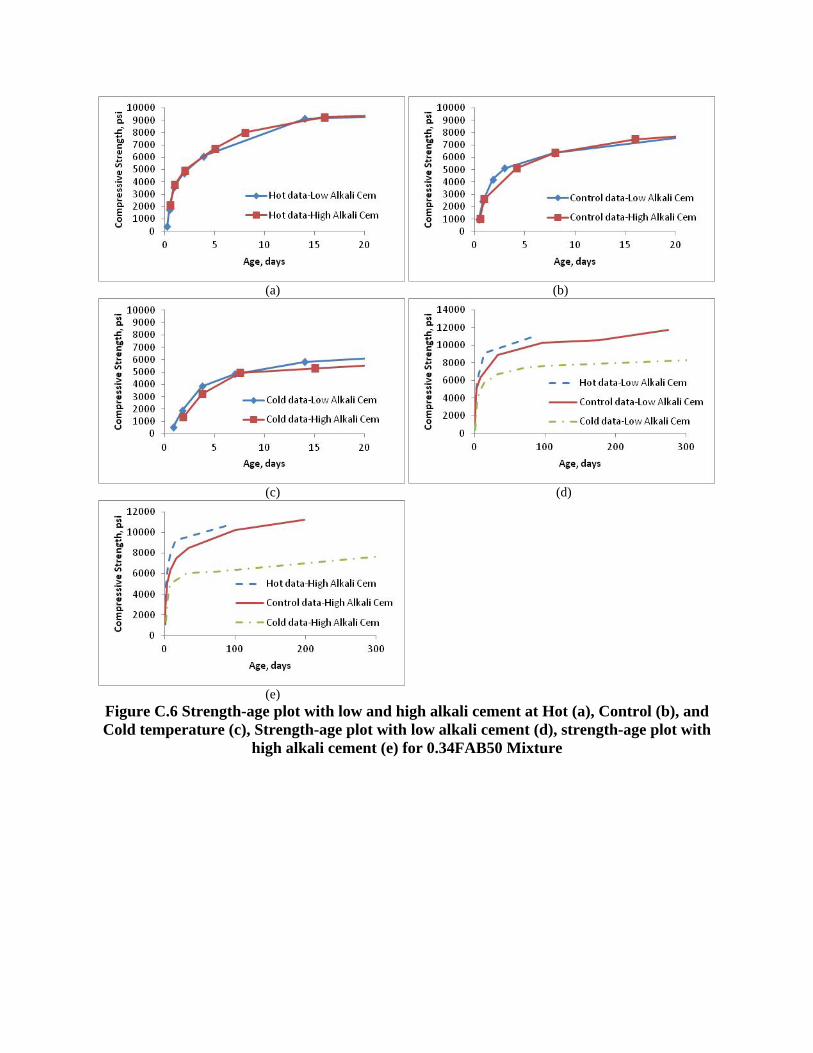
(a) (b)
(c) (d)
(e)
Figure C.6 Strength-age plot with low and high alkali cement at Hot (a), Control (b), and Cold temperature (c), Strength-age plot with low alkali cement (d), strength-age plot with
high alkali cement (e) for 0.34FAB50 Mixture

(a) (b)
(c) (d)
(e)
Figure C.7 Strength-age plot with low and high alkali cement at Hot (a), Control (b), and Cold temperature (c), Strength-age plot with low alkali cement (d), strength-age plot with
high alkali cement (e) for 0.34FAC50 Mixture