Page 1 Budgeting for an Earmark Proposal. Page 2 Excel Workbook.

Greater Yellowstone Rural ITS Project
Work Order II-2C Dynamic Warning VMS Evaluation of Wyoming Site
Prepared for
MONTANA DEPARTMENT OF TRANSPORTATION
And
U.S. DEPARTMENT OF TRANSPORTATION, FEDERAL HIGHWAY ADMINISTRATION
In cooperation with
WYOMING DEPARTMENT OF TRANSPORTATION
Prepared by
Western Transportation Institute Montana State University
Bozeman, Montana
October 2003
GYRITS Table of Contents
TABLE OF CONTENTS
Table of Contents.............................................................................................................................1 List of Figures ..................................................................................................................................2 List of Tables ...................................................................................................................................2 Implementation Statement ...............................................................................................................3 Disclaimer ........................................................................................................................................3 Acknowledgements..........................................................................................................................3 1. Introduction..............................................................................................................................4
1.1. Description of the GYRITS Corridor ............................................................................. 4 1.2. Report Organization........................................................................................................ 6
2. System Description ..................................................................................................................7 2.1. Site Description............................................................................................................... 8 2.2. Deployment Costs........................................................................................................... 9 2.3. Challenges and Issues ..................................................................................................... 9
3. Data Collection Methodology................................................................................................10 3.1. Speed Data .................................................................................................................... 10 3.2. Motorist Survey ............................................................................................................ 13 3.3. Crash Data..................................................................................................................... 14
4. Analysis and Results ..............................................................................................................15 4.1. Speed............................................................................................................................. 15 4.2. Survey ........................................................................................................................... 18 4.3. Crash Data..................................................................................................................... 21
5. Summary and Conclusions ....................................................................................................22 6. References..............................................................................................................................23 7. Appendix A: Sign Log...........................................................................................................24 8. Appendix B: FHWA Classification scheme f........................................................................35 9. Appendix C: Motorist survey.................................................................................................37 10. Appendix D: Brochure.......................................................................................................41
Western Transportation Institute 1

GYRITS Table of Contents
LIST OF FIGURES
Figure 1: GYRITS Study Area ....................................................................................................... 5 Figure 2: Inductive Loops............................................................................................................... 7 Figure 3: Static Sign........................................................................................................................ 8 Figure 4: Sharp Curves ................................................................................................................... 8 Figure 5: Map of Area.................................................................................................................... 8 Figure 7: Locations of Speed Data Collection.............................................................................. 12 Figure 8: Hypothetical Speed Profile Along 6 Data Locations .................................................... 13 Figure 9: Distribution Survey ....................................................................................................... 13 Figure 10: Speed Results for Passenger Cars ............................................................................... 16 Figure 11: Speed Results for Trucks............................................................................................. 17 Figure 12: Trip Characteristics ..................................................................................................... 18 Figure 13: General Response ........................................................................................................ 19 Figure 14: Location and Visibility................................................................................................ 19 Figure 15: Motorist Response in Behavior ................................................................................... 20
LIST OF TABLES
Table 1: Crash Rates Per 100 Million Vehicle Miles ..................................................................... 9 Table 2: Qualities of The Error Distribution Between Device Types .......................................... 11 Table 3: Passenger Car Speed Results .......................................................................................... 15 Table 4: Speed Results for Trucks ................................................................................................ 16 Table 5: Speed Reduction ............................................................................................................. 17 Table 6: Crash Data Summary (MP 66-69) .................................................................................. 21
Western Transportation Institute 2
GYRITS Implementation Statement
IMPLEMENTATION STATEMENT
This study is sponsored by the U.S. Department of Transportation, Federal Highway Administration in cooperation with the Montana Department of Transportation, the Wyoming Department of Transportation, the Idaho Transportation Department, and the Yellowstone National Park. The major objective of this document is to summarize GYRITS Work Order II-2C, Evaluation of Dynamic Warning Signs in Wyoming.
DISCLAIMER
The opinions, findings and conclusions expressed in this publication are those of the authors and not necessarily those of the Wyoming Transportation Department, the Montana Department of Transportation or the U.S. Department of Transportation, Federal Highway Administration. Alternative accessible formats of this document will be provided upon request.
Persons with disabilities who need an alternative accessible format of this information, or who require some other reasonable accommodation to participate, should contact Kate Heidkamp, Western Transportation Institute, PO Box 173910, Montana State University–Bozeman, Bozeman, MT 59717-3910, telephone: (406) 994-7018, fax: (406) 994-1697. For the hearing impaired call (406) 994-4331 TDD.
ACKNOWLEDGEMENTS
Grateful appreciation is extended to the U.S. Department of Transportation, Federal Highway Administration; Montana Department of Transportation; Idaho Transportation Department; Wyoming Department of Transportation; Yellowstone National Park; other partner agencies and the Greater Yellowstone Rural ITS Project Steering Committee members. Special thanks to those individuals who assisted with the development of this report including but not limited to Jim Gaulke (WYDOT), Dee West (Highway Safety WYDOT), Jim Stout (Highway Safety WYDOT), Joe Kaltsas (WTI), Sara Haynes (WTI), and Bose Sadagoparamanujam (WTI).
Western Transportation Institute 3

GYRITS Introduction
1. INTRODUCTION
This report summarizes the Wyoming component of the evaluation of Work Order II-2C, Dynamic Warning Variable Message Signs. The overall purpose of the work order was to deploy and evaluate Dynamic Warning Variable Message Signs (DVMS) in Montana, Wyoming and Idaho.
For this component, a dynamic warning variable message sign was installed on Wyoming highway 14A. This report summarizes the evaluation of the effectiveness of the Wyoming sign (evaluation of the deployments in Montana and Idaho will be summarized in separate reports). This report includes a description of the GYRITS Project, a system description of the dynamic warning variable message sign, an overview of the challenges and issues, and analysis of the benefits.
1.1. Description of the GYRITS Corridor
The Greater Yellowstone Rural ITS Project (GYRITS Project) was initiated to move rural ITS forward by demonstrating and evaluating ITS in a rural environment. GYRITS began in January 1997 with a Congressional Earmark to fund (1) the development of a Regional ITS Strategic Deployment Plan, (2) the implementation of "early winner" projects, and (3) the development of supporting documentation. In February 2000, a strategic plan was completed that included stakeholder input, GYRITS organizational structure, regional architecture, legacy systems, and candidate projects. The Dynamic Warning VMS is one of the candidate projects selected for implementation.
The Greater Yellowstone Rural Intelligent Transportation System Priority Corridor is a 200-mile long, 100-mile wide, heavily utilized rural transportation corridor between Bozeman, Montana and Idaho Falls, Idaho (Figure 1). This corridor includes:
• three states: Montana, Idaho and Wyoming;
• two national parks: Yellowstone (YNP) and Grand Teton GTNP; and
• a variety of transportation facilities ranging from Interstate freeway to low-volume, two-lane rural highways.
Primary transportation facilities include:
• Interstate 90/15 from Bozeman, Montana to Idaho Falls, Idaho through Butte, Montana;
• U.S. Highway 191/20 from Bozeman, Montana to Idaho Falls, Idaho; and
• U.S. Highway 89/26 from Livingston, Montana through Jackson, Wyoming to Idaho Falls, Idaho.
Western Transportation Institute 4

GYRITS Introduction
Additional highways added to the corridor at the March 1998 Steering Committee meeting include:
• Highway 212 from Red Lodge, Montana, through Cooke City, Montana and into Yellowstone National Park;
• Highway 14 from Cody, Wyoming, through the east entrance of Yellowstone National Park and into the Park interior; and Highway 31 from Swan Valley Idaho, over Teton Pass to Jackson, Wyoming.
Figure 1: GYRITS Study Area
These routes represent vital transportation links for the economy and well being of the three-state area of Montana, Wyoming and Idaho. They also serve the recreational and resource needs of a growing number of individuals seeking to utilize the Greater Yellowstone ecosystem and Grand Teton National Park. The national importance of the corridor is further emphasized by its function as the connector for the trucking industry between the upper Midwest markets along Interstate 90 and the Intermountain and Southwest markets accessible by Interstate 15.
Because this report addresses DVMS deployed only in Wyoming, it will focus on the Wyoming portion of the GYRITS Study Area, in particular Highway 14A. As seen in Figure 1, the location of the DVMS is not in the core GYRITS corridor. However, the character and challenges of the DVMS location fit with the intent of the GYRITS project mission.
Western Transportation Institute 5

GYRITS Introduction
1.2. Report Organization
This evaluation of the Wyoming DVMS will be presented in the following sections:
• A description of the system components, locations, costs and challenges (Section 2);
• The methodology employed in gathering evaluation data (Section 3);
• Results and analysis of the data collected for the evaluation, including speed data, motorist survey, and crash data (Section 4); and
• Summary of findings (Section 5).
Western Transportation Institute 6
GYRITS System Description
2. SYSTEM DESCRIPTION
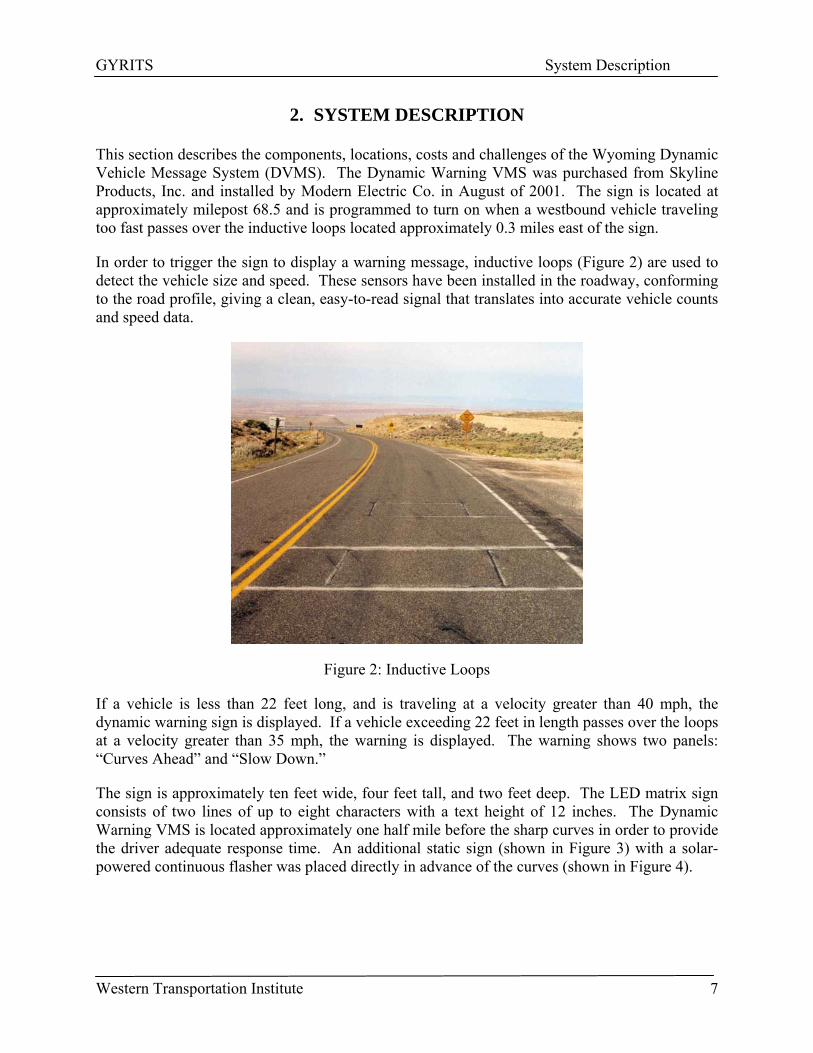
This section describes the components, locations, costs and challenges of the Wyoming Dynamic Vehicle Message System (DVMS). The Dynamic Warning VMS was purchased from Skyline Products, Inc. and installed by Modern Electric Co. in August of 2001. The sign is located at approximately milepost 68.5 and is programmed to turn on when a westbound vehicle traveling too fast passes over the inductive loops located approximately 0.3 miles east of the sign.
In order to trigger the sign to display a warning message, inductive loops (Figure 2) are used to detect the vehicle size and speed. These sensors have been installed in the roadway, conforming to the road profile, giving a clean, easy-to-read signal that translates into accurate vehicle counts and speed data.
Figure 2: Inductive Loops
If a vehicle is less than 22 feet long, and is traveling at a velocity greater than 40 mph, the dynamic warning sign is displayed. If a vehicle exceeding 22 feet in length passes over the loops at a velocity greater than 35 mph, the warning is displayed. The warning shows two panels: “Curves Ahead” and “Slow Down.”
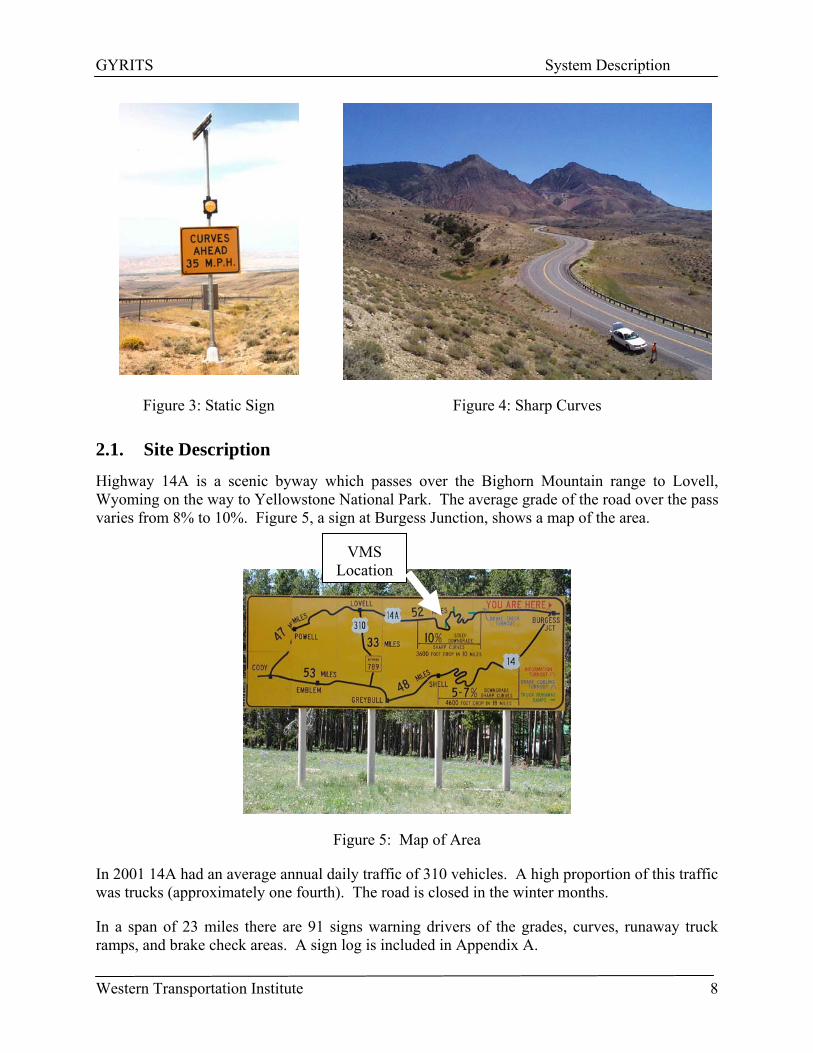
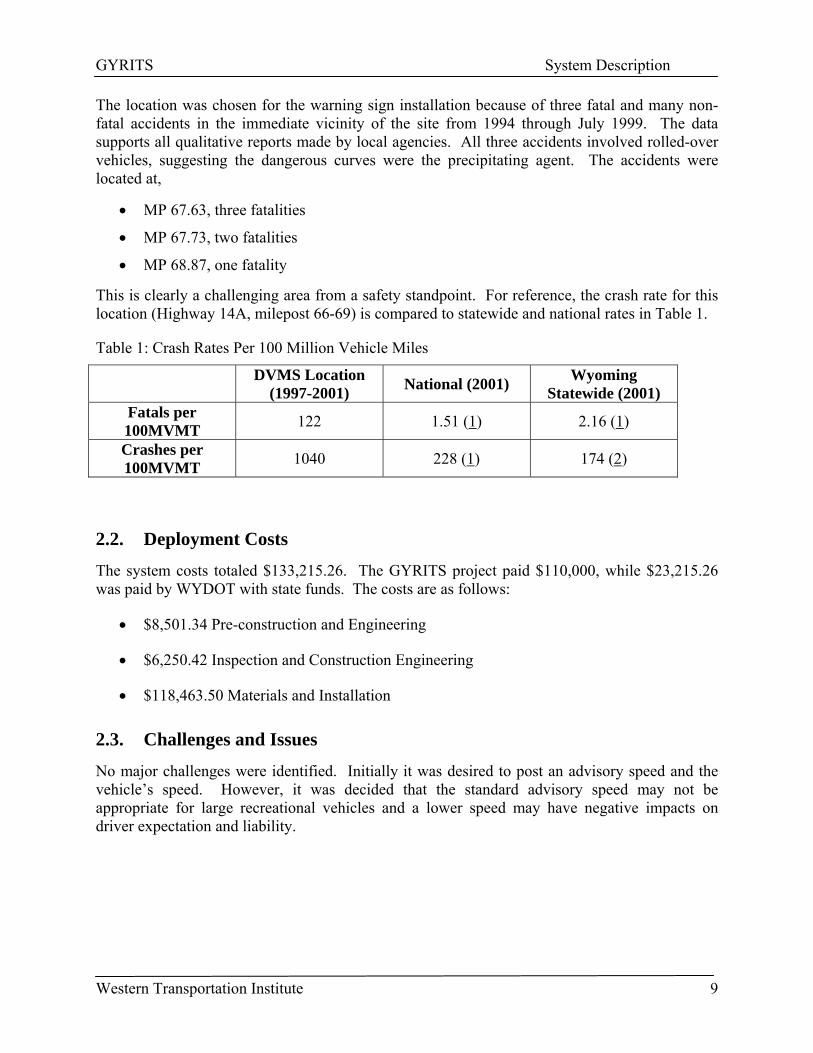
The sign is approximately ten feet wide, four feet tall, and two feet deep. The LED matrix sign consists of two lines of up to eight characters with a text height of 12 inches. The Dynamic Warning VMS is located approximately one half mile before the sharp curves in order to provide the driver adequate response time. An additional static sign (shown in Figure 3) with a solar-powered continuous flasher was placed directly in advance of the curves (shown in Figure 4).
Western Transportation Institute 7
GYRITS System Description
Figure 3: Static Sign Figure 4: Sharp Curves
2.1. Site Description
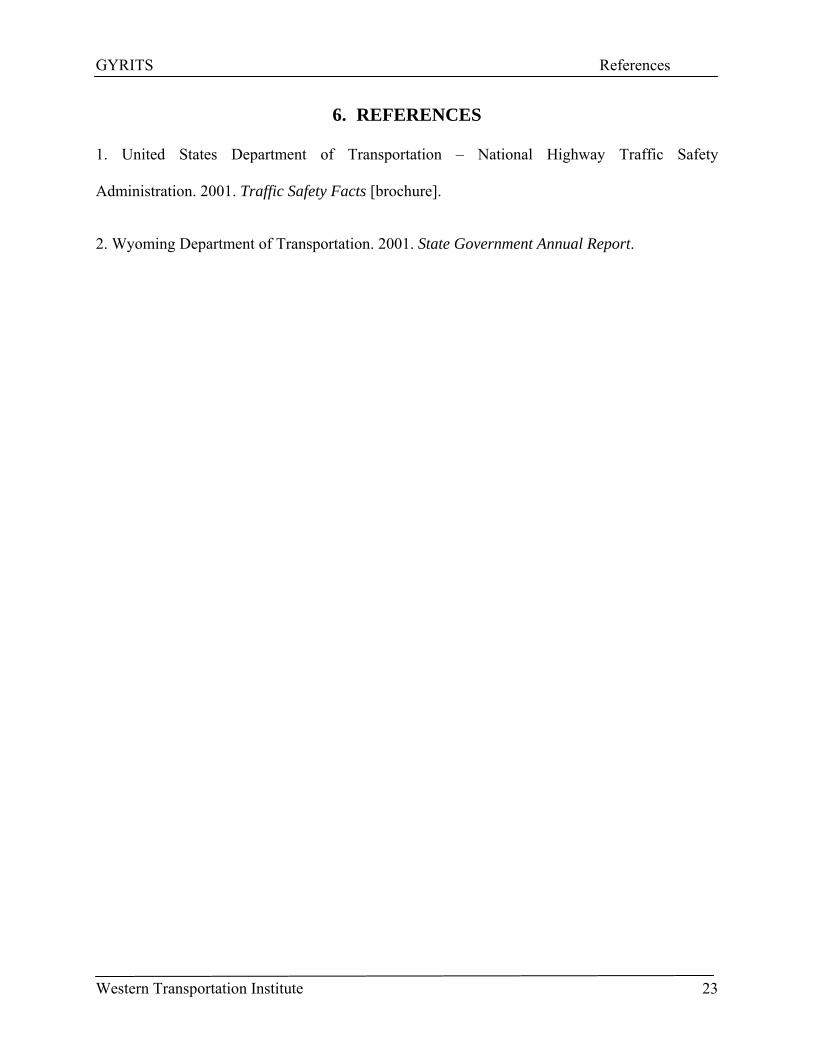
Highway 14A is a scenic byway which passes over the Bighorn Mountain range to Lovell, Wyoming on the way to Yellowstone National Park. The average grade of the road over the pass varies from 8% to 10%. Figure 5, a sign at Burgess Junction, shows a map of the area.
VMS Location
Figure 5: Map of Area
In 2001 14A had an average annual daily traffic of 310 vehicles. A high proportion of this traffic was trucks (approximately one fourth). The road is closed in the winter months.
In a span of 23 miles there are 91 signs warning drivers of the grades, curves, runaway truck ramps, and brake check areas. A sign log is included in Appendix A.
Western Transportation Institute 8
GYRITS System Description
The location was chosen for the warning sign installation because of three fatal and many non-fatal accidents in the immediate vicinity of the site from 1994 through July 1999. The data supports all qualitative reports made by local agencies. All three accidents involved rolled-over vehicles, suggesting the dangerous curves were the precipitating agent. The accidents were located at,
• MP 67.63, three fatalities
• MP 67.73, two fatalities
• MP 68.87, one fatality
This is clearly a challenging area from a safety standpoint. For reference, the crash rate for this location (Highway 14A, milepost 66-69) is compared to statewide and national rates in Table 1.
Table 1: Crash Rates Per 100 Million Vehicle Miles
DVMS Location (1997-2001) National (2001) Wyoming
Statewide (2001) Fatals per 100MVMT 122 1.51 (1) 2.16 (1)
Crashes per 100MVMT 1040 228 (1) 174 (2)
2.2. Deployment Costs
The system costs totaled $133,215.26. The GYRITS project paid $110,000, while $23,215.26 was paid by WYDOT with state funds. The costs are as follows:
• $8,501.34 Pre-construction and Engineering
• $6,250.42 Inspection and Construction Engineering
• $118,463.50 Materials and Installation
2.3. Challenges and Issues
No major challenges were identified. Initially it was desired to post an advisory speed and the vehicle’s speed. However, it was decided that the standard advisory speed may not be appropriate for large recreational vehicles and a lower speed may have negative impacts on driver expectation and liability.
Western Transportation Institute 9

GYRITS Data Collection Methodology
3. DATA COLLECTION METHODOLOGY
This section of the evaluation will detail the methodology employed in gathering relevant data. Data collected includes traffic speed, motorist surveys, and crash data.
3.1. Speed Data
Speed data was collected to evaluate any potential impact of the DVMS on vehicle speed. Vehicle spot speeds and classifications were collected for a two-week period prior to the Dynamic Warning VMS installation and a two-week period after. All speeds are measured in miles per hour (mph) and are averaged as time mean speeds. Pre-installation data was collected using Numetrics NC-97 magnetic traffic counters. Due to challenges encountered with the Numetrics, post-installation data was collected using Trax I classifiers with “mini-tube” road tubes.
The two data collection efforts were as follows:
• Pre-installation:
• Date: 6/28/2000 – 7/5/2000
• Device: NC-97 Numetrics
• Post-installation
• Date 6/24/2002 – 7/11/2002
• Device: TRAX road-tubes
The time periods were selected to include the July 4th weekend. Based on discussions with WYDOT staff, the July 4th time weekend experiences the highest traffic overall and specifically the highest number of motorists unfamiliar with the road. Collecting speed data during the same annual time periods provides more consistency between pre and post installation data.
The pre-installation effort experienced difficulties. Due to vehicles disturbances, three of the NC-97 devices were lifted off the pavement and were found beside the road in the ditch. In an effort to protect these expensive devices, the remaining devices were retrieved early, cutting the data collection short. These challenges were the reason for using road-tubes for the post-installation data collection.
Passenger cars (PC’s) and trucks were analyzed separately. The Numetrics counters classify vehicles by length. Vehicles 22 feet or less were identified as passenger cars. Vehicles longer than 22 feet were identified as trucks. Road tubes classify vehicles according to the FHWA Schedule F classification. Passenger classes 1, 2 and 3 were identified as passenger cars. All other Schedule F classes were identified as trucks. According to this scheme, a passenger car towing a trailer would likely be classified as a truck by the NC-97 detectors and as a passenger
Western Transportation Institute 10

GYRITS Data Collection Methodology
car by the road tubes. This could cause some error in the comparison. Appendix B lists the FHWA Type F classification scheme.
This study is concerned with average speeds and not individual vehicle speeds. Researchers selected the average speed within a two-hour period as the unit of measure. This was chosen for two reasons. First, due to limitations in data storage it was infeasible to capture individual speeds. Second, two-hour averages have less variance in the error (discussed below).
The differences in the errors of the types of data collection devices can affect the accuracy of the data analysis. For example, if one device type typically over-estimates speeds while the other does not, a difference in speeds may be measured when one does not exist. To compensate for this, several comparison tests were conducted with the two types of units. From the data both road-tubes and NC-97 devices have errors when compared to radar and pilot cars. No device is perfectly accurate. However, it is important to determine how the error distributions of the two devices compare to each other. For purposes of this study the road tubes were assumed to be accurate, and the error was defined as the difference in the speeds measured by the NC-97 devices (In actuality this error is a combination of the errors of both devices.) As shown in Table 2 the NC-97 devices overestimated speed by an average of 1.5 mph when compared to the road tubes. To compare data between these two devices 1.5 mph will be subtracted from the NC-97 average speeds.
Table 2: Qualities of The Error Distribution Between Device Types
Rouse Comparison Test October 2002
Minimum -6.25 Maximum 12.50 Average 1.54 Standard Deviation 2.64 n (2-hour averages) 46
The mileposts and mile-markers were changed between the pre and post installation. This made the precise locations of the speed data collection difficult to find. There is a possibility the road tubes collected data at slightly different locations. However, because of landmarks identified, the pre and post installation data collection locations should not differ by more than 1/10th of a mile. The traffic counters were placed in the westbound lane at six locations. The locations are as follows (see also Figure 6).
• Location 1: Adjacent to the road closure gate (MP 68.75). This gives a speed in the horizontal curve and steep downgrade previous to the potential sign location.
• Location 2: Just east of the Five Springs Campground intersection (MP 68.63). This gives a speed at the beginning of the tangent section.
• Location 3: Adjacent to the 35-mph curve warning sign at the end of the tangent section (MP 68.35).
Western Transportation Institute 11

GYRITS Data Collection Methodology
• Location 4: At the beginning of the less sharp horizontal curves following the tangent section (MP 67.95). This shows the progression of speeds approaching the hazardous curves.
• Location 5: At the beginning of the hazardous curves, precisely the third delineator into the guardrail (MP 67.80). This displays the speeds when entering the hazardous curves.
• Location 6: Following the final hazardous horizontal curve (MP 66.80).
Figure 6: Locations of Speed Data Collection
To better understand the challenge of driving this segment of road, consider an uninformed motorist that would be surprised by the curves and an informed motorist that would see the dynamic warning sign and slow accordingly. Figure 7 shows the expected profiles of vehicle speeds of these two types of vehicles. Location 1 is at the end of a steep grade (approximately 8%), and vehicles would be coming off a steep grade. When the vehicle reaches Location 2, it comes to a less severe grade and has the false appearance of being out of the steep grades. At this location the dynamic warning sign first comes into view. The view shown in Figure 2 is at this location. At location 3 (just beyond the location of the sign) an informed motorist would see the sign and slow down in anticipation of the curves. An uninformed motorist would continue to speed up until reaching location 3 where the grade again changes to a steep grade. Between locations 3 and 4 the uninformed motorist would slow down or maintain speed. At location 4 the s-curve at location 5 would come into view and the motorist would realize they were in trouble and continue to slow. At location 6 the motorist is truly in the valley bottom and would increase speed.
Western Transportation Institute 12

GYRITS Data Collection Methodology
Expected Speed Profiles
30
40
50
60
0 1 2 3 4 5 6 7
Location
Ave
rage
Spe
ed
Unexpecting Motorist
Informed Motorist
Figure 7: Hypothetical Speed Profile Along 6 Data Locations
3.2. Motorist Survey
A motorist survey was conducted for the purposes of assessing motorist reported response to the DVMS. Motorists were asked if they saw the sign, how they adjusted their driving behavior and if they thought the signs were useful. On July 11, 2002 two surveyors distributed motorist surveys (see Figure 8). Mail-in surveys were distributed at the stop sign (left turn) and the yield sign (right turn) where Federal Highways 14A and 310 intersect.
Figure 8: Distribution Survey
An informational letter explaining this section of the GYRITS Project accompanied the surveys. A copy of the informational letter and survey is included in Appendix C. The survey consists of a two-page document asking about the dynamic message sign and how the individual responded to it. Over 50 surveys were distributed in a four-hour period. Seventeen surveys were returned.
Western Transportation Institute 13

GYRITS Data Collection Methodology
If drivers requested more information when they received their surveys, a brochure on the Dynamic Warning VMS was distributed explaining why the system was installed, the intended goal, how long it will be in place, and some background about the area. A copy of this brochure is included in Appendix D.
The survey distribution site was located approximately 20 miles west of the Dynamic Warning VMS. A “Survey Crew” sign was placed upstream and vehicles were flagged to stop. However, approximately 20% of the vehicles did not take a survey. Additionally, this intersection was near Lovell, so some of the traffic may have been local drivers who had not just passed the sign.
3.3. Crash Data
The primary purpose of this type of system is to improve safety thus reducing crashes. With other external factors, randomness and the short evaluation period (only one year post crash data was collected), any change in crash frequencies may not necessarily be attributable to the system. However, crash data was analyzed in an attempt to detect potential effects of the dynamic warning sign.
Summary crash data was obtained from the Wyoming Department of Transportation crash database. The system was installed in August 2001. Because the road was closed soon after (the road is typically closed for the winter after the first major snowfall), all 2001 data was considered to be prior to installation. Crash data from 1997-2001 (five years prior to installation) were compared to 2002 data (one year after installation). Crashes taking place between mileposts 66.0 to 69 were examined.
Western Transportation Institute 14

GYRITS Analysis and Results
4. ANALYSIS AND RESULTS
This section documents the results of the data collected for the evaluation, including speed data, motorist survey and crash data. Where appropriate, details are given regarding analysis techniques. All analysis utilizes a 95% confidence interval (α=0.05). For most cases a one tailed t-test is used. If the t-value is greater than 1.96, we are 95% confident there is a statistically significant change.
4.1. Speed
Table 3 and Figure 9 show the results of the speed data analysis for passenger cars. Location 2 is approximately where motorists first see the sign. If there is a significant change in speed at or before Location 2, it cannot yet be due to the sign. Location 4 and 5 are of key concern as a reduction in speed at these locations could mean increased safety. The NC-97 speeds are adjusted by -1.5 mph as discussed previously. Considering the adjusted t-test, this is exactly what researchers expected to see. There is little difference at location 2, where motorists first see the sign, and a significant decrease at all locations downstream.
Table 3: Passenger Car Speed Results
Location Pre/Post
install Start Time End Time n 2-hr
Intervaln
VehiclesMean Speed s t test
Adjusted Mean
Adjustedt test
1 Pre no data 1 Post 6/24/02 15:00 7/11/02 9:00 202 4016 46.2 5.6 46.2 2 Pre 6/28/00 7:00 7/5/00 15:00 89 2361 45.4 5.1 43.9 2 Post 6/24/02 15:00 7/11/02 9:00 202 4055 43.4 5.5
-3.1 43.4
-0.8
3 Pre no data 3 Post 6/24/02 15:00 7/11/02 9:00 202 4365 41.6 5.3 41.6 4 Pre 6/28/00 7:00 7/1/00 13:00 40 688 48.2 6.7 46.7 4 Post 6/24/02 15:00 7/11/02 9:00 202 4222 43.8 4.7
-4.0 43.8
-2.7
5 Pre 6/28/00 7:00 7/3/00 21:00 68 1673 46.9 5.1 45.4 5 Post 6/24/02 15:00 7/11/02 9:00 202 3893 40.0 4.0
-10.1 40.0
-7.9
6 Pre 6/28/00 7:00 7/5/00 15:00 89 2406 52.8 7.8 51.3 6 Post 6/24/02 15:00 7/11/02 9:00 202 4118 47.7 5.5
-5.6 47.7
-3.9
Western Transportation Institute 15

GYRITS Analysis and Results
Speed Profile
30.0
40.0
50.0
60.0
0 1 2 3 4 5 6 7
Location
Ave
rage
Spe
ed
PC After
PC Before
Figure 9: Speed Results for Passenger Cars
Table 4 and Figure 10 show the results for Trucks, which are different from those of passenger cars. Although there is a significant decrease in speed at location 5, there is a significant increase at location 4. It is clear that the overall speeds have increased due to some other factor, since the sign should not affect speeds at location 2. One can see by Figure 10 that although the overall speeds have increased, vehicles appear to be slowing down in the curves.
Table 4: Speed Results for Trucks
Location Pre/Post
Install Start Time End Time n 2-hr
Intervalsn
VehiclesMean Speed s t test
AdjustedMean
Adjusted t test
1 Pre no data 1 Post 6/24/02 15:00 7/11/02 9:00 202 1115 49.0 8.7 49.0 2 Pre 6/28/00 7:00 7/5/00 15:00 89 281 41.2 7.3 39.7 2 Post 6/24/02 15:00 7/11/02 9:00 202 1187 46.1 8.0 5.1 46.1 6.6
3 Pre no data 3 Post 6/24/02 15:00 7/11/02 9:00 202 1210 44.1 8.0 44.1 4 Pre 6/28/00 7:00 7/1/00 13:00 40 99 45.4 8.1 43.9 4 Post 6/24/02 15:00 7/11/02 9:00 202 1251 47.5 7.6 1.5 47.5 2.6
5 Pre 6/28/00 7:00 7/3/00 21:00 68 297 47.5 5.8 46.0 5 Post 6/24/02 15:00 7/11/02 9:00 202 1442 42.1 5.2 -6.7 42.1 -4.9
6 Pre 6/28/00 7:00 7/5/00 15:00 89 307 49.5 6.6 48.0 6 Post 6/24/02 15:00 7/11/02 9:00 202 1042 51.9 7.4 2.8 51.9 4.5
Western Transportation Institute 16

GYRITS Analysis and Results
Speed Profile
30.0
40.0
50.0
60.0
0 1 2 3 4 5 6 7
Location
Ave
rage
Spe
ed
Truck After
Truck Before
Figure 10: Speed Results for Trucks
Researchers also considered the reduction in speed from location 2 (upstream of the sign) to both locations 4 and 5 (in the curves). Table 5 shows the reduction in speed after seeing the sign (e.g., prior to installation, passenger cars increase there speed between location 2 and 4 by 2.44 mph). Both trucks and passenger cars reduced their speed more after the sign was installed. However it was only significant for location 5.
Table 5: Speed Reduction
Vehicle Reduction Pre/Post Mean s n t PC 2-4 Pre -2.44 6.50 34 PC 2-4 Post -0.43 4.81 174 -1.71
PC 2-5 Pre -1.70 5.75 51 PC 2-5 Post 3.31 5.22 174 -5.58
Truck 2-4 Pre -2.89 8.40 27 Truck 2-4 Post -0.81 6.68 150 -1.22
Truck 2-5 Pre -5.96 7.29 47 Truck 2-5 Post 4.07 6.36 150 -8.47
Although some speed comparisons did not see a significant decrease in speed after the DVMS was installed, there was in all cases a significant decrease at location 5. Since location 5 is the beginning of the sharp curves, the DVMS seems likely to have a positive impact on safety at this site.
Western Transportation Institute 17

GYRITS Analysis and Results
4.2. Survey
The intent of the dynamic warning VMS is to cause drivers to slow down and/or drive more attentively. One can measure the effects of this reaction by average vehicle speeds and crash data. To measure this effect directly, motorists were asked if they reduced their speed or drove more cautiously after viewing the VMS. Although this survey attempts to measure the direct effect, it actually documents the motorists’ perceived and reported change, and not necessarily the actual change in their driving behavior. However, motorists’ reported response can still provide good insight into the effectiveness of the dynamic warning VMS. Additionally, other benefits and challenges can be identified such as visibility, location, ease of understanding and public acceptance.
Because of the low volumes of traffic and lack of a convenient survey location, only 17 surveys were collected. A copy of the survey can be found in Appendix C. The survey sample contains a fairly even distribution of motorists based on familiarity, vehicle type and trip length (see Figure 11). Since this is a rural highway, it is not surprising that no motorists surveyed were making typically local trips (i.e., shopping, school, and medical). Only one responder was not a Wyoming resident.
(1) How often do you travel over Bighorn Pass on U.S. Highway 14A?
0%10%20%30%40%50%60%
First T
ime
1-5 Ti
mes P
er Yea
r
6-10 T
imes
Per.
..11
-15 Tim
es P
e...
>15 T
imes
Per
...Did
Not Ans
wer
(10) What is the PRIMARY PURPOSE for the majority of your vehicle travel on US Hwy
14A?
0%
20%
40%
60%
80%
100%
Work
Schoo
l
Shopp
ing
Medica
l
Recrea
tional
Visiting
F/F
Other
(13) What TYPE of vehicle do you PRIMARILY drive on US Hwy 14A?
0%
20%
40%
60%
80%
100%
Automob
ile
Commerc
ial RVOthe
r
No Ans
wer
(14) What is the AVERAGE number of miles traveled for the trip purpose in
Question #10?
0%
20%
40%
60%
80%
100%
0-24 25-49 50-99 100-300 300+
Miles
Figure 11: Trip Characteristics
Western Transportation Institute 18

GYRITS Analysis and Results
Based on the surveyed population, seventy-six percent of the motorists noticed the sign. Those that did not notice the sign did not respond to the remaining questions. The response to the DVMS was generally positive. Of those that noticed the sign, all respondents thought it was useful to very useful (Figure 12).
(2) Did you notice the Dynamic Warning VMS while driving west on US Hwy 14A
coming from the Bighorn Pass heading towards Lovell?
0%20%40%60%80%
100%
No Yes
(7) Overall, HOW USEFUL is the Dynamic Warning VMS?
0%20%40%60%80%
100%
Didn't Ans
wer
Not Use
ful
Useful
Very U
seful
Figure 12: General Response
Motorists generally felt the sign was in a good location and was easy to read (Figure 13). There appears to be no difficulty in reading and responding to the DVMS. Of those that noticed the sign, 92% thought it was in a good location and 77% thought it was easy to read.
(3) HOW EASY is the Dynamic Warning VMS to read and understand?
0%20%40%60%80%
100%
Didn't Ans
wer
Diff icu
ltFair
Easy
(8) Was the Dynamic Warning VMS in a good location?
0%20%40%60%80%
100%
Didn'tAnsw er
No Yes
Figure 13: Location and Visibility
The primary purpose of the motorist survey was to measure motorists’ reported change in driving behavior after seeing the DVMS. Regarding a change in their awareness of the road conditions, 23% of respondents who noticed the sign reported no change, 46% reported more awareness and 31% reported some change in awareness. Regarding a change in speed, 15% reported no change, 23% slowed somewhat, 31% slowed (between somewhat and considerably), and 31% slowed considerably.
Western Transportation Institute 19

GYRITS Analysis and Results
(5) Did the message cause you to SLOW DOWN?
0%20%40%60%80%
100%
Didn't Ans
wer
No Cha
nge
Slowed
Slowed
Con
sid...
(6) Did the message make you aware of the road conditions?
0%20%40%60%80%
100%
Didn't Ans
wer
No Cha
nge
Aware
More A
ware
Figure 14: Motorist Response in Behavior
Motorists were also given space on the survey to make comments. The comments made are listed below. The comments were generally positive. However, some of the surveyed motorists showed confusion with the status of the sign when the message did not turn. Recall that the sign will not activate if a motorist is traveling at a safe speed.
"The dynamic warning signs are very goods!"
"Need another sign on top of the mountain!"
"The locals who use 14A numerous times each year are very aware of the steepness and curves on the lower part of the road - the dynamic warning sign is and will be a good safety feature to the many tourists who use 14A each year."
"I traveled on #14 2 mi east of Lovell WY then turned on #37. Did not go over Big Horn Pass. Thanks:"
"The slow down sign sometimes seems to be off."
"Sign is perfect when it is on."
"I lived in Lovell most of my life and heard about many accidents because people thought they were off the steep part. I wouldn’t mind seeing another one up on top reminding people to shift down and not burn up their brakes. It's a great sign in a necessary location."
" 'USE LOWER GEARS' should appear on sign. Also notification not to ride the brakes. Sign needs to be put up higher or use more than one sign."
Western Transportation Institute 20

GYRITS Analysis and Results
4.3. Crash Data
As mentioned previously, reductions in crashes can be a primary measure of effectiveness when evaluating safety improvements. The sign is located at approximately milepost 68.5. Crashes occurring between mileposts 66.0 and 69.0 were evaluated. This encompasses the area between the location where the sign is first visible (approximately milepost 69) and the end of the steep grade (approximately milepost 66).
Crashes have been categorized by severity, primary contributing factor of “speeding” or “alcohol”, and vehicle type. Table 6 shows the number of crashes before and after installation of the dynamic curve warning system.
Table 6: Crash Data Summary (MP 66-69)
Vehicle Type
Year Total Fatal AADT (mp 59.8)
Single Vehicle Speed Alcohol Tractor Van Pickup Motor-
cycle 1997 5 0 290 3 2 1 2 1 0 0 1998 3 1 290 1 1 0 0 2 1 0 1999 4 1 290 3 2 1 0 0 1 0 2000 3 0 290 3 1 1 0 0 1 0 2001 2 0 330 2 2 0 0 0 1 0 Pre-
Install 17 2 298 12 8 3 2 3 4 0
Pre-Install /
Year 3.4 0.4 298 2.4 1.6 0.6 0.4 0.6 0.8 0
2002 7 0 350 6 3 0 0 0 1 2
Most of the crashes are single vehicle, run off the road crashes. Almost half had speed identified as a contributing factor. For the specific curves, there were on average 3.4 crashes per year prior to installation of the DVMS. The year after installation had twice the previous average. Although there was a significant increase in traffic, this does not explain the entire increase. It is encouraging that there were no fatal crashes the year after the system was installed. However, as fatal crashes averaged about 0.4 per year, this is not significant beyond random chance.
Western Transportation Institute 21

GYRITS Summary and Conclusions
5. SUMMARY AND CONCLUSIONS
A dynamic warning variable message sign was installed on Wyoming State Highway 14A in August 2001. This low traffic highway has a relatively high number of crashes. This report summarizes the evaluation of this system. Data was collected regarding vehicle speeds, crash data, and motorists reported responses.
Speed was measured prior to the DVMS installation. When compared to speed after the installation was complete, there was a statistically significant reduction in vehicle speeds at the sharp curves for both passenger cars and trucks.
Motorists generally approved of the sign. Of those surveyed 76% noticed the sign. Of those that noticed the sign, 77% became more aware of the roadway conditions and 85% slowed their speed.
There was not a decrease in total crashes at the DVMS location. No fatal crashes occurred in the year following the installation compared to two fatal crashes in the five years prior. Due to the low traffic volumes a significant change in crashes with one year of crash data is difficult to identify. Crashes at this location should be re-evaluated when more data is available.
The total number of crashes may not appear to warrant the cost of the DVMS. However, consider that a fatal crash occurs approximately every other year within a specific set of curves. If the DVMS prevented even one fatal crash during the lifetime of the system, both WYDOT and the public would likely consider the initial cost to be a good investment.
Western Transportation Institute 22
GYRITS References
6. REFERENCES
1. United States Department of Transportation – National Highway Traffic Safety
Administration. 2001. Traffic Safety Facts [brochure].
2. Wyoming Department of Transportation. 2001. State Government Annual Report.
Western Transportation Institute 23

GYRITS Appendix A
7. APPENDIX A: SIGN LOG
ApproximateMilepost MUTCD Description Standard
Dimensions Picture
App 88.5 –0.5 mile from
Burgess Jct.
“All trucks, RVs, vehicles with trailers MUST STOP and read sign. Turnout
Ahead.”
App 88.3 – 0.2 mi from above sign
Map of Area
87.9 W 1-4L and W 13-1
Reverse Curve with Advisory Speed Plate
30” x 30”
18” x 18”
86.8 W 1-2L and W 13-1
Curve to the Left with Advisory Speed Plate
30” x 30”
18” x 18”
86.4 W 1-5 and W 13-1
Winding Road with Advisory Speed Plate
30” x 30”
18” x 18”
86.1 W 1-2R and W 13-1
Curve to the Right with Advisory Speed Plate
30” x 30”
18” x 18”
85.8 W 1-2L and W 13-1
Curve to the Left with Advisory Speed Plate
30” x 30”
18” x 18”
85.4 W 1-2R and W 13-1
Curve to the Right with Advisory Speed Plate
30” x 30”
18” x 18”
Western Transportation Institute 24

GYRITS Appendix A
ApproximateMilepost MUTCD Description Standard
Dimensions Picture
83.4 W 1-2R and W 13-1
Curve to the Right with Advisory Speed Plate
30” x 30”
18” x 18”
82.9 W 1-2L and W 13-1
Curve to the Left with Advisory Speed Plate
30” x 30”
18” x 18”
82.8 “Open Range – Loose Stock” 30” x 30”
78.1 “Brake Check Turnout—All Trucks RVs
Vehicles with Trailers MUST STOP 1 Mile”
77.9 “Steep Grades Ahead” 30” x 30”
77.8 “Next 14 Miles – Steep Grade 10% Sharp Curves Check Brakes”
78.0 “Brake Check Turnout—All Trucks RVs
Vehicles with Trailers MUST STOP 1000 Feet”
77.9 “Sharp Curves Ahead” 30” x 30”
77.8 “Brake Check Turnout”
Western Transportation Institute 25
GYRITS Appendix A
ApproximateMilepost MUTCD Description Standard
Dimensions Picture
77.7 Map of Area
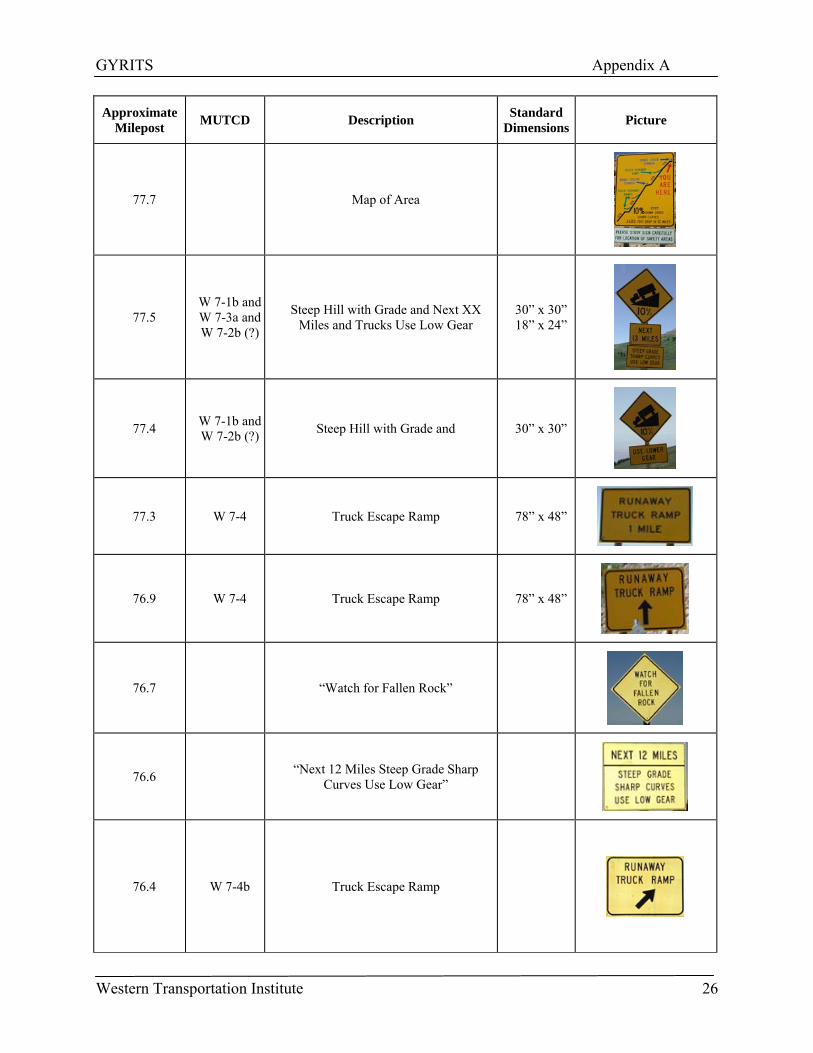
77.5 W 7-1b and W 7-3a and W 7-2b (?)
Steep Hill with Grade and Next XX Miles and Trucks Use Low Gear
30” x 30” 18” x 24”
77.4 W 7-1b and W 7-2b (?) Steep Hill with Grade and 30” x 30”
77.3 W 7-4 Truck Escape Ramp 78” x 48”
76.9 W 7-4 Truck Escape Ramp 78” x 48”
76.7 “Watch for Fallen Rock”
76.6 “Next 12 Miles Steep Grade Sharp Curves Use Low Gear”
76.4 W 7-4b Truck Escape Ramp
Western Transportation Institute 26

GYRITS Appendix A
ApproximateMilepost MUTCD Description Standard
Dimensions Picture
76.2 W 7-1b and W 7-2b (?) Steep Hill with Grade and 30” x 30”
75.1 W 1-2R Curve to the Right 30” x 30”
75.1 “All Vehicles Use Lower Gear”
75.0 W 7-1b and W 7-3a
Steep Hill with Grade and Supplemental Plaque
30” x 30” 18” x 24”
74.9 “Brake Cooling Turnout 2 Miles”
74.6 W 1-4R and W 13-1
Reverse Curve and Advisory Speed Plaque
30” x 30”
18” x 18”
74.1 W 7-1b and (?)
Steep Hill with Grade and Supplemental Plaque 30” x 30”
74.9 W 1-2L and W 13-1
Curve to the Left with Advisory Speed Plate
30” x 30”
18” x 18”
Western Transportation Institute 27

GYRITS Appendix A
ApproximateMilepost MUTCD Description Standard
Dimensions Picture
74.8 “Brake Cooling Turnout 1 Mile”
74.6 W 1-2R and W 13-1
Curve to the Right with Advisory Speed Plate
30” x 30”
18” x 18”
74.5 “Next 10 Miles Steep Grade Sharp Curves Use Low Gear”
74.2 W 1-2R and W 13-1
Curve to the Right with Advisory Speed Plate
30” x 30”
18” x 18”
74.1 “Brake Cooling Turnout ½ Mile”
74.0 W 1-5 and W 13-1
Winding Road with Advisory Speed Plate
30” x 30”
18” x 18”
73.95 “Warning 10% Grade Sharp Curves
Next 9 Miles All Trucks RVs Vehicles with Trailers Use Lower Gear”
73.9 “Brake Cooling Turnout”
Western Transportation Institute 28

GYRITS Appendix A
ApproximateMilepost MUTCD Description Standard
Dimensions Picture
73.8 “All Vehicles Use Lower Gear”
73.7 W 7-1b and W 7-3a
Steep Hill with Grade and Supplemental Plaque
30” x 30” 18” x 24”
73.3 W 2-8R and W 13-1 U-Turn and Advisory Speed Plaque 30” x 30”
18” x 18”
73.2 W 7-4 Truck Escape Ramp 78” x 48”
73.1 W 2-8L and W 13-1 U-Turn and Advisory Speed Plaque 30” x 30”
18” x 18”
72.9 “Next 8 Miles Steep Grade Sharp Curves Use Low Gear”
72.8 “End Scenic Byway Medicine Wheel Passage”
72.8 W 1-2R and W 13-1
Curve to the Right with Advisory Speed Plate
30” x 30” 18” x 18”
Western Transportation Institute 29

GYRITS Appendix A
ApproximateMilepost MUTCD Description Standard
Dimensions Picture
72.7 W 7-4 Truck Escape Ramp 78” x 48”
72.5 W 2-8L and W 13-1 U-Turn and Advisory Speed Plaque
30” x 30”
18” x 18”
72.3 W 7-1b and Steep Hill with Grade and Supplemental Plaque 30” x 30”
72.2 W 2-8L and W 13-1 U-Turn and Advisory Speed Plaque 30” x 30”
18” x 18”
72.1 W 7-4b Truck Escape Ramp
72.1 Truck Ramp
71.95 W 1-5 and W 13-1
Winding Road with Advisory Speed Plate
30” x 30” 18” x 18”
Western Transportation Institute 30

GYRITS Appendix A
ApproximateMilepost MUTCD Description Standard
Dimensions Picture
71.7 W 7-4 Truck Escape Ramp 78” x 48”
71.5 W 7-1b and W 7-3a
Steep Hill with Grade and Supplemental Plaque
30” x 30” 18” x 24”
71.2 W 7-4 Truck Escape Ramp 78” x 48”
71.2 W 1-5 and W 13-1
Winding Road with Advisory Speed Plate
30” x 30” 18” x 18”
71.0 W 7-1b and Steep Hill with Grade and Supplemental Plaque 30” x 30”
71.0 Descriptive History
70.8 W 7-4b Truck Escape Ramp
70.7 Construction Road Damage with Advisory Speed Plaque
30” x 30” 18” x 18”
Western Transportation Institute 31

GYRITS Appendix A
ApproximateMilepost MUTCD Description Standard
Dimensions Picture
70.6 W 1-2R and W 13-1
Curve to the Right with Advisory Speed Plate
30” x 30” 18” x 18”
70.1 “Next 6 Miles Steep Grade Sharp Curves Use Low Gear”
70.0 W 1-4R and W 13-1
Reverse Curve and Advisory Speed Plaque
30” x 30” 18” x 18”
69.9 W 7-1b and Steep Hill with Grade and Supplemental Plaque 30” x 30”
69.3 W 1-5 Winding Road 30” x 30”
68.5 (?) and
W 7-3a
“Winding Road Ahead” with Supplemental Plaque
30” x 30” 18” x 24”
68.5 W 7-1b and W 7-3a
Steep Hill with Grade and Supplemental Plaque
30” x 30” 18” x 24”
68.4 Variable Message Sign
Western Transportation Institute 32

GYRITS Appendix A
ApproximateMilepost MUTCD Description Standard
Dimensions Picture
68.1 “Curves Ahead 35 mph”
68.0 W 7-1b and Steep Hill with Grade and Supplemental Plaque 30” x 30”
67.4 W 7-1b and W 7-3a
Steep Hill with Grade and Supplemental Plaque
30” x 30” 18” x 24”
67.1 W 1-2R and W 13-1
Curve to the Right with Advisory Speed Plate
30” x 30” 18” x 18”
67.0 W 7-1b and W 7-3a
Steep Hill with Grade and Supplemental Plaque 30” x 30”
66.5 W 1-2L and W 13-1
Curve to the Left with Advisory Speed Plate
30” x 30” 18” x 18”
66.4 W 7-1b and W 7-3a
Steep Hill with Grade and Supplemental Plaque
30” x 30” 18” x 24”
Western Transportation Institute 33

GYRITS Appendix A
ApproximateMilepost MUTCD Description Standard
Dimensions Picture
66.0 W 7-1b and (?)
Steep Hill with Grade and Supplemental Plaque 30” x 30”
65.4 W 7-1b and W 7-3a
Steep Hill with Grade and Supplemental Plaque
30” x 30”
18” x 24”
Western Transportation Institute 34

GYRITS Appendix B
8. APPENDIX B: FHWA CLASSIFICATION SCHEME F
Class 1 – Motorcycles. This class includes all two- or three-wheeled motorized vehicles. These vehicles typically have a saddle-type of seat and are steered by handlebars rather than a steering wheel. This includes motorcycles, motor scooter, mopeds, motor-powered bicycles and three-wheel motorcycles.
Class 2 – Passenger cars. This class includes all sedans, coupes and station wagons manufactured primarily for the purpose of carrying passengers, including those pulling recreational or other light trailers.
Class 3 – Pickups, Vans, and other 2-axle, 4-tire single unit vehicles. This class includes all two-axle, four tire vehicles other than passenger cars, which includes pick-ups, vans, campers, small motor homes, ambulances, minibuses and carryalls. These types of vehicles that are pulling recreational or other light trailers are included.
Class 4 – Buses. This class includes all vehicles manufactured as traditional passenger-carrying buses with two axles and six tires or three or more axles. This includes only traditional buses, including school and transit buses, functioning as passenger-carrying vehicles. All two-axle, four tire minibuses should be classified as Class 3. Modified buses should be considered to be trucks and classified appropriately.
Class 5 – Two-Axle, Six-Tire Single Unit Trucks. This class includes all vehicles on a single frame that have two axles and dual rear tires. This includes trucks, camping and recreation vehicles, motor homes, etc.
Class 6 – Three-Axle Single Unit Trucks. This class includes all vehicles on a single frame that have three axles. This includes trucks, camping and recreation vehicles, motor homes, etc.
Class 7 – Four or More Axle Single Unit Trucks. This class includes all vehicles on a single frame with four or more axles.
Class 8 – Four or Less Axle Single Trailer Trucks. This class includes all vehicles with four or less axles consisting of two units, in which the pulling unit is a tractor or single unit truck.
Class 9 – Five-Axle Single Trailer Trucks. This class includes all five-axle vehicles consisting of two units in which the pulling unit is a tractor or single unit truck.
Class 10 – Six or More Axle Single Trailer Trucks. This class includes all vehicles with six or more axles consisting of two units in which the pulling unit is a tractor or since unit truck.
Class 11 – Five or Less Axle Multi-Trailer Trucks. This class includes all vehicles with five or less axles consisting of three or more units in which the pulling unit is a tractor or single unit truck.
Western Transportation Institute 35

GYRITS Appendix B
Class 12 – Six-Axle Multi-Trailer Trucks. This class includes all six-axle vehicles consisting of three or more units in which the pulling unit is a tractor or single unit truck.
Class 13 – Seven or More Axle Multi-Trailer Trucks. This class includes all vehicles with seven or more axles consisting of three or more units in which the pulling unit is a tractor or single unit truck.
Western Transportation Institute 36

GYRITS Appendix C
9. APPENDIX C: MOTORIST SURVEY
The following mail back survey was distributed to Motorists on Highway 14A.
Western Transportation Institute 37

GYRITS Appendix C
Western Transportation Institute 416 Cobleigh Hall, PO Box 173910 MSU • Bozeman Bozeman, MT 59717-0398 Telephone (406) 994-6114 Fax (406) 994-1697
July 11, 2002
Dear Highway User:
Dynamic warning signs are being introduced along highways throughout the nation to improve motorist safety. These signs have changeable messages; attempting to supply accurate and dynamic information pertaining to road conditions and major weather events. A dynamic warning sign was placed on Highway 14A east of Lovell to warn motorists of curves in the roadway.
In order to determine the effectiveness of these signs, we are conducting a survey of motorists using Highway 14A.
Your opinions about the variable message sign on Highway 14-A are extremely important in helping in the direction of future usage of these types of systems. Responses are used for research purposes and are completely confidential. Please complete the entire questionnaire and return it by the July 18th deadline.
Thank you for your participation!
Sincerely,
Patrick McGowen
Western Transportation Institute 38

GYRITS Appendix C
Western Transportation Institute 39

GYRITS Appendix C
Western Transportation Institute 40

GYRITS Appendix D
10. APPENDIX D: BROCHURE
The following brochure was given to motorists who asked for further information about the project.
Western Transportation Institute 41