Public Information Centre #2 Wellington Master Servicing ...

Greater Wellington Regional Council - Public Web Map Application
Overview
This application is a web mapping application for use by anyone who wishes to view map information for the Wellington Region. For example, you can
search for addresses or resource consents, assess natural hazards in your area, look at outdoor opportunities in the regional parks, or review natural
resource plans which affect the region.
Greater Wellington Regional Council promotes Quality for Life by ensuring our environment is protected while meeting the economic, cultural and social
needs of the community. Our specific responsibilities include environment management, flood protection and land management, provision of regional
parks, public transport planning and funding, and metropolitan water supply.
The maps consist of a basemap (e.g. aerial photos) overlain by a set of overlay layers. Map overlays are grouped by theme, and a switcher button
allows you to move between collections of themes. The application is usually accessed from the Map Gallery page (URL http://mapping.gw.govt.nz/gwrc/)
The application is compatible with all modern web browsers including browsers on mobile devices.

Screen layout
Zoom In / Out
Previous/Next Extent
Home View
Centre at GPS
location (mobile
devices only)
Address search
Tool Bar (widgets)
Table view handle
Overview map arrow
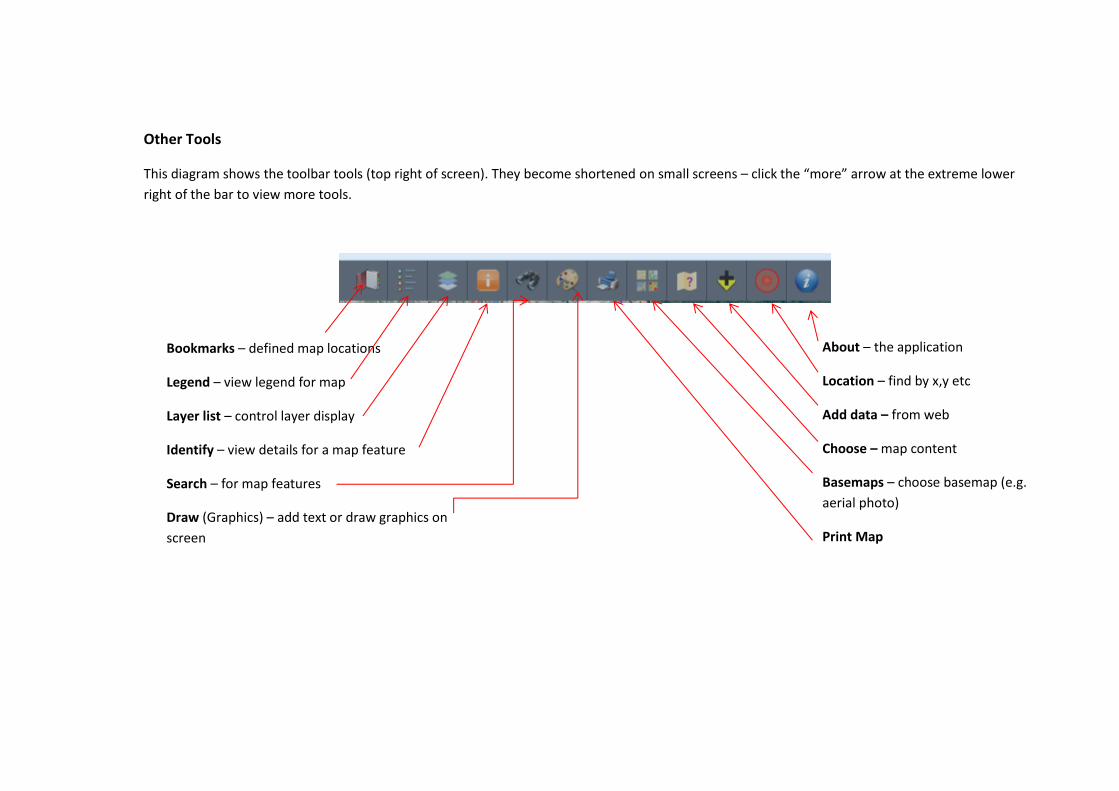
Other Tools
This diagram shows the toolbar tools (top right of screen). They become shortened on small screens – click the “more” arrow at the extreme lower
right of the bar to view more tools.
Bookmarks – defined map locations
Legend – view legend for map
Layer list – control layer display
Identify – view details for a map feature
Search – for map features
Draw (Graphics) – add text or draw graphics on
screen
About – the application
Location – find by x,y etc
Add data – from web
Choose – map content
Basemaps – choose basemap (e.g.
aerial photo)
Print Map

Layer Tools
Each layer can be expanded in the Layer list to provide more details.
Clicking on the “…” symbol next to a layer name in the Layer list will open a context menu, as shown below.
Click here to cause descriptive pop-ups to appear when
you click on a map feature in this layer
Open a view of the attribute table associated with this
layer
Open a new browser tab showing a description of the layer
Click here to expand the layer details to show sublayers
and symbology
A downward pointer indicates that the layer is fully
expanded.
Clicking in a tick box shows the layer on the map (as long
as the parent layer is also ticked).

Table View
Clicking on the Table View handle (centre bottom of map screen) or using the “Open Attribute Table” layer option shows the Table View, as below.
The Table View shows the records associated with each map layer. By default, the “Filter by Map Extent” option is turned on (so only features in the
current map extent appear as records in the Table View).
You can click on the box at the extreme left of a record to highlight or “select” it. This highlights the record(s) and associated map feature(s) in blue.
The “Zoom To” option will then zoom to the map extent for the selected feature.

Show only Selected Records in the Table View
Apply a filter (see below for dialog)
Show/Hide table columns
Export table data to CSV format (e.g. to use in Excel)
The Filter Dialog
Choose “Add a filter expression”
Then choose an attribute field name, then a query term,
e.g. locality is Waikanae Beach
This will filter layer data in the table and map views to only
show features matching the expression.
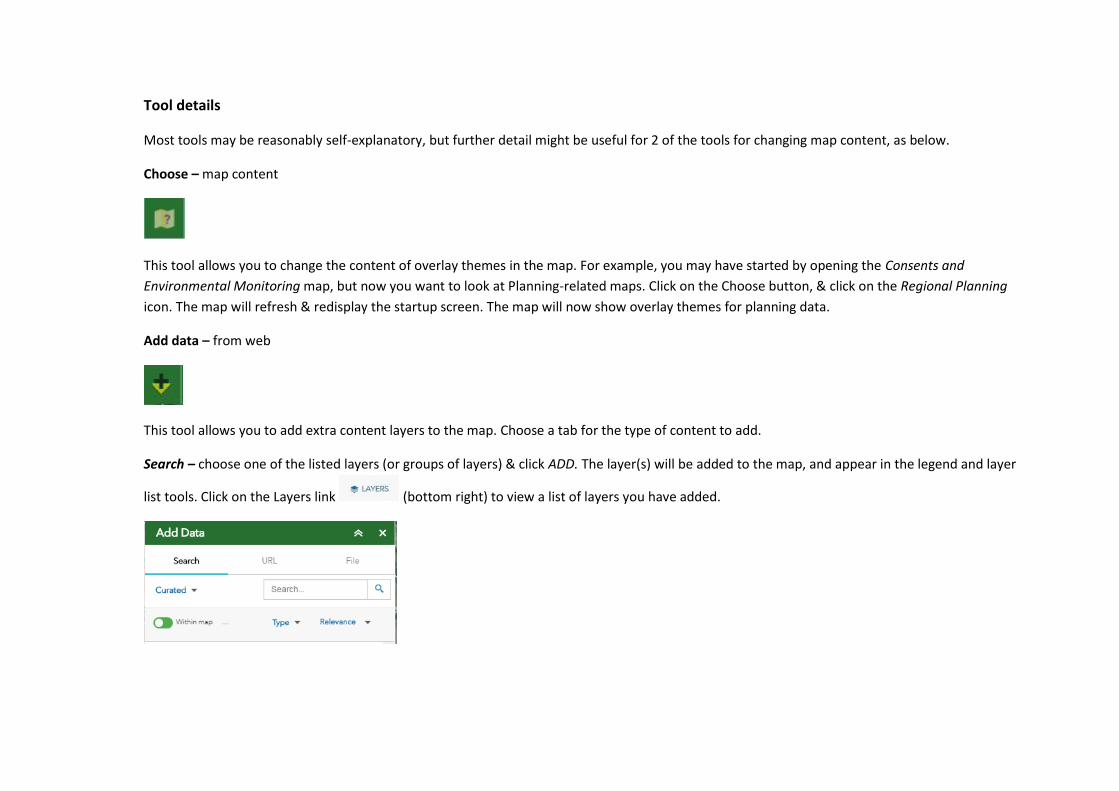
Tool details
Most tools may be reasonably self-explanatory, but further detail might be useful for 2 of the tools for changing map content, as below.
Choose – map content
This tool allows you to change the content of overlay themes in the map. For example, you may have started by opening the Consents and
Environmental Monitoring map, but now you want to look at Planning-related maps. Click on the Choose button, & click on the Regional Planning
icon. The map will refresh & redisplay the startup screen. The map will now show overlay themes for planning data.
Add data – from web
This tool allows you to add extra content layers to the map. Choose a tab for the type of content to add.
Search – choose one of the listed layers (or groups of layers) & click ADD. The layer(s) will be added to the map, and appear in the legend and layer
list tools. Click on the Layers link (bottom right) to view a list of layers you have added.

URL – enter a URL for a layer that you wish to add to the map. For example, try a wind zones layer supplied by Hutt City Council. The URL is
http://gisweb.huttcity.govt.nz/arcgis/rest/services/Online/Wind_Zones/MapServer.
File – drag and drop a zipped file, or browse for a file on your computer, to add as a layer to your map. For example, imagine you want to know
about lightning groundstrikes in the Wellington City area. You can source this data from MfE at their Data Service site :
https://data.mfe.govt.nz/layer/3558-lightning-groundstrikes-by-region/
Follow the URL link in your browser. Add this layer to the MfE Data Service map, set a crop area, and download, using default settings. This requires
a free registration to use the site. Save the downloaded zip file somewhere on your computer.
Return to the GWRC map site. Choose Add Data – File, click the Browse button, and locate the zip file & load it. Lightning strike points will appear in
your map as a new layer.
Copy and paste this URL text into the URL box on the tool, & click ADD. The layer is added to
the map (you may have to zoom in to make the layer visible).
You can also paste the URL text into the address bar of your browser. It will show an
information page describing the dataset.

Map Services
Clicking on the Layer “Description” option as in Layer Tools above shows a new browser page with details about the layer. The new page has a full
description of the web map service. The URL can be used to embed the map layers into other applications, e.g. ESRI ArcMap, or QGIS.
Data Content
The following major themes are available through the mapping application.
Base Information
Regional Planning
Addresses – all regional addresses, sourced from LINZ. Updated every 6 months.
Property Boundaries – Property boundaries, sourced from LINZ. Updated every 6 months.
Topographic information - roads, tracks, rail lines, streams, lakes etc
Data layers relating to regional plans administered by GWRC.
Proposed Natural Resources Plan 2015 – layers relating to the PNRP http://www.gw.govt.nz/quick-facts-
about-the-proposed-natural-resources-plan/
Regional Plans – Existing GWRC regional plan layers, for Coastal, Freshwater, Heritage, Regional Policy
Statement, Soil Plan, and Wairarapa Coastal Strategy http://www.gw.govt.nz/what-are-regional-plans/
Region Basemap – as for “Base Information” themes above
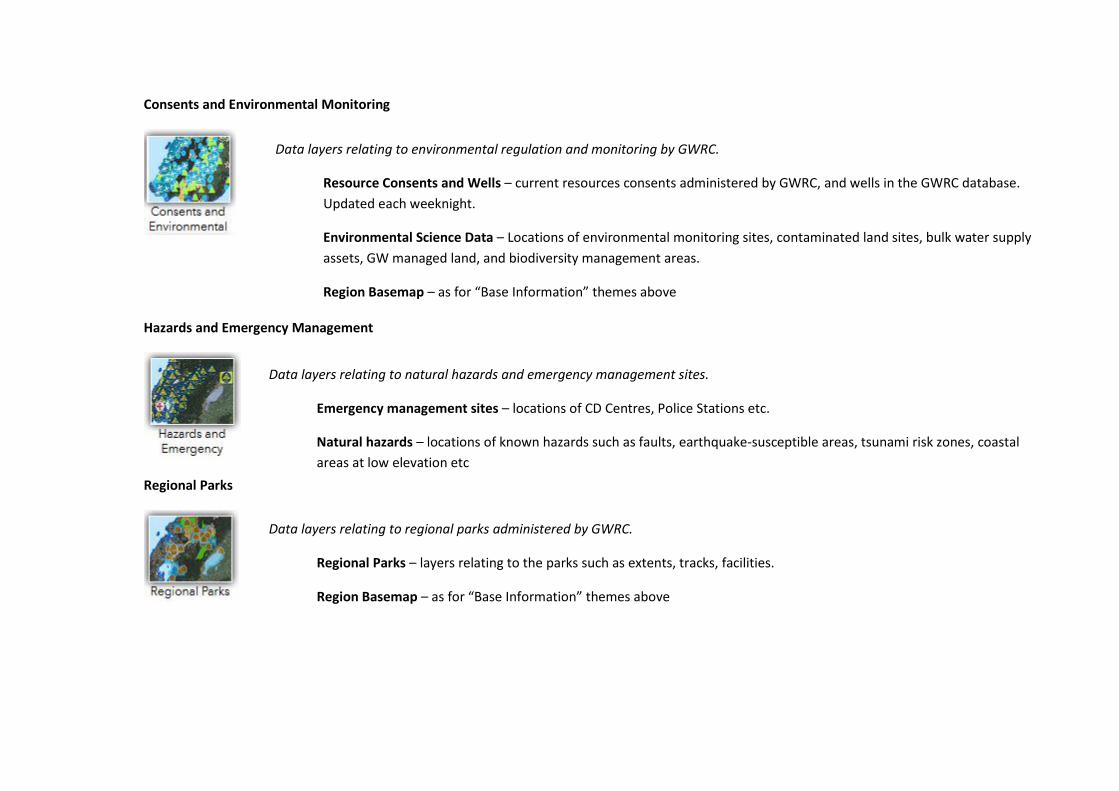
Consents and Environmental Monitoring
Hazards and Emergency Management
Regional Parks
Data layers relating to environmental regulation and monitoring by GWRC.
Resource Consents and Wells – current resources consents administered by GWRC, and wells in the GWRC database.
Updated each weeknight.
Environmental Science Data – Locations of environmental monitoring sites, contaminated land sites, bulk water supply
assets, GW managed land, and biodiversity management areas.
Region Basemap – as for “Base Information” themes above
Data layers relating to natural hazards and emergency management sites.
Emergency management sites – locations of CD Centres, Police Stations etc.
Natural hazards – locations of known hazards such as faults, earthquake-susceptible areas, tsunami risk zones, coastal
areas at low elevation etc
Region Basemap – as for “Base Information” themes above
Data layers relating to regional parks administered by GWRC.
Regional Parks – layers relating to the parks such as extents, tracks, facilities.
Region Basemap – as for “Base Information” themes above

Regional Environmental Data
Public Transport
Contacts
For queries about the application please contact :
[email protected] or call Ph: (04) 384 5708 or freephone 0800 496 734 or use our feedback form
Data layers relating to environmental data.
Environmental Data – land cover, soils, geology, land use, public lands, native fish habitat etc.
Region Basemap – as for “Base Information” themes above
Data layers relating to public transport.
Public Transport – locations of bus stops, bus routes, park-and-ride sites etc
Region Basemap – as for “Base Information” themes above