Greater Beirut Water Supply Project Quality...
35
Greater Beirut Water Supply Project: Independent Technical Review of Source Water Quality Final Report May 31, 2011 Dr. Jamie Bartram, Director of the Water Institute at UNC Joseph LoBuglio P.E. Created for the World Bank Sustainable Development Department Middle East and North Africa Region by the Water Institute at UNC
Transcript of Greater Beirut Water Supply Project Quality...
Greater Beirut Water Supply Project: Independent Technical Review of Source Water Quality
Final Report
May 31, 2011
Dr. Jamie Bartram, Director of the Water Institute at UNC
Joseph LoBuglio P.E.
Created for the World Bank Sustainable Development Department Middle East and North Africa Region by the Water Institute at UNC

Greater Beirut Water Supply Project: Independent Technical Review of Source Water Quality 1
SummaryandKeyFindings
Summary
The Water Institute at UNC was asked to provide an independent technical review concerning the
suitability of water in the Joun Reservoir as a source for a water treatment facility serving the Greater
Beirut area of Lebanon built as part of the Greater Beirut Water Supply Project (GBWSP). This review is
based on water quality data obtained from weekly samples taken over a one year period beginning April
2010, daily samples taken in April and May 2011, and historic water quality data. It is also informed by
an April 2011 site visit to Lebanon by a senior UNC water engineer, and on data obtained from the
Beirut Mount Lebanon Water Establishment (BMLWE), Litani River Authority (LRA), the Council for
Development and Reconstruction (CDR), and the Ministry of Environment (MOE).
As part of this review, the Water Institute was also asked to comment on the relevancy of the data for
helping solicit a design‐build‐operate (DBO) contract for the water treatment plant and to provide
operational recommendations as appropriate within existing project design and context.
Water available to the GBWSP is of sufficient quality such that conventional water treatment
technologies can produce potable water meeting Lebanese and international health‐ and aesthetic‐
based standards and guidelines. The available data will be an important input for those designing and
operating the water treatment plant.
The provision of high quality potable water to the end user depends not only on sound treatment plant
design and operation, but also on establishing a framework addressing water quality challenges present
from the catchment, through treatment, and conveyance of finished water to the point of supply, as is
done with water safety plans and other similar preventive management approaches.
KeyFindingsandAssumptions
Key findings
Microbial Water Quality. Water from Joun Reservoir is of sufficient quality such that
conventional water treatment technologies can produce potable water meeting Lebanese and
international health‐ and aesthetic‐based standards and guidelines. Although microbial
contamination exists in the source waters, standard water treatment should be able to reduce
contamination and result in product water meeting drinking water quality standards.
Pesticides and Organic Chemicals. Levels of pesticides and organic chemicals were consistently
below guidelines or limits of detection for all existing data. The dataset consists of four
sampling dates in 2010 and 2011 and five in 1999. Detectable levels present in one sample in
1999 were attributed to contamination from a hydroelectric plant that will be downstream of
the water treatment plant intake when operational. Should a need for treatment develop, a
variety of methods are available. Periodic monitoring for these parameters should continue as a
matter of good practice.

Greater Beirut Water Supply Project: Independent Technical Review of Source Water Quality 2
Heavy Metals. Data from eight measurements on samples from the Joun Reservoir taken
between 1999 and 2011 indicate that metals removal is not a high concern. No instances were
found of levels above the allowable maximum contaminant level. Metals are removed as part of
the conventional treatment process, which can be optimized should metals removal become a
concern.
Other Water Quality Parameters. Nitrite levels, turbidity, and color will have to be addressed
during treatment but are well within the limits of treatability. Nitrite levels can be addressed
through appropriate water treatment, for example oxidation via chlorination or ozonation.
Turbidity and color will also need to be addressed during treatment, but this is a common
challenge addressed with standard treatment processes. Lastly, fluoride levels are very low and
fluoridation should be considered as a public health measure to assist in control of dental
carries.
Source Water Protection. Understanding the effect of catchment activities on source water
quality and including water quality protection in the management plan for the watersheds will
help preserve source water quality into the future. The MOE Business Plan for Combating
Pollution of the Qaraoun Lake contains recommendations to protect the upper Litani River. Such
strategies should also be considered for other rivers in Lebanon, including the Awali River.
Design‐build‐operate Contracts. Consideration of the full range of treatment options is
important to the successful design and implementation of a water treatment facility. Design‐
build‐operate contracts provide one effective mechanism to achieve this. Competent oversight
of the process will be needed in order to evaluate proposals on a variety of parameters in
addition to capital costs, including treatment effectiveness, flexibility, operation and
maintenance cost, and robustness.
Key Assumptions
Available water quality data are representative of long‐term water quality. Comprehensive
sampling is available for only one year, with limited historic data and daily measurements.
Although the historic and recent datasets appear consistent, there is no assurance that the
inter‐year variability has been captured.
Efforts to improve source water quality will be implemented. The risk associated with the prior
assumption is ameliorated if concrete steps are taken towards source water protection.
Improving the water quality in the Litani River Basin has been an objective for many years.
Implementation of measures, such as those in the business plan for combating lake pollution, is
needed to assure water quality does not degrade and to reduce risk of water treatment upsets.
Greater Beirut Water Supply Project: Independent Technical Review of Source Water Quality 3
1.IntroductionA 250,000 cubic meter per day water treatment plant will be constructed as part of the Greater Beirut
Water Supply Project. Source water for this water treatment plant will be obtained from an intake
structure receiving water from the Joun Reservoir, a reservoir that is fed by the Litani River, which is
impounded upstream at Karoun Reservoir, two springs (near Jezzine and Ain Zarqa), and by the
Awali/Bisri River.
The objective of this technical review is to:
1) Review Joun Reservoir water quality data and assess its fitness as a source‐water for a water
treatment plant producing water meeting Lebanese and international health‐ and aesthetic‐based
guidelines.
2) Assess the value of having prior source water quality data prior to soliciting proposals for Design‐
Build‐Operate (DBO) contracts and the suitability of DBO contracts.
3) Generate other implementation/operational recommendations as appropriate within existing
project design and context.
1.1ProjectBackgroundAccording to the Awali‐Beirut Conveyor Project Feasibility Study Update1, the location of the water
treatment plant was chosen as the preferred option in 1994 and was judged to remain a viable option in
2010. This report mentions that past analyses of raw water quality (1968/1972, 1984, 1994/1995, and
2001) are either too old to be relevant to current conditions or limited either in the temporal
distribution of samples or the number of parameters measured. As a result, weekly sampling of a broad
set of parameters was undertaken by the BMLWE starting in April 2010, and has recently been
completed for a full calendar year, in order to capture levels, variability, and seasonal trends in water
quality.
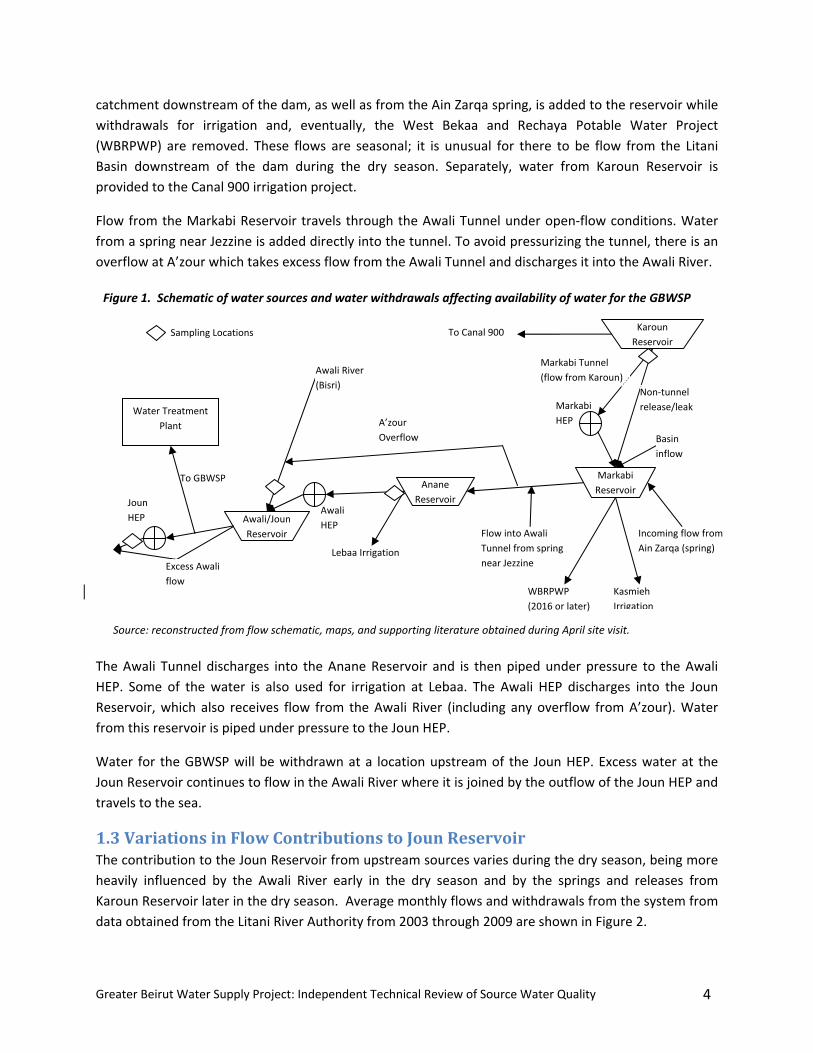
1.2DescriptionoftheSystemThe most proximate source of water for the drinking water treatment plant intake is the Joun Reservoir.
It receives water from a variety of sources that vary seasonally. During the wet season, water is
abundantly available from the Awali River and from springs near Jezzine and at Ain Zarqa, as well as
from the Litani River. The Karoun Reservoir2 is recharged during the wet season, which can reduce the
Litani River contribution. During the dry season, water originating from the Karoun Reservoir can make
up the majority of water entering Joun Reservoir. A schematic of the system is shown in Figure 1.
Water from Karoun Reservoir makes its way to Markabi Reservoir either through the tunnel and
Markabi hydroelectric plant (HEP) or through the Litani River downstream of the dam. Water from the
1 Awali‐Beirut Conveyor Project Feasibility Study Update: First Submission. Report for the Council of Development & Reconstruction, MWH ME Limited – Dubai Branch. April 2010
2There is no standard spelling of Karoun, which is alternately spelled Qaraoun and Karaoun, and which is referred to both as a lake and a reservoir.
Greater Beirut Water Supply Project: Independent Technical Review of Source Water Quality 4
catchment downstream of the dam, as well as from the Ain Zarqa spring, is added to the reservoir while
withdrawals for irrigation and, eventually, the West Bekaa and Rechaya Potable Water Project
(WBRPWP) are removed. These flows are seasonal; it is unusual for there to be flow from the Litani
Basin downstream of the dam during the dry season. Separately, water from Karoun Reservoir is
provided to the Canal 900 irrigation project.
Flow from the Markabi Reservoir travels through the Awali Tunnel under open‐flow conditions. Water
from a spring near Jezzine is added directly into the tunnel. To avoid pressurizing the tunnel, there is an
overflow at A’zour which takes excess flow from the Awali Tunnel and discharges it into the Awali River.
The Awali Tunnel discharges into the Anane Reservoir and is then piped under pressure to the Awali
HEP. Some of the water is also used for irrigation at Lebaa. The Awali HEP discharges into the Joun
Reservoir, which also receives flow from the Awali River (including any overflow from A’zour). Water
from this reservoir is piped under pressure to the Joun HEP.
Water for the GBWSP will be withdrawn at a location upstream of the Joun HEP. Excess water at the
Joun Reservoir continues to flow in the Awali River where it is joined by the outflow of the Joun HEP and
travels to the sea.
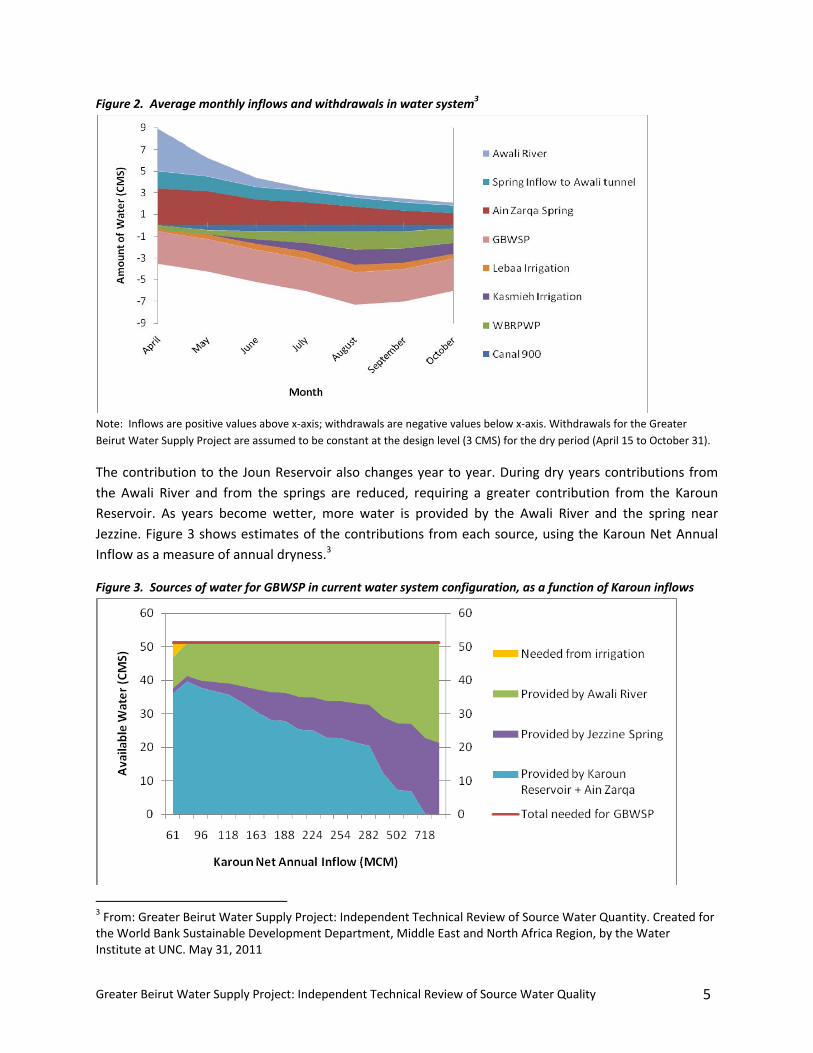
1.3VariationsinFlowContributionstoJounReservoirThe contribution to the Joun Reservoir from upstream sources varies during the dry season, being more
heavily influenced by the Awali River early in the dry season and by the springs and releases from
Karoun Reservoir later in the dry season. Average monthly flows and withdrawals from the system from
data obtained from the Litani River Authority from 2003 through 2009 are shown in Figure 2.
Anane
Reservoir
Markabi
Reservoir
Awali/Joun
Reservoir
Karoun
Reservoir
Markabi Tunnel
(flow from Karoun)
Incoming flow from
Ain Zarqa (spring)
Flow into Awali
Tunnel from spring
near Jezzine
Non‐tunnel
release/leak
Basin
inflow
Markabi
HEP A’zour
Overflow
Awali River
(Bisri)
Joun
HEP Awali
HEP
To GBWSP
WBRPWP
(2016 or later)
Lebaa Irrigation
Kasmieh
Irrigation
Excess Awali
flow
To Canal 900
Source: reconstructed from flow schematic, maps, and supporting literature obtained during April site visit.
Figure 1. Schematic of water sources and water withdrawals affecting availability of water for the GBWSP
Water Treatment
Plant
Sampling Locations
Greater Beirut Water Supply Project: Independent Technical Review of Source Water Quality 5
Figure 2. Average monthly inflows and withdrawals in water system3
Note: Inflows are positive values above x‐axis; withdrawals are negative values below x‐axis. Withdrawals for the Greater
Beirut Water Supply Project are assumed to be constant at the design level (3 CMS) for the dry period (April 15 to October 31).
The contribution to the Joun Reservoir also changes year to year. During dry years contributions from
the Awali River and from the springs are reduced, requiring a greater contribution from the Karoun
Reservoir. As years become wetter, more water is provided by the Awali River and the spring near
Jezzine. Figure 3 shows estimates of the contributions from each source, using the Karoun Net Annual
Inflow as a measure of annual dryness.3
Figure 3. Sources of water for GBWSP in current water system configuration, as a function of Karoun inflows
3 From: Greater Beirut Water Supply Project: Independent Technical Review of Source Water Quantity. Created for the World Bank Sustainable Development Department, Middle East and North Africa Region, by the Water Institute at UNC. May 31, 2011
Greater Beirut Water Supply Project: Independent Technical Review of Source Water Quality 6
2.0SourceWaterData
2.1DescriptionofDatasets2.1.1 Beirut Water & Mount Lebanon Quality Management Central Laboratory in Dbayeh
As recommended in the Awali‐Beirut Conveyor Project Feasibility Study Update, microbial and chemical
analysis of weekly samples began on 20 April 2010 and is ongoing. The data used in this review cover
one year, ending in 26 April 2011 and are from samples from the Joun Reservoir, Awali/Bisri River,
Anane Reservoir, and Karoun Reservoir. Weekly analyses did not include heavy metals or complex
chemicals such as pesticides or volatile organics. A time series of the data for the Joun Reservoir and box
plots of the data for all sample sites are plotted in Annex 1.
On two days (03 June 2010 and 11 May 2010) samples from the four sites were analyzed for 82 complex
chemicals including pesticides, volatile organics, semi‐volatile organics, and organo‐halides. The May
sample was analyzed for heavy metals.
2.1.2 American University of Beirut
Because source water quality is typically measured daily for an active water treatment plant, daily water
samples from the Joun Reservoir were analyzed for microbial contamination and basic water quality
characteristics for approximately 31 days in April and May of 2011. Data were also obtained at the three
other locations mentioned in section 2.1.1 at less frequent intervals. Analysis for heavy metals was
performed on samples from all locations twice during this period (20 April and 27 April) and analysis for
complex chemicals was performed on one sample from each location on 20 April.4
2.1.3 Draft Business Plan for Combating Pollution of the Qaraoun Lake
The United Nations Development Program funded a MOE report for improving the water quality of
water flowing into Karoun Reservoir.5 This report summarizes sources of pollution in the upper Litani
Basin as well as the results of water quality testing in Karoun Reservoir from 16 reports dated between
2000 and 2011, including the February 2011 report of the Litani River Basin Management Support
Program.6
2.1.4 Raw Water Monitoring Report
This report presents data collected by Montgomery Watson in 1999 as requested by CDR. The report
sampled near the four sites described in section 2.1.1 four times in 1999. Only the samples from the
Joun Reservoir were analyzed for the suite of 93 elements and compounds while the remaining samples
were used only when a particular chemical was detected, in which case the samples from the other
three sites were tested only for the constituents that were detected in the Joun sample.
4 Testing frequency depends on many factors. Common practice is to monitor for microbial contamination in product water daily and to test for metals and complex chemical contaminants several times a year. 5 Business Plan for Combating Pollution of the Qaraoun Lake (LB‐EQM‐UND‐CPQ‐10): Progress Report II: Draft Business Plan. Submitted 05 April 2011. Prepared by Earth Link and Advanced Resources Development S.A.R.L. (ELARD), Submitted to the United Nations Development Program (UNDP). 6 Litani River Basin Management Support Program Water Quality Survey (Summer 2010), Volumes 1 and 2. USAID – Lebanon. February 2011
Greater Beirut Water Supply Project: Independent Technical Review of Source Water Quality 7
2.1.5 Water Establishment for Beirut & Mount Lebanon Chemical Analysis
The Water Establishment had samples collected on 14 March 2011 just upstream of the Joun Reservoir
(from Lake Anan and the Awali River) and the Joun Reservoir analyzed for 11 heavy metals, 16 complex
compounds (including pesticides), and cyanide.
2.2SummaryofDataThe data from the weekly microbial and chemical analysis for Joun reservoir is plotted in Annex 1 of this
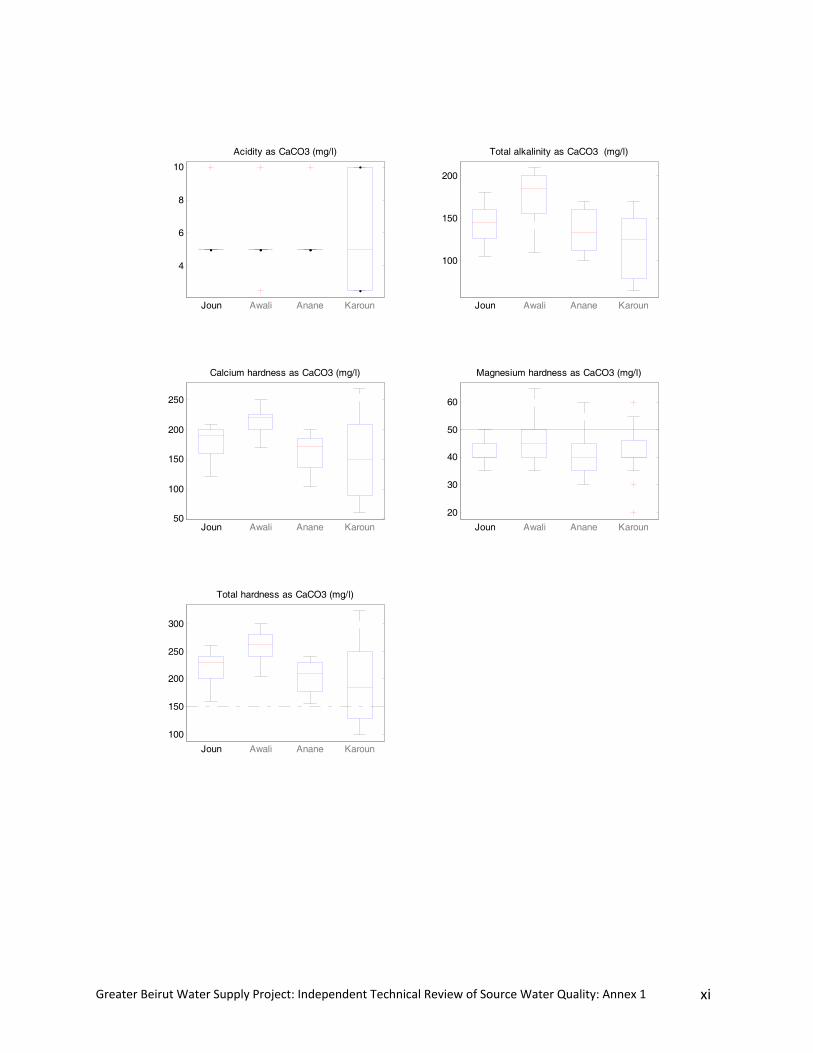
report and is summarized in Table 1. Box plots of the data for the four sampling locations (Joun, Anane,
and Karoun reservoirs plus the Awali River) show values from the four locations to be generally
equivalent.
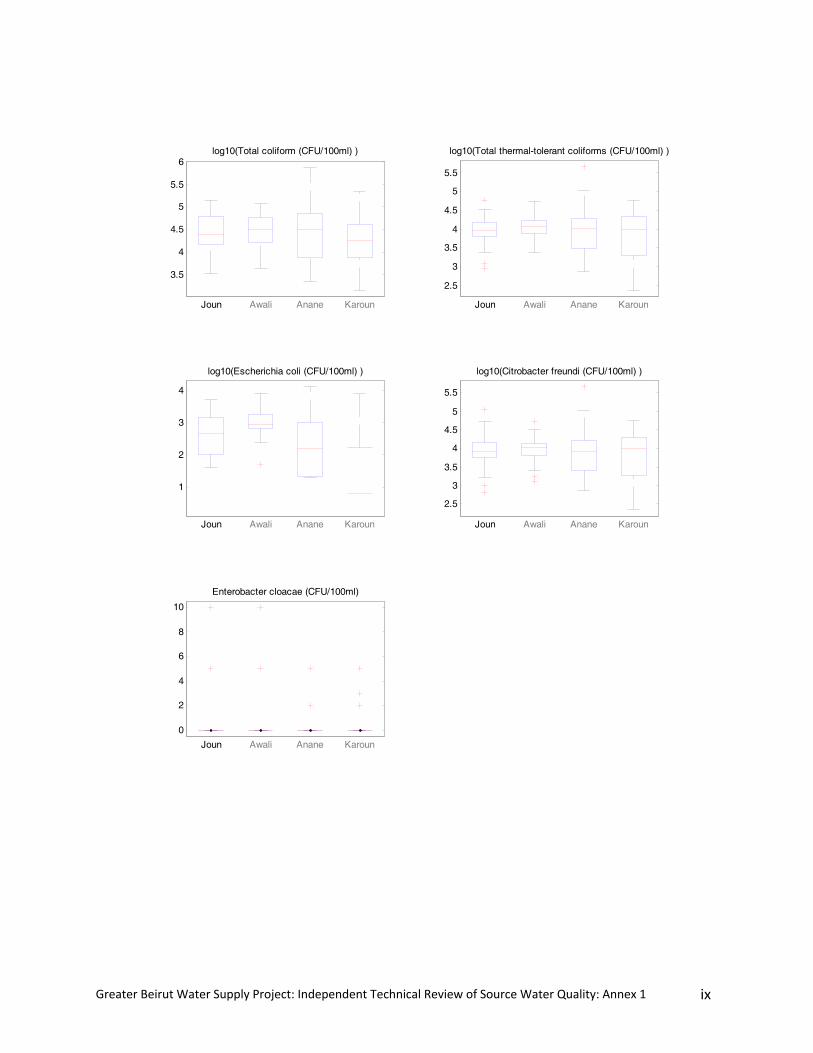
2.2.1 Microbiological Data
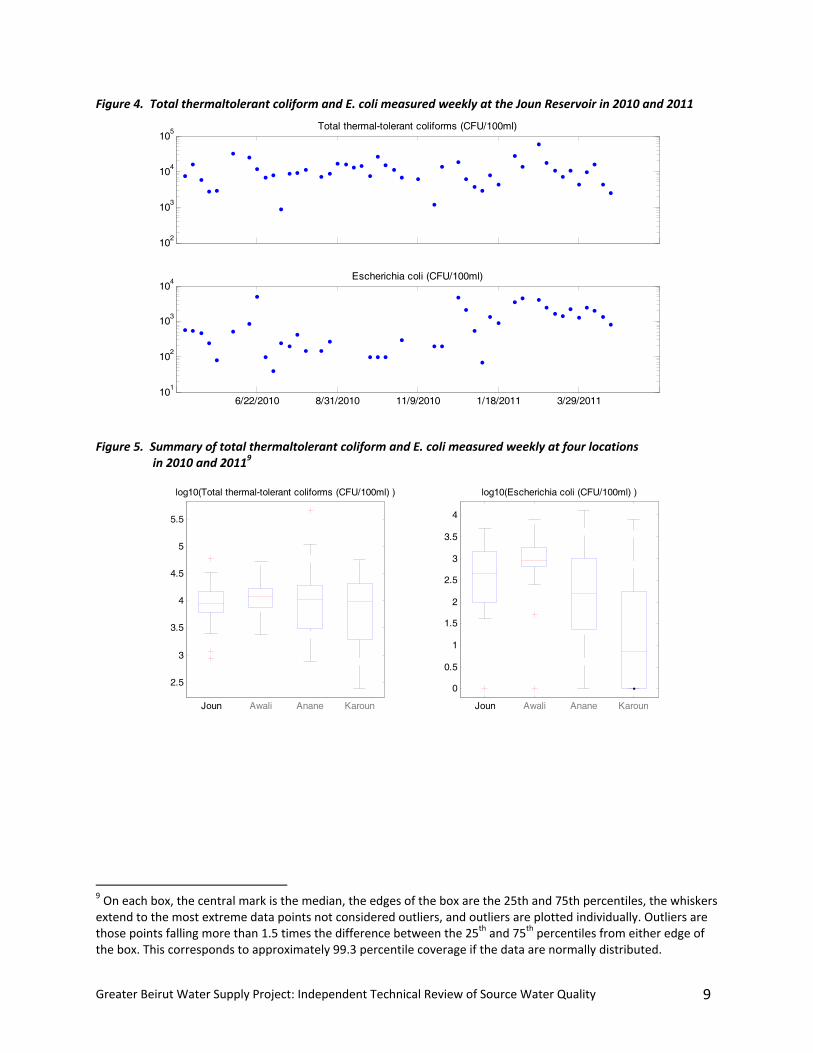
Levels of bacteria are typical for agricultural and developed areas, with high levels seen when
precipitation is present and basin activities are high. Measurements of the most common indicator
bacteria, total thermotolerant coliform (sometimes referred to as fecal coliform) and E. coli, from the
weekly sampling are presented in Figure 4.
Figure 5 presents a summary of the same data for the four sampling locations, showing the median and
range of the data. The data on total coliform are consistent between locations. There is greater
variability in the E. coli data although it is not extreme. This is reassuring as this means the quality of the
water in the Joun Reservoir does not depend greatly on the original source of the water.
The E. coli values measured in the Karoun Reservoir samples are substantially lower than at the other
three sampling locations, with many values being zero; this is in contrast with the reputation of Karoun
Reservoir as a highly impaired water body.
Assuming the data are correct (Karoun samples were measured concurrently with the other samples)
this could be explained by the Karoun Reservoir acting as a settling basin where E. coli numbers are
reduced by settling and by die‐off. It is unclear why the trend is less pronounced with total
thermotolerant coliform, although this might reflect the fact that the total thermotolerant coliform
measurement includes multiple species of bacteria (of which E. coli is one) and thus encompass the
variation in characteristics affecting settling and die‐off as well as the presence of environmental
sources.
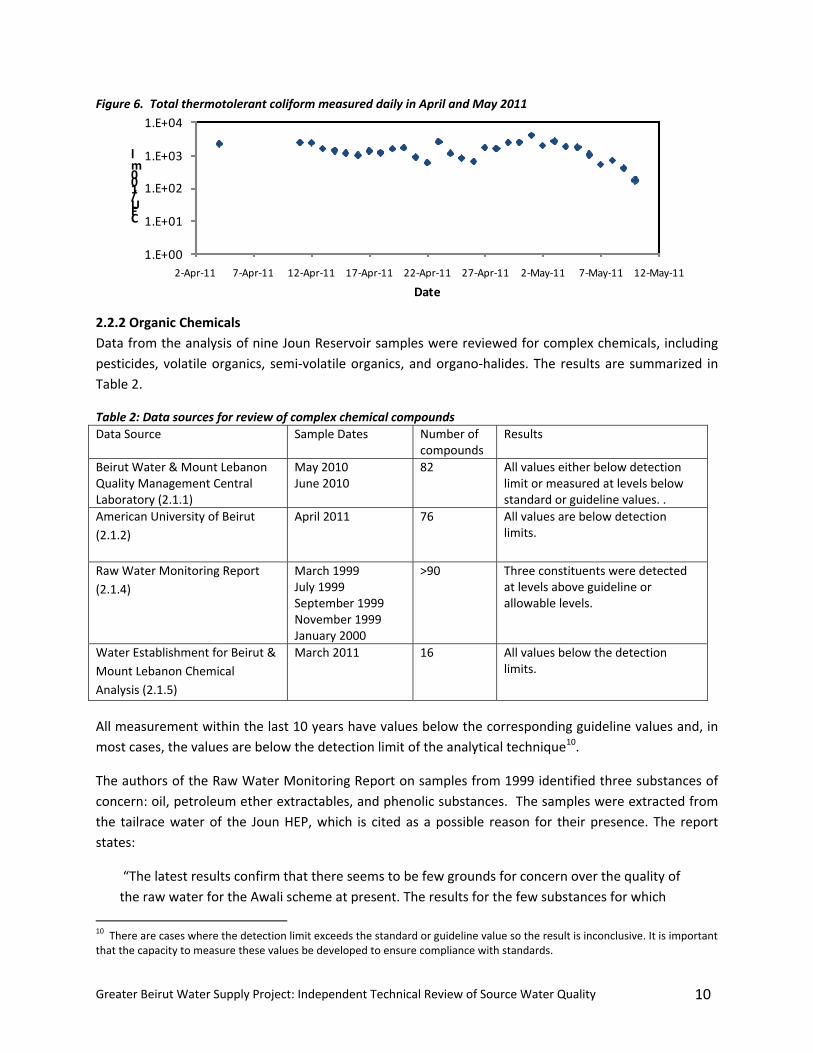
The results of the daily sampling (Figure 6) for Joun Reservoir fall within the range observed weekly over
the prior year. The observed variation in the daily data indicate that, for this period, weekly sampling
would have captured similar information as is present in the daily samples.
Greater Beirut Water Supply Project: Independent Technical Review of Source Water Quality 8
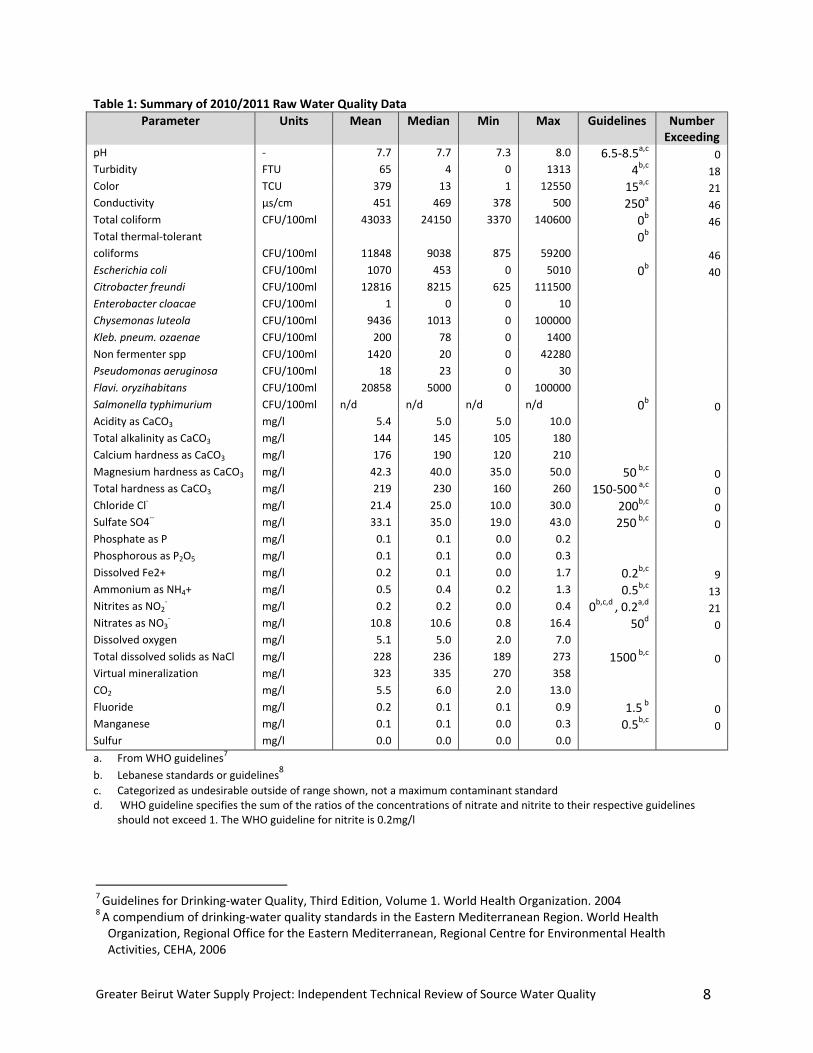
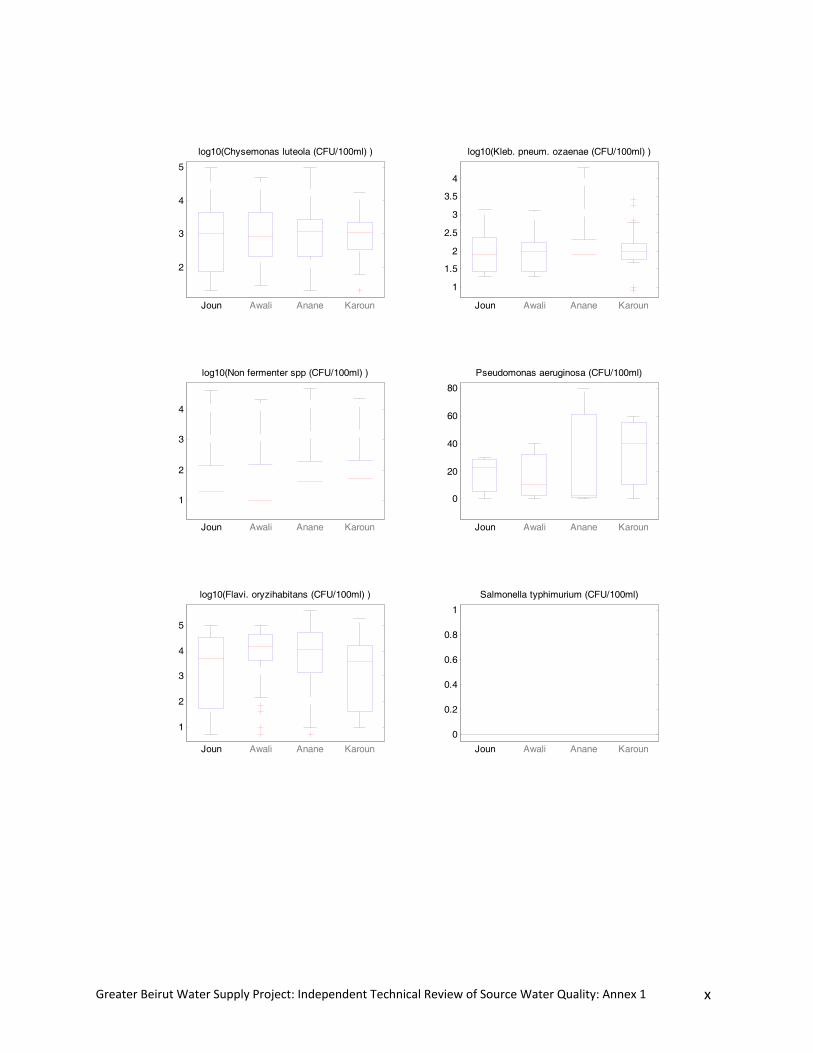
Table 1: Summary of 2010/2011 Raw Water Quality Data
Parameter Units Mean Median Min Max Guidelines Number Exceeding
pH ‐ 7.7 7.7 7.3 8.0 6.5‐8.5a,c 0 Turbidity FTU 65 4 0 1313 4b,c 18 Color TCU 379 13 1 12550 15a,c 21 Conductivity µs/cm 451 469 378 500 250a 46 Total coliform CFU/100ml 43033 24150 3370 140600 0b 46 Total thermal‐tolerant
coliforms CFU/100ml 11848 9038 875 59200
0b
46 Escherichia coli CFU/100ml 1070 453 0 5010 0b 40 Citrobacter freundi CFU/100ml 12816 8215 625 111500 Enterobacter cloacae CFU/100ml 1 0 0 10 Chysemonas luteola CFU/100ml 9436 1013 0 100000 Kleb. pneum. ozaenae CFU/100ml 200 78 0 1400 Non fermenter spp CFU/100ml 1420 20 0 42280 Pseudomonas aeruginosa CFU/100ml 18 23 0 30 Flavi. oryzihabitans CFU/100ml 20858 5000 0 100000 Salmonella typhimurium CFU/100ml n/d n/d n/d n/d 0b 0 Acidity as CaCO3 mg/l 5.4 5.0 5.0 10.0 Total alkalinity as CaCO3 mg/l 144 145 105 180 Calcium hardness as CaCO3 mg/l 176 190 120 210 Magnesium hardness as CaCO3 mg/l 42.3 40.0 35.0 50.0 50 b,c 0 Total hardness as CaCO3 mg/l 219 230 160 260 150‐500 a,c 0 Chloride Cl‐ mg/l 21.4 25.0 10.0 30.0 200b,c 0 Sulfate SO4‐‐ mg/l 33.1 35.0 19.0 43.0 250 b,c 0 Phosphate as P mg/l 0.1 0.1 0.0 0.2 Phosphorous as P2O5 mg/l 0.1 0.1 0.0 0.3 Dissolved Fe2+ mg/l 0.2 0.1 0.0 1.7 0.2b,c 9 Ammonium as NH4+ mg/l 0.5 0.4 0.2 1.3 0.5b,c 13 Nitrites as NO2
‐ mg/l 0.2 0.2 0.0 0.4 0b,c,d , 0.2a,d 21 Nitrates as NO3
‐ mg/l 10.8 10.6 0.8 16.4 50d 0 Dissolved oxygen mg/l 5.1 5.0 2.0 7.0 Total dissolved solids as NaCl mg/l 228 236 189 273 1500 b,c 0 Virtual mineralization mg/l 323 335 270 358 CO2 mg/l 5.5 6.0 2.0 13.0 Fluoride mg/l 0.2 0.1 0.1 0.9 1.5 b 0 Manganese mg/l 0.1 0.1 0.0 0.3 0.5b,c 0 Sulfur mg/l 0.0 0.0 0.0 0.0
a. From WHO guidelines7
b. Lebanese standards or guidelines8
c. Categorized as undesirable outside of range shown, not a maximum contaminant standard d. WHO guideline specifies the sum of the ratios of the concentrations of nitrate and nitrite to their respective guidelines
should not exceed 1. The WHO guideline for nitrite is 0.2mg/l
7 Guidelines for Drinking‐water Quality, Third Edition, Volume 1. World Health Organization. 2004 8 A compendium of drinking‐water quality standards in the Eastern Mediterranean Region. World Health Organization, Regional Office for the Eastern Mediterranean, Regional Centre for Environmental Health Activities, CEHA, 2006
Greater Beirut Water Supply Project: Independent Technical Review of Source Water Quality 9
Figure 4. Total thermaltolerant coliform and E. coli measured weekly at the Joun Reservoir in 2010 and 2011
6/22/2010 8/31/2010 11/9/2010 1/18/2011 3/29/2011 10
1
102
103
104
Escherichia coli (CFU/100ml)
102
103
104
105
Total thermal-tolerant coliforms (CFU/100ml)
Figure 5. Summary of total thermaltolerant coliform and E. coli measured weekly at four locations in 2010 and 20119
0
0.5
1
1.5
2
2.5
3
3.5
4
Joun Awali Anane Karoun
log10(Escherichia coli (CFU/100ml) )
2.5
3
3.5
4
4.5
5
5.5
Joun Awali Anane Karoun
log10(Total thermal-tolerant coliforms (CFU/100ml) )
9 On each box, the central mark is the median, the edges of the box are the 25th and 75th percentiles, the whiskers extend to the most extreme data points not considered outliers, and outliers are plotted individually. Outliers are those points falling more than 1.5 times the difference between the 25th and 75th percentiles from either edge of the box. This corresponds to approximately 99.3 percentile coverage if the data are normally distributed.
Greater Beirut Water Supply Project: Independent Technical Review of Source Water Quality 10
Figure 6. Total thermotolerant coliform measured daily in April and May 2011
1.E+00
1.E+01
1.E+02
1.E+03
1.E+04
2‐Apr‐11 7‐Apr‐11 12‐Apr‐11 17‐Apr‐11 22‐Apr‐11 27‐Apr‐11 2‐May‐11 7‐May‐11 12‐May‐11
CFU/100 ml
Date
2.2.2 Organic Chemicals
Data from the analysis of nine Joun Reservoir samples were reviewed for complex chemicals, including
pesticides, volatile organics, semi‐volatile organics, and organo‐halides. The results are summarized in
Table 2.
Table 2: Data sources for review of complex chemical compounds
Data Source Sample Dates Number of compounds
Results
Beirut Water & Mount Lebanon Quality Management Central Laboratory (2.1.1)
May 2010June 2010
82 All values either below detection limit or measured at levels below standard or guideline values. .
American University of Beirut
(2.1.2)
April 2011 76 All values are below detection limits.
Raw Water Monitoring Report
(2.1.4)
March 1999July 1999 September 1999 November 1999 January 2000
>90 Three constituents were detectedat levels above guideline or allowable levels.
Water Establishment for Beirut &
Mount Lebanon Chemical
Analysis (2.1.5)
March 2011 16 All values below the detection limits.
All measurement within the last 10 years have values below the corresponding guideline values and, in
most cases, the values are below the detection limit of the analytical technique10.
The authors of the Raw Water Monitoring Report on samples from 1999 identified three substances of
concern: oil, petroleum ether extractables, and phenolic substances. The samples were extracted from
the tailrace water of the Joun HEP, which is cited as a possible reason for their presence. The report
states:
“The latest results confirm that there seems to be few grounds for concern over the quality of
the raw water for the Awali scheme at present. The results for the few substances for which
10 There are cases where the detection limit exceeds the standard or guideline value so the result is inconclusive. It is important that the capacity to measure these values be developed to ensure compliance with standards.
Greater Beirut Water Supply Project: Independent Technical Review of Source Water Quality 11
additional testing was called for are summarized in Table 1 below [not reproduced here]. It can
be seen from this table that the upstream samples do not confirm the presence of the
substances detected in the tail race of the Charles Helou HEPS. It therefore seems probable that
the levels of Oil, Petroleum Ether Extractables, and Phenolic Substances found there are the
result of contamination from the HEPS itself.”
The four most recent samples occur in April through June 2011. Although these samples indicate
contaminant levels are likely low, samples should be routinely collected throughout the year (at least
quarterly) to verify compliance with standards and guidelines.
2.2.3 Heavy Metals
Eight samples from the Joun Reservoir were analyzed for heavy metals. Four of these samples occurred
in March through May and the other samples were taken throughout the year. Values, shown in Table 3,
were generally below the detection limit while those present at measurable levels were below the
maximum standard or guideline value. Samples analyzed from the other three sites on 11 May 2010, 20
April 2011, and 27 April 2011 showed similar levels, all of which were below the maximum contaminant
level.
Table 3: Results of heavy metals analysis of Joun Reservoir Samples Metal MCL
(mg/L) source of MCL
Raw Water Monitoring Report (2.1.4) AUB 2010 (2.1.1)
AUB 2011(2.1.2)
18 Mar 99 07 Jul 99 04 Oct 99 01 Nov 99 07 Jan 00 11 May 10 20 Apr 11 27 Apr 11
Antimony 0.01 a <0.0004 <0.0004 0.0026 <0.0004 <0.0004 <0.002 <0.002
Arsenic 0.05 a <0.0004 0.0004 0.0007 0.0008 <0.0004 <0.002 <0.002
Barium 0.7 b <0.0004 <0.004 <0.004 <0.004 <0.004 0.02 0.018
Beryllium 0.004 c <0.002 <0.002
Cadmium 0.005 a <0.0005 <0.0005 <0.0005 0.0006 <0.0005 <0.002 <0.002 <0.002
Chromium 0.05 a 0.0009 <0.0006 <0.0006 0.0014 0.0006 <0.002 <0.002 <0.002
Copper 2 b 0.003 <0.002 <0.002
Lead 0.05 a <0.003 <0.001 <0.001 0.002 <0.001 <0.002 <0.002 <0.002
Mercury 0.001 a <0.00005 <0.00005 <0.00005 <0.00005 0.00027 0.0007 <0.0005 <0.0005
Selenium 0.01 a <0.0008 <0.001 0.001 <0.001 <0.001 <0.002 <0.002
Thallium 0.002 c <0.002 <0.002
a) Lebanon Drinking Water standard, b) WHO drinking water guideline (no Lebanese standard), c) USEPA (no Lebanese or WHO standard)
During the April 2011 site visit, a concern was raised that the Joun Reservoir water quality would be
compromised with heavy metals during the dry season when the Karoun Reservoir becomes a major
source of water. In response, water quality data from the MOE Draft Business Plan for Combating
Pollution of the Qaraoun Lake was reviewed (see section 2.1.3) for heavy metals.
Because the Karoun Reservoir acts as a settling basin, especially during the dry season when inflows are
very low, water quality varies from the inlet from the Litani River to the dam. Because water is
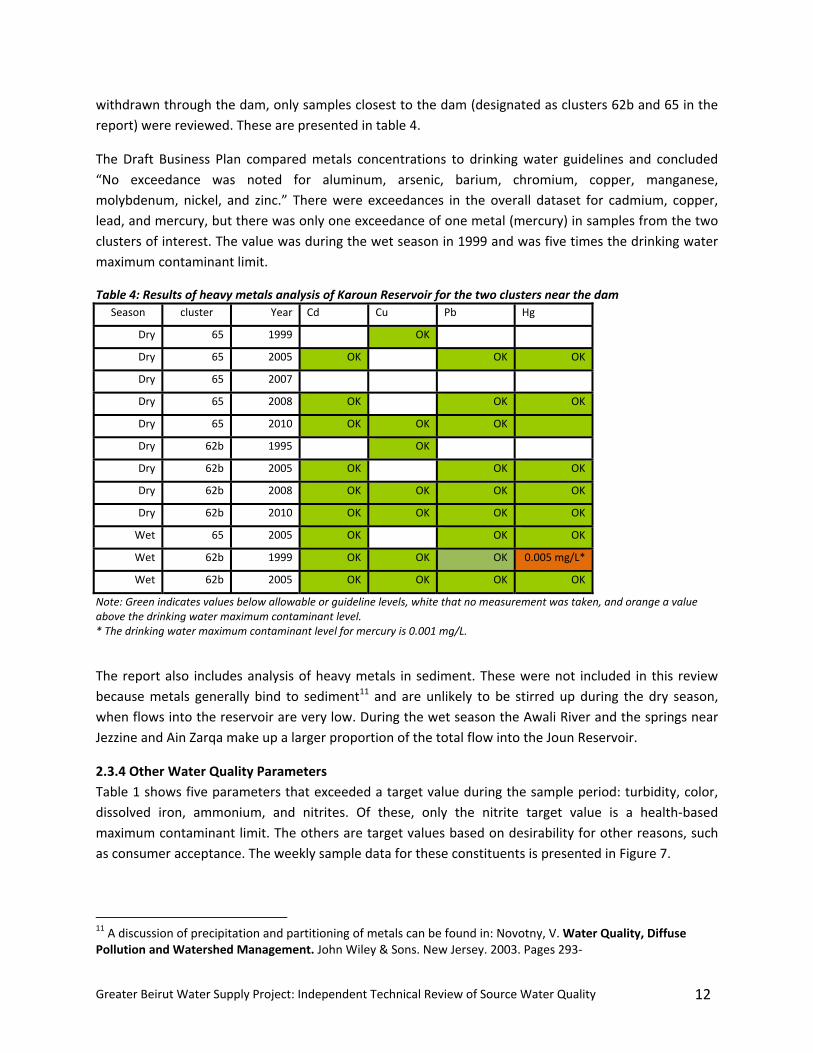
Greater Beirut Water Supply Project: Independent Technical Review of Source Water Quality 12
withdrawn through the dam, only samples closest to the dam (designated as clusters 62b and 65 in the
report) were reviewed. These are presented in table 4.
The Draft Business Plan compared metals concentrations to drinking water guidelines and concluded
“No exceedance was noted for aluminum, arsenic, barium, chromium, copper, manganese,
molybdenum, nickel, and zinc.” There were exceedances in the overall dataset for cadmium, copper,
lead, and mercury, but there was only one exceedance of one metal (mercury) in samples from the two
clusters of interest. The value was during the wet season in 1999 and was five times the drinking water
maximum contaminant limit.
Table 4: Results of heavy metals analysis of Karoun Reservoir for the two clusters near the dam
Season cluster Year Cd Cu Pb Hg
Dry 65 1999 OK
Dry 65 2005 OK OK OK
Dry 65 2007
Dry 65 2008 OK OK OK
Dry 65 2010 OK OK OK
Dry 62b 1995 OK
Dry 62b 2005 OK OK OK
Dry 62b 2008 OK OK OK OK
Dry 62b 2010 OK OK OK OK
Wet 65 2005 OK OK OK
Wet 62b 1999 OK OK OK 0.005 mg/L*
Wet 62b 2005 OK OK OK OK
Note: Green indicates values below allowable or guideline levels, white that no measurement was taken, and orange a value above the drinking water maximum contaminant level. * The drinking water maximum contaminant level for mercury is 0.001 mg/L.
The report also includes analysis of heavy metals in sediment. These were not included in this review
because metals generally bind to sediment11 and are unlikely to be stirred up during the dry season,
when flows into the reservoir are very low. During the wet season the Awali River and the springs near
Jezzine and Ain Zarqa make up a larger proportion of the total flow into the Joun Reservoir.
2.3.4 Other Water Quality Parameters
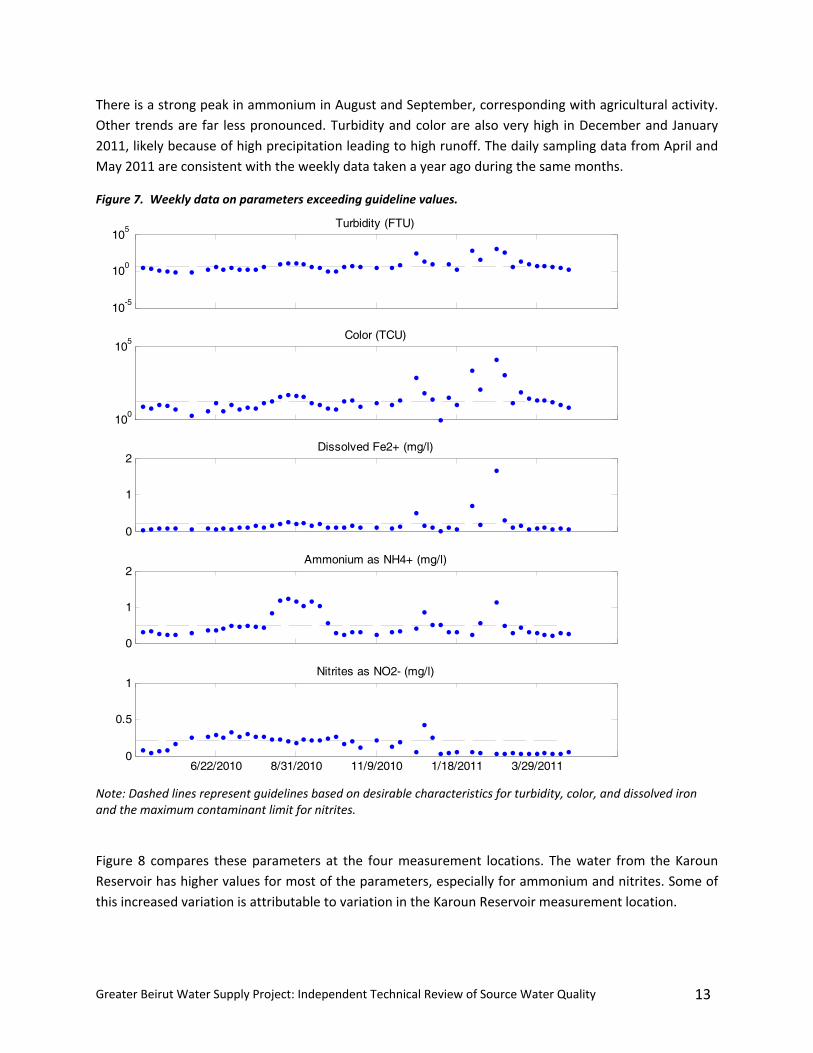
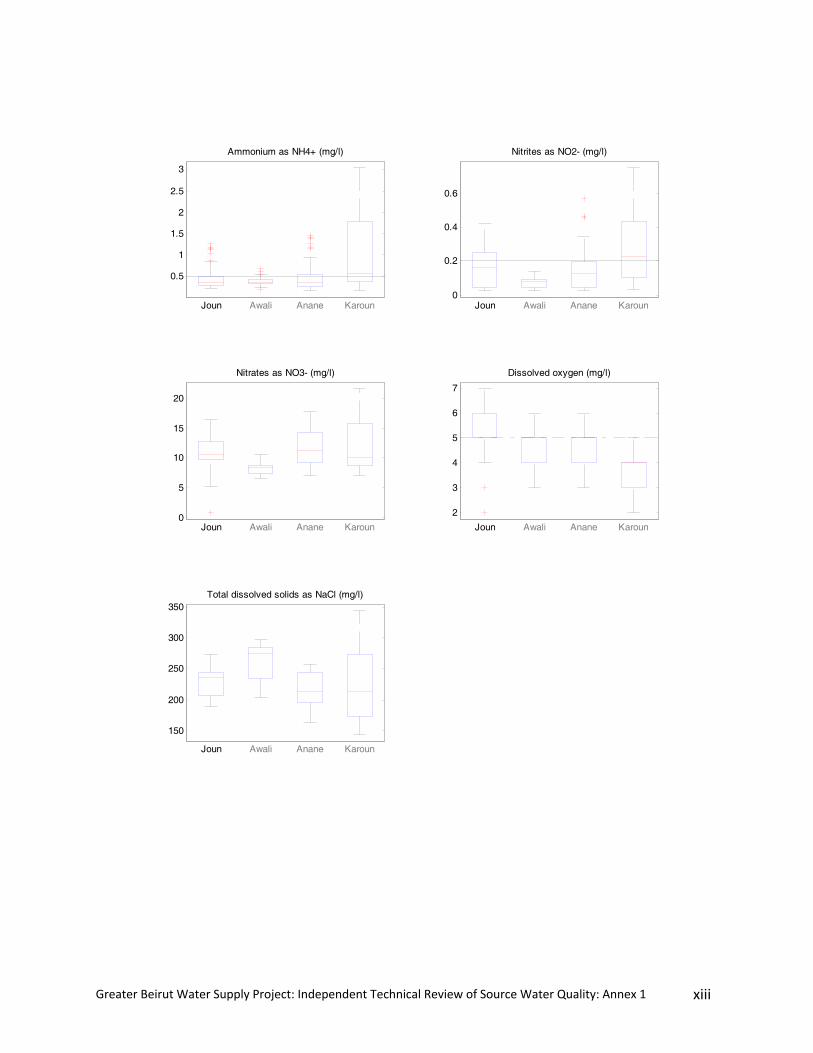
Table 1 shows five parameters that exceeded a target value during the sample period: turbidity, color,
dissolved iron, ammonium, and nitrites. Of these, only the nitrite target value is a health‐based
maximum contaminant limit. The others are target values based on desirability for other reasons, such
as consumer acceptance. The weekly sample data for these constituents is presented in Figure 7.
11 A discussion of precipitation and partitioning of metals can be found in: Novotny, V. Water Quality, Diffuse Pollution and Watershed Management. John Wiley & Sons. New Jersey. 2003. Pages 293‐
Greater Beirut Water Supply Project: Independent Technical Review of Source Water Quality 13
There is a strong peak in ammonium in August and September, corresponding with agricultural activity.
Other trends are far less pronounced. Turbidity and color are also very high in December and January
2011, likely because of high precipitation leading to high runoff. The daily sampling data from April and
May 2011 are consistent with the weekly data taken a year ago during the same months.
Figure 7. Weekly data on parameters exceeding guideline values.
6/22/2010 8/31/2010 11/9/2010 1/18/2011 3/29/2011 0
0.5
1Nitrites as NO2- (mg/l)
10-5
100
105
Turbidity (FTU)
100
105
Color (TCU)
0
1
2Dissolved Fe2+ (mg/l)
0
1
2Ammonium as NH4+ (mg/l)
Note: Dashed lines represent guidelines based on desirable characteristics for turbidity, color, and dissolved iron and the maximum contaminant limit for nitrites.
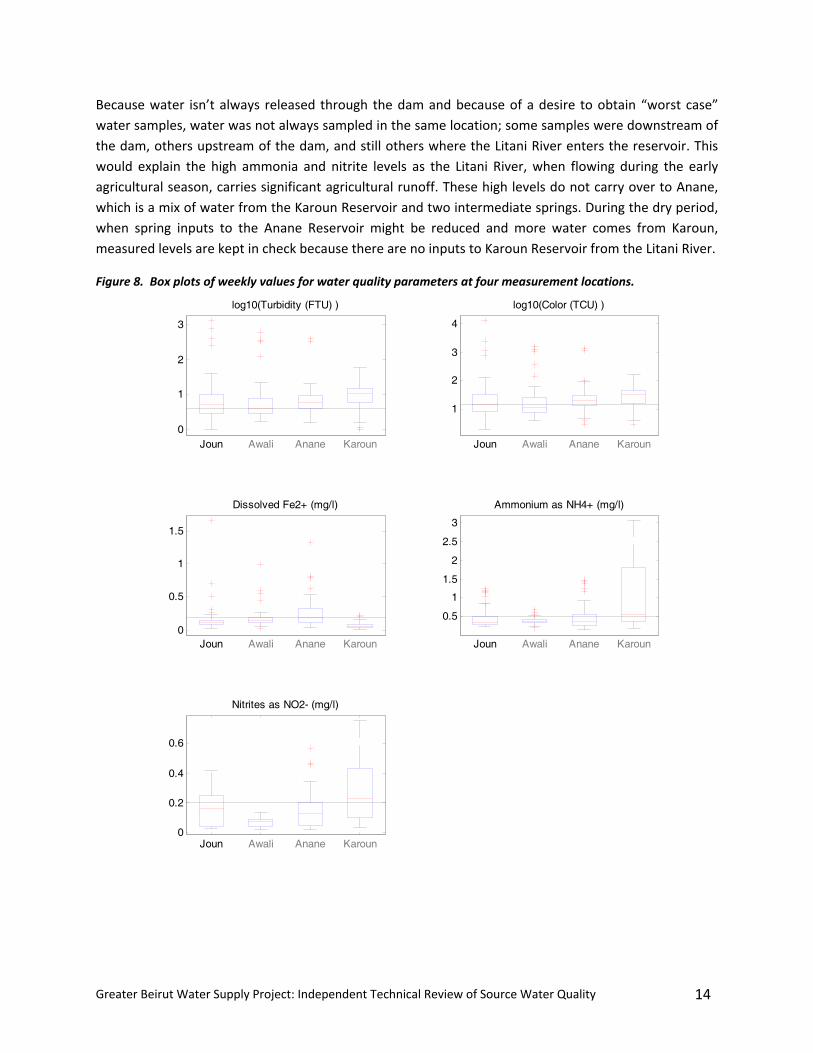
Figure 8 compares these parameters at the four measurement locations. The water from the Karoun
Reservoir has higher values for most of the parameters, especially for ammonium and nitrites. Some of
this increased variation is attributable to variation in the Karoun Reservoir measurement location.
Greater Beirut Water Supply Project: Independent Technical Review of Source Water Quality 14
Because water isn’t always released through the dam and because of a desire to obtain “worst case”
water samples, water was not always sampled in the same location; some samples were downstream of
the dam, others upstream of the dam, and still others where the Litani River enters the reservoir. This
would explain the high ammonia and nitrite levels as the Litani River, when flowing during the early
agricultural season, carries significant agricultural runoff. These high levels do not carry over to Anane,
which is a mix of water from the Karoun Reservoir and two intermediate springs. During the dry period,
when spring inputs to the Anane Reservoir might be reduced and more water comes from Karoun,
measured levels are kept in check because there are no inputs to Karoun Reservoir from the Litani River.
Figure 8. Box plots of weekly values for water quality parameters at four measurement locations.
0
0.2
0.4
0.6
Joun Awali Anane Karoun
Nitrites as NO2- (mg/l)
0
1
2
3
Joun Awali Anane Karoun
log10(Turbidity (FTU) )
1
2
3
4
Joun Awali Anane Karoun
log10(Color (TCU) )
0
0.5
1
1.5
Joun Awali Anane Karoun
Dissolved Fe2+ (mg/l)
0.5
1
1.5
2
2.5
3
Joun Awali Anane Karoun
Ammonium as NH4+ (mg/l)
Greater Beirut Water Supply Project: Independent Technical Review of Source Water Quality 15
3.0TreatabilityThe water quality data indicate that water from Joun Reservoir is of sufficient quality such that
conventional water treatment technologies can produce potable water meeting Lebanese and
international health‐ and aesthetic‐based standards and guidelines. The challenges for treating the raw
water appear typical of water impacted by agricultural and settled catchments.
3.2.1 Treatment for Microbiological Contamination
Microbial values, although high, are typically reduced by 99% during the first clarifying steps in water
treatment including processes such as coagulation, flocculation, and sedimentation.12, 13 These steps also
address turbidity and some color concerns. Disinfection through ozonation or chlorination (i.e., free
chlorine, monochloramine, chlorine dioxide) is effective at eliminating the remaining bacteria14.
Disinfection by free chlorine or chloramines is a common choice because they can also be used as
residual disinfectants in the drinking water distribution system. Residual disinfection provides partial
maintenance of water quality safety during transport.
The water samples were tested for bacteria. Other microbial threats, such as viruses and protozoan
cysts, were not measured. Chemical disinfection practices for bacteria are largely effective for viruses;
however, protozoan cysts (i.e., Giardia lamblia15, and Cryptosporidium parvum oocysts) may be orders
of magnitude more resistant to usual chlorine and monochloramine treatments. As a result, if
protozoan cysts were a concern in the source waters, UV light irradiation, or advanced filtration may
need to be considered as treatment options.
3.2.2 Organic Chemicals
Data on the organic compounds show virtually all measurements to be below the corresponding
guideline values and, in most cases, the values are below the detection limit of the analytical technique.
The most efficient strategy to protect drinking water quality is to implement strategies of source water
protection, such as those in the MOE Business Plan for Combating Pollution of the Qaraoun Lake. Should
a need for treatment develop in the future, a variety of methods are available including granular
activated carbon and air stripping.
3.2.3 Heavy Metals
The data presented in 2.2.3 show no instances of metals measured in samples from the Joun Reservoir
above the allowable maximum contaminant level. This alleviates concerns that extraordinary measures
will be needed to ensure relevant drinking water standards are met. Metals are removed as part of the
12 Water Treatment and Pathogen Control: Process Efficiency in Achieving Safe Drinking Water. Edited by Mark W LeChevallier
and Kwok‐Keung Au. Published by IWA Publishing, London, UK. 2004 13 Microfiltration is able to remove most bacteria. and removal effectiveness increases with smaller pore sizes found in ultra‐, nano‐, and reverse osmosis filters.13 14 Water Quality Treatment: A Handbook of Community Water Supplies. American Water Works Association. Fifth Edition.
McGRaw Hill. 1999. 15 Giardia infection can cause a variety of intestinal symptoms, which include diarrhea, gas or flatulence, greasy stool that can float, stomach or abdominal cramps, upset stomach or nausea, and dehydration.
Greater Beirut Water Supply Project: Independent Technical Review of Source Water Quality 16
conventional treatment process. Metals tend to associate with organic matter and other (negatively
charged) particles, and organic matter and particles are removed during coagulation + flocculation +
sedimentation + filtration (C+F+S+F), where one or more of those steps may not be used. As a result,
anything that is associated (attached) to the organic matter and particles are also removed with them
(i.e., the metals).
Watershed protection, as part of a comprehensive risk based water quality management strategy, is the
best way to ensure levels of metal remain low. Should levels become a concern, operations can be
optimized towards metal removal by adjusting C+F+S+F conditions that are the best compromise
between metal removal, turbidity, costs and other concerns.
3.2.4 Other Water Quality Parameters
Nitrite levels, turbidity, and color will have to be addressed during treatment. Lebanese guidelines
specify that any value of nitrite concentration above zero is undesirable. The WHO guideline value is
0.2mg/l for nitrite and 50 mg/l for nitrate with the caveat that nitrate and nitrite should be considered
together because of toxicological interaction; specifically that the sum of the ratio of concentrations of
nitrate and nitrite to their respective guidelines should not exceed 1. This sum in the raw water often
exceeds 1, but this can be addressed through appropriate water treatment. For example, nitrites can be
converted to nitrates through oxidation via chlorination or ozonation. Nitrate by itself is well below the
guideline value and is otherwise removable16.
Turbidity and color are typically largely improved during coagulation + flocculation + sedimentation +
filtration and are one of the primary inputs driving treatment control. However reducing these
parameters by source protection can be a more cost‐effective strategy as such practices improve the
quality of the source water generally. Best management practices, such as riverine buffer strips, soil
conservation practices, detention basins, and erosion management at construction sites are examples of
accepted methods of protecting ambient water quality.
According to the WHO Guidelines for Drinking‐water Quality, ammonia is not of direct relevance to
health at levels below the taste threshold (1.5 mg/liter for ammonia, 35 mg/liter for ammonium).
Observed values are below these levels.
Lastly, fluoride levels are very low and fluoridation should be considered as a public health measure to
assist in control of dental carries.
16 5 mg/l of nitrate should be achievable by using, for example, ion exchange. Biological denitrification is also a viable option in some settings.
Greater Beirut Water Supply Project: Independent Technical Review of Source Water Quality 17
4.0Design‐build‐operatecontractsConsideration of the full range of treatment options is important to the successful design and
implementation of a water treatment facility. Design‐build‐operate contracts provide one effective
mechanism to achieve this.
DBO contracts are a viable means of securing safe drinking water at the point of production. The year’s
worth of weekly data will be of great value in the development of an appropriate specification for the
DBO contract, and also to the firm ultimately charged with running the water treatment facility.
Competent oversight of the process will be needed in order to evaluate proposals on a variety of
parameters in addition to capital costs, including treatment effectiveness, flexibility, operation and
maintenance cost, and robustness to water quality variability.
Water treatment plant operations, and specifications for DBO contracts, typically focus on water quality
and quantity as the metrics of performance and this parallels the historic method of verifying
compliance with drinking‐water standards. Reliance on end‐of‐pipe testing and steady‐state
performance may be insufficient for health protection. Rather proactive preventive management,
failure‐mode analysis, and understanding of inter‐dependencies among processes are essential.
The incorporation of water safety plans in the 2004 WHO Guidelines for Drinking‐water Quality and,
subsequently, in national practice in many countries world‐wide reflects the evolution from output‐ to
input‐based approaches to ensuring safe water; that is from periodic assessment of the quality of
product water (end of pipe testing) to incorporation of a preventive risk management perspective by
complementing conventional monitoring with assessment of the adequacy of processes and procedures
to ensure the ongoing safety of drinking water. In cases where this has been done, compliance has
required verification that water safety plan procedures are in‐place through an independent audit,
either through a government regulatory body or a specifically‐constituted external review group.
The DBO contract should include responsibility for participating in a wider risk management strategy
with other participants overseeing the catchment and distribution systems, perhaps led by the Beirut
Mount Lebanon Water Establishment (BMLWE).
Greater Beirut Water Supply Project: Independent Technical Review of Source Water Quality 18
5.0ImplementationandOperationalRecommendationsA water treatment plant is one part of a system to ensure the provision of safe water. Robust delivery
requires protecting source water, effective process monitoring, and ensuring distribution of safe water
to the point of use. This has been reflected in the MOE Business Plan for Combating Pollution of the
Qaraoun Lake
Water safety plans and similar preventive management approaches use a risk‐based metric to prioritize
control measures and identify necessary monitoring and management strategies for source water, water
treatment, and water distribution.
5.1CatchmentmanagementExperience has shown the value of engagement with catchment users (agriculture, industry, human
settlement) in efforts to minimize the risks and costs associate with source water contamination. The
available data indicates current source water quality is sufficient to be treatable to meet drinking water
standards. Understanding the effect of catchment activities on source water quality and including water
quality protection in the management plan for the watersheds will help preserve source water quality
into the future by allowing the development of source protection strategies. For example, new
settlement or agricultural activities can be required to use best practices to prevent contamination and
to ensure continued water availability. Incentives or phased‐in regulation could be used to upgrade
existing land use practices.
5.2WaterconveyanceAs with any conveyance structure, recontamination is a possibility in the conveyance tunnel after water
treatment. Careful consideration of residence time, residual, and infiltration potential is needed to
ensure the water remains safe. Infiltration is a concern especially in tunnels that are not always fully
pressurized; residence time can be a concern if the capacity of the tunnel is based on future rates of
withdrawal.
In the short term, the GBWSP treated water tunnel will be operated intermittently because its carrying
capacity is well above the current water utilization rate, with the tunnel being at least partially empty at
times. This creates an opportunity for infiltration, the effects of which should be mitigated. Activities
with the potential to introduce contaminants into the conveyance tunnel should also be monitored and,
if necessary, controlled to protect both the groundwater near the tunnel and the risk of contamination
from infiltration. Routine analysis of the initial portion of water through the tunnel when flow resumes
would assist in assessing any concerns from infiltration. This concern will be far reduced in the future
when the tunnel is continuously pressurized.
Intermediate storage facilities need to be managed to ensure sufficiently short residence times. Water
quality can be monitored in these storage systems, but it is also necessary to ensure the stored water is
well mixed or, at the least, there are not regions of unmixed water remaining in storage for long periods
of time.
Greater Beirut Water Supply Project: Independent Technical Review of Source Water Quality 19
5.3WaterdistributionA rigorous system of codes covering the distribution system, storage, and piping internal to buildings
(between the point of delivery and the point of use) should be adhered to. Codes ensure adequate
design, materials and operation, reduce the potential for contamination from cross‐connections, and
create a culture of good practice. The Lebanese building code was not reviewed as part of this
assignment.
The maintenance of distribution pressure is critical. Leaks in distribution systems are unavoidable;
typical systems have leakage rates in excess of 15%. During low pressure events the sites of leaks
become areas where infiltration can occur. Low pressure events can also cause backflow in buildings,
leading to non‐potable water at higher elevations, or stored under pressure entering the internal
distribution system. Maintaining pressure should be achieved by a comprehensive leak management
program combined with ensuring adequate supply through sufficient drinking water production in
conjunction with appropriate conservation practices.
Joining old and new distribution systems can be a challenge as the path water flows can be complex.
“Legacy systems” are more likely to have problems with infiltration, dead‐end connections, and cross‐
connections and can have biological and physical impairments. Consideration should be given to
improving these legacy systems and ensuring that atypical flow patterns, which might occur during low
pressure events or transient pressure changes, do not result in contamination. The designs of the
distribution network were not reviewed as part of this assignment.
Greater Beirut Water Supply Project: Independent Technical Review of Source Water Quality: Annex 1 i
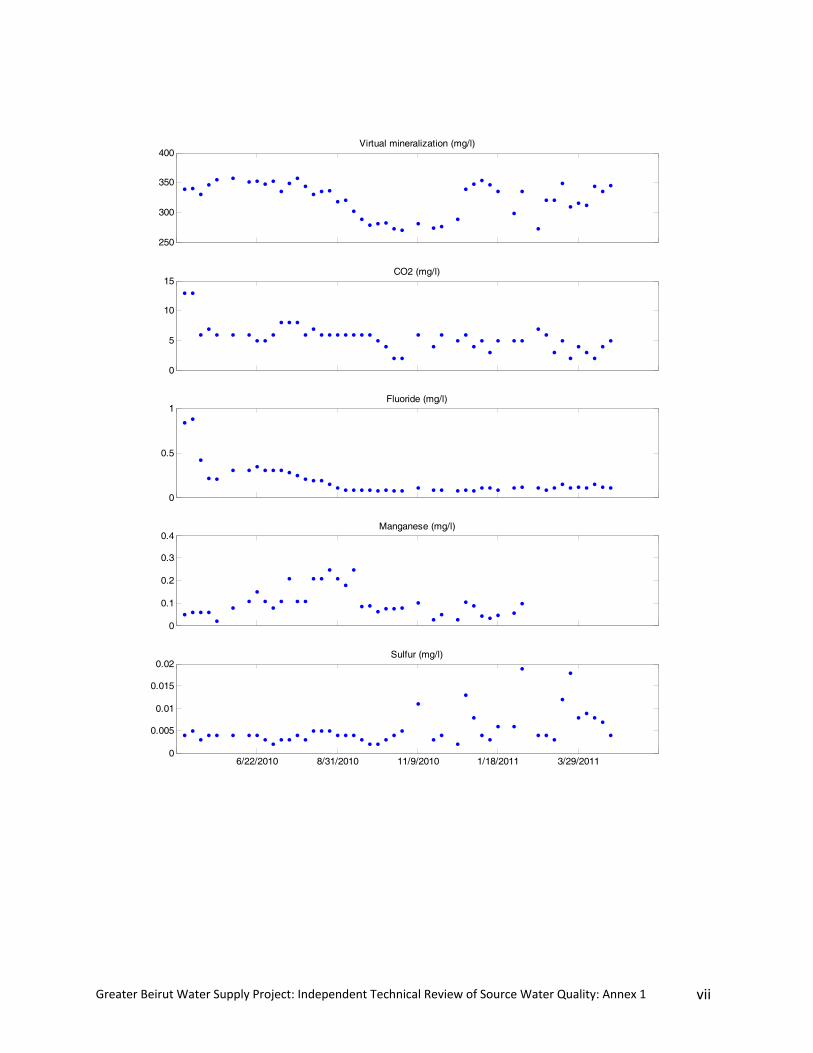
Annex1:DataSummaryMicrobial and chemical analysis of weekly samples beginning on 20 April 2010 and ending in 08 February
2011 from the Joun Reservoir were reviewed for this report. Data are missing for seven weeks within
this period: 24 May, 08 June, 10 August (bacteria missing), 01 November, 15 November, and 05
December in 2010, 24 January 2011 and 15 February 2011. The 09 November 2010 value for nitrate was
modified from the reported value of 1018 mg/l, more than 100 times any other value. The laboratory
has confirmed this to be a typographical error and that the correct value is 10.18 mg/l.
Time series plots of weekly results from Joun Reservoir samples.
6/22/2010 8/31/2010 11/9/2010 1/18/2011 3/29/2011 350
400
450
500Conductivity (us/cm)
7.2
7.4
7.6
7.8
8
8.2pH (-)
0
1000
2000Turbidity (FTU)
0
20
40
0
1
2x 10
4 Color (TCU)
0
100
200
Greater Beirut Water Supply Project: Independent Technical Review of Source Water Quality: Annex 1 ii
6/22/2010 8/31/2010 11/9/2010 1/18/2011 3/29/2011 0
5
10Enterobacter cloacae (CFU/100ml)
103
104
105
106
Total coliform (CFU/100ml)
102
103
104
105
Total thermal-tolerant coliforms (CFU/100ml)
101
102
103
104
Escherichia coli (CFU/100ml)
102
104
106
Citrobacter freundi (CFU/100ml)
Greater Beirut Water Supply Project: Independent Technical Review of Source Water Quality: Annex 1 iii
6/22/2010 8/31/2010 11/9/2010 1/18/2011 3/29/2011 0
0.5
1Salmonella typhimurium (CFU/100ml)
Non-detects
100
105
Chysemonas luteola (CFU/100ml)
100
102
104
Kleb. pneum. ozaenae (CFU/100ml)
100
105
Non fermenter spp (CFU/100ml)
0
10
20
30Pseudomonas aeruginosa (CFU/100ml)
Non-detects
100
105
Flavi. oryzihabitans (CFU/100ml)
Greater Beirut Water Supply Project: Independent Technical Review of Source Water Quality: Annex 1 iv
6/22/2010 8/31/2010 11/9/2010 1/18/2011 3/29/2011 150
200
250
300Total hardness as CaCO3 (mg/l)
4
6
8
10Acidity as CaCO3 (mg/l)
100
120
140
160
180Total alkalinity as CaCO3 (mg/l)
100
150
200
250Calcium hardness as CaCO3 (mg/l)
35
40
45
50Magnesium hardness as CaCO3 (mg/l)
Greater Beirut Water Supply Project: Independent Technical Review of Source Water Quality: Annex 1 v
6/22/2010 8/31/2010 11/9/2010 1/18/2011 3/29/2011 0
0.5
1
1.5
2Dissolved Fe2+ (mg/l)
10
15
20
25
30Chloride Cl- (mg/l)
10
20
30
40
50Sulfate SO4-- (mg/l)
0
0.1
0.2
0.3
0.4Phosphate as P (mg/l)
0
0.1
0.2
0.3
0.4Phosphorous as P2O5 (mg/l)
Greater Beirut Water Supply Project: Independent Technical Review of Source Water Quality: Annex 1 vi
6/22/2010 8/31/2010 11/9/2010 1/18/2011 3/29/2011 150
200
250
300Total dissolved solids as NaCl (mg/l)
0
0.5
1
1.5Ammonium as NH4+ (mg/l)
0
0.2
0.4
0.6
0.8Nitrites as NO2- (mg/l)
0
5
10
15
20Nitrates as NO3- (mg/l)
2
4
6
8Dissolved oxygen (mg/l)
Greater Beirut Water Supply Project: Independent Technical Review of Source Water Quality: Annex 1 vii
6/22/2010 8/31/2010 11/9/2010 1/18/2011 3/29/2011 0
0.005
0.01
0.015
0.02Sulfur (mg/l)
250
300
350
400Virtual mineralization (mg/l)
0
5
10
15CO2 (mg/l)
0
0.5
1Fluoride (mg/l)
0
0.1
0.2
0.3
0.4Manganese (mg/l)
Greater Beirut Water Supply Project: Independent Technical Review of Source Water Quality: Annex 1 viii
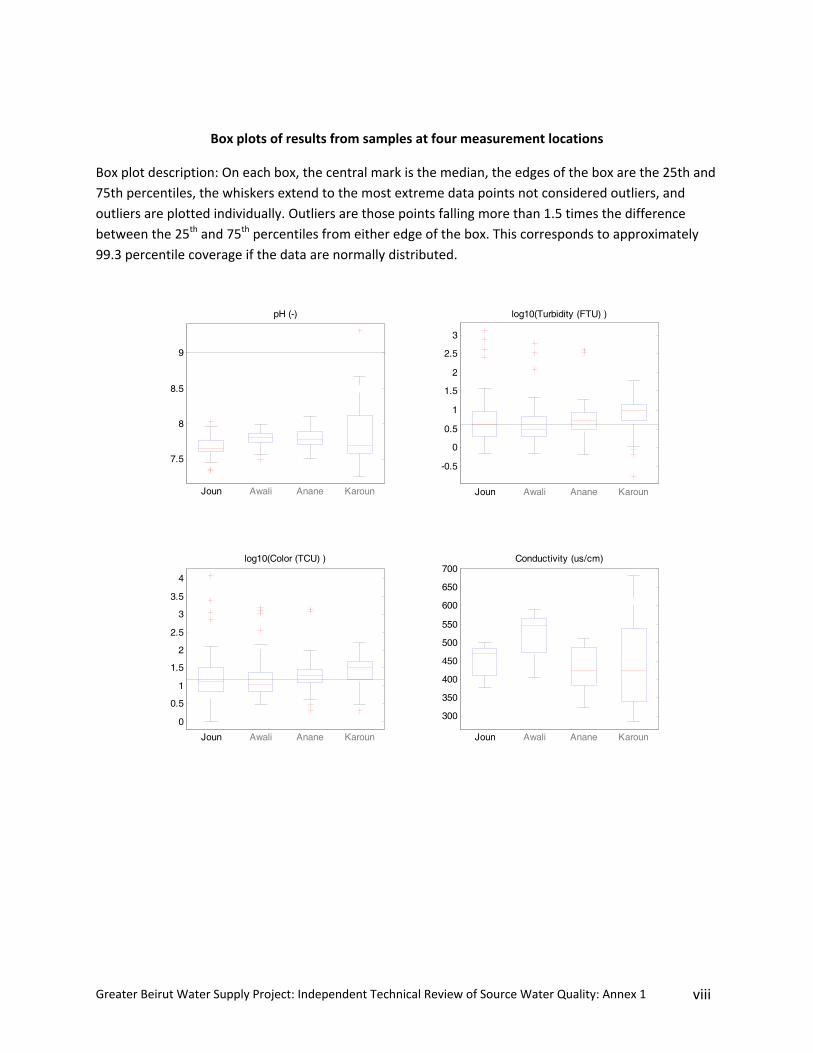
Box plots of results from samples at four measurement locations
Box plot description: On each box, the central mark is the median, the edges of the box are the 25th and
75th percentiles, the whiskers extend to the most extreme data points not considered outliers, and
outliers are plotted individually. Outliers are those points falling more than 1.5 times the difference
between the 25th and 75th percentiles from either edge of the box. This corresponds to approximately
99.3 percentile coverage if the data are normally distributed.
300
350
400
450
500
550
600
650
700
Joun Awali Anane Karoun
Conductivity (us/cm)
7.5
8
8.5
9
Joun Awali Anane Karoun
pH (-)
-0.5
0
0.5
1
1.5
2
2.5
3
Joun Awali Anane Karoun
log10(Turbidity (FTU) )
0
0.5
1
1.5
2
2.5
3
3.5
4
Joun Awali Anane Karoun
log10(Color (TCU) )
Greater Beirut Water Supply Project: Independent Technical Review of Source Water Quality: Annex 1 ix
0
2
4
6
8
10
Joun Awali Anane Karoun
Enterobacter cloacae (CFU/100ml)
3.5
4
4.5
5
5.5
6
Joun Awali Anane Karoun
log10(Total coliform (CFU/100ml) )
2.5
3
3.5
4
4.5
5
5.5
Joun Awali Anane Karoun
log10(Total thermal-tolerant coliforms (CFU/100ml) )
1
2
3
4
Joun Awali Anane Karoun
log10(Escherichia coli (CFU/100ml) )
2.5
3
3.5
4
4.5
5
5.5
Joun Awali Anane Karoun
log10(Citrobacter freundi (CFU/100ml) )
Greater Beirut Water Supply Project: Independent Technical Review of Source Water Quality: Annex 1 x
0
0.2
0.4
0.6
0.8
1
Joun Awali Anane Karoun
Salmonella typhimurium (CFU/100ml)
2
3
4
5
Joun Awali Anane Karoun
log10(Chysemonas luteola (CFU/100ml) )
1
1.5
2
2.5
3
3.5
4
Joun Awali Anane Karoun
log10(Kleb. pneum. ozaenae (CFU/100ml) )
1
2
3
4
Joun Awali Anane Karoun
log10(Non fermenter spp (CFU/100ml) )
0
20
40
60
80
Joun Awali Anane Karoun
Pseudomonas aeruginosa (CFU/100ml)
1
2
3
4
5
Joun Awali Anane Karoun
log10(Flavi. oryzihabitans (CFU/100ml) )
Greater Beirut Water Supply Project: Independent Technical Review of Source Water Quality: Annex 1 xi
100
150
200
250
300
Joun Awali Anane Karoun
Total hardness as CaCO3 (mg/l)
4
6
8
10
Joun Awali Anane Karoun
Acidity as CaCO3 (mg/l)
100
150
200
Joun Awali Anane Karoun
Total alkalinity as CaCO3 (mg/l)
50
100
150
200
250
Joun Awali Anane Karoun
Calcium hardness as CaCO3 (mg/l)
20
30
40
50
60
Joun Awali Anane Karoun
Magnesium hardness as CaCO3 (mg/l)
Greater Beirut Water Supply Project: Independent Technical Review of Source Water Quality: Annex 1 xii
0
0.5
1
1.5
Joun Awali Anane Karoun
Dissolved Fe2+ (mg/l)
10
20
30
40
50
60
Joun Awali Anane Karoun
Chloride Cl- (mg/l)
10
20
30
40
50
60
Joun Awali Anane Karoun
Sulfate SO4-- (mg/l)
0
0.2
0.4
0.6
Joun Awali Anane Karoun
Phosphate as P (mg/l)
0
0.2
0.4
0.6
0.8
Joun Awali Anane Karoun
Phosphorous as P2O5 (mg/l)
Greater Beirut Water Supply Project: Independent Technical Review of Source Water Quality: Annex 1 xiii
150
200
250
300
350
Joun Awali Anane Karoun
Total dissolved solids as NaCl (mg/l)
0.5
1
1.5
2
2.5
3
Joun Awali Anane Karoun
Ammonium as NH4+ (mg/l)
0
0.2
0.4
0.6
Joun Awali Anane Karoun
Nitrites as NO2- (mg/l)
0
5
10
15
20
Joun Awali Anane Karoun
Nitrates as NO3- (mg/l)
2
3
4
5
6
7
Joun Awali Anane Karoun
Dissolved oxygen (mg/l)

Greater Beirut Water Supply Project: Independent Technical Review of Source Water Quality: Annex 1 xiv
0
0.005
0.01
0.015
0.02
Joun Awali Anane Karoun
Sulfur (mg/l)
200
250
300
350
400
450
500
Joun Awali Anane Karoun
Virtual mineralization (mg/l)
0
5
10
15
Joun Awali Anane Karoun
CO2 (mg/l)
0.2
0.4
0.6
0.8
Joun Awali Anane Karoun
Fluoride (mg/l)
0
0.1
0.2
0.3
0.4
0.5
0.6
Joun Awali Anane Karoun
Manganese (mg/l)