Great Plains Landscape Conservation Cooperative Monitoring ...€¦ · state and UTM zone. We...
22
Great Plains Landscape Conservation Cooperative Monitoring Grid September, 2010
Transcript of Great Plains Landscape Conservation Cooperative Monitoring ...€¦ · state and UTM zone. We...

Great Plains Landscape Conservation Cooperative
Monitoring Grid
September, 2010


ROCKY MOUNTAIN BIRD OBSERVATORY • Mission: To conserve birds and their habitats Vision: Native bird populations are sustained in
healthy ecosystems Core Values: 1. Science provides the foundation for effective bird conservation. 2. Education is critical to the success of bird conservation. 3. Stewardship of birds and their habitats is a shared responsibility.
• RMBO accomplishes its mission by: • Monitoring long-term bird population trends to provide a scientific foundation for conservation
action. • • Researching bird ecology and population response to anthropogenic and natural processes to
evaluate and adjust management and conservation strategies using the best available science. • • Educating people of all ages through active, experiential programs that create an awareness and
appreciation for birds. • • Fostering good stewardship on private and public lands through voluntary, cooperative
partnerships that create win-win situations for wildlife and people. • • Partnering with state and federal natural resource agencies, private citizens, schools,
universities, and other non-governmental organizations to build synergy and consensus for bird conservation.
• • Sharing the latest information on bird populations, land management and conservation practices
to create informed publics. • • Delivering bird conservation at biologically relevant scales by working across political and
jurisdictional boundaries in western North America.
Suggested Citation: Sparks, R.A., F. Cardone, D.J. Hanni. 2010. Great Plains Landscape Conservation Cooperative Monitoring Grid. Tech. Rep. SC-GPLCC-USFWS-10. Rocky Mountain Bird Observatory, Brighton, CO, 18 pp. Cover Photo: Bill Schmoker, LEPC Contact Information: David Hanni; [email protected] Rob Sparks; [email protected] Frank Cardone; [email protected] Rocky Mountain Bird Observatory PO Box 1232 Brighton, CO 80601

303-659-4348

GP LCC: 2010
ROCKY MOUNTAIN BIRD OBSERVATORY Conserving birds and their habitats i
EXECUTIVE SUMMARY We used the United States National Grid to develop a sampling grid for monitoring programs in the Great Plains Landscape Conservation Cooperative, delineated by Bird Conservation Regions 18 and 19. Landscape Conservation Cooperatives are science based partnerships with the goal to inform and guide conservation at regional landscape levels. Developing a standardized sampling grid for a LCC is a new endeavor and is designed to reduce program costs, avoid repetition in sampling, and increase efficiency in monitoring programs. This is possible because the grid’s nationwide coverage, uniform starting point, and scalability allow researchers to expand their monitoring programs from a small, local level to a regional or even national level. We modified the grid slightly; cells along Universal Transverse Mercator (UTM) zone junctions are irregular in size and shape. In order to retain the grid’s scalability and avoid sampling grids smaller than 1 kilometer square we merged the small, irregular cells with their adjacent cells. The completed project is a geodatabase of grid feature classes divided into subsets by UTM zone. Each feature class follows the naming convention “STATE_USNG_UTMxx_BCRxx”. For example, the region of Nebraska that lies in the portion of BCR 18 that exists in UTM 13 has the title “NE_USNG_UTM13_BCR18. The GP LCC grid has a set of attributes that provide a versatile array of strata, allowing the researcher to develop monitoring programs that have useful implementations and purposes. We base our landbird monitoring strata on a few attributes, including NRCS ecoregions, Federal land ownership, and stream complexity. Other fields include dominant land cover type, X and Y coordinates of the cell centroid, and USNG addresses. The attribute tables of the grids provide a comprehensive summary of the landscape’s ecoregions and ownership properties. Using the GP LCC monitoring grid will improve partnership coordination at the landscape level to accomplish shared conservation goals.

GP LCC: 2010
ROCKY MOUNTAIN BIRD OBSERVATORY Conserving birds and their habitats ii
ACKNOWLEDGEMENTS Funding for the Great Plains LCC monitoring grid was provided through Great Plains Conservation Cooperative. We thank the US Forest Service, Colorado Division of Wildlife, Playa Lakes Joint Venture and Great Plains LCC for providing guidance to this project. Nancy Drilling and Chris White reviewed the report.

GP LCC: 2010
ROCKY MOUNTAIN BIRD OBSERVATORY Conserving birds and their habitats iii
Table of Contents Executive Summary ............................................................................................ i Acknowledgements ............................................................................................ ii Introduction ........................................................................................................ 1 Methods .............................................................................................................. 1 Results ................................................................................................................ 3 Discussion .......................................................................................................... 7 Literature Cited ................................................................................................... 8 Appendix A: Stratification Maps ....................................................................... 9
Map 1. Colorado BCR 18 ............................................................................................ 9 Map 2. Kansas BCR 18 ............................................................................................ 10 Map 3. Kansas BCR 19 ............................................................................................ 10 Map 4. Nebraska BCR 18 .......................................................................................... 10 Map 5. Nebraska BCR 19 .......................................................................................... 10 Map 6. New Mexico BCR 18 ...................................................................................... 10 Map 7. Oklahoma BCR 18 ........................................................................................ 10 Map 8. Oklahoma BCR 19 ........................................................................................ 10 Map 9. Texas BCR 18 .............................................................................................. 10 Map 10. Texas BCR 19 ............................................................................................ 10 Map 11. Wyoming BCR 18 ....................................................................................... 10
Figures Figure 1. GP LCC zipper effect ..................................................................................................2 Figure 2. Zipper effect solution ...................................................................................................3 Figure 3. GP LCC monitoring grid stratified by state and BCR ...................................................4
Tables
Table 1. GPLCC pre-merge statistics. ........................................................................................3 Table 2. GPLCC post-merge statistics ........................................................................................3 Table 3. GP LCC strata by state/BCR ........................................................................................5

GP LCC: 2010
ROCKY MOUNTAIN BIRD OBSERVATORY Conserving birds and their habitats 1
INTRODUCTION Landscape Conservation Cooperatives (LCC) are science based partnerships with the goal to inform and guide conservation at regional landscape levels. Understanding ecological processes at the landscape level will make conservation efforts more efficient and improve management responses to regional conservation issues such as climate change and habitat fragmentation. A major challenge while addressing regional conservation issues is coordinating efforts across partner agencies and organizations. LCC’s will facilitate coordination of multiple partners and improve conservation planning. A monitoring framework at the regional level was identified as a science need for the Great Plains Landscape Conservation Cooperative (GPLCC). Our objectives are to create a monitoring grid that biologists can use to monitor a variety of taxa at multiple scales and develop strata that can be used for landbird monitoring. When developing a regional monitoring grid, we consider the following key elements: spatial extent, datum and projection, scalability and standards. A grid overlaying a specific study area is commonly used to monitor populations, and many advanced analysis methods require a spatial context to develop statistical inferences and predictions. Occupancy modeling is one such method and is becoming increasingly popular for monitoring low density species. We can define the spatial extent in many ways, and we can use many geometric shapes to cover the spatial extent. The square is easily scalable to create different nested resolutions within a monitoring context. A grid with a familiar datum and projection will facilitate use among multiple partners, and GIS layers are more compatible with a commonly used datum and projection. Rocky Mountain Bird Observatory and partners have identified the United States National Grid (USNG) as a potential standard to use for monitoring biological populations at regional levels. The United States Federal Geographic Data Committee developed the grid to use at a national level to increase the efficiency of emergency response and to create a standard for geospatial industries (FGDC, 2001). The USNG is based on NAD 83 datum and a UTM projection, and it has a spatial address imbedded into each grid cell. The spatial address has three parts. The first is the grid zone designator; 6 degree longitudinal zones identified by a number and 8 degree latitudinal zones identified by a letter. The second is the 100,000-meter square identification. The third is the unique grid coordinates that allow scalability to local areas (FGDC, 2001). The number of digits in the grid coordinate determines the precision and resolution of the point. Grid coordinates range from two digits (defining regional coordinates) all the way to ten digits (one meter precision). The easting and northing coordinates allow scalability to these different resolutions. The concept of the grid is derived from the Military Grid Reference System and uses a similar labeling scheme to identify grid cells. For example a unique 1-kilometer square location has the coordinates 13TGF3437 (a grid cell located in northeastern Colorado). 13T is the grid zone designator; GF is the 100,000-meter square identification, and 3437 is the easting (34) and the northing (37) values that create the cell’s unique grid coordinates.
METHODS USNG Zipper Effect The Universal Transverse Mercator (UTM) projection is a planer projection used to project the curved surface of the earth on a two-dimensional plane. In the U.S, excluding Alaska, there are approximately

GP LCC: 2010
ROCKY MOUNTAIN BIRD OBSERVATORY Conserving birds and their habitats 2
12 UTM zones. Irregular grid cells with areas less than 1-kilometer square occur along the edges of each zone junction (Figure 1). These “zipper cells” occur because mapping the three-dimensional spherical earth on a two-dimensional plane creates distortions. The irregular cells less than 1 kilometer square would change our sampling effort and may bias analysis estimates. These unequal area cells only comprise 0.33% of the total number of grids in the GPLCC (Table 1). Geodatabase Schema We obtained the USNG grid shapefiles from Delta State University; these grids were divided by state and UTM zone. We subdivided the grids in the GP LCC by Bird Conservation Region (BCR); the GP LCC is a combination of BCR 18 and 19 and exists in UTM zones 13 and 14. We assigned grid cells to a state, UTM zone, and BCR based on the location of the cell’s centroid. We used the naming convention STATE_USNG_UTMxx_BCRxx. For example, we label the grid covering Kansas UTM 13, BCR 18 as “KS_USNG_UTM13_BCR18”. Merging Cells To merge the grid cells smaller than 0.95-kilometer square, we used an eliminate script. The eliminate script allows the user to select cells by an attribute query. In this case the query selected cells below 0.95-kilometer square, and merged the selected cells to the respective neighbors to which they share the largest common boundary. The script created a new field in the attribute table, assigned a unique value to each grid cell that matched the attribute query, selected by location the grid cells that shared the largest boundary to the queried cells and assigned them the same value as each one’s bordering queried cell. The script then dissolved the cells based on the new field. Grid Attribution Attributes added to each grid include NRCS Major Land Resource Areas (ecoregions), federally owned and managed lands, rivers, and land cover/vegetation types. NRCS ecoregions encompass a wide array of landscape properties, including soil types, climate variables, and topography. The attribute tables also include X and Y coordinates of cell centroids and USNG addresses. We attributed the grid using many methods, depending on data types and agency requests. The primary method for attribution was to perform a spatial join between the centroids of the grid cells and the desired attribute layer. The spatial join finds the polygon in the attribute layer that intersects with the grid cell centroid point and attributes each point. We used this method for the Fedlands and NRCS layers. We also used this intersection method to determine a grid cell’s NHD strahler order (stream complexity) attribute. Linear features are best represented this way because a large river can cross through a cell but not run through the centroid. We attributed the National Land Cover Data (NLCD), a thematic raster dataset that describes land cover with 30x30 meter pixels, based on dominant land cover type rather than the land cover type intersecting with the cell centroid. Discovering the dominant land cover type instead of the type associated with the cell centroid is more pertinent. Discovering the single pixel intersecting the grid cell centroid could potentially represent only 0.1 percent of the land cover type in the grid cell. Once we have a fully attributed grid, we can stratify the grid based on the attributes. We based many of the strata for the landbird monitoring project primarily on NRCS ecoregions, federal land ownership, and strahler order. Strata are customizable and we can modify them to better fit specific studies.
Figure 1. GP LCC zipper effect

GP LCC: 2010
ROCKY MOUNTAIN BIRD OBSERVATORY Conserving birds and their habitats 3
RESULTS We solved the Zipper Effect problem by merging cells smaller than 0.95-kilometer square with their respective adjacent cells. After merging grid cells, 0.3% of the cells are larger than 1-kilometer squares, but none are below 0.95-kilometer square (a 5% tolerance) (Table 2). If the larger cells are selected for sampling we could then randomly place a 1km2 cell within the larger cell. This solution allows for inference to the entire study area and maintains the spatial extent of the sampling frame. The grid is still scalable, and the increased cell size does not alter inclusion probabilities when conducting finite spatially-balanced sampling (Anthony Olsen pers. comm.). Table 1. GPLCC pre-merge statistics.
#Grid Cells
Percent Area of Grid Cells (km2)
Percent of total Area
Conforming Cells (cells >= 0.95 km2)
780600 99.67% 780547.42 99.84%
Sliver Cells (area less than 0.95 km2)
2573 0.33% 1250.24 0.16%
Total 783173 781797.66 Table 2. GPLCC post-merge statistics #Grid
Cells Percent Area of Grid Cells
(km2) Percent of total Area
cells 0.95-0.99 km2 111 0.0142% 107.76 0.014% cells = 1 km2 778113 99.681% 778113.00 99.53% Cells larger than 1km2
2376 0.304% 3576.9 0.46%
total 780600 781797.66 GP LCC Monitoring Grid
Figure 2. Zipper effect solution

GP LCC: 2010
ROCKY MOUNTAIN BIRD OBSERVATORY Conserving birds and their habitats 4
Figure 3. GP LCC monitoring grid stratified by state and BCR
The completed project is a geodatabase containing all grids stratified by state and BCR for the GPLCC (Figure 3). There are no overlapping or duplicate grid cells, nor are there gaps in the grid. For our monitoring grid, we have developed a strata scheme for each state based on attributes in the grid, primarily NRCS ecoregions and federal land ownership (Table 3). We intersected strata for grid cells located in more than one stratum. For example, a cell with a river strahler order greater than or equal to 4 that exists in Black Kettle National Grassland has the value “Rivers Black Kettle NG”. The user can then decide to stratify based on the grid cell’s river stratum, federal ownership stratum, or both. The following attributes are fields in the table of each grid: Grid1MIL: Grid Zone designation. Designates which UTM zone and latitudinal band contains the cell. Grid100K: 100,000-meter square designation. It identifies a cell’s location within a grid zone designation. Northings: The vertical component of the grid cell’s unique grid coordinates. It identifies the vertical location of a cell within the 100,000-meter square
designation relative to its southwest corner.

GP LCC: 2010
ROCKY MOUNTAIN BIRD OBSERVATORY Conserving birds and their habitats 5
Eastings: The horizontal component of the grid cell’s unique grid coordinates. It
identifies the horizontal location of a cell within the 100,000-meter square designation relative to its southwest corner.
State_BCR Strata Strata continued Coloado BCR 18 Arkansas River and Tributaries Pawnee National Grassland
Comanche National Grassland Platte to I-70 DOD land South of the Arkansas I-70 to Arkansas North of the Platte River Platte River and Tributaries
Kansas BCR 18 Rivers (Strahler >=4) Rolling Plains and Breaks Central High Tableland Southern High Plains, Breaks* Cimmarron National Grassland Kansas BCR 19 Central High Tableland Nebraska and Kansas Loess Drift Hills* Central Kansas Sandstone Hills Rivers (Strahler >=4) Rolling Plains and Breaks Southern High Plains and Breaks*
Nebraska BCR 18
Rivers (Strahler >=4) Oglala National Grassland
Nebraska National Forest Scotts Bluff National Monument Biologically Unique Landscapes* Nebraska BCR 19
Central Loess Plains* Nebraska Sand Hills*
Central Nebraska Loess Hills Rivers (Strahler >=4) Loess Uplands Rolling Plains and Breaks*
New Mexico BCR 18
BLM Lands Southern Desertic Basins, Plains, and Mountains
Canadian River Plains and Valleys* Southern High Plains* Kiowa National Grassland* Upper Pecos River Valley Rivers (Strahler >= 4)
Oklahoma BCR 18
Rita Blanca National Grassland* Southern High Plains, Northern Part
Rivers (Strahler >= 4) Southern High Plains, Breaks Southern High Plains, NW part Canadian River Plains and Valleys Oklahoma BCR 19
Black Kettle National Grassland North Cross Timbers
Central Rolling Red Plains* Southern High Plains, Breaks* Central Rolling Red Prairies* Wichita Mountains Rivers (Strahler >= 4)
Texas BCR 18 Edwards Plateau* Southern High Plains, Northern Part* Rita Blanca National Grassland* Southern High Plains, Southern Part* Rivers (Strahler >= 4) Upper Pecos River Valley Southern Desertic Basins, Plains, and
Mountains
Texas BCR 19 Central Rolling Plains Red Prairies* Rivers (Strahler >= 4) Central Rolling Plains, Western Part Southern High Plains, Breaks Edwards Plateau*
Wyoming BCR 18
Rivers (Strahler >=4) BLM Lands
DOD Lands
Table 3. GPLCC strata by state/BCR.
* = More than one ecoregion(s) were grouped in a stratum see appendix A.

GP LCC: 2010
ROCKY MOUNTAIN BIRD OBSERVATORY Conserving birds and their habitats 6
USNG: The entire address for a 1 km2 cell. It specifies the cell’s grid zone designation, 100,000-meter square designation, and unique grid coordinates (northings and eastings). X: X coordinate of cell centroid. Units are meters, and they define the location in relation to the spatial extent of the feature class. Y: Y coordinate of centroid. Units are meters, and they define the location in relation to the spatial extent of the feature class. Fedlands: Lands owned or administered by the Federal government. The source of the data is the United States Geological Survey. A grid cell will have a Fedlands attribute if its centroid resides within the boundary of a Federal Land. The Fedlands field is derived from the ‘AGBUR’ field in the Fedlands.shp layer. Name1: Property name for lands owned or managed by the Federal government. Related to the FedLands field, ‘Name1’ provides the specific name of some federal lands, including wildlife refuges, Air Force bases, and National Grasslands. For US Forest Service lands, the field is based on the USFS Proclaimed boundaries rather than the Fedlands layer. NRCS: Major Land Resource Areas, developed by the National Resources Conservation Service. NRCS ecoregions are based on the geographic grouping of Landscape Resource Units (LRU) and act as excellent boundaries for sampling because they delineate regions with similar landscapes and climate, which is ideal for long term monitoring. The NRCS field is derived from the ‘MLRA_Name” field in the MLRA_v42.shp layer. NLCD/DOM_LAND: National Land Cover Data, dominant land cover type. A thematic raster dataset, compiled by the United States Department of Agriculture and NRCS. Using ArcGIS’s Spatial Analyst extension, we calculate NLCD dominant land cover by executing a zonal statistics tool. NLCD field represents the numeric code for land cover type; DOM_LAND field is the name of the land cover type. Strahler: Derived from National Hydrography Dataset and strahler order table, Data source: USGS. Strahler order refers to the complexity of a river system; main branches of a river have a higher strahler number and as you move down the nodes of tributaries, the strahler number decreases. We label strahler orders greater than or equal to 4 as “48”. BUL: (Unique to Nebraska) Biologically Unique Landscapes, developed by Nebraska Wildlife Action Plan.

GP LCC: 2010
ROCKY MOUNTAIN BIRD OBSERVATORY Conserving birds and their habitats 7
DISCUSSION Collaboration and partnerships are necessary to create successful conservation objectives and plans at the landscape level. We are taking steps to collaborate with partners and agencies to develop landbird monitoring strata for the GPLCC. Spatially explicit conservation models require a spatial extent for inference. A sampling grid provides an organized spatial extent partitioned into sampling units needed in spatially explicit models and is integral to research and monitoring. The landbird monitoring grid developed for the GPLCC is based on the USNG standards. The USNG is a scalable national grid that may be used within and across LCC landscapes. The scalable nature of the USNG grid is useful for monitoring and research of multiple taxa. The USNG has spatial continuity which facilitates the use of the grid by multiple partners and improves the ability to compare parameter estimates and coordinate conservation objectives. Furthermore, a standardized monitoring and research grid will decrease project costs, necessary labor, and duplicate sampling efforts. Using the GPLCC monitoring grid will improve partnership coordination at the landscape level to accomplish shared conservation goals. An example of a monitoring program that can use the same grid developed for the GPLCC utilizes structured decision making (SDM). SDM analyzes a decision by breaking it into parts with the aim to identify the optimal decision in terms of specified objectives. In conservation the elements of decision making include: objectives, management actions, models of system behavior, a monitoring program to track system state and a method to identify the solution (Martin et al. 2009). Using SDM and applying it to sequential decision processes is referred to as adaptive management (Williams et al. 2002). . For our landbird monitoring program, we stratified the GPLCC by state and BCR. We chose our stratification schemes based on ecoregions, land ownership, and rivers. In Nebraska, Biologically Unique Landscapes, developed by the Nebraska State Wildlife Action Plan, were also used to develop strata. Our goal for developing a landbird monitoring program was to have a stratification scheme that is relevant at the landscape level and is not subject to strata changing over long periods of time. This particular stratification scheme will not be optimal for targeting specific species but the same grid can be stratified in many ways depending on the objectives of the research question.

GP LCC: 2010
ROCKY MOUNTAIN BIRD OBSERVATORY Conserving birds and their habitats 8
LITERATURE CITED United States National Grid (USNG), FGDC, December 2001, Reston, Virginia. Major Land Resource Areas (MLRA), Natural Resource Conservation Service (NRCS), December 2005. Martin, J.M., Runge M.C., Nichols J.D., Lubow B.C., and Kendall W.L. (2009). Structured decision making as a
conceptual framework to identify thresholds for conservation management. Ecological Applications. 19(5), 1079-1090.
Williams, B. K., J. D. Nichols, and M. J. Conroy. 2002. Analysis and management of animal populations. Academic
Press, San Diego, California, USA.

GP LCC: 2010
ROCKY MOUNTAIN BIRD OBSERVATORY Conserving birds and their habitats 9
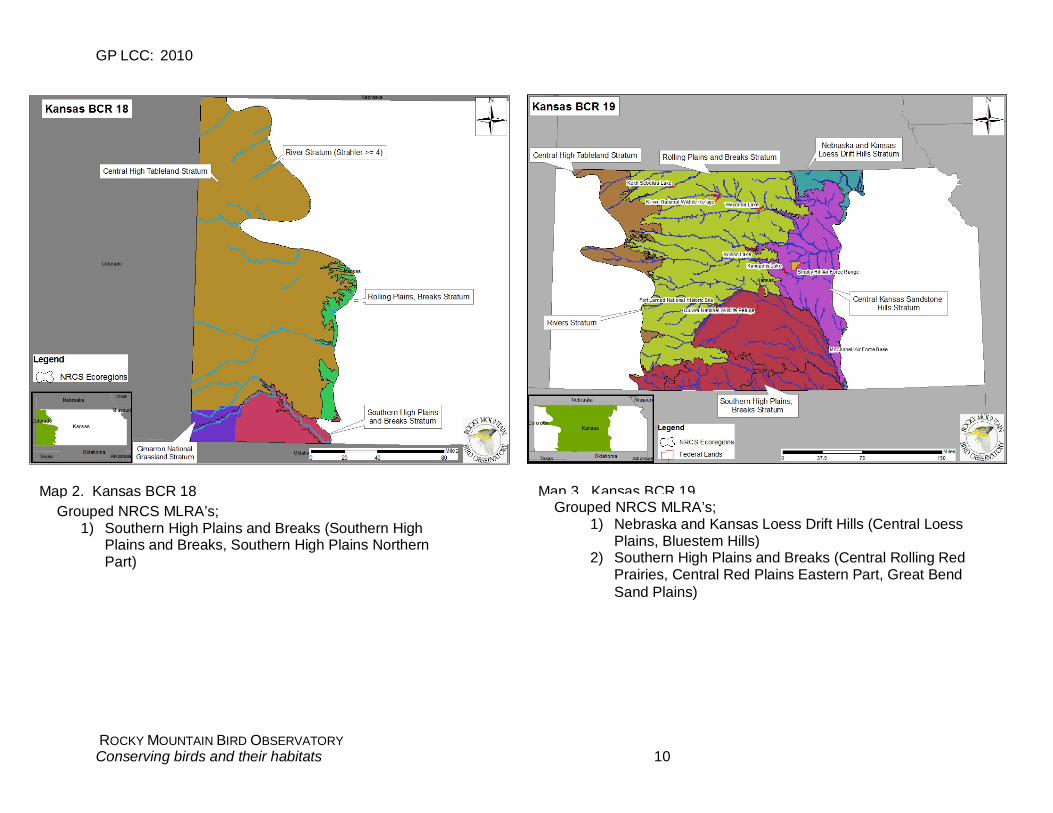
APPENDIX A: STRATIFICATION MAPS The Following maps display the stratification schemes for each State/BCR. If more than one NRCS MLRA ecoregion were grouped they appear in text below the map.
Map 1. Colorado BCR 18
GP LCC: 2010
ROCKY MOUNTAIN BIRD OBSERVATORY Conserving birds and their habitats 10
Map 2. Kansas BCR 18
Map 3. Kansas BCR 19 Grouped NRCS MLRA’s;
1) Southern High Plains and Breaks (Southern High Plains and Breaks, Southern High Plains Northern Part)
Grouped NRCS MLRA’s; 1) Nebraska and Kansas Loess Drift Hills (Central Loess
Plains, Bluestem Hills) 2) Southern High Plains and Breaks (Central Rolling Red
Prairies, Central Red Plains Eastern Part, Great Bend Sand Plains)

GP LCC: 2010
ROCKY MOUNTAIN BIRD OBSERVATORY Conserving birds and their habitats 11
Map 5. Nebraska BCR 19
Map 4. Nebraska BCR 18
Grouped NRCS MLRAs: 1) Mixed Sandy and Silty Tableland and Badlands, Pierre Shale
Plains, Nebraska Sand Hills, Central High Plains Northern Part, Central High Tableland
Grouped NRCS MLRAs: 1) Central Loess Plains (Central Loess Plains, Nebraska and Kansas
Loess-Drift Hills) 2) Nebraska Sand Hills (Nebraska Sand Hills, Mixed Sandy and Silty
Tableland and Badlands, Dakota-Nebraska Eroded Tableland) 3) Rolling Plains and Breaks (Rolling Plains and Breaks, Central High
Tableland)

GP LCC: 2010
ROCKY MOUNTAIN BIRD OBSERVATORY Conserving birds and their habitats 12
Grouped NRCS MLRAs:
1) Canadian River Plains and Valleys (Canadian River Plains and Valleys, Southern High Plains Northwestern Part, Southern Rocky Mountain Foothills)
2) Southern High Plains (Southern High Plains Southwestern Part, Southern High Plains Southern Part)
Map 6. New Mexico BCR 18

GP LCC: 2010
ROCKY MOUNTAIN BIRD OBSERVATORY Conserving birds and their habitats 13
Map 7. Oklahoma BCR 18
Map 8. Oklahoma BCR 19
Grouped NRCS MLRAs: 1) Southern High Plains Northern Part (Southern High Plains
Northern Part, Southern High Plains Breaks, Southern High Plains Northwestern Part, Canadian River Plains and Valleys)
Grouped NRCS MLRAs: 1) Central Rolling Red Plains (Central Rolling Red Plains
Eastern Part, Central Rolling Red Plains Western Part) 2) Central Rolling Red Prairies (Central Rolling Red Prairies,
Bluestem Hills) 3) Southern High Plains and Breaks (Southern High Plains and
Breaks, Southern High Plains Northern Part)

GP LCC: 2010
ROCKY MOUNTAIN BIRD OBSERVATORY Conserving birds and their habitats 14
Map 10. Texas BCR 19
Map 9. Texas BCR 18 Grouped NRCS MLRAs:
1) Edwards Plateau (Edwards Plateau Central Part, Edwards Plateau Western Part)
2) Southern High Plains Northern Part (Southern High Plains Northern Part, Southern High Plains and Breaks, Southern High Plains Northwestern Part)
3) Southern High Plains Southern Part (Southern High Plains Southern Part, Central Rolling Red Plains Western Part, Southern High Plains Southwestern Part, Southern High Plains Southwestern Part)
Grouped NRCS MLRAs: 1) Central Rolling Plains Red Prairies (Central Rolling Red Prairies,
Central Rolling Red Prairies Western Part) 2) Edwards Plateau (Edwards Plateau Western Part, Edwards
Plateau Central Part, Rolling Limestone Prairie, Texas North Central Prairies)

GP LCC: 2010
ROCKY MOUNTAIN BIRD OBSERVATORY Conserving birds and their habitats 15
Map 11. Wyoming BCR 18