Great Companies, Great Charts - Effective Stock Trading Techniques to Beat the Markets
93
Transcript of Great Companies, Great Charts - Effective Stock Trading Techniques to Beat the Markets
Great Companies,Great Charts
Great Companies,Great Charts
✦
Effective Stock Trading Techniques toBeat the Markets
Andy Dunn
iUniverse, Inc.
New York Lincoln Shanghai
Great Companies, Great ChartsEffective Stock Trading Techniques to Beat the Markets
No part of this book may be reproduced or transmitted in any form or by any means, graphic, electronic, or mechanical, including photocopying,
recording, taping, or by any information storage retrieval system, without the written permission of the publisher.

All Rights Reserved © 2004 by Andy Dunn
iUniverse, Inc.For information address:
iUniverse, Inc.2021 Pine Lake Road, Suite 100
Lincoln, NE 68512
www.iuniverse.comPrinted in the United States of America
ISBN: 0-595-76096-1Statement of non-liability
Investing in the stock market is risky. The information in this book expresses only the opinions of the author…that’s me. Take what I say with
a bag of salt. No representation is made that any account will, or is likely to, achieve profits or losses similar to those shown. There aredifferences between theory and actual results achieved by any particular trading system. Theoretical trading does not involve financial risk, and
therefore cannot account for the reality of actual trading. Past performance is not an indicator of future performance. The stocks I currentlyhold, have held in the past, and will buy in the future, do not represent a recommendation to buy, hold, or sell. The risk of loss in trading stocks
can be substantial. If, while attempting to apply any of the ideas, procedures, or advice contained within this book, you suffer loss, you arewholly responsible. I disclaim responsibility for your actions, and for your loss.
What I’m saying is, if you bet the farm and lose, “you” bet the farm.
Andy Dunn

Chart Permissions
The stock price charts used throughout this book were created courtesy of
StockCharts.com. At the time of publishing 2004 they allow users to reprint up to 25 charts a day (some restrictions apply).
StockCharts.com has simply the web’s best financial charts.http://stockcharts.com
The compounding interest growth chart in chapter 18 is used with written permission from Bob Sardis at MoneyChimp.com. Money Chimp
offers some of the web’s best financial calculators.http://www.moneychimp.com
To Mom and Dad
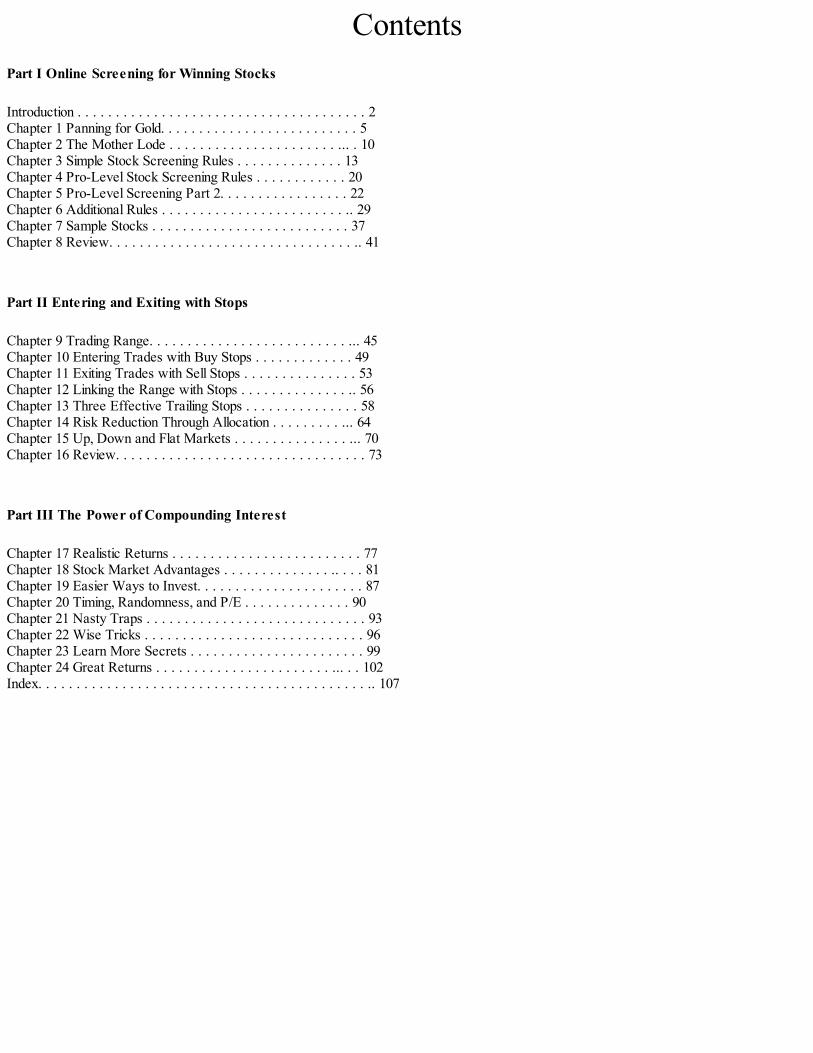
Contents
Part I Online Screening for Winning Stocks Introduction . . . . . . . . . . . . . . . . . . . . . . . . . . . . . . . . . . . . . . 2Chapter 1 Panning for Gold. . . . . . . . . . . . . . . . . . . . . . . . . . 5Chapter 2 The Mother Lode . . . . . . . . . . . . . . . . . . . . . . ... . 10Chapter 3 Simple Stock Screening Rules . . . . . . . . . . . . . . 13Chapter 4 Pro-Level Stock Screening Rules . . . . . . . . . . . . 20Chapter 5 Pro-Level Screening Part 2. . . . . . . . . . . . . . . . . 22Chapter 6 Additional Rules . . . . . . . . . . . . . . . . . . . . . . . . .. 29Chapter 7 Sample Stocks . . . . . . . . . . . . . . . . . . . . . . . . . . 37Chapter 8 Review. . . . . . . . . . . . . . . . . . . . . . . . . . . . . . . . .. 41 Part II Entering and Exiting with Stops Chapter 9 Trading Range. . . . . . . . . . . . . . . . . . . . . . . . . . ... 45Chapter 10 Entering Trades with Buy Stops . . . . . . . . . . . . . 49Chapter 11 Exiting Trades with Sell Stops . . . . . . . . . . . . . . . 53Chapter 12 Linking the Range with Stops . . . . . . . . . . . . . . .. 56Chapter 13 Three Effective Trailing Stops . . . . . . . . . . . . . . . 58Chapter 14 Risk Reduction Through Allocation . . . . . . . . . ... 64Chapter 15 Up, Down and Flat Markets . . . . . . . . . . . . . . . ... 70Chapter 16 Review. . . . . . . . . . . . . . . . . . . . . . . . . . . . . . . . . 73 Part III The Power of Compounding Interest Chapter 17 Realistic Returns . . . . . . . . . . . . . . . . . . . . . . . . . 77Chapter 18 Stock Market Advantages . . . . . . . . . . . . . . .. . . . 81Chapter 19 Easier Ways to Invest. . . . . . . . . . . . . . . . . . . . . . 87Chapter 20 Timing, Randomness, and P/E . . . . . . . . . . . . . . 90Chapter 21 Nasty Traps . . . . . . . . . . . . . . . . . . . . . . . . . . . . . 93Chapter 22 Wise Tricks . . . . . . . . . . . . . . . . . . . . . . . . . . . . . 96Chapter 23 Learn More Secrets . . . . . . . . . . . . . . . . . . . . . . . 99Chapter 24 Great Returns . . . . . . . . . . . . . . . . . . . . . . . ... . . 102Index. . . . . . . . . . . . . . . . . . . . . . . . . . . . . . . . . . . . . . . . . . . .. 107

Acknowledgements
I owe many thanks to my friends and family whose support and ideas helped shape this book. My friends were instrumental in locating a chartsource, correcting grammar and picking a book title. I can’t wait to write the runner-up title, DUNN ON STOCKS: Frisky Fireball Trading. I
also wish to thank my copyeditor, Denise.
Special thanks to Paul Cheatham, my accountant and friend, who sat me down a long time ago, and told me the tall tale: ‘The Power ofCompounding
Interest’.

PART IOnline Screening for
Winning Stocks

Introduction
Like many investors, my stock portfolio was crushed in the years 2000, 2001, and 2002. I had chest pains and migraines as I helplesslywatched my retirement portfolio evaporate as the market relentlessly trended lower. It was during those years I forced myself to reevaluatehow I traded. I researched and assebled the mechanical, trend-following system I use today. By using the techniques described in this book,my portfolio has recovered and within the next couple years it should reach new highs. This book details the successful strategies I use toinvest in the stock market. Why This Book is UniqueThe book is unique for three reasons: It’s a blend of both fundamental and technical stock analysis.It’s a blend of both stock and futures trading techniques.It’s complete trading philosophy, not just stock picking Most books on trading choose either a fundamental approach, dealing with accounting and financial statements, or a technical approach,dealing with stock chart price patterns. There are benefits using a synthesis of the two methods. I invest in both stocks and futures. There aremany excellent futures trading techniques that apply well to the stock market. By combining skillful stock-picking techniques with futuretrading’s entry and exit techniques, a powerful trading system can be created. Wall Street writers often focus on stock picking. Picking the winners is only one third of successful trading. Investors need to manage thewhole trade from start to finish. Investors need self-discipline and confidence to trade without emotional interference. The standardizedroutines I use create investor competence.
2Background in Risk RewardI completed an undergraduate Bachelor of Business Administration (BBA) at Sir Wilfrid Laurier in Canada and then continued with a Mastersof Business Administration (MBA) at University of California at Riverside. My focus was advertising but near the end of my studies I beganto concentrate on marketing math and research. Market research is rooted in statistics which is where I fell in love with probability theory.Gambling, speculating, and investing are essentially risk vs. reward—the heart of probability theory. There is a reason why CDs pay 2% andindexed mutual funds pay 10% —the greater the risk, the greater the chance of loss, and the greater the reward. After university, I opened a series of small businesses. Some did poorly, some broke even, and a couple did well. I invested $35,000 in a dial-upInternet bulletin board system and lost it all. I invested $70,000 in a bar game vending route and broke even. I invested $55,000 in an instantsign store and sold the business seven years later for $215,000. I invested $70,000 in an Internet-based banner advertising system and sold ittwo years later for $1,000,000. These business events demonstrated: With calculated risk can come rewardTwo investments will make as much as eight othersNever stop trying I began investing in the stock market with mutual funds in the early ’90s. I eventually began trading stocks. Like most investors, I did wellduring the technology bubble of the late ’90s and, like most investors, I was trapped when the market crashed. I didn’t give up; I honed myrisk-reward skills and applied them to the markets, developing my simple and disciplined trading style. My portfolio has beaten the market ever

since. Trading PhilosophyThe stock market is as much about human nature as it is about financial statements, and moves up and down for many reasons. The stockmarket is about people—investors like you and I. We are creatures of habit. The markets have trended upward for the last century at a 10%clip and I think this trend will continue. There will always be stocks that out perform the market; the key is finding the characteristics of thesewinning stocks.
3A good trading system does not need to be complex. Complexity often comes dangerously close to curve-fitting; customizing trading rules to adegree that realistic results are unlikely. Simple trading systems work, and are usually more robust over time. Most people do poorly in themarket, not because of poor stock picking skills, but because of a lack of self-discipline. A trend following, mechanical system is one of thebest tools for encouraging a complete, self-discipline, approach to investing. The title of this book is Great Companies, Great Charts and my premise forwriting the book is to give readers new skills for achieving “great returns.”

4
Panning for Gold
Technical and Fundamental Analysis The tech boom was on! The year was 1999 and the public had an insatiable thirst for stocks known as the dot-coms. Entrepreneurial fortunehad smiled on me the previous year when I sold a banner advertising website for a high six figures. I invested these proceeds in the stockmarket and quickly purchased 10 stocks. Like many investors the system I used for choosing stocks was based on wild rumors, hot tips, andthe seat of my pants. I was tossing dice in the big casino; when you choose to gamble, the casino always wins. I decided to buy shares in an interesting new company called NetBank, Inc., (NASDAQ: NTBK). I was an Internet proponent and it madeperfect sense that the public would eventually bank online. It never occurred to me that brick-and-mortar banks would simply create websites!That year, the price of NetBank went up eight fold. I made more than $200,000 (on paper) in three weeks, and had daydreams of purchasingmy first Tropical island. I held NetBank all the way up! I held tightly onto NetBank all the way down. Down. Down. Down. This rise-and-fallstory repeated itself with most technology stocks and almost all the dot-com stocks. All but a handful of dot-coms exist today. From 2000through 2002, I watched the majority of my portfolio go up in smoke. It was during these painful down years that I continued to read everyinvestment book I could get my hands on while back testing hundreds of technical trading systems. I eventually came to the point where myinvesting was no longer about hot tips and gambling, but instead focused on logic, risk tolerance, human nature, and self-discipline. In the following pages, I’ll describe my investment methods for you. I make my living trading stocks. Discretionary trading relies on one’sjudgment, where mechanical trading relies on defined rules. I trade mechanically which encourages self-discipline. My market philosophy issensible and simple. The techniques I use can be adjusted to match your personal risk tolerance.
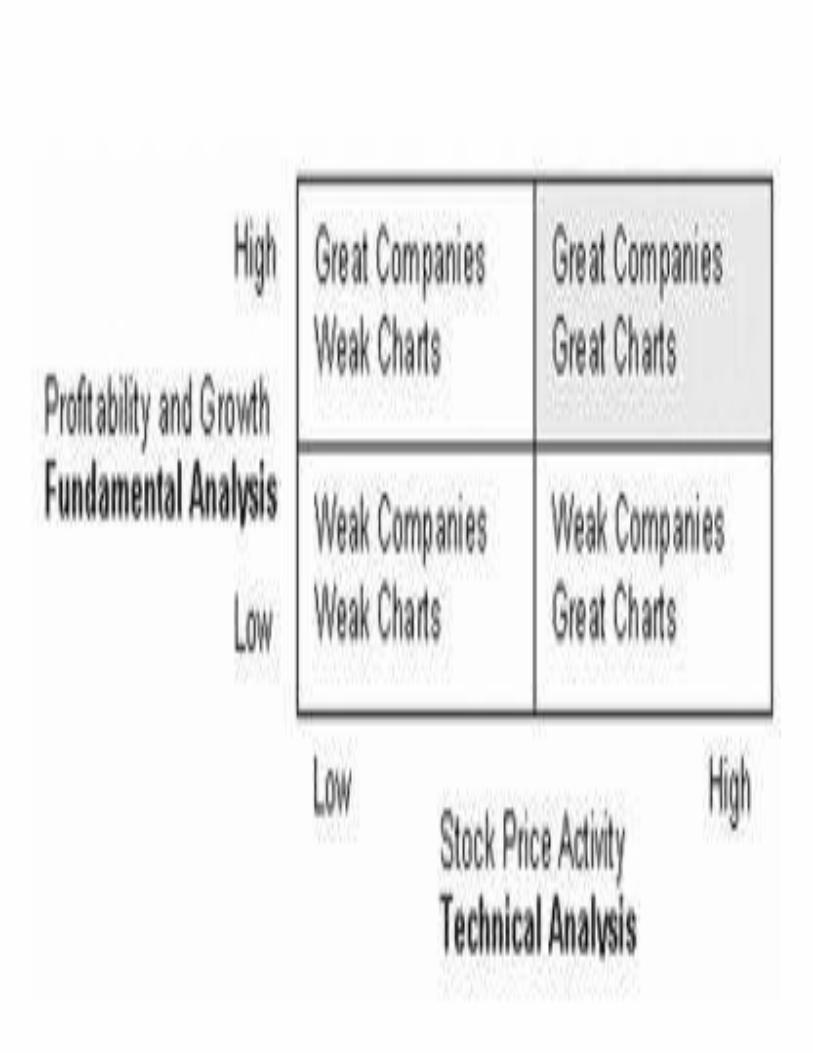
5In the midst of the difficult years following the tech boom, I developed a clean model which uses both fundamental and technical analysis toplace publicly traded companies into one of four categories: great companies with great charts, great companies with weak charts, weakcompanies with great charts, and weak companies with weak charts. Fundamental analysis is a method of anticipating future stock price movement using economic data. This data includes earnings, profitmargins, and revenue growth. Technical analysis is a method of anticipating future stock price movement using price activity or chart patterns. In a perfect world, purefundamentalists believe companies with large profit margins and strong earnings should be the best stocks to purchase. Fortunately, this is not a perfect world—it’s the stock market. Great companies don’t always have the best performing stocks. In a perfect

world, pure technicians believe all knowable information for any given stock is logically reflected in that stock’s price movement. Simply findthe charts with upward price patterns and buy. Great charts don’t necessarily indicate the company represented by the chart is financiallysound. If you only cared about upward price momentum, then the dot-com stocks of the late ’90s would be very attractive. The stock market is made up of people with many different ideas. People buy and sell stocks for many reasons; some of which areemotional and irrational. While riding down the elevator in the Waldorf Towers, Sally overhears Bob-the-Bellhop tell Desk-Clerk-David thatBioBioBio Inc., is a month away from finding a cure for the common cold. Sally just bought 1000 shares of BioBioBio Inc., and is currentlydeciding how she’ll decorate her yacht moored in the Cayman Islands. Sally buys stock like many investors: trusting hot tips, hunches, andintuition. This style of investing is dangerous at best. However, by understanding fundamental and technical analysis, Sally would choose betterstocks by finding the great companies with great charts. The financial strength of a company is weak or great based on a fundamental evaluation provided by online stock screening tools. Stockscreening allows investors to quickly scan large volumes of stocks using a series of filters or rules. The stock price activity of a company isweak or great based on a technical evaluation of its price charts. The chart below is a visual representation of my market model.
6
There are traders successfully buying and selling stocks in all four categories. I believe one quadrant offers superior equity choices over theothers. If you want to pick more winners, search for great companies with great charts. These stocks are the bee’s knees and have bothtechnical and fundamental indicators suggesting they are more likely to move upward. In the past 10 years ago or more, stock market research was done almost entirely by hand. Reading through financial statements, handdrawing price charts, calculating ratios, and moving averages, was tedious and time consuming. Computers and the Internet now offerinvestors powerful research tools that can do the same research in a fraction of the time. One of the most exciting tools is the online stockscreener. The results from these screens are the stocks that best match your trading philosophy criteria. The first section of this book(chapters one through eight), revolve around stock screening. If you would like a sneak peek at some of my favorite screening Web sites,please visit these links: http://finance.yahoo.com/http://www.google.com/financehttp://www.marketwatch.com/tools/stockresearch/screener/ These sites change over the years. Try searching ‘stock screener’ in a search engine like Google or Bing and you will find many choices. The Four CategoriesWeak companies with weak charts are bottom of the barrel. These companies are technically weak and fundamentally weak. This is theworst possible category for finding winning stocks. This is the land of the penny stock. This is the land of the dying company. This is the landof hyped start-up. There is nothing to be found here but long shots. These companies have nasty financial statements and ugly chart patterns.If you want to find these companies using an online stock screener, enter criteria along the lines of: Previous Day’s Closing Price $10 or lessPrevious Day’s Closing Price near the 52 Week LowNet Profit Margin less than 0%

7 Weak companies with great charts are technically strong, fundamentally weak.If you care only about stock price, these companies will attract you. The dot-coms are a perfect example of weak companies with greatcharts. People usually purchase these stocks with the future hope of profitability. I don’t like to buy on hope. Like most investors, I gotpunched in the gut during the dot-com crash and learned a hard lesson of life. If you want to find these companies using an online stockscreener, enter criteria like: Net Profit Margin less than 5%Previous Day’s Closing Price near or above 52 Week High Great companies with weak charts are technically weak, but fundamentally strong.These companies offer sound financial statements with a beat down stock price. The public is not always rational. Stocks can be in fashionone year and old news the next. Some industries are sexier than others. Assuming the fundamentals were equivalent, if you had the choicebetween Super Sonic Microchip Inc., or White Pulp and Paper Inc., which stock would you buy? The public likes sizzle with their steak. Notall great companies are popular. Currently, a great company with a weak chart is the Microsoft Corporation (NASDAQ: MSFT). Microsofthas stunning financial statements. Most CEOs would kill for a 30% net profit margin—yet the share price of Microsoft has struggled in recentyears. Warren Buffet, one of the greatest stock market investors of modern times, is the king of finding great companies selling at bargainprices. He is a master of finding fundamentally sound companies with technically weak share prices. Dogs of the Dow is an investmentstrategy that searches for stocks in this quadrant. This strategy has several variations, each attempts to choose good industrial companies withbeaten down stock prices. I don’t fish for great companies with weak charts, but many successful investors do. If you want to find thesecompanies using an online stock screener, enter criteria like: Net Profit Margin above 10%% Price Change YTD (or 12 months) less than 0Previous Day’s Closing Price 10 or above Great companies with great charts are technically and fundamentally strong.And here finally is the category this book is about. Profit margins are thick; earnings are strong and growing. The share prices for thesecompanies are headed up and right. These are the stocks I like. These are the stocks I want to hold. In the coming chapters, I’ll show you indetail how to find these companies using online stock screening tools. The Stock Market is a Competition The stock market is a competitionwith thousands of players competing daily. If you trade equities, then you and I are players in this stock market game. Imagine for a momentyou’ve been given $50,000,000 to buy players to build the best basketball team.
8It doesn’t have to be basketball. Pick your favorite sport…soccer, football, NASCAR, etc. What players will you select? Do you want low-priced weak players? These players are definitely a bargain. You’ll save a lot of coin for nice jerseys and maybe a teamjet. There is only one problem—your team sucks! Cheap, weak players are going to end up last in the league. Do you want high-priced weak players? These players are due! This is the year they are going to shine. I know they have been using aspecial exercise machine and have these new trick sneakers that will make them go fast and strong. Weak players with high prices are longshots. Vegas is for gambling. Do you want low-priced great players? Low-priced great players are difficult to find. If they are truly great, their price will quickly becorrected. It might be hard to find a full team of these rare jewels. Often these are great players past their prime. They will always be betterthan the average player, but they’ll never be what they once were. Do you want high-priced great players? Yes. These are the players that are going to win. There is a reason top athletes are paid bigsalaries—because they’re worth it. Great companies with great stock charts offer the best opportunity for finding winners. If a stock goesfrom $20 to $200, it gets there one dollar at a time, set- ting new highs all the way up. It’s never a bargain.
9
The Mother Lode
Net Profit Margins, EPS Growth, and Stock Charts Find companies with strong fundamentals and strong technicals and you’ve found the Mother Lode. Fundamentally, I look at profit margins andearnings per share (EPS); technically, I look at stock price charts and EPS bar charts. Net profit margin has always been my favorite fundamental indicator. Great companies have above average profits. Higher net profits shouldmean the management team is more efficient, the product lines are superior, and the company is doing a better job than their competition. Forexample: Business No. 1 grosses $10M a year and brings $200,000 to the bottom line. Business No. 2 grosses $1M a year and brings $200,000to the bottom line. Given only this information, which of the two businesses would you prefer to own? Number. 1 has a net profit margin of 2% and No. 2 has a net profit margin of 20%. I want to own business No. 2 because No. 1 hasproblems. Business No. 1’s industry might be mature and price competitive. The management team might be inefficient or living high on thehog. There may be too many employees. The product lines might be inferior. There is no room for error with a 2% margin. Business No. 2 haseverything going for it. No. 2 may be in an emerging growth industry. No. 2 might have a semi-monopoly. The management team is morelikely tight and efficient. The product lines are probably stronger. There is room to weather the odd storm. Earning per share is my second favorite fundamental indicator. Great companies are growing companies. I want to see revenues growing yearover year, and I want to see earnings growing year over year. Growth is good.When you purchase a stock, you’re often speculating on thefuture growth of that company. Publicly traded companies use the money generated from the sale of stock to accelerate growth andexpansion.
10
A stock price going from the lower left-hand corner to the upper right-hand corner of a chart, with as flat a pattern as possible is my favoritetechnical indicator. I prefer finding stocks making new highs with a steady pattern leading up to that high. Three Real World ExamplesHere are real world examples of great companies with great charts. These are the types of companies I want to find and own. Try thesesymbols at your favorite online charting site. Forest Laboratories, Inc., (NYSE: FRX), develops, manufactures, and sells both branded and generic drug products for prescription andover-the-counter sales. The fundamentals for Forest Laboratories are excellent. Their net profit margin is currently 29.60%. The EPS growthrates ytd vs. ytd is 36.60%. Technical analysis of FRX is also strong. The three-month stock chart goes from the lower left corner to the upperright corner as does the three-year chart. This is a great company with a great stock chart. Shuffle Master, Inc., (NASDAQ: SHFL), develops, manufactures, and sells automatic card shufflers for casinos. Shuffle Master has anexcellent net profit margin of 25.10%. The EPS growth rates ytd vs. ytd is 12.20%. Both the three- month and three-year stock charts areheaded up and right. This is a great company with a great stock chart. Boston Properties, Inc., (NYSE: BXP), is a self-managed real estate investment trust (REIT). Boston Properties has a net profit margin of35.80%. Their EPS growth rates year-to-date vs. year-to-date is 64.80%. Both the three-year and three-month stock charts are headed upand right. This is a great company with a great stock chart. These are the companies I want to own. These companies are stock market gold. Firing on all CylindersMy approach to stock picking combines the fundamental business indicators with the technical stock price indicators. A stock with both factorspushing it upward is firing on all cylinders. It has the engine power to keep climbing. I’m not comfortable buying a stock only because of itsgreat balance sheet. This completely ignores the fact that traders are emotional. More than just accounting influences the people who play thestock market game.
11The book by author Charles Mackay, Extraordinary Popular Delusions & the Madness of Crowds, details the large-scale irrational madness ofpeople during a craze. The Tulip Bulb mania of 1624 is really no different than the dot-com frenzy of the late 1990s. Investors are emotionaland not always rational. I won’t buy a stock only because the share price is headed up and is repeating a chart pattern. “As a science, I should say that chart reading shares a pedestal with astrology; but most chart readers are educated men and have
too much mental discipline to take astrology seriously.”
—Fred Schwed Jr., Where Are the Customers’ Yachts?
Investors searching for companies using both technical and fundamental criteria will have the best chance of picking winners. These stocksare financially strong and technically popular.
12
Simple Stock Screening Rules
Online Screening ToolsIn the next two chapters, I’ll show how I screen for stocks. This is the fundamental portion of company research. In chapter 5, I’ll show how Itake the stock screener results and weed them down further using basic chart reading. This is the technical side of company research. I try tofind 50 to100 stocks during first screen, depending on market conditions. In an up-trending market, I’ll find more stocks, and in a down-trendingmarket I’ll find less. I reduce the list of 100 prospects to 10 by looking at the price charts and EPS graphs. Many Web sites offer free stock screening tools. These tools vary from simple to complex. Even basic screeners can help you quickly producea short list of stocks for consideration. Here are four, free stock screener Web sites. I’ve listed some of the search criteria available. Theselists might seem long and complex, but don’t have a conniption fit—in the end, we will only use three or four rules for the basic search, andfive to seven rules for the pro-level search. Most screeners offer enough parameters to make you hurl. It’s refreshing to know that our basicsearch will be relatively simple, yet robust.
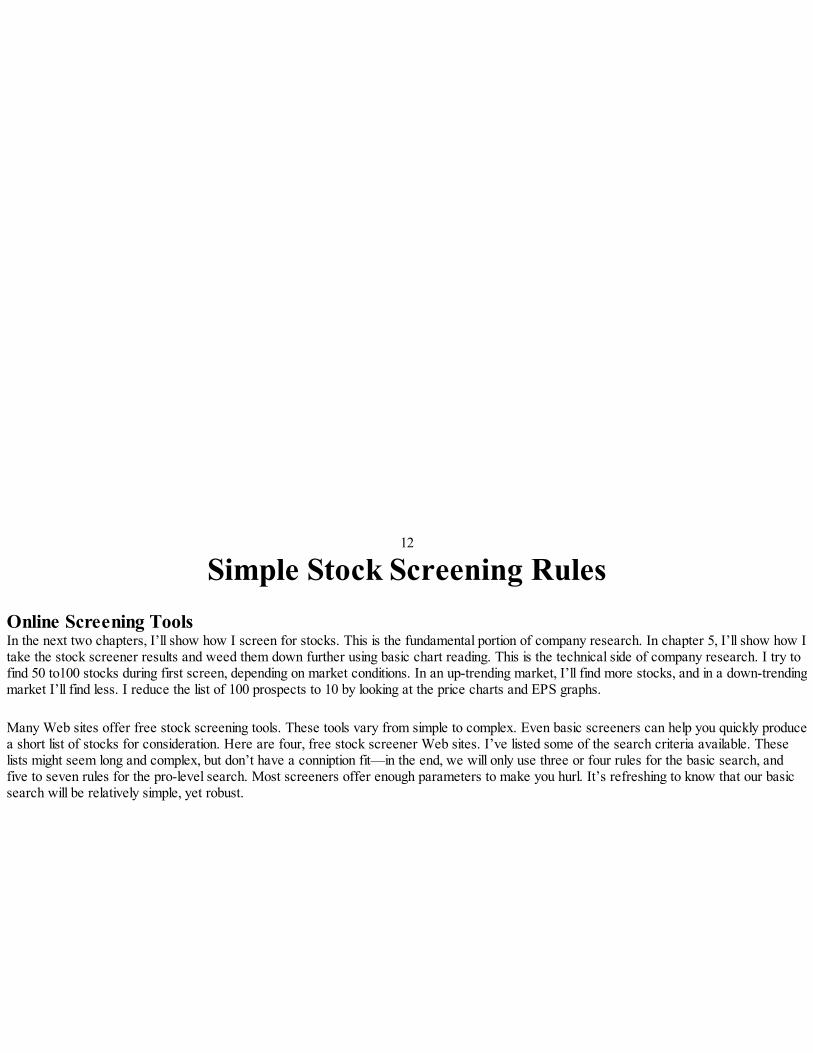
13Market Watch Stock Screenerhttp://www.marketwatch.com/tools/stockresearch/screener/ is an easy to use, entry-level screening system with impressive results. This website is jam-packed full of company data and research.

Screen capture from the MarketWatch Stock Screener14
Yahoo! Finance Stock Screenerhttp://screen.yahoo.com/stocks.html is another easy to use yet slightly more advanced screener that offers various selection criteria.
Screen capture of the Yahoo! Finance screener
15Google Finance Stock Screenerhttp://www.google.com/finance/stockscreener One of my new favorite free stock screeners is the Google Finance Screener. It’s fun to use as the rules are controlled with value boxes orsliders. These sliders also give value reference to how many companies you are including or excluding from you seach criteria.
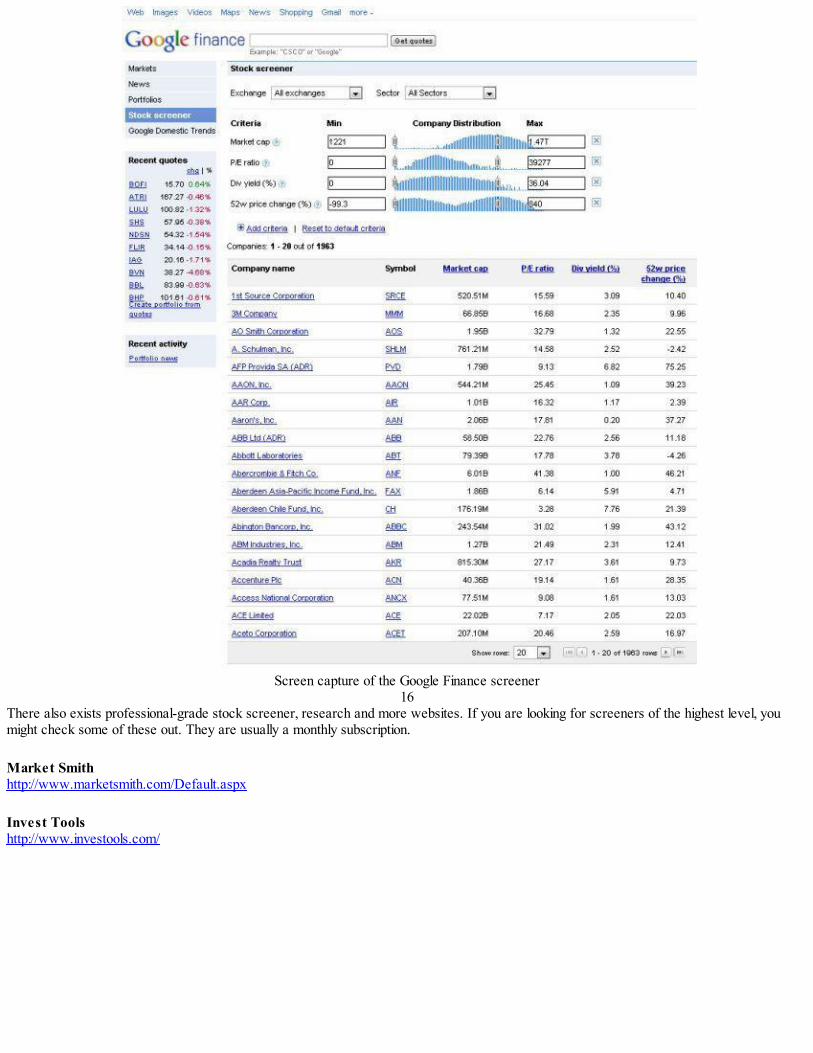
Screen capture of the Google Finance screener
16There also exists professional-grade stock screener, research and more websites. If you are looking for screeners of the highest level, youmight check some of these out. They are usually a monthly subscription. Market Smithhttp://www.marketsmith.com/Default.aspx Invest Toolshttp://www.investools.com/

17
Three Rules for a Simple Screen—The 15/15/15 Traders often believe that a stock or futures trading system or screening method needs to be complex. More rules and complexities oftencurve-fits the data. Good screens are simple, logical, profitable, and not overly optimized. This produces robust results. Stock price is $15+This rule is designed to avoid the dangers of low-priced equities. Most investors consider any stock under $5 a penny stock. William J. O’Neil,author of How to Make Money in Stocks writes, “I do not like to buy any common stock that sells below $10 to $12 a share. If you want to fly,why not go first class?” Net profit margin is 15%+The net profit margin is an important indicator of business strength and health. Net profit margins of 15% or more are the exceptionalcompanies I want to find. 5 year EPS growth 15%+Great companies grow. Growing earnings provide the foundation for future stock price growth. I want to find companies with earnings pershare up at least 15% for last 5 years.
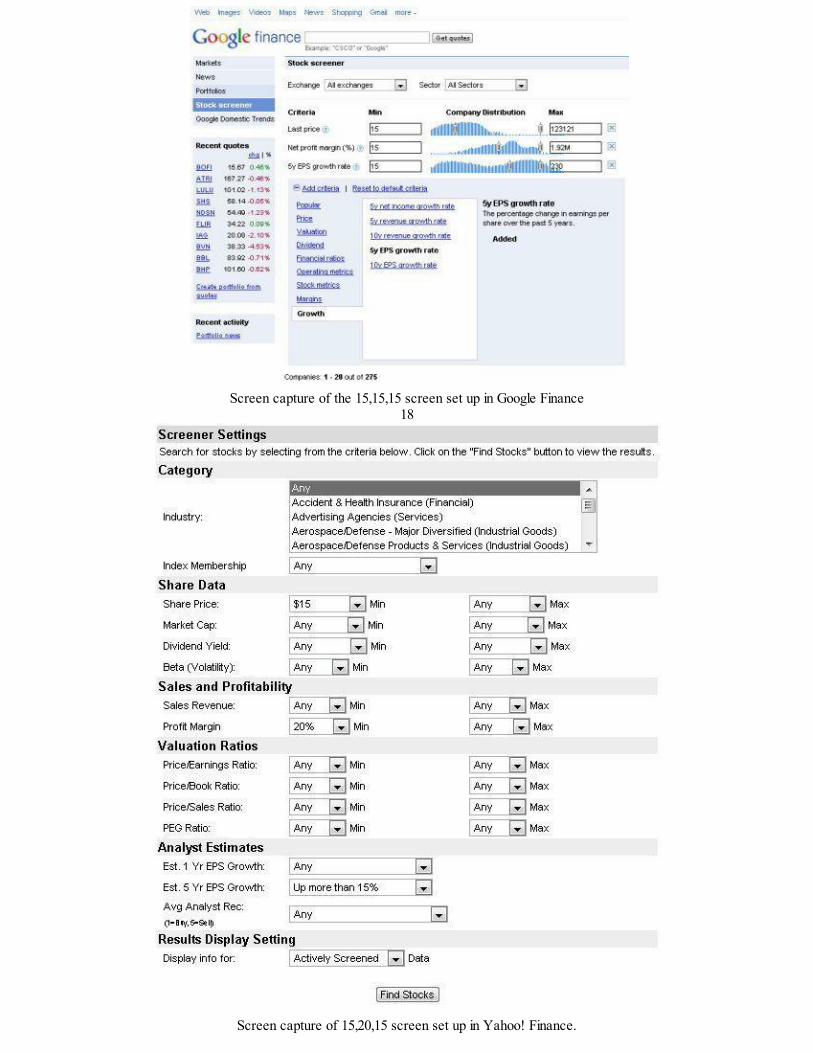
Screen capture of the 15,15,15 screen set up in Google Finance
18
Screen capture of 15,20,15 screen set up in Yahoo! Finance.

Notice I had to choose a Profit Margin of 20% based on the fixed choices available. We can be flexible. I wanted to add that the choice of 15 as a basis point needs to change with market conditions: in difficult times like today, 15works great. When the enonomy is on fire and growing, we might choose 20,20,20. Our goal is to get 100-300 companies in ourfinal search result that we can then weed through by hand, looking for the best ones.
19
Pro-Level Stock Screening RulesThe simple system above is all we need to get started on the search for great companies with great charts. There are a few additional ruleswe might consider to save time and effort. Market Cap $100M to $1BAgain I would use this rule depending on market conditions; in tough economic times I would not use this rule because it is hard enough to findwinning stocks. In prosperous times, it helps to find companies that are $100M to $1B in size. Smaller companies have an easier time growingwhen they are young and expanding. Volume 1000+This rule just avoids companies that are thinly traded. Thin trading can make it hard to enter and exit the stock. We want to avoid low volumetraded securities. Previous Days Closing Price Near 52 Week HighNot all screeners have this rule; if yours does, this rule helps find companies that are moving upward recently. In later chapters we will use achannel-breakout method to purchase stocks; it helps if they are in new highs.
Screen capture of the Google screener with Market Cap and Volume Rules
20
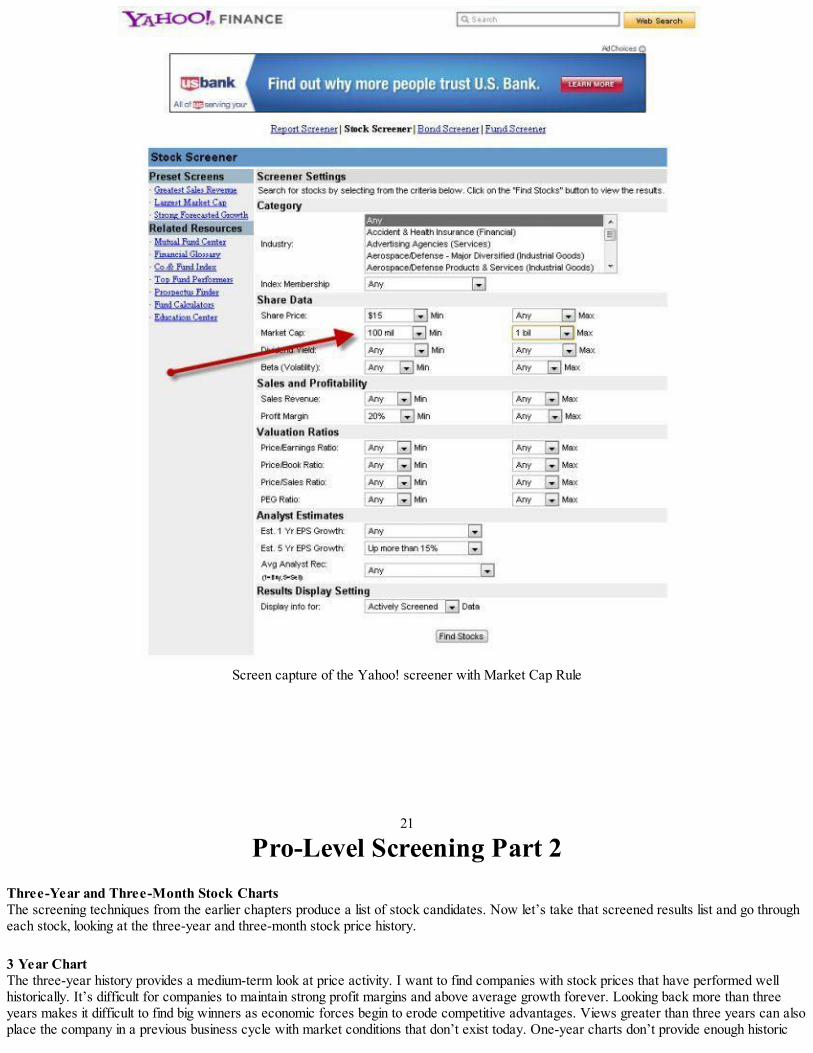
Screen capture of the Yahoo! screener with Market Cap Rule
21
Pro-Level Screening Part 2
Three-Year and Three-Month Stock ChartsThe screening techniques from the earlier chapters produce a list of stock candidates. Now let’s take that screened results list and go througheach stock, looking at the three-year and three-month stock price history. 3 Year ChartThe three-year history provides a medium-term look at price activity. I want to find companies with stock prices that have performed wellhistorically. It’s difficult for companies to maintain strong profit margins and above average growth forever. Looking back more than threeyears makes it difficult to find big winners as economic forces begin to erode competitive advantages. Views greater than three years can alsoplace the company in a previous business cycle with market conditions that don’t exist today. One-year charts don’t provide enough historic
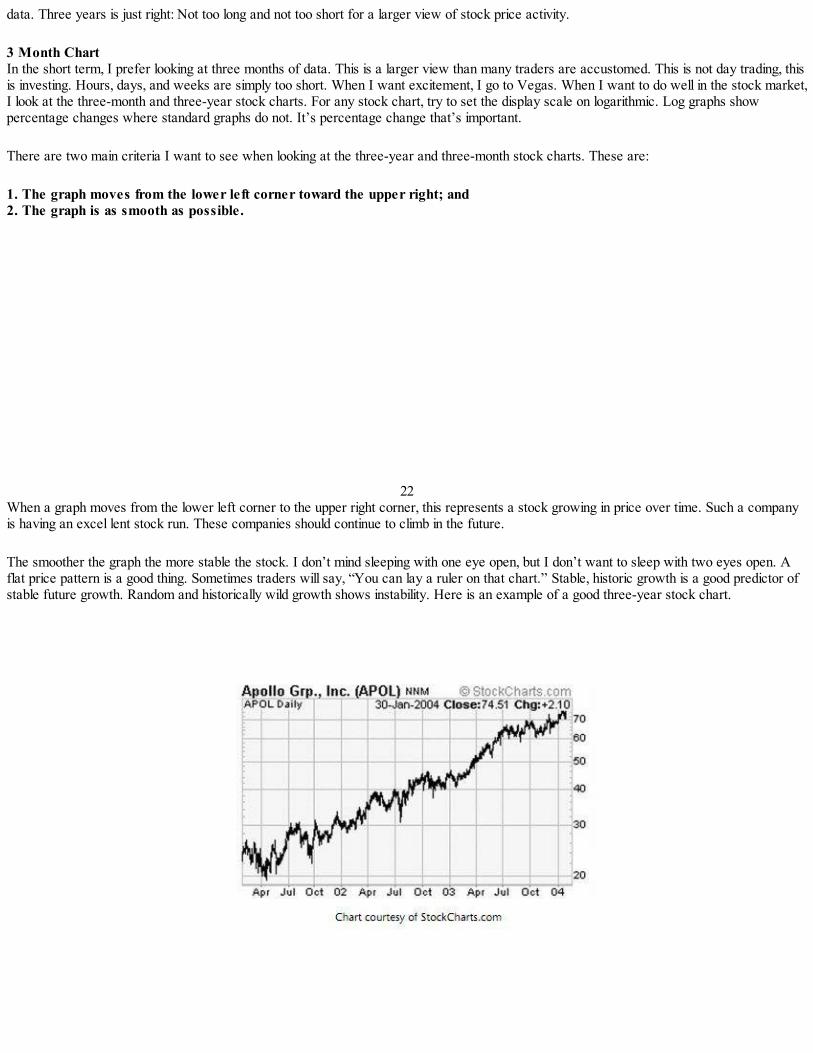
data. Three years is just right: Not too long and not too short for a larger view of stock price activity. 3 Month ChartIn the short term, I prefer looking at three months of data. This is a larger view than many traders are accustomed. This is not day trading, thisis investing. Hours, days, and weeks are simply too short. When I want excitement, I go to Vegas. When I want to do well in the stock market,I look at the three-month and three-year stock charts. For any stock chart, try to set the display scale on logarithmic. Log graphs showpercentage changes where standard graphs do not. It’s percentage change that’s important. There are two main criteria I want to see when looking at the three-year and three-month stock charts. These are: 1. The graph moves from the lower left corner toward the upper right; and2. The graph is as smooth as possible.
22When a graph moves from the lower left corner to the upper right corner, this represents a stock growing in price over time. Such a companyis having an excel lent stock run. These companies should continue to climb in the future. The smoother the graph the more stable the stock. I don’t mind sleeping with one eye open, but I don’t want to sleep with two eyes open. Aflat price pattern is a good thing. Sometimes traders will say, “You can lay a ruler on that chart.” Stable, historic growth is a good predictor ofstable future growth. Random and historically wild growth shows instability. Here is an example of a good three-year stock chart.

23Here is an example of a good three-month stock chart.
The three-month charts generally appear jagged and less stable than the three year charts. I allow the three-month charts more freedom whenanalyzing them. This chart for Hot Topic Inc., (NASDAQ: HOTT) has greater volatility, but is still good.
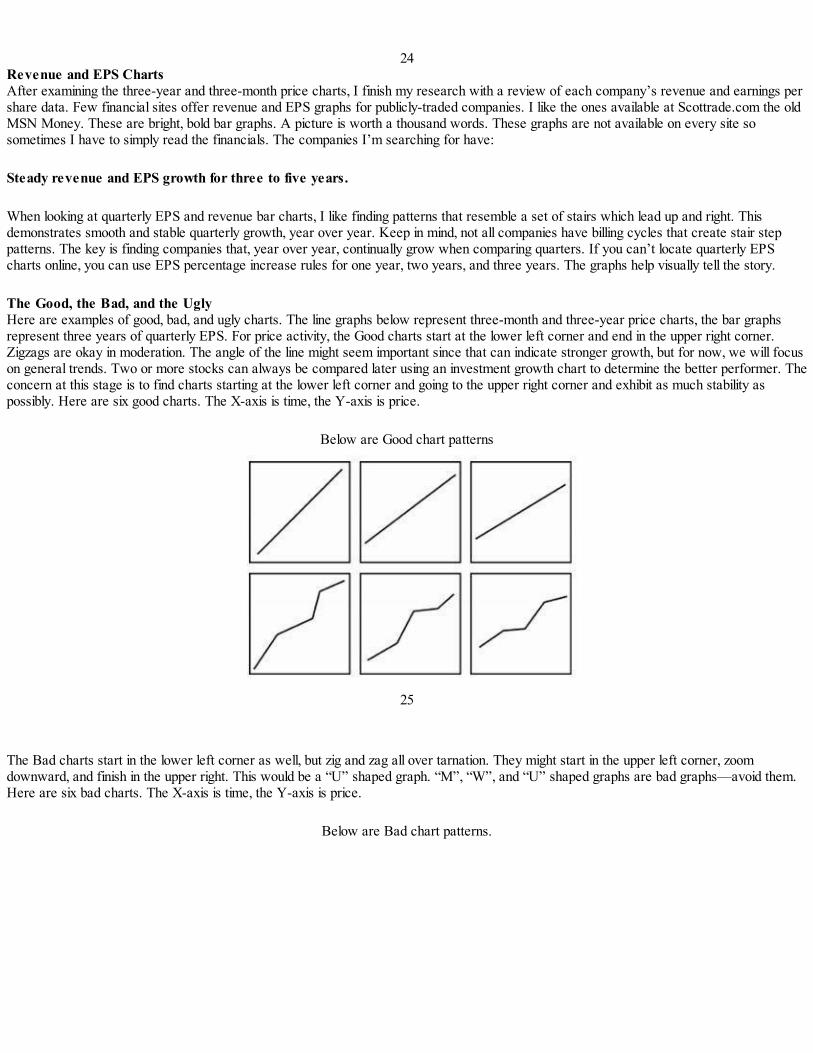
24Revenue and EPS ChartsAfter examining the three-year and three-month price charts, I finish my research with a review of each company’s revenue and earnings pershare data. Few financial sites offer revenue and EPS graphs for publicly-traded companies. I like the ones available at Scottrade.com the oldMSN Money. These are bright, bold bar graphs. A picture is worth a thousand words. These graphs are not available on every site sosometimes I have to simply read the financials. The companies I’m searching for have: Steady revenue and EPS growth for three to five years. When looking at quarterly EPS and revenue bar charts, I like finding patterns that resemble a set of stairs which lead up and right. Thisdemonstrates smooth and stable quarterly growth, year over year. Keep in mind, not all companies have billing cycles that create stair steppatterns. The key is finding companies that, year over year, continually grow when comparing quarters. If you can’t locate quarterly EPScharts online, you can use EPS percentage increase rules for one year, two years, and three years. The graphs help visually tell the story. The Good, the Bad, and the UglyHere are examples of good, bad, and ugly charts. The line graphs below represent three-month and three-year price charts, the bar graphsrepresent three years of quarterly EPS. For price activity, the Good charts start at the lower left corner and end in the upper right corner.Zigzags are okay in moderation. The angle of the line might seem important since that can indicate stronger growth, but for now, we will focuson general trends. Two or more stocks can always be compared later using an investment growth chart to determine the better performer. Theconcern at this stage is to find charts starting at the lower left corner and going to the upper right corner and exhibit as much stability aspossibly. Here are six good charts. The X-axis is time, the Y-axis is price.
Below are Good chart patterns
25
The Bad charts start in the lower left corner as well, but zig and zag all over tarnation. They might start in the upper left corner, zoomdownward, and finish in the upper right. This would be a “U” shaped graph. “M”, “W”, and “U” shaped graphs are bad graphs—avoid them.Here are six bad charts. The X-axis is time, the Y-axis is price.
Below are Bad chart patterns.
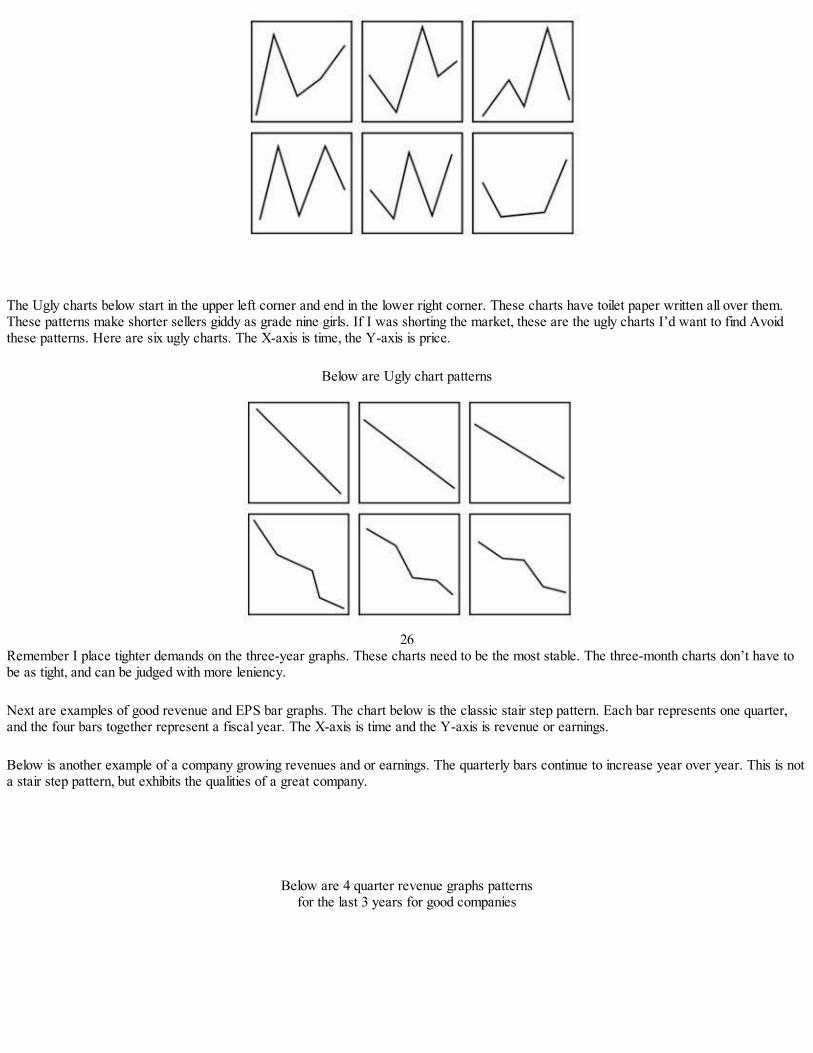
The Ugly charts below start in the upper left corner and end in the lower right corner. These charts have toilet paper written all over them.These patterns make shorter sellers giddy as grade nine girls. If I was shorting the market, these are the ugly charts I’d want to find Avoidthese patterns. Here are six ugly charts. The X-axis is time, the Y-axis is price.
Below are Ugly chart patterns
26
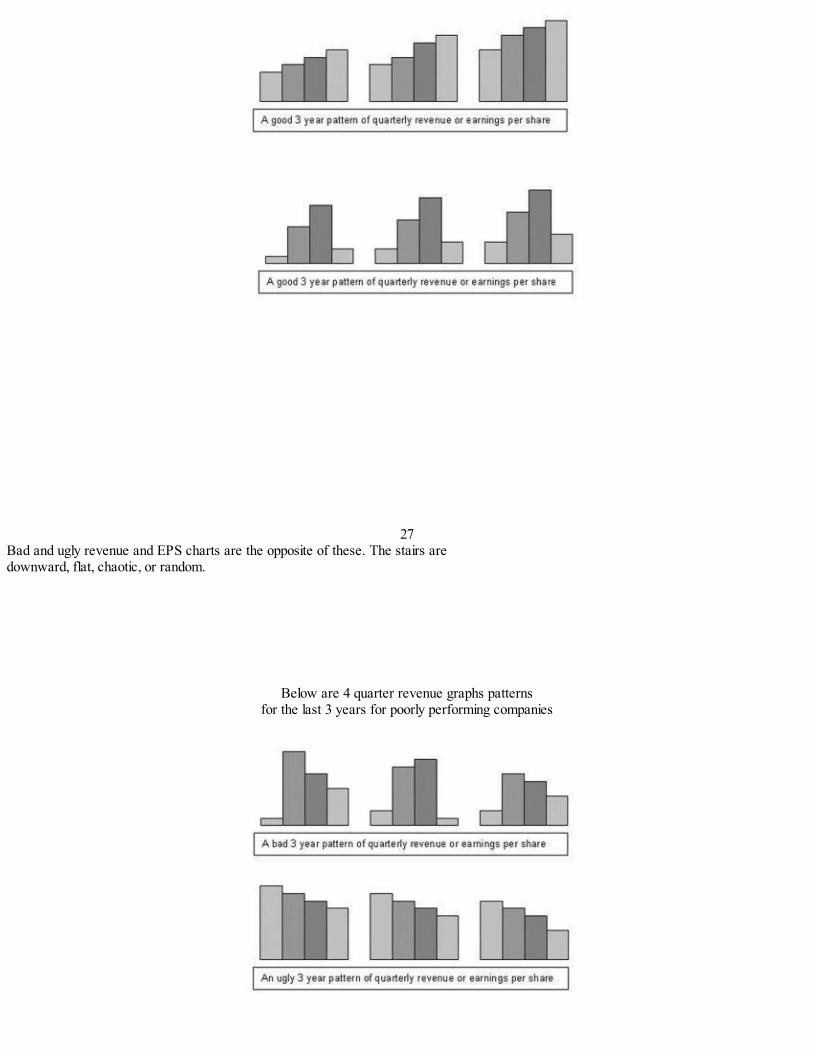
Remember I place tighter demands on the three-year graphs. These charts need to be the most stable. The three-month charts don’t have tobe as tight, and can be judged with more leniency. Next are examples of good revenue and EPS bar graphs. The chart below is the classic stair step pattern. Each bar represents one quarter,and the four bars together represent a fiscal year. The X-axis is time and the Y-axis is revenue or earnings. Below is another example of a company growing revenues and or earnings. The quarterly bars continue to increase year over year. This is nota stair step pattern, but exhibits the qualities of a great company.
Below are 4 quarter revenue graphs patternsfor the last 3 years for good companies
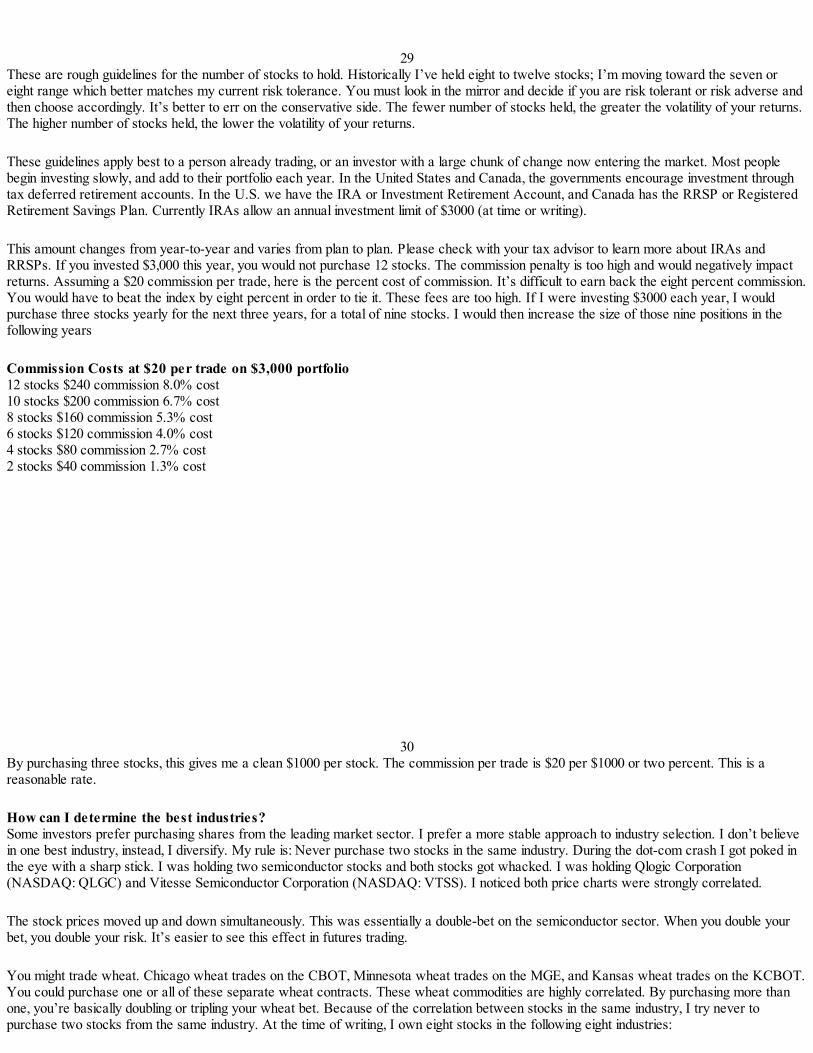
27Bad and ugly revenue and EPS charts are the opposite of these. The stairs aredownward, flat, chaotic, or random.
Below are 4 quarter revenue graphs patternsfor the last 3 years for poorly performing companies

28
Additional Rules There are four additional rules I use for stock selection. These add stability to my investment returns when I answer the following questions: 1. How many stocks should I own?2. How can I determine the best industries?3. How can I remain logical and unemotional?4. How can I release my discretionary ideas? How Many Stocks Should I Own?The number of stocks held in a portfolio greatly influences both risk and return and is similar to the accelerator pedal of an automobile. Howfast do you want to drive? Holding more stocks can reduce risk and return. Holding fewer stocks can increase risk, volatility, and return. If youhold the five hundred stocks of the S&P500, there is no way to beat the index—you can only tie it. Even one hundred shares will mimic the daily return of the S&P. Holding more shares does decrease volatility; this is a double-edged sword asreturns are also decreased. You may be asking yourself, “Andy, why don’t I buy only one or two stocks?” You increase the mathematical riskof ruin as you approach owning a single stock. You might get lucky, pick a winner, and have excellent results. You might get unlucky, pick aloser, and have your investment snowball and evaporate into nothing. Too much or too little of a good thing can be dangerous. You need to finda balance where you’re comfortable. Earlier I asked how fast you’d like to drive. This is a metaphor for your risk tolerance: How Fast To Drive55mph—twelve to fifteen stocks65mph—ten to twelve stocks75mph—eight to ten stocks85mph—six to eight stocks95mph—four to six stocks
29These are rough guidelines for the number of stocks to hold. Historically I’ve held eight to twelve stocks; I’m moving toward the seven oreight range which better matches my current risk tolerance. You must look in the mirror and decide if you are risk tolerant or risk adverse andthen choose accordingly. It’s better to err on the conservative side. The fewer number of stocks held, the greater the volatility of your returns.The higher number of stocks held, the lower the volatility of your returns. These guidelines apply best to a person already trading, or an investor with a large chunk of change now entering the market. Most peoplebegin investing slowly, and add to their portfolio each year. In the United States and Canada, the governments encourage investment throughtax deferred retirement accounts. In the U.S. we have the IRA or Investment Retirement Account, and Canada has the RRSP or RegisteredRetirement Savings Plan. Currently IRAs allow an annual investment limit of $3000 (at time or writing). This amount changes from year-to-year and varies from plan to plan. Please check with your tax advisor to learn more about IRAs andRRSPs. If you invested $3,000 this year, you would not purchase 12 stocks. The commission penalty is too high and would negatively impactreturns. Assuming a $20 commission per trade, here is the percent cost of commission. It’s difficult to earn back the eight percent commission.You would have to beat the index by eight percent in order to tie it. These fees are too high. If I were investing $3000 each year, I wouldpurchase three stocks yearly for the next three years, for a total of nine stocks. I would then increase the size of those nine positions in thefollowing years Commission Costs at $20 per trade on $3,000 portfolio12 stocks $240 commission 8.0% cost10 stocks $200 commission 6.7% cost8 stocks $160 commission 5.3% cost6 stocks $120 commission 4.0% cost4 stocks $80 commission 2.7% cost2 stocks $40 commission 1.3% cost
30By purchasing three stocks, this gives me a clean $1000 per stock. The commission per trade is $20 per $1000 or two percent. This is areasonable rate. How can I determine the best industries?Some investors prefer purchasing shares from the leading market sector. I prefer a more stable approach to industry selection. I don’t believein one best industry, instead, I diversify. My rule is: Never purchase two stocks in the same industry. During the dot-com crash I got poked inthe eye with a sharp stick. I was holding two semiconductor stocks and both stocks got whacked. I was holding Qlogic Corporation(NASDAQ: QLGC) and Vitesse Semiconductor Corporation (NASDAQ: VTSS). I noticed both price charts were strongly correlated. The stock prices moved up and down simultaneously. This was essentially a double-bet on the semiconductor sector. When you double yourbet, you double your risk. It’s easier to see this effect in futures trading. You might trade wheat. Chicago wheat trades on the CBOT, Minnesota wheat trades on the MGE, and Kansas wheat trades on the KCBOT.You could purchase one or all of these separate wheat contracts. These wheat commodities are highly correlated. By purchasing more thanone, you’re basically doubling or tripling your wheat bet. Because of the correlation between stocks in the same industry, I try never topurchase two stocks from the same industry. At the time of writing, I own eight stocks in the following eight industries:

Internet Software & ServicesWireless CommunicationsRegional—Mid-Atlantic BanksDiversified ElectronicsMedical Instruments & SuppliesApparel StoresEducation & Training ServicesREIT—Retail
31How Can I Remain Logical and Unemotional?I want to be logical like Star Trek’s Mr. Spock when I trade. Emotions are dangerous as they can lure us into acting irrationally. The rule I useto remain emotionally unattached to my holdings is: Never buy stocks you’re emotionally invested in. If you love cars, you might want to avoid purchasing auto stocks. If you live for computers, you might want to avoid purchasing computer-manufacturing stocks. Avoid buying stocks you’re emotionally invested in. If you own such stock, you might be tempted to hold onto it too longwhen it’s going down because you know in your heart that it’s going to turn around soon. If you’re about to purchase such a stock, you mightbe tempted to buy double the amount because you can just “feel it in your bones” that it’s going to be the next huge winner. These are notrational decisions, but emotional ones. Emotion has no place in trading. I avoid buying stocks I care about. I like to play poker. I remember when poker.com (BB:PKER) began trading in 1999. Yes, I foolishlybought a stock under $10. I watched PKER go up a few days, and then I watched it go down—way down. My heart was saying, “I lovepoker! Everyone loves poker! This is going to be the greatest thing on the Internet ever!” I could not get out of this trade. I was emotionallyinvested in the stock. I think I finally sold after a 90% loss. Ouch. Never buy stocks you’re emotionally invested in. I admit I’m human and get tempted. I felt guilty buying The Mills Corporation (NYSE: MLS) earlier this year. I live near the Mills Mall insouthern California, and I like seeing the parking lot full of shoppers. This stock met all of my screening criteria and I never shop at the mall. Ibuy everything online. I decided it was safe to own this stock.

32How Can I Release My Discretionary Ideas?Mechanical trading systems are boring. There are few decisions to be made and there is little room for creative thought. Boredom candangerous. You might be tempted to continually change or adjust your stock picking criteria to stay entertained. To build in a creative check-valve, I allow myself to purchase one stock for reasons other than those found using my mechanical system. This discretionary purchase is usually a promising new company that hasn’t reached profitability. I place a bet on their future success. I limitthis activity to one stock, this amounts to between 10% and 15% of my total portfolio value. I’ve held up to two stocks purchased in thismanner, but consider this more risky. This rule can be stated as: Release your discretionary ideas by picking one stock non-mechanically. I willadmit the older I get, the less and less I need this rule since many times this discretionary pick has performed poorly. Customize a System by Toggling Three SwitchesThe stock selection rules described in the previous chapters can be adjusted to match an investor’s risk tolerance. These three parameters canbe increased or decreased: 1. Minimum stock price2. Minimum percentage3. Quantity of stocks held Minimum Stock PriceI select $15 as my minimum stock price. I realize this is an extreme stance. You might wish to reduce this figure to $12, or $10. The lower thevalue, the greater the risk you take. You will produce more stocks in the screened results since this relaxes the parameter. You could alsoincrease the minimum price upward. I believe $20 is on the high side and little or nothing will be gained by increasing passed that. Minimum PercentageOn the simple three-rule 15/15/15 screen, I set the minimum values to 15%. These values can be adjusted higher or lower to best meet yourneeds. A higher minimum value will tighten the parameters and produce fewer results. A lower minimum value will loosen the parameters andproduce more results. You might want to try the 20/20/20 if you are risk adverese and 10/10/10 if you are a gambler at heart. Higher valuesare safer. I adjust the criteria based on current market conditions. In a bear market, I’ll loosen the parameters. In a bull market I’ll tighten. Mygoal is to have the screens produce a short list of 100 to 300 companies. I adjust to meet this goal.
33Quantity of Stocks HeldAs stated earlier, the amount of stocks held will influence both your risk and return. Nine or 10 stocks is a good number to hold as yourportfolio gets larger. You may choose to hold more or less stocks to meet your risk tolerance and investment return needs. Holding fewerstocks creates additional volatility and greater risk. Three Rules Used by Exceptional InvestorsI trade stocks a certain way. This is a style choice. There are thousands of successful investors and no two investor’s trade exactly alike.Below are three rules you might consider based on the ideas of three exceptional investors. I don’t use these rules but it’s important tounderstand that there is more than one way to find winning stocks. These investors are: William J. O’Neil

David and Tom GardnerMartin Zweig These investors trade differently and use slightly different rules that match their styles. Here are three rules you might consider based on theirtechniques: Institutional SponsorshipWilliam J. O’Neil, author of How to Make Money in Stocks writes, “It takes big demand to move supply up, and the largest source ofdemand for stock is by far the institutional buyer.” O’Neil picks stocks that are owned by mutual funds, pension funds, or hedge funds etc. O’Neil wants to see three to 10 mutual fundssponsoring a stock. Some stock screening tools offer the parameter “% Held By Institutions” or “% Institutional Sponsorship.” If I were goingto add Institutional Sponsorship to my screener, the rule would be: Institutional sponsorship is greater than 50%
34
Small CapsDavid and Tom Gardner, authors of The Motley Fool Investment Guide write, “Since 1929, small caps have, as a group, well exceededthe overall returns of larger stocks.” The Gardner’s classify small capitalization growth stocks as stocks in the $50 million range to $500 million range.
The market capitalization for any stocks is the total dollar value of all the outstanding shares. Market cap is calculated by multiplying thenumber of shares times the current stock price per share. Some stock screening tools offer the market cap parameter. If I were going to addthe small cap criteria to my screener, the rules would be: 1. Market capitalization greater than $50 million2. Market capitalization less than $500 million

35
P/E RatioMartin Zweig, author of Martin Zweig’s Winning on Wall Street writes, “Soon I began to understand the role of earnings in valuingstocks. Also becoming clearer was the relationship between the price and earnings, the P/E ratio.” The P/E ratio can also be called the “multiple.” This is the last closing price divided by the latest 12 months’ earnings per share. Investors suchas Zweig avoid both stocks with very high or very low P/E ratios. I don’t use the P/E ratio, but many successful investors do. P/E is affectedby market conditions, and I would adjust upward or downaccordingly. If I were to state two P/E rules, they would be: 1. P/E ratio is greater than 152. P/E ratio is less than 35
36
Sample Stocks Eight StocksAt the time of writing I was holding eight stocks in my portfolio. I found them using a simple five-rule screen as described in previous chapters.Once I purchase a stock, I exit the trade based on price performance. I do not exit a trade if the stock fails to meet the screening criteria afterthe purchase. For example, if I bought XYZ Corporation and their net profit margin fell to 11%, I would not sell for failure to maintain thescreen rules. I would sell based on poor stock price performance. These are the stocks I held in the winter of 2003. These are not recommendations to buy. As of December 22, 2003, these holdings werebeating all three indexes including the high flying NASDAQ. Apollo, Inc. APOL............................. 11/21/2001Chico’s FAS, Inc. CHS..................... 03/06/2003The Cooper Corporation COO ….....10/28/2002International Game Tech IGT........... 10/04/2002Mobile TeleSystems MBT …............10/17/2002The Mills Corporation MLS …............11/21/2002Virginia Commerce Bancorp VCBI... 08/11/2003Amazon.com, Inc. AMZN …...............02/24/2003
37Past performance is not proof of future gains. A one-year track record is not statistically significant. I’ve been trading for the last 10 years. Iwas a seat-of-the-pants emotional investor until the dot-com boom gave me the whack. This rude awakening was the stimulus I needed todevelop the complete, logical, and mechanical system I now use. You may have noticed that I’ve held many of these stocks for a year ormore. I prefer to never sell a stock; this would mean it’s always headed up. I only sell when a stock performs poorly. Let your winners runinfinitely. Take your losses quickly. I never sell to capture short-term gain. As an example, if your stock goes up and you decide to take the profit and sell—now what? You sold a great stock that may have kept goingup. Those kinds of stocks are hard to find and now you have to find another. You found the gold, so why close the mine? The sale may alsocreate tax law capital gains issues. A body in motion tends to stay in motion and a stock in motion tends to stay in motion. Let your winnerscontinue to win. The time to sell a stock is when it goes down. The trend will eventually bend downward and the order to sell will be hit. Profits or losses are then captured. The market decides when astock should be sold. You may have noticed that Amazon.com, Inc., is at the end of the list and separated from the other stocks. This holding
was purchased with my release of discretionary ideas rule. I buy everything online and have done so since 1996. I admire www.amazon.comand was flabbergasted when the stock fell under $10. I knew Amazon.com was the Internet shopping leader with the excellent shopping cart.I always shopped there. If Amazon.com were going to fail, Internet commerce would fail. I believed passionately that online shopping wouldbecome huge and Amazon.com would reach profitability. I had to place my money where my mouth was. I purchased 1000 shares. As luckwould have it, Jeff Bezos is chewing bubble gum and kicking ass and he’s all out of bubble gum. This discretionary purchase has fortunatelyperformed well. Six Stocks I Sold This YearThese are the stocks I sold in 2003: Doral Financial Corp. DRL............. 02/24/2003 07/31/2003Forest Laboratories, Inc. FRX........ 09/11/2002 02/14/2003Infosys Technologies Ltd. INFY …..11/04/2002 03/07/2003
38 Three of these stocks netted a profit, two had losses, and one was basically neutral. The price trend dictated when to sell. These soldsecurities represent great companies. When I sell a stock, I don’t hate it or love it, it’s just business. I’m not mad at the stock for going down.I’ll consider buying the stock again if it passes the screening criteria. I don’t fear the stock because of its short-term negative priceperformance. I would reevaluate and consider adding it to my portfolio in the future. I sold Shuffle Master, Inc., (NASDAQ: SHFL) last year,. A couple weeks later, it reversed and began climbing. I repurchased this stock aweek ago. Generally, the average holding time of my sold stocks is less than the current stocks in the portfolio. This is a natural part of thesystem, since winners are allowed to run where poor performers are sold sooner. My longer than average holding times might surprise sometraders. I’m not a day trader and I don’t suggest you day trade. Brown & Brown, Inc., was a special case. I’ve been testing a new rule to deal with flat performance. A flat trending stock could float inside aportfolio indefinitely, hurting overall performance—I’d hate to have three pieces of dead wood. I’m currently testing a rule that would removethe weakest stock from my holdings once every 12 months. BRO was weeded because of this test. As of writing I do give myself the optionof removing a single stock from the portfolio once in June and once in December (a stock that is trending flat for a long period of time). Characteristics of These Winning StocksThe stocks I’m currently holding have several common characteristics. These include: high return on equity, high net profit margins, high yearlyEPS growth, high yearly revenue growth, and a stock price of more than $20. These winning stocks have great three-month and three-yearprice charts. Mylan Laboratories, Inc. MYL ….....02/28/2003 11/11/2003Shuffle Master, Inc. SHFL ….........10/28/2002 02/06/2003Brown & Brown, Inc. BRO …........10/11/2002 07/16/2003

39The stocks I’m holding do not have market capitalization in common. The market caps range from $250M to $20B. They do not share acommon P/E ratio. The P/E ratios range from 20 to 70. These stocks do not have institutional ownership in common. They range from fourpercent to almost 100%. There are many ways to pick winning stocks, and each investor does it his or her own way. I believe my method islogical and will continue to outperform the indexes overtime.
408

ReviewBelow is a quick review of the key points contained in the first eight chapters. The Simple Market ModelThere are two methods to research a publicly-traded company: fundamental analysis and technical analysis. Fundamental analysis includesearnings, profit margins, revenue growth, financial statements, and the future projections of a business. Technical analysis deals with stockprice movement and patterns. Investors often use only one of the two models when making stock selections. Why not combine the twomethods? Fundamental analysis determines if the company is strong or weak. Technical analysis determines if the stock chart is strong orweak. By combining the two methods, you can place companies into one of four categories: Weak Companies with Weak ChartsWeak Companies with Great ChartsGreat Companies with Weak ChartsGreat Companies with Great Charts I believe picking great companies with great price charts gives you the best advantage for finding market winners. This section explained howto find these stocks. Stocks Screeners and Price ChartsThe first step for finding great companies is screening. Online stock screeners make quick work of dull, fundamental analysis. What makes agreat company? It’s my belief that great companies produce above average profits and grow at above average rate. The screening toolsquickly find companies exhibiting these qualities.
41The simple 15/15/15 system is a three-rule screen, which produces a short list of great companies.Stock price is greater than or equal to $15Net profit margin is greater than or equal to 15%5 Year EPS growth is greater than or equal to 15% Some additional rules can be added to the screens.Market Cap $100M to $1BStock Trading Near 52 Week HighTrading Volume 1000+ These screens produce 100 to 300 publicly-traded companies. The screen rules can be adjusted upward or downward depending on marketconditions. In a bear market, I might relax these parameters. In a bull market, I might tighten these parameters. Basically, I want to obtain ashort list of 100 to 300 prospective companies. Stock price charts and EPS bar graphs are then reviewed for each company on the short list. Cream rises to the top and the great companieswith great stock charts are found. When examining the three-year and three-month price charts, a graph starting at the lower left corner andfinishing in the upper right corner is desirable. Flatter lines are better than wiggly lines because stability is preferred to volatility. Quarterly EPSbar graphs should be increasing from left to right. A stair step pattern headed up and to the right is good to find. The key is finding EPS
increasing in each quarter from one year to the next.
42There are Many Ways to Pick Winning StocksThere are thousands of successful investors and no two investors pick stocks in the exact same manner. I’m confident with my selectiontechniques. If you agree with my ideas, this stock picking system may work for you. You might use the system as presented in this section orcreate your own variation. I encourage you to read more books on the stock market to learn the various ways different investors pick winners.

43
PART IIEntering and Exiting with
Stops

44
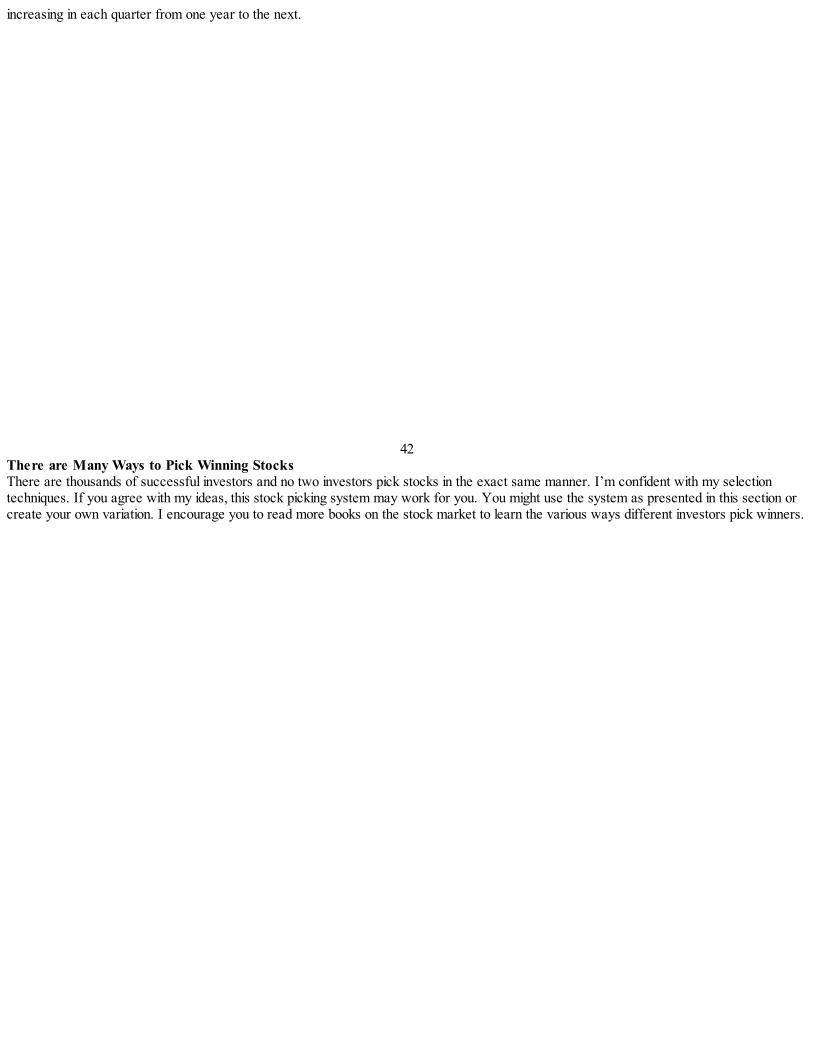
Trading Range The trading range is the area where a stock fluctuates between the highest and lowest transaction prices during a specific period of time. Thetrading range is the volatility of a stock’s price. I use the trading range to determine when to buy and when to sell a stock. I also use it todetermine how much stock to purchase. By incorporating the trading range into the trading system, better trades are made that are custom fitfor each stock. No two stocks trade identically. Stocks rarely share the same volatility. The technique described in the next few chapters,channel breakouts with buy and sell stops, has been described in several investment books. Some of the most successful stock and futurestraders use variations of this trend-following technique as a basis for their investment systems. To find the trading range for X amount of days,find the highest price and the lowest price on a given stock chart. Here are a couple examples. This is the 90-day stock chart for MicrosoftCorporation (NASDAQ: MSFT).
45
The highest high is right around 29.75 and the lowest low is right around 24.75. This the trading range for Microsoft’s stock in that time period.Here is the same stock chart presented in a slightly different format. The above chart shows the open, high, low, and closing price. Mostinvesting sites don’t carry that much data; they track only the closing price as shown in the chart below.
In this case, I would call the high $30 or $29.75 and the low $25. It doesn’t matter which type of chart you use, just be consistent. I prefer thecharts with the open, high, low, and close since you get the true highest high and the true lowest low for the last 90 days. Both charts work fine—the key is consistency.
46The range will be used to set our buy stops and to move our trailing sell stops. The range incorporates market conditions and volatility into eachtrade. Time FrameThe trading range can only be determined once a time frame has been selected. Seven day, 20-day, and 90-day ranges are popular tradingranges with trend followers. I prefer using a longer time frame. Benefits of a Shorter Trading Range• More action and excitement• Possibly slightly higher profits in testing Benefits of a Longer Trading Range• Simpler• Less work• More efficient

• Less commission• Less prone to human error• Easiest to do for the rest of your life• Tax advantages of holding periods greater than one year In back testing, 20-day trading ranges often produce the highest profits. Computer testing is not human testing and there are practical issues toconsider. A longer view of the markets is simpler and easier to maintain. Broader time frames result in larger winning trades, experience lesswhipsaws, and generate less commission. A bigger range gives a stock room to run. One additional benefit of a longer trading view is thelower capital gains tax rate for holding periods greater than one year. When using a 20-day range, almost all the trades will be short term.Capital gains will be taxed at the higher rate. A trader in the 38.6% tax bracket will pay 38.6% on that gain if it was realized by holding it lessthan one year. The capital gains rate is 20% if the asset is held for more than one year. That’s a big difference. If you’re in the 15% taxbracket, itgets even better with a rate of 10%. These lower tax rates make longer trading ranges with longer holding periods attractive. More trades willbe over one year when using a 90-day trading range. The 90-day range makes the system simpler, less work, and gener ates less commissionand tax. See your tax professional for advice on trading and capital gains.
47
BreakoutsA breakout is a rise in price above the highest point in the trading range, or a fall in price below the lowest point. I buy a stock when it breaksabove the highest high for the last 90 days. Some traders refer to the upper point in the range as a resistance level and the lowest point as asupport level. I prefer not to use these terms since it gives the trading range subjective attributes that I don’t believe exists. It’s often psychologically difficult for investors to buy a stock that has made new highs. When a stock makes a new high, this is often a goodindication it is going higher. If a stock goes from $20 to $200, it’s going to be setting new highs all the way up. I don’t want to buy low and sellhigh—I want to buy high and sell higher. I want to buy high, hold higher, and sell only when the trend ends! Buying low assumes we can timethe markets. I’m not a fortune-teller. I don’t know of any successful fortune-telling investors. A body in motion tends to stay in motion and agreat company with a great chart—whose price breaks into new highs—tends to continue higher. If I were buying Microsoft in the example earlier, I’d buy it when the price hits $30. This $30 represents a new high and a breakout to theupside of the trading channel.

48
Entering Trades with Buy Stops Stops or stop orders are orders that become market orders when a particular price level is hit. A buy stop is placed above the market. I usebuy stops to enter trades. I use buy stops because: • They confirm the stock is setting a new high• They confirm the stock is breaking out of range• The buy stop, trading range, and sell stop, are all part of a system• They allow orders to be entered in advance• They help maintain a mechanical trading system• They can prevent re-entering a bear market• They can prevent the purchase of a stock that is trending down or flat I don’t want to buy a stock and hope it will go up. I want a stock to go up and then I’ll buy it. The stock must prove it’s trending upward bybreaking out of its 90-day trading range. By purchasing stocks in this manner, you will embrace new highs rather than fear them. No bottomfishing please; purchase stocks on their way up. Winners go up and keep going up.
49
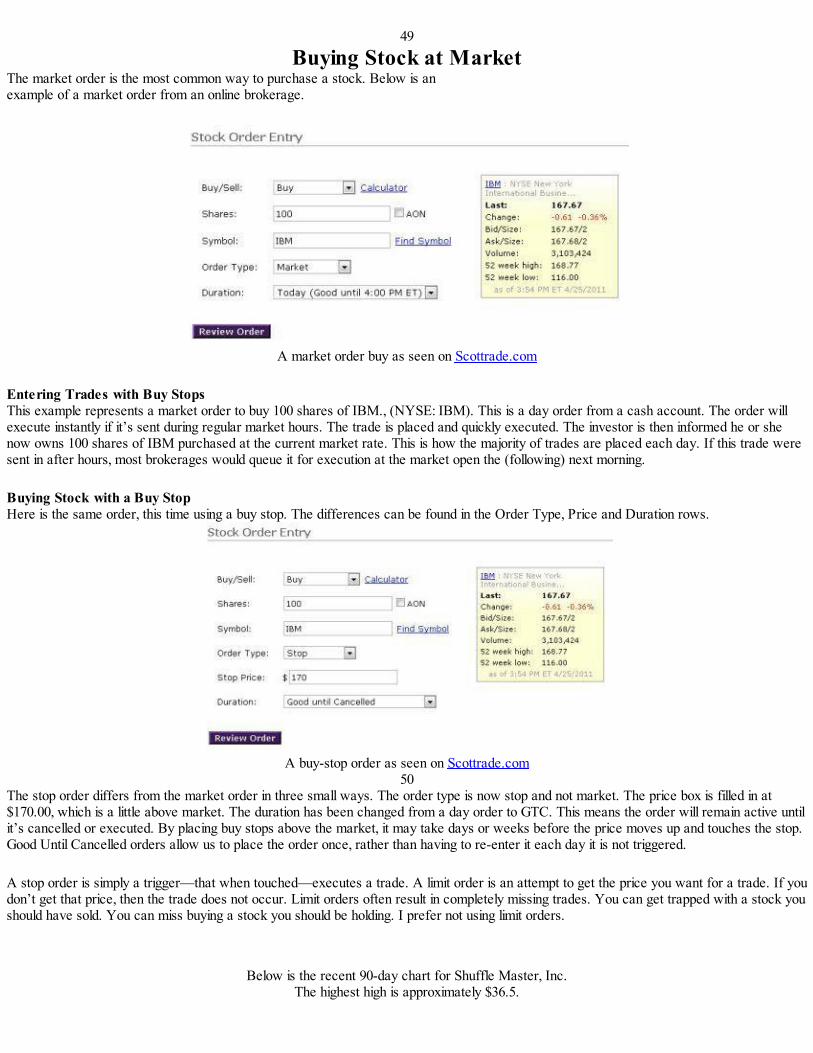
Buying Stock at MarketThe market order is the most common way to purchase a stock. Below is anexample of a market order from an online brokerage.
A market order buy as seen on Scottrade.com
Entering Trades with Buy StopsThis example represents a market order to buy 100 shares of IBM., (NYSE: IBM). This is a day order from a cash account. The order willexecute instantly if it’s sent during regular market hours. The trade is placed and quickly executed. The investor is then informed he or shenow owns 100 shares of IBM purchased at the current market rate. This is how the majority of trades are placed each day. If this trade weresent in after hours, most brokerages would queue it for execution at the market open the (following) next morning. Buying Stock with a Buy StopHere is the same order, this time using a buy stop. The differences can be found in the Order Type, Price and Duration rows.
A buy-stop order as seen on Scottrade.com
50The stop order differs from the market order in three small ways. The order type is now stop and not market. The price box is filled in at$170.00, which is a little above market. The duration has been changed from a day order to GTC. This means the order will remain active untilit’s cancelled or executed. By placing buy stops above the market, it may take days or weeks before the price moves up and touches the stop.Good Until Cancelled orders allow us to place the order once, rather than having to re-enter it each day it is not triggered. A stop order is simply a trigger—that when touched—executes a trade. A limit order is an attempt to get the price you want for a trade. If youdon’t get that price, then the trade does not occur. Limit orders often result in completely missing trades. You can get trapped with a stock youshould have sold. You can miss buying a stock you should be holding. I prefer not using limit orders.
Below is the recent 90-day chart for Shuffle Master, Inc.The highest high is approximately $36.5.

If I were to purchase 100 shares of this stock, the order would be a buy stop order priced at $37 GTC. Buy stops prevent purchasing a stockthat is about to trend downward or continues trending flat. It’s frustrating to purchase a stock and watch it head south. This can happen. Usinga buy stop helps minimize this occurrence because a stock breaking into new highs is more likely to continue trending upward. Buy stopsprevent purchasing stocks in a downward trending or bear market. I witnessed this first hand during the false recovery stages in the years thatfollowed the dot-com crash. In the big bear market, there were several stocks I wanted to purchase. No one knew where the bottom was. Iset my buy stops and watched. There were several false recoveries and my buy stops were not hit.
51The market sank lower and lower. My buy stops rarely triggered and I avoided larger losses. I would have been poked in the eye with a sharpstick several times if I had purchased these stocks at market. Buy stops appear counter intuitive in a raging bull market when every stocktrends upward. Don’t fret. Buy stops are a defensive tool and prevent heart attacks when the screaming bear comes to town.

52
Exiting Trades with Sell Stops
Sell StopsOnce again, stop orders are orders that become a market order when a particular price level is hit. A sell stop is placed below the market.Reasons to use sell stops include:• Limit losses• Preserve profits• Know when you are getting out before you get in• Discipline• Sleep at night• Remove emotional decisions Charles LeBeau and David Lucas, authors of Technical Trader’s Guide to Computer Analysis of the Futures Market write, “The truth isthat the entry is probably one of the least important ingredients in a complete and well-designed trading system. We assert thatthe real key to profits is knowing how to exit.” I agree with these authors. I want to know when I’m going to sell a stock even before I buy it. Stocks and futures are not identical financialvehicles, but do share many similar characteristics. Most books on the stock market deal with picking stocks. Investors need a completeapproach to trading. This approach must encompass picking stocks, entering trades, exiting trades, money management, and discipline. Using a sell stop insures I’m following my plan with discipline and logic. There are no emotional decisions to be made in the heat of battle.
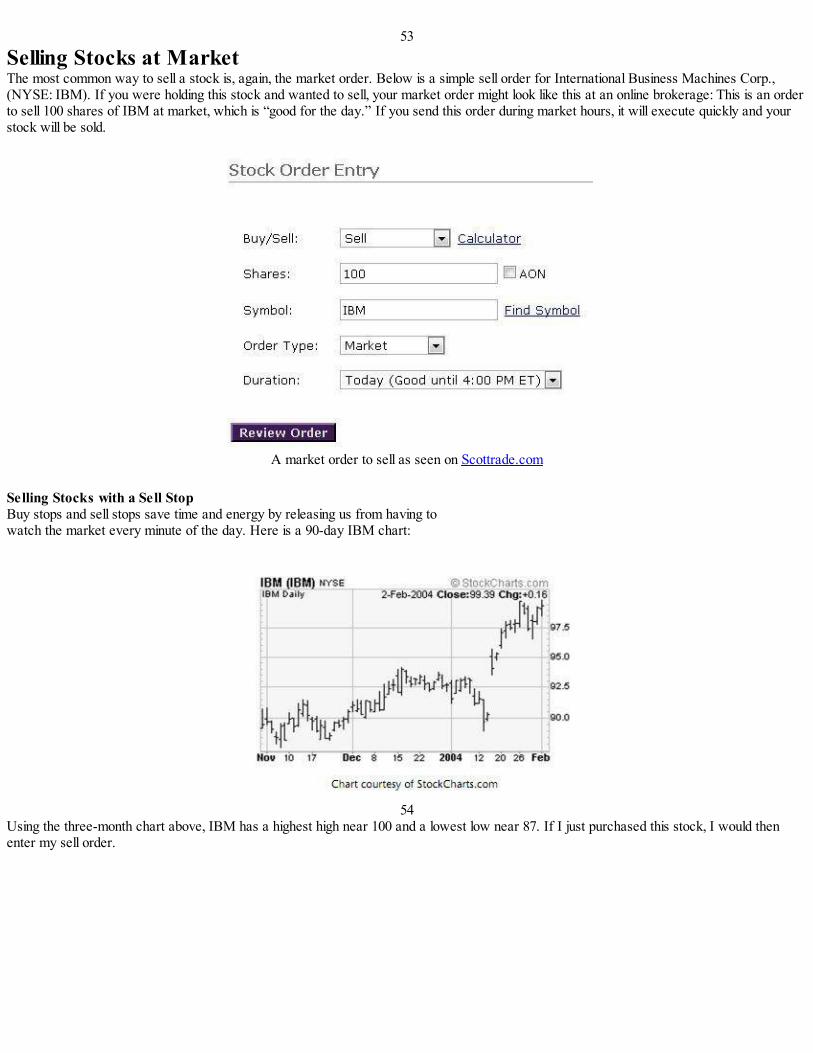
53
Selling Stocks at MarketThe most common way to sell a stock is, again, the market order. Below is a simple sell order for International Business Machines Corp.,(NYSE: IBM). If you were holding this stock and wanted to sell, your market order might look like this at an online brokerage: This is an orderto sell 100 shares of IBM at market, which is “good for the day.” If you send this order during market hours, it will execute quickly and yourstock will be sold.
A market order to sell as seen on Scottrade.com
Selling Stocks with a Sell StopBuy stops and sell stops save time and energy by releasing us from having towatch the market every minute of the day. Here is a 90-day IBM chart:
54
Using the three-month chart above, IBM has a highest high near 100 and a lowest low near 87. If I just purchased this stock, I would thenenter my sell order.

A sell-stop order as seen on Scottrade.com
Like the buy stop, there are three small changes. The price type is now stop and not market. There is a price entered in the price box whichwas previously unfilled. As soon as the market touches this price, this trade becomes active and the shares are sold. The term is now GTC.
55
Linking the Range with Stops Initial RiskThe sell stop can also be called a Stop Loss. It limits losses and therefore limits risk. There are two types of risk associated with any trade:initial risk and equity risk. The initial risk is the difference between the price you paid for the stock and the sell stop. In this EBay Inc.,(NASDAQ: EBAY) example the trading range is between $66 and $50. I would place my buy stop at $66 and once in the trade, I would placemy sell stop at $50. If I were purchasing 100 shares, the initial risk would be 100 times ($66-$50) equals $1,600.

My loss is limited to $1,600. I’m ignoring commission and slippage to keep the examples simple. Please note that commission and slippagemight make the loss $30 to $60 greater in this instance. It’s reassuring to know the worse case scenario before entering the trade. Knowingthe initial risk will help make a better trading system.
56
Equity RiskEquity risk is the difference between an open trade’s market price and the price of the current sell stop. Equity risk increases as our profitabletrades improve. Sell stops are used to protect both initial risk and equity risk. The initial sell stop is determined with the trading range orchannel. If the trade improves, the sell stop will trail the stock upward, ratcheting in profits as it goes. This traps equity and limits the risk of thetrade. Using the EBay example, assume that EBay continues to $100. Using a 10% trailing stop, if EBay reverses and goes down 10% fromits highest high, then the stock will be sold. At $100, if EBay drops to $90, this triggers a 10% trailing stop and the stock is sold. The equity riskon this winning trade is 100 shares times ($100-$90), equals $1000. Trailing StopsThe trailing stop is a stop order set below the current stock price and adjusts as the stock price fluctuates. A trailing stop is an excellent toolfor letting profits run and cutting losses short. A trailing stop is a type of ratchet, permitting motion in one direction. If the stock price moveslower, the trailing stop does not budge. If the price drops and reaches the trailing stop, the sell stop is triggered, and the position is closed. If thestock price moves higher, the trailing stop ratchets up, continually locking in greater equity. As long as the stock price is higher than the trailingstop, the share is held. The simplest method of determining a trailing stop is measuring with a ruler. Print out a 90-day chart for any stock and measure the distancefrom the highest high to the lowest low. Assume this distance is one inch. If you owned this stock and it went up in price, you would continueto measure one inch down from the highest high to determine the level at which to place the trailing stop. The ruler method works fine, butthere are simpler and more accurate methods to determine a trailing stop.

57
Three Effective Trailing Stops
Trading Range High-Low Price DifferenceBelow is a three-month chart for Nvidia Corp., (NASDAQ: NVDA). I define the buy and sell stops as marks a little above the highest highand a little below the lowest low. You could be more accurate and select a mark one penny above the high and one penny below the low. Iprefer to eyeball it.
In this case, I would choose $24.5 as my point above the highest high and $15.5 as my point below the lowest low. An effective trailing stop isthe price difference between these two figures, i.e., $24.5 minus $15.5 equals $9. If I were to purchase Nvidia with a buy stop of $24, I wouldthen trail the stock upward and move my sell stop, always $9 from the highest high as the stock proceeded upward.
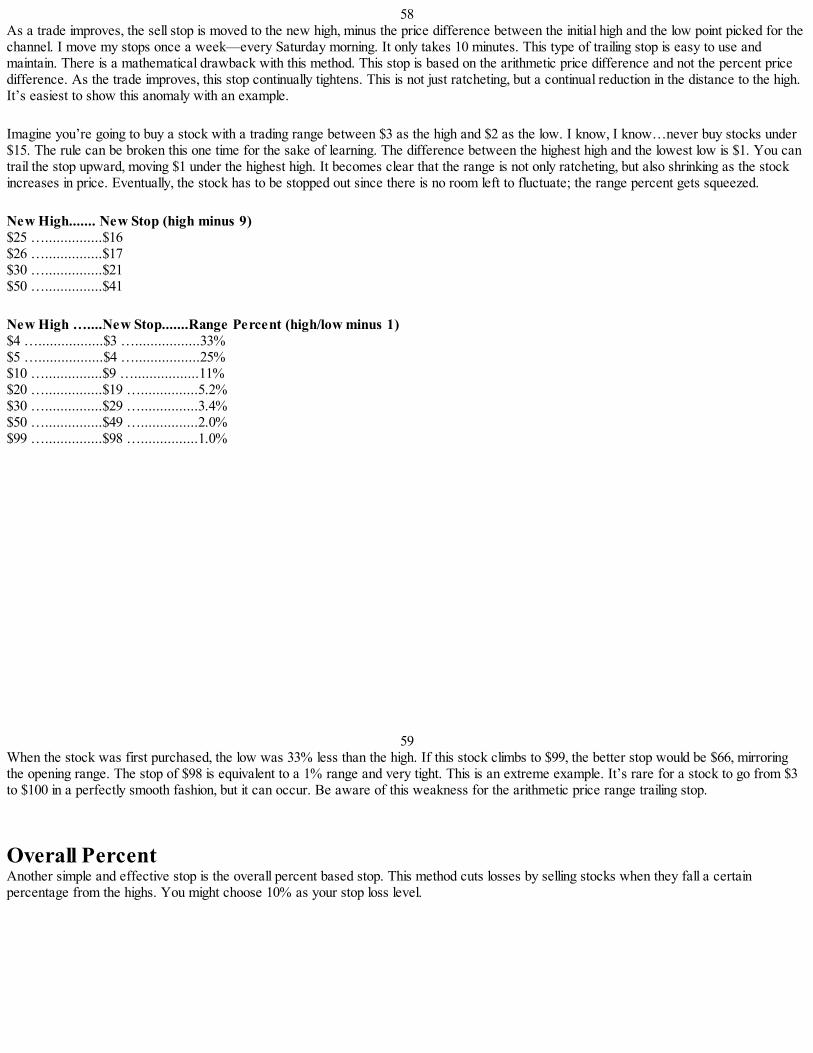
58As a trade improves, the sell stop is moved to the new high, minus the price difference between the initial high and the low point picked for thechannel. I move my stops once a week—every Saturday morning. It only takes 10 minutes. This type of trailing stop is easy to use andmaintain. There is a mathematical drawback with this method. This stop is based on the arithmetic price difference and not the percent pricedifference. As the trade improves, this stop continually tightens. This is not just ratcheting, but a continual reduction in the distance to the high.It’s easiest to show this anomaly with an example. Imagine you’re going to buy a stock with a trading range between $3 as the high and $2 as the low. I know, I know…never buy stocks under$15. The rule can be broken this one time for the sake of learning. The difference between the highest high and the lowest low is $1. You cantrail the stop upward, moving $1 under the highest high. It becomes clear that the range is not only ratcheting, but also shrinking as the stockincreases in price. Eventually, the stock has to be stopped out since there is no room left to fluctuate; the range percent gets squeezed. New High....... New Stop (high minus 9)$25 …...............$16$26 …...............$17$30 …...............$21$50 …...............$41 New High …....New Stop.......Range Percent (high/low minus 1)$4 ….................$3 ….................33%$5 ….................$4 ….................25%$10 …...............$9 ….................11%$20 …...............$19 …...............5.2%$30 …...............$29 …...............3.4%$50 …...............$49 …...............2.0%$99 …...............$98 …...............1.0%
59When the stock was first purchased, the low was 33% less than the high. If this stock climbs to $99, the better stop would be $66, mirroringthe opening range. The stop of $98 is equivalent to a 1% range and very tight. This is an extreme example. It’s rare for a stock to go from $3to $100 in a perfectly smooth fashion, but it can occur. Be aware of this weakness for the arithmetic price range trailing stop. Overall PercentAnother simple and effective stop is the overall percent based stop. This method cuts losses by selling stocks when they fall a certainpercentage from the highs. You might choose 10% as your stop loss level.

In the chart example above, I would enter this trade using a buy stop of $48. If this buy was triggered and Abbott Laboratories (NYSE: ABT)continued moving upward, I would position my stop loss 10% under the highest high. New High …........New Stop (0.9 times high)$48 …....................$43.2$50 …....................$45$60 …....................$54$70 …....................$63
60The percent method is simple and effective. It’s easy to calculate. It does not continually tighten like the earlier price range method. This stophas its own weakness. There is no easy way to determine the best percentage level. Stock volatility is directly affected by time, marketconditions, industry category, and individual stock characteristics. Many traders who use this method are not aware that the percent level determines how long you hold each stock. A tight percentage stop offive percent will have you buying and selling stocks more frequently than with a 15% stop loss level. Below are closing price charts for three stocks (based on 90 days of data) at the end of 2003.

61
The volatility of each of the three stocks above is different There’s no single value that matches the range for all three stocks. Ten percent is a good choice for BRO, 20% works for QLGC, and 25%would work for FRX. Momma Bear’s porridge was too cold, and Papa Bear’s porridge was too hot. To use this method, I’d pick the averagepercent volatility for the current stocks in my portfolio. If you choose this technique, you’ll end up trading more volatile stocks sooner since thestop is too tight for them. You’ll trade less volatile stocks later since the stop is too loose for them. Pro-Level Percent

This trailing stop combines the two previous methods, excluding their weaknesses. The stop is tailored to the volatility of the individual stock.This is the trailing stop I use. Instead of using a single percent, the low is divided by the high for each stock. Company …..................High ….........Low …...........((high-low) divided by high)Brown & Brown, Inc. …...33................10 ….................29.71 …......10.24%Qlogic Corporation …......58................43 ….................47.01 …......19.55%Forest Laboratories, Inc. .62................51 ….................47.12 …......24.62%
62You can calculate this stop by hand or with a spreadsheet. I update my stops once a week. If I were holding Brown & Brown, Inc., (NYSE:BRO) and it moved up to $40, the stop would be $40 x 0.8976 = $35.90. This method of trailing stop incorporates each stock’s individualvolatility, making for better trades. If these stocks move higher, here is how the stops would trail. BROQLGCFRX Company …....................High …...........LowBrown & Brown, Inc. …...33.10 ….........29.71 …...89.76%Qlogic Corporation …......58.43 ….........47.01 …...80.46%Forest Laboratories, Inc ..62.51 ….........47.12 …...75.38% BRONew High ….......New Stop (0.8976 times high)35 …......................31.4640 …......................35.9045 …......................40.39 QLGCNew High ….......New Stop (0.8046 times high)60 …......................48.2865 …......................52.3070 …......................56.32 FRXNew High ….......New Stop (0.7538 times high)65 ….....................49.0070 ….....................52.7775 ….....................56.54

63
Risk Reduction ThroughAllocation
The Trading Range and RiskWhen using the buy stop, sell stop, and range, each trade has an exact financial risk, known before entering the transaction. This risk is directlyrelated to the low-high percentage.
In the example above, Sharper Image Corporation (NASDAQ: SHRP), has nudged $34 on the high and $23 on the low. I would place my buystop at $34.5 and my sell stop at $22.5, just slightly above and slightly below these points. The range is $12. If I were to purchase 100 sharesof SHRP, my initial risk is $1,200. The cost of the stock is $3,450.
64

In the example above, Pfizer Inc., (NYSE: PFE) has neared $35.5 on the high and $29.5 on the low. I would place my buy stop at $36 and mysell stop at $29. The range is $7. If I were to purchase 100 shares of PFE, my initial risk is $700. The cost of the stock is $3,600. Notice the price for both stocks is almost identical ($3,450 vs. $3,600), but the risk is different ($1,200 vs. $700). This is because PFE trades in a tighter range than SHRP. If you were trading a $35,000 portfolio consisting of 10 stocks, you could purchase$3,500 of each. The weakness of this plan is that some of the stocks will be of higher risk to the portfolio. A calculator or quick spread- sheetcan help distribute the risk more evenly. Spreadsheet Examples
65Above is an example of a portfolio containing eight stocks with a total value of $35,000. If you purchased $4,375 of each stock, the initial riskwould vary from $641 to $1,701. Stock B represents more than double the initial risk of stock G. To add stability to my portfolio, I balanceinitial risk when entering new trades. In the chart below the initial risk is the difference of the high, minus the low, multiplied by the shares.
In the above spreadsheet, I guess the values in the “shares” column until the initial risks are approximately even and the portfolio total valuehits my target—in this case it’s $35,000. You can do this with a calculator but it’s fast and easy making guesses with a spreadsheet.

My good friend, David “Math Ninja” Chidley, solved the formula for determining the exact equal initial risk. His spreadsheet formula made iteasy as cake.
66The formula used to calculate the $1,138 in this instance was:= 35,000/ (46/11+18/7+21/8+28/8.75+17.75/6+36.75/8+36/5.25+30.60/8.10)= 1,138 For math lovers, below is the e-mail David sent me Hey Andy,I sorted it out for you. See the attached sheet. I have added a third table below yours. There are two constraints in your problem. 1. The sum of the costs equals $35,0002. Risk is constant Cost A = shares A * high ARisk = shares A * diff Acombining the aboveCost A = Risk*(high A/diff A) Now, constraint 1 says that sum of costs equals $35,000, so we can write:Risk*(high A/diff A) + Risk*(high B/diff B) +…+ Risk*(high H/diff H) = 35,000 The only unknown is Risk, so we can solve the equation. Hope that helps,David

67
Real World Example and NotesAssume you have a $9,000 portfolio with three stocks. I’ll use SHRP and PFE from above and add Red Hat Inc., (NASDAQ: RHAT). Hereare the values from a 90-day chart at the end of 2003.
The spreadsheet below has three parts. The top section shows an even distribution of $3000 per share. The initial risk is not evenly distributed.The middle section is my share guesstimate to distribute the initial risk evenly. The third section uses David Chidley’s formula to nail the exactamount of shares to perfectly distribute initial risk. Balancing the initial risk improves the stability of your portfolio.
68

NotesThis risk balancing technique is more common in futures trading because trades are made on margin and the account is almost never fullyinvested. Stock market accounts are often fully invested. This technique offers less benefit when adding a single stock to an existing portfoliosince the value for the new investment may be fixed. This method might better be used to choose between three stock candidates, seeking theone that best matches the risk of the current portfolio holdings. Risk allocation becomes more of a factor when purchasing two or more stocks at the same time. I do not adjust for risk once a trade is inmotion. Balancing initial risk is to be done before purchasing two or more stocks. Once I’m in a trade, initial risk is no longer a factor. As astock goes up, it naturally becomes a greater percent of the portfolio. From the example above, assume PFE and RHAT trend flat, whereSHRP trends upward to $100. Your stock bundle would have $4,680 of PFE, $1,640 of RHAT, and now $8,000 of SHRP. SHRP is now alarger percent of the total portfolio. SHRP represents a greater equity risk. That’s perfectly fine. You must let your winners run. I do not adjust for risk after entering the trade. I adjust for initial risk before purchasing stocks. This year I planto reduce my holdings from 10 stocks to eight. I’ll use a variation of this technique to evenly allocate the capital generated from the sale to theremaining stocks in my portfolio.
69
Up, Down and Flat Markets Up MarketsBull markets are exciting! The easiest markets to trade are Up Markets. In an up market, all is right in the world. The birds are chirping andthe sun is shining. Ah yes…life is good. You will be fully invested and your trades will be constantly making new highs. At the end of eachweek, you will review your portfolio and move your stops as necessary. In a bull market, you may wish to tighten your parameters whenscreening for stocks. More companies do well financially, and more stocks perform well. The danger of an up market is the intoxication ofbeing right and thinking you can do no wrong. It’s difficult to just sit. Avoid the temptation to adjust your trading rules. Avoid placing wild bets.Anytime you’re emotional, it is a bad time to fiddle with your investment plan. Bull markets are as dangerous as bear markets in this respect.Enjoy the ride. Keep your emotions in check.
“…irrational exuberance…”
—Alan Greenspan, Federal Reserve Chairman Down MarketsBear markets are painful! Down markets will test and retest your resolve. You’ll constantly have doubts. Will this market ever recover? You’llhave anxiety about your investment plan. You’ll be tempted to believe the gloom and doom gurus. It takes discipline and conviction to ride outan extended bear market. Have a long-term view of the markets. Historically, the markets have trended higher for the last 70 to 100 years.You must believe in the markets and believe in yourself. If you don’t, you won’t be able to take the pain. If you can’t take the pain, thenperhaps another investment alternative would better match your risk tolerance. You must believe in your trading ideas. It’s next to impossibleto believe in the advice of a guru when things get tough. It’s difficult to have deep convictions based on the information provided in one book.Ongoing reading, studying, and thinking about your trading ideas will give you the resolution to endure nasty bear markets. You must live and die by your own sword and to do this, you must believe in your plan and understand the reasons that you follow it. Bearmarkets will test your mettle. The dot-com crash had me hiding in my cave. I didn’t want to leave my home or visit with friends because I justwanted to pout. The false recovery whipsaws toy with your emotions. During the last bear market I, fortunately, believed in the markets and Ibelieved in my trading ideas. After three difficult years, finally there was light at the end of the tunnel. Yeah! When screening for stocksduring bear conditions, you may want to relax the screening parameters. Fewer companies will be doing well financially. Fewer stocks willhave good charts.
70Many of your stocks will get stopped out. In fact, all of your stocks may get stopped out under strong down trending conditions. Stop buyorders, sit on the sidelines, and never get triggered. Finally, when they do get triggered, they reverse, sink, and get stopped out under a falserecovery. New holdings might go up for a week and then slam down as bad news shakes consumer’s confidence. Sell stops make bearmarkets more tolerable. An investor lives with relentless anxiety if he or she chooses not to use stops. Do I stay invested? Should I get outtomorrow? Things might get better? Making decisions under duress is a difficult task Sell stops take the edge off bear markets. Some analystswill not buy breakouts in a bear market; however, I will. No one can predict the future. A whipsaw false recovery is impossible to distinguishfrom a true recovery. The 90-day channel is long enough to minimize false recoveries. Down markets test us all. Be prepared for these tests. The best preparation is discipline and conviction that comes from knowledge, research,and planning. Flat MarketsSideways markets are frustrating! Existing trades tread water. Stop buy orders are rarely triggered. The market lolly-gags up and down in arange, not wanting to continue into new territory. Uncertain consumer confidence and investor indecision pervade the financial news.Sideways markets are neither exciting nor painful—they are boring. Hang tough.

71
This is a 10-year chart for the Dow Jones Industrial Average. This graph has bull, bear and sideways portions. There is a strong bull trendfrom ’95 through late ’97. Late ’98 through ’00 was the madness of crowds and the tech bubble. The market went sideways with a downwardslant from ’99 through half of ’01. The bear came to town from late ’00 through all of ’02. My investment goals remained the same during allmarket conditions—beat the indexes. In an up market, I want to beat the indexes. I want to beat the NASDAQ, the Dow, and the S&P. Thisis sometimes difficult with a hot NASDAQ tech sector. In a flat market, where the market is near zero percent return, I try and make five or 10 percent, picking wisely. It’s not always easy to findstocks that stand out in flat times. In a bear market, I want to lose less than the market. Often, investors feel they must make positive returnseach year. This is not always realistic. It’s difficult to get out of the way of a speeding freight train. If the market tanks 50%, you’ll be hardpressed to find stocks in the black. A winning stock is a stock that outperforms the market. If the market sinks 20% and my portfolio sinks10% that is a big win. In a bear market, a stock that loses less value than the overall market is a winning stock.
72
ReviewThe first section of this book dealt with picking winning stocks. The second section explained how to enter and exit trades, how to use trailingstops to limit equity risk, and how to evenly distribute initial risk. Buy Stops, Sell Stops, and the Trading RangeYou can look at any stock’s price chart for a given period and determine a range for the highest and lowest transaction price. This range issometimes called the trading range and can be used as a measure of volatility for that stock. Stock charts usually come in two forms. The mostcommon charts show a single point for the daily closing price. More detailed charts show the open, high, low, and closing price. Either chartworks for determining the trading range. Pick the format you like best and stick with it. The given data period for a chart can be intraday, five day, ten day, one month, three months, one year, three years or more. Most investors

use one week or one month. I use a three-month or 90-day chart. This time frame provides a larger bigger view of the stock price activity.Stronger overall trends are found, and less volatile whipsaws occur. A longer view results in less work, fewer trades, and produces lesscommission. Longer stock holding times can also prove advantageous with capital gains tax rules. For any stock chart, there is a highest transaction point and a lowest transaction point. This is the stock’s trading range. The range contains thevolatility of that stock. I pick a point slightly above the highest high and slightly below the lowest low to place my buy stop and sell stop orders.The buy stop is priced just above the highest high point. The stock is then purchased once it breaks above its current trading range and headsinto new high territory. The sell stop is priced slightly below the lowest low point on the chart. This stop is placed after purchasing the stockand limits the initial risk exposure from the trade.
73
Effective Trailing StopsIf the stock price continues to trade higher, the sell stop can be moved upward, following the stock as it makes new highs. This is referred toas a trailing stop. The stop now limits equity risk once a trade begins making money. There are four easy methods for calculating the trailingstop: the ruler method, the price difference method, the overall percent method, and the pro-level percent method. The ruler method is a non-mathematical way to position a stop. I mentioned it with the other three for interest’s sake. For the rulermethod, you can print a 90-day stock chart and simply measure from the highest price point to the lowest. That measurement is the range usedto trail the stock price as it makes new highs. If this measurement was one inch—as the stock moved higher—you would measure down oneinch from the high to determine where to move your sell stop. If you like this old-school method, please use a logarithmic scale. The price difference between the buy stop and the sell stop makes a good trailing stop. If the buy stop is $50 and the sell stop is $40,then $10 is the distance used to trail the advancing stock price. If a stock you own moves to $70, the buy stop would be moved to $60, $10below the new high. This trailing stop technique works well. The weakness of this method is the use of an arithmetic value rather than apercent value. An example makes this deficiency clear. A stock has a $1 trading range if it’s moving between $2 any $3 for a given timeperiod. If this stock is purchased and climbs to $100, the stop would be moved to $99. The $1 range is appropriate for the $3 stock. The $1range is inappropriate for the $100 stock. The trading range has been severely tightened with the advancing price. An overall percent decline makes an effective stop. You can place a trailing stop at a certain percentage below the new high. Tenpercent might be a good percent level. If a held stock declines 10% from its high, the trade must be exited. If you purchased a $50 stock, yourinitial stop would be 10% lower, or $45. As the stock moves higher, continue moving the stop to the level 10% less than the new high. If the$50 stock moves to $70, the stop would be moved to $63. The drawback with this method is that it’s based on the assumption all stocks sharethe same volatility. Price volatility is not constant. Volatility varies from stock to stock, year-to-year, market condition to market condition. The pro-level percent stop uses the channel high and low to find a volatility percent for each stock. Consider a stock with a price rangebetween $50 and $40. The percent of the low to the high is 40/50 or 0.80. The trailing stop is therefore 80% of the price as it makes newhighs. If this stock reaches $70, the trailing stop would be moved to $56, representing 80% of $70. This is calculated for each stock in ourportfolio.
74
Allocating Initial Risk and Market Conditions
Each stock has an individual volatility range. You can evenly divide capital based on the number of stocks or based on the initial risk of eachstock. An even allocation of capital is not an even allocation of risk. An example can better illustrate this condition. In the last three months, Stock A has ranged from $10 to $90, Stock B has ranged from $30 to $70, and Stock C has ranged from $50 to $60.With a $9,000 portfolio, you could purchase $3000 of each stock. This is an even distribution of capital. This is not even distribution of initialrisk. If all three stocks were to perform poorly, and trend downward after purchase hitting their sell stops, Stock A would erase adisproportionately higher amount of capital from your portfolio. Of the three, Stock A would lose $2,640, Stock B would lose $1,720, and StockC would lose $500. You can use a calculator or a spreadsheet to determine the quantity of each stock that would evenly distribute this initial risk. Special thanks toDavid Chidley for providing the math to solve the quantities instantly. You can also guesstimate with a spreadsheet and find the approximatequantities quickly. Initial risk allocation can be used when purchasing more than one stock at a same time. This procedure is only used beforebuying stocks. Equity risk is not balanced once trades are in motion. Bull markets are fun, bear markets are not fun, and sideways markets are frustrating. Emotions must be kept in check under all marketconditions. Trade your plan. Up markets stroke egos. Don’t be lured into toggling the switches when things are going great. Sit on your hands.It often helps to tighten the parameters when screening for stocks in an up market. You’ll most likely be fully invested during bull marketconditions. It helps to loosen screening parameters in a bear market. During a downward trend, your stocks will lose value. You may getstopped out of all your trades. It may be difficult to reenter the market as buy stops are rarely hit. You might find yourself on the sidelines witha 100% cash position. The buy and sell stops will determine this. In a flat market, you’ll tread water. Trades occur slowly. Existing trades willnot meet new highs, nor will they stop out. Knowledge, confidence in your ideas, and self-discipline will guide you through the various marketphases.
75
PART III
The Power ofCompounding Interest
76
Realistic Returns You Can be a Millionaire
“You can be a millionaire and never pay taxes. Yes, you can have one mil-lion dollars and never pay taxes. You say to yourself, ‘Steve, how can I be a
millionaire and never pay taxes?’ First, get a million dollars.”—Steve Martin
That’s my favorite quote from Steve Martin’s album Comedy Is Not Pretty. You can be a millionaire trading stocks in your undies, but it’s noteasy. Investors can build a million dollar stock portfolio if they start early. Most investors have unrealistic expectations. You can take a historical look at the stock market and calculate an average yearly rate of return. Most investment authors place the return onthe Dow Jones Industrial Average or the S&P500 between 10% and 15%. To be conservative, I use 10%. New investors often think they canquit their day jobs and live off the markets. Here is an income level chart based on a 10% rate of return combined with various sized stockportfolios.

If you’re trading $10,000, you’re going to have a hard time buying food. With $100,000 invested, your yearly income level is still below thepoverty line. You’ll need $500,000 invested if you want to make $50,000 a year. Few people make their living trading since it requires a largeportfolio to generate income. You can become a millionaire through investing. This is achieved with time and the power of compoundinginterest.
77The Guru of Guff and the Guru of GuileAre stock gurus telling the truth? You’ve seen their ads; the guru claims his system has accuracy and simplicity and makes bank! The guruclaims a rate of return that blows the lid off the popper. Earn 300% per year! Earn 20% per month! Eighty percent profitable trades! Ninetypercent accurate signals! Wow! Can these rates of return be true? In the short run, very high rates of return can be achieved with risky bets and luck. In the long run of five, 10, 20 years or more, investmentrates of return are lower than most think. Below is a chart showing how $10,000 would grow over 25 years, based on various interest rates. Imade the calculations with a helpful online compounding interest calculator also known as Compounded Annual Growth Rate (CAGR).
CAGR = ((Last Value/ First Value) raised to the (1/ Years) power) minus 1
Oh my! I don’t even know how to say some of those numbers. You probably want to remind me that I did not deduct for tax; I’m pretendingthe $10,000 was in a tax sheltered retirement investment to keep things easy. You can put $3,000 in an IRA each year—$10,000 is not thatdifficult to accumulate, growing tax-free. I believe the top number is eight quadrillion! I don’t believe there are any quadrillionaires—the claimsof 200% are simply lies. One hundred fifty percent makes for $88 trillion. That is a lot of money and I’ve never read about a single trillionaire in Forbes. More lies? How about 100%? Bill Gates was the richest man onthis planet the last time I checked. I believe Mr. Gates is closer to $50 billion, not $335 billion.
78Could these gurus be exaggerating? Yes, some are crooks! An average compounding rate of 75% turns $10,000 into $11 billion in 25 shortyears. I personally don’t believe there are any traders compounding at 75% for 15 years or more. Finally, we get down to 50% a year. This number seems so small compared to the rest, and yet it has the power to turn $10,000 into $250million! I estimate there are less than a handful of traders reaching 50% compounded annually for 15 years. Some do exist—these are the

Tiger Woods of trading. I doubt anyone can continue compounding at this rate for more than 20 or 25 years. The world banks will beat a pathto your door when you can compound at 50% a year. The claims of most gurus are the claims of guff and guile.
Realistic Compounding Interest Goals or Targets
The chart above shows yearly return rates and the skill level required to achieve them. Five percent is not difficult. I think most Grandmascould do it. Five percent is not a good yearly return. You can achieve this with most mutual funds and bonds. Ten percent is similar to themajor market indexes. Ten percent can be achieved with an indexed mutual fund. The Vanguard 500 Index Fund has realized an annual returngreater than 12% since inception. Fifteen percent is a very good yearly return. I believe Warren Buffet has stated he wants to stay at or above this target. So far he’s been wellabove it. Mr. Buffet’s company, Berkshire Hathaway, has earned approximately 25% a year for the last 30 years (as of writing 2004, sincethen the rate has declined some). He is the second richest man on earth. Let that be your guide. Twenty percent is tricky to achieve and fewtraders can do it in the long run. Compound at 20% a year and investors will hand you their portfolios for management.
79On the back cover of Jack Schwager’s book Market Wizards, it states “Michael Steinhardt, whose fund has averaged a 30 percent annualreturn over a twenty-one-year period!” The back cover also mentions, “Ed Seykota, who realized an astounding 250,000 percent return on his accounts over sixteen years!” EdSeykota’s 16-year return would be more than 60% compounded annually. These are two of the world’s best traders. Returns of 30% to 60%are extremely rare. Indexed funds realize 10% to 15%. I would use that as a baseline and target upward from there.
80
Stock Market Advantages
The Power of Compounding InterestThe power of compounding interest is amazing. Compounding interest is the proverbial money press. Invest well, start early, and almostanyone can become a millionaire. For simplicity, I’m assuming these yearly investments are growing in a tax-free retirement account. The leftcolumn is the annual contribution. The middle column is the realized rate of return. The column on the right is the years necessary to accrueone million dollars. $1000 a year earning 10% is $1,000,000 in 48 years. $6,000 a year earning 15% is $1,000,000 in 23 years.
I’d like this chart to impress upon you the following idea
The power of compounding interest can turn small, yearly contributions into a large snowball of wealth over time.
Doubling your yearly investment shaves off only a few years. Quintuplingyour yearly investment only cuts the time in half. Time is more powerful than
yearly contributions.
•A few percentage points can shave years off the total time.

81The best time to start is now. Time is the fuel that feeds the compounding interest engine. It’s never too late. If you’re 65, invest now becauseyou won’t mind having a million in your late eighties. If you’re sixteen, start investing now and you will become a very wealthy man or womanlater in life. You even have the power to become a billionaire. Invest steadily. Invest as much as you can afford each year. Steady investmentis more important than size. Invest for the rest of your life. Invest as much as you can in tax-free retirement accounts each year. A few percentage points mean everything. Two thousand dollars at 15% is close to $6000 at 10%. If you had one million dollars in the markettoday and could realize either 10% or 15%, which would you prefer? The difference is $50,000 the first year. It’s worth it to read 10 goodbooks on the stock market and take a pro-active approach to investing. No Employees and No CustomersMy wife and I used to own a sign shop. It was a great small business and we did well. We eventually sold the business to an employee.Friends often ask us, “Don’t you miss making signs?” I reply, “I miss making signs…I don’t miss the drama of customers and employees!” There are many investment vehicles. One good investment is owning a small business. Thomas J. Stanley and William D. Danko, authors ofThe Millionaire Next Door surveyed America’s millionaires. They discovered most millionaires achieved their wealth through the ownership ofa small business. Most people are risk adverse. I’ve encouraged friends and family to open their own business. Very few can take the leap. Being married with kids and a mortgage oftenprevents people from risking their life savings on the unknown future of a small business startup. These people do not have the entrepreneurialgene. Folks become frenzied at the mere thought of giving up that medical plan and company car. When you work for yourself, there are noguarantees. Aside from the public’s aversion to risk, there is another aspect of small business ownership that constrains it with regards to thepower of compounding interest.
82
For easy math, assume you own a small business that grosses $300,000 a year and nets $100,000. You invested $50,000 to start it up. The firstyear you make 100% return! Yeah! Now what? You can plow the money back into the business and grow it, but it’s difficult to achieve
sustained growth in a small business. They usually grow for two to five years then level off. Pretend you put all of the $100,000 in the bankeach year, earning 0% interest. You save 100%.
Each your return on investment gets worse.
The first year, your $50,000 investment turns into $100,000. You then have $100,000 in the bank and make $100,000. Each year the businessmakes $100,000 and you save it. The rate of return falls continuously into the future. You may say to yourself, “Andy, I can open morestores!” Yes, you can open more stores. Operating one business is simpler than operating two. You’ll have to open more and more stores atan exponential rate as you grow. Soon you aren’t making widgets, but running a widget corporation. This is not a simple formula forcompounding interest. You may say to yourself, “Andy, I can invest that money in the stock market!” Yep…that’s why this book is about stock market secrets and not small business secrets. Real estate is an investment. Members of my familyexcel in real estate. Last month I looked up my home’s value in 1977 and compared that to today’s value. Using my favorite online compoundannual growth rate calculator, I typed in the numbers and out a shot six percent yearly return. That’s not a bad rate of return, but it was lowerthan I thought it would be.With real estate, you must remember to add in all the costs. Soon that six percent starts to look like four percentafter property tax and maintenance. Don’t forget six percent broker commission on the way in and six percent on the way out. You may sayto yourself, “Andy, real estate is all about leverage!” That’s true, but I want to compare apples to apples. I don’t buy the leverageargument, since I can leverage any investment. I can start a small business with a loan.
83I can trade stocks on margin. I can mortgage my house and trade stocks on the mortgage. Real estate is safer than the stock market becauseyou are holding property and not paper. It makes sense that because real estate is safer, it offers a lower rate of return. The same practicalgrowth problem witnessed with small businesses also occurs in real estate. It’s difficult to grow your real estate empire endlessly. You’ll haveto buy more and more property at an increasing rate in order to compound interest at a continuous rate. Bonds and CDs offer safer investments. Safe comes at a price. Bond and CDs realize relatively low rates of return. Venture capital, the dot-com type, has cost me more money than any other investment. Try venture capital if you enjoy lighting money on fire. The biggest problem with venture capital is that the investments are often emotional.There is groupthink that occurs between investors and entrepreneurs. It’s easy to leave your logic at the door and buy into the product orservice. Investors, shareholders, and workers buy into the dream of going public. Most startups never get to market. The initial public offeringday never comes. Venture capital is a very risky investment. Even if you become a successful venture capitalist, each year you’ll need to findmore and more great startups in order to compound at a steady rate. Futures are high-risk investments. Futures are commodities, currencies, bonds, or stock indices, bought, or sold upon agreement of futuredelivery. Gold, coffee, oil, and treasury bonds are all futures. The futures market is enormous and dwarfs the stock market. Trading futures isrisky and difficult. You might consider trading futures once your house is paid off, the kids are through college, and you’ve got a two milliondollar stock portfolio. At that point, it’s safe for you to trade futures. Futures trading, like stock trading, can achieve compounding rates thatscale more easily than other investments. If the stock market is arithmetic, the futures market is calculus. IRAs and RRSPsTax-free retirement accounts offer one of the best reasons to invest in the stockmarket. In America, we have IRAs, or Individual Retirement Accounts. In Canada, they have RRSPs, or Registered Retirement Savings Plan.IRAs come in several flavors, such as the traditional SEP, and ROTH. Traditional IRAs and RRSPs allow deductible contributions and allowearnings to grow tax deferred until funds are withdrawn. ROTH IRAs offer tax-deferred earnings. SEP IRAs are tied into employee

contributions. There are different rules and restrictions for each investment plan.
84The standard IRA meets the needs of most people. Current rules allow for contributions up to $3000 each calendar year. Seek professionaladvice from your tax advisor to determine which plan is correct for you. This next chart demonstrates the power of compounding interest when combined with a tax free retirement account. This chart is based on anannual investment of $3,000 compounding at 15% for 30 years with and without a capital gains tax rate of 15%.
A traditional IRA is worth half a million more in this example. Tax-free retirement plans are worth their weight in gold. Without the tax shelter,growth is approximately 15% less than 15% due to taxes. That’s not exactly what’s occurring, it’s an easy way to think about it. This nextchart gives a visualization of the IRA growth.
85I’d like this chart to impress upon you the following ideas: • Yes! The power of compounding interest really does turn small, yearly contributions into a large snowball of wealth over time.

• Tax-free growth is the same as earning a greater compounding rate of return. • The small tax savings becomes big wealth over time. Do the research. Talk with your tax advisor or investment planner. Tax sheltered retirement accounts often make good investment sense.
86
Easier Ways to Invest Load and No Load Mutual FundsYou’ve read most of this book, and your head is spinning, your heart is pumping, and you may scream, “Andy! I don’t want to play the stockmarket! What’s the simplest way to capture the power of compounding interest while taking advantage of my IRA?” A mutual fund is an investment company that uses its pooled capital to invest in the diversified securities of other companies. The shares areredeemable on demand at their net asset value. The fund is professionally managed. Mutual funds are diversified and portfolio diversificationcan provide greater safety and reduced volatility.

A Load Mutual Fund charges a fee or load when investors make purchases. This fee is used generally to compensate the salespeople sellingthe fund. A No Load Mutual Fund allows shares to be purchased without a sales charge or load. I see no load funds as robbing Peter to payPaul. The money has to come from somewhere and without a load, I suspect higher annual fees. My cynicism aside, it’s generally better to startyour search for mutual funds with the no loads; they seem lower cost overall. Do your research before picking a fund. Look at the 10-year and15-year track records of each fund. Don’t be swayed by three and five-year performance graphs. Many online brokerage sites offer mutualfund screening tools. You should be able to find a good fund realizing a 10% return in the long run. Mutual funds have historically underperformed the market indices. I attribute this to their fee structures. As you add more and more stocks to the pool, the fund eventually takes onthe characteristics of the market. The S&P500 is like a mutual fund of the 500 S&P stocks. The Dow Jones Industrial Average is similar andconsists of 30 stocks. The funds begin to mimic the performance of the indices. The fund’s disadvantage is its management fee. The fund’sfee reduces the return enough that it rarely beats the indexes.
87
Index FundsAn Index Fund is a mutual fund that buys securities to match those tracked by an index such as the Dow Jones Industrial Average or theStandard & Poor’s 500 index. The index fund attempts to achieve the same return as the general market. The funds are simpler to managesince they are run by a computer and not humans. The costs of managing the fund are minimal. An index fund will not exactly match themarket’s return because of the small fee, but it will come very close. An index fund is a good investment alternative for an investor who doesnot wish to learn about the stock market, but believes in the power of com- pounding interest. The Motley Fools, David and Tom Gardner,were two of the first author-investors to ballyhoo the excellent benefitsof an index fund. Index funds are some of the best mutual funds available. Diamonds, Spiders, and QubesDIA, SPY, and QQQ are unit investment trusts. These are traded like stocks, but act like mutual funds. The benefit of purchasing aninvestment trust over a mutual fund is greater liquidity and less paperwork. DIA is the symbol of the tracking stock for DIAMONDS, a unitinvestment trust created to provide investment results that generally correspond to the price and yield performance of the Dow Jones IndustrialAverage. SPY is the symbol of the tracking stock for spiders or SPDRs. Standard & Poor’s Depositary Receipts, represent ownership in theSPDR, a unit investment created to provide investment results that generally correspond to the price and yield performance of the Standard &Poor’s 500 Composite Stock Price Index. QQQ is the symbol of the tracking stock for the NASDAQ-100 Index Tracking Stock, a unitinvestment trust created to provide investment results that generally correspond to the price and yield performance of the NASDAQ-100Index.
88These three investment vehicles attempt to mirror the price and yield performance of the index they represent. There is no assurance the priceand yield performance of the index can be fully matched. These tracking stocks can be traded in a regular brokerage account. The decision to purchase a tracking stock or a mutual can be financial.You can calculate the stock commission vs. fund fees and compare. Mutual funds can be more attractive to investors wanting to contributesmaller amounts to their portfolio on a monthly basis. This is impractical when buying stocks and paying commission. Tracking stocks and index funds offer simpler stock market investment alter-natives.

89
Timing, Randomness, and P/E
Timing is Over-RatedI believe in being fully invested; I don’t believe in timing the market. The market has trended upward for the last 75 or more years; hopping inand out of the market and serves no purpose other than making brokers wealthy. I have no idea where the market is headed tomorrow or nextweek and I doubt anyone does. No one can predict the future, especially in the short term.
“Timing and luck are nice, but you can make more money getting in now.”
—Louis Rukeyser Louis Rukeyser tells an excellent story about two brother-in-laws named Ralph and Darth. Ralph was unlucky and always invested at markettops, but he invested early. Darth timed perfectly and hit every top. He started late, but added more capital. After 40 years, the lads’ portfolioswere almost identical! The moral of the story is that timing, and the amount invested, are less of a factor than over- all time. Invest early and stay fully invested. Don’t jump in and out of the market. You’ll be wrong as often as you’re right, and you will make yourbroker fat with commission. You’ll also miss the big up moves that occur at the end of a correction. If you pick better stocks than the overallmarket, then it’s reasonable to assume that your returns will beat those of the index. The index has realized at least a 10% return historically.Stay invested with your winning choices and you will beat the market. If you fund your portfolio monthly or yearly, fund consistently, as soonas you have the capital. Fund now, don’t wait. It’s time that makes compounding interest work, not timing. I’m not saying I’m fully invested 100% percent of the time—I’d like to be, as this would mean the market is continually moving upward. Thesystem of buy stops and sell stops allow price action to determine when I’m in trades or on the sidelines.
90The buy stops get me into a trade, and the sell stops take me out. I’m fully invested 90% of the time. When the overall market begins todecline I get stopped out of one or more stocks. The new buy stops used to replace those holdings are not always triggered right away. I mayend up sitting with cash until the market turns and begins trending upward again. Using channel breakouts with stops is not a magic bullet. Youmay miss some of the painful decline, but the price paid is missing some of the initial recovery. False recoveries can occur. Using a 90-daychannel helps minimize the whipsaws. Stay invested and allow price action to determine the few times you are sitting with cash. Random Market TheoryThere exists a group of mathematicians who believe market price activity is random. The stock market is a competition; the stock market is agame. In all forms of competition, there will be players who excel at the game. Investment results are not random. I play poker and the game I love most is Texas Hold’em. I’m not that good yet, but I’m getting better. I read, study, and practice. I give mymoney away in the big online tournaments. The basic rules of Hold’em are straightforward. A deck of cards is shuffled well—shuffled so wellthat a mathematician might even consider the cards to be randomized. Each player is dealt two cards…only two stinking cards! You might aswell bet on coin flips. On the surface, Hold’em seems simple. Below the surface lies the subtle complexities, and this is the allure. Hold’empoker has little to do with the two randomly dealt cards and a lot to do with betting, psychology, and the reactions of the other nine players. Idon’t believe the markets are random. If statistical randomness exists, it may be one element of a more complex game.
“The markets are not random, because they are based on human behavior,and human behavior, especially mass behavior, is not random. It never has
been, and it probably never will be.”—Jack D. Schwager, author of Market Wizards
Thoughts on Price To Earnings RatioP/E is the price per earnings ratio. This ratio has never been a factor in my trading. It’s calculated by dividing the stock’s price per share byearnings per share for a 12-month period. A stock is selling for $20 and earning $4 a share and is sellingat a P/E of five.
91Many investors believe stocks should be purchased below a certain P/E. I disagree. Great companies with great stock charts often have highP/E ratios. Overall, market P/E ratios change with time and market direction. If the ratio is not stable, how can it be useful? I simply see P/Eas a stock popularity index. The more popular a stock, the higher this ratio becomes. I have renamed P/E to the Popularity Evidence ratio. Alltypes of stocks are popular and unpopular. This has little predictive value when hunting for big winners. The P/E ratio is useful with some investment techniques. I suspect if you’re a value shopper, seeking great companies with weak stock charts,then the P/E ratio is a solid evaluation tool.Warren Buffet and Martin Zweig choose stocks in a certain way, often looking for these greatcompanies at suppressed prices. Their selection criteria are such that P/E can be used to locate the bargains. I side more with William J. O’Neil and seek the riskier, but bigger winners.
“A stock’s P/E ratio is not normally an important cause of the most successfulstock moves.”
—William J. O’Neil, author of How to make Money in Stocks

92
Nasty Traps Penny StocksThere is a nasty trap called Penny Stocks. Penny stocks are traded on the over-the-counter bulletin board (OTCBB). Penny stocks arevolatile, speculative, and occasionally manipulated. Penny stocks used to refer to stocks trading for less than $1 a share—it’s now morecommon to place the value at $5 a share or less. Companies traded on the OTCBB have minimal listing requirements, offering few safeguardsfor the public. Some investors will not purchase a stock trading for less than $10. I take an extreme position and rarely purchase a stock with a value of lessthan $15. Penny stocks, microcap, and low-priced stocks will lure you into a nasty trap. These stocks are priced low for a reason. Thesecompanies are often struggling, are new and untested, or are manipulated. Most IPO’s debut in the $8 to $12 range. I prefer to wait until the stock has gone past the $15 mark. The big funds don’t buy cheap stocks.Do a stock screen for stocks priced $10 or less and include the institutional—sponsorship parameter. Examine the results and then do the sametest using stocks priced over $20. The results reveal that big funds don’t want cheap stocks and neither should you. Don’t buy any stock under $10. If you’ve got the resolve, don’t buy a stock under $10. If you want to join me with overkill, don’t look at stocksunder $15. If a great company with a great chart goes from $8 to $100, missing the $7 from eight to fifteen has little effect on overall returns.The dangers from $8 to $20 are simply too high.
93
Six of One, Half Dozen of the OtherIt’s a common desire of the public to hold a greater quantity of a cheap stock rather than a low quantity of a higher priced stock. This is anasty trap and faulty logic. Stocks go up by percent, not by points. Johnny Q Public has $1,000 and is ready to purchase a stock for hisportfolio. If offered 1000 shares of $1 stock, 200 shares of $5 stock, or 10 shares of $100 stock, Johnny usually chooses the 1000 shares of $1stock. It’s total price, not share count, that is our investment.$1,000 is $1,000 no matter 10 stocks or 100.

There is no difference between the five choices. Holding more shares has no mathematical or practical benefit. One thousand dollars is $1000is $1000. This is how Johnny Q is lured into penny stocks. Why do stocks split? Stocks split because companies know the investing public is scared to buy higher priced stocks. Stock splits occur toappease irrational investors who believe higher priced shares are at a disadvantage. I know some of you are nodding in disbelief. Walk to yourcomputer and pull up a chart for Berkshire Hathaway Inc., (NYSE: BRK.A). Look at graph for 2003. Look at a 10-year graph. This is thestock for Warren Buffet’s company. This stock closed yesterday at $84,800 a share. Yes, one single share is almost $100,000. Mr. Buffet isthe coolest cat because he refuses to split the shares. This stock opened at the start of 2003 at $71,700 and closed at the end 2003 at $84,250. During the last 12 months, the realized return is morethan 17%. The 10-year realized return is also more than 17%. This figure crushes the market indexes. Since 1990, the average yearly-realizedreturn is even higher. Don’t fall into the trap of wanting lots of cheap shares. Assuming share price is greater than $20, ignore share pricewhen making your purchase decision.
94
Failing to PlanHe didn’t plan to fail, he failed to plan, as the saying goes. One of my goals is to trade with a complete, organized plan. Many books on themarket explain how to pick stocks. Stock picking is only a portion of investing. Even if you disagree with my ideas and logic, I stronglyencourage you to think through all aspects of your trading system before investing. Does the system answer the following questions: • Why do I want to trade stocks?• What are the characteristics of the stocks I’m looking for?• Why do I like this particular stock?• How many stocks am I going to hold?• When am I going to buy this stock?• When am I going to sell this stock? The vast majority of traders can’t answer the questions above. They purchase stocks on tips, hunches, and intuition. They sell stocks becausethey got scared watching the morning news. Being a successful investor is more than stock picking. Finding winners is one part of thecomplete trading philosophy. Don’t fall into the nasty trap of trading by the seat of your pants. The stock market is a serious game. You arecompeting against serious investors. This is risky. This is your money. You must know when you are getting out of a trade before you get in.Plan your trades, trade your plan, and you’ll be on your way to having the total skill—that being a successful investor.

95
Wise Tricks Percent vs. PointsI touched on this in the “six of one and half dozen of the other” section. Many of these issues overlap and are interrelated. A wise trick is toanalyze stocks in terms of percent, not points, or dollar values. You’ll often hear the financial news announce, “The Dow was up 100 pointstoday.” This information has little value. One hundred points means nothing. Sometimes the announcers will add, “The Dow closed at 10,100.”Now we have two pieces of information, both of them weak. I’m not a walking calculator. I want to know the percent increase or decrease. Percent is everything; points are nothing. If the announcer said the Dow was up 1.0% today, then he or she has reported useful information.It’s wise to judge investments based on percent. It’s all about realized return and compounding interest. You’re at a cocktail party and you spot a gentleman in the corner surrounded by onlookers. He is a chewing a cube of cheddar cheese on astick while sipping white Grenache. You overhear him brag how he made a tidy $20,000 profit in the market last year. Is he a good trader? Hisgain has shock value; the number alone is meaningless. What was the size of the cheddar chewer’s portfolio at the start of the year? Income only matters once we know his portfolio size so we can solve return.
If he were trading $10,000, he realized an amazing 200% return. If he were trading $100,000, then he had a 20% year. If he were trading$1million, he gained 2%. It’s the percentage of return that counts, not cash. It’s difficult to analyze this trader’s skills, even know his return,since one year does not make a track-record and the market conditions are unknown.
96This same story happened again in real life, not less than seven days after writ- ing this. I was in my garage with a fellow car enthusiast andwe talked about engines and horsepower. We also talked about small business and investments. He mentioned that his friend had done well inthe markets during 2003. I asked how his friend did, and he said the lad made twenty-five large. “Oh my,” I said. “How much do you think he
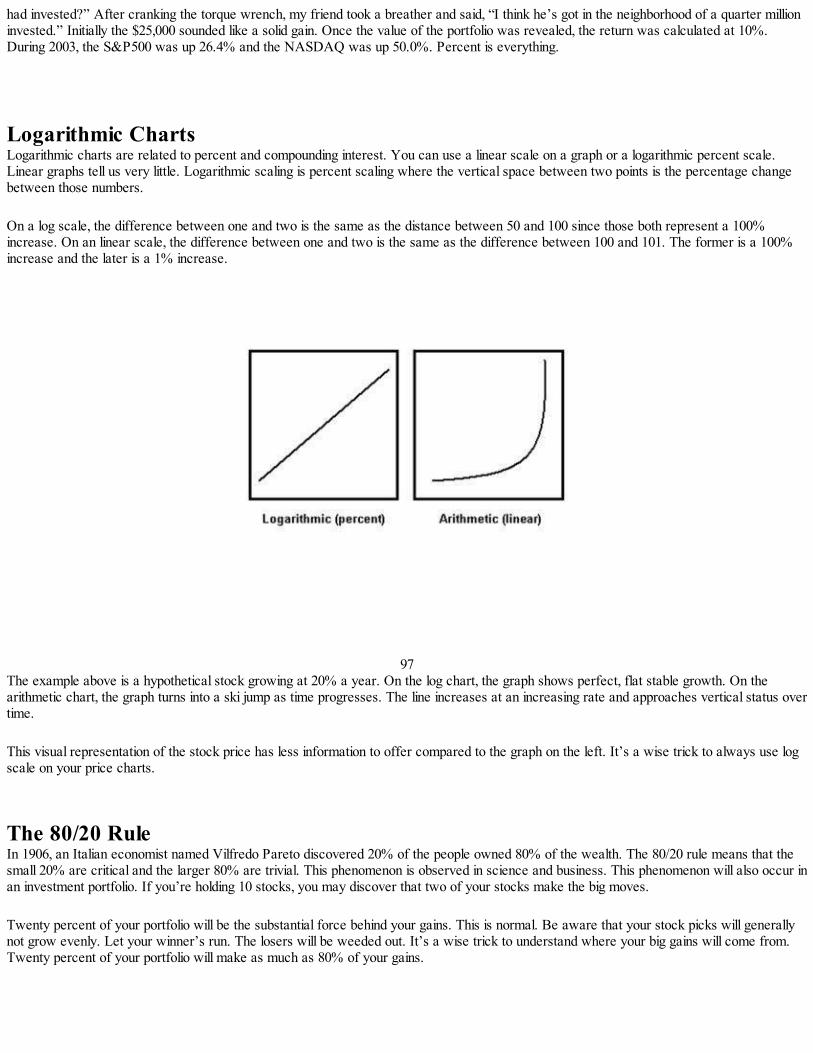
had invested?” After cranking the torque wrench, my friend took a breather and said, “I think he’s got in the neighborhood of a quarter millioninvested.” Initially the $25,000 sounded like a solid gain. Once the value of the portfolio was revealed, the return was calculated at 10%.During 2003, the S&P500 was up 26.4% and the NASDAQ was up 50.0%. Percent is everything. Logarithmic ChartsLogarithmic charts are related to percent and compounding interest. You can use a linear scale on a graph or a logarithmic percent scale.Linear graphs tell us very little. Logarithmic scaling is percent scaling where the vertical space between two points is the percentage changebetween those numbers. On a log scale, the difference between one and two is the same as the distance between 50 and 100 since those both represent a 100%increase. On an linear scale, the difference between one and two is the same as the difference between 100 and 101. The former is a 100%increase and the later is a 1% increase.
97The example above is a hypothetical stock growing at 20% a year. On the log chart, the graph shows perfect, flat stable growth. On thearithmetic chart, the graph turns into a ski jump as time progresses. The line increases at an increasing rate and approaches vertical status overtime. This visual representation of the stock price has less information to offer compared to the graph on the left. It’s a wise trick to always use logscale on your price charts. The 80/20 RuleIn 1906, an Italian economist named Vilfredo Pareto discovered 20% of the people owned 80% of the wealth. The 80/20 rule means that thesmall 20% are critical and the larger 80% are trivial. This phenomenon is observed in science and business. This phenomenon will also occur inan investment portfolio. If you’re holding 10 stocks, you may discover that two of your stocks make the big moves. Twenty percent of your portfolio will be the substantial force behind your gains. This is normal. Be aware that your stock picks will generallynot grow evenly. Let your winner’s run. The losers will be weeded out. It’s a wise trick to understand where your big gains will come from.Twenty percent of your portfolio will make as much as 80% of your gains.

98
Learn More Secrets
BooksI treasure non-fiction books. The information in books is awesome and inexpensive. If you gain one piece of knowledge from a book, it’s paidfor itself multiple times. If you’re going to play golf on the pro tour, I suggest you frequent the driving range. If you’re going to trade equities, Isuggest you read as much as you can about the stock market. Here are three books I recommend reading. These authors are excellent investors, and know the market in their own way. Each onetrades differently. For the first book I suggest William J. O’Neil’s. He describes his stock selection approach he created by studying the 500biggest stock market winners from 1953 to 1993. Starting with the greatest winners, he worked backwards, finding similar characteristicsshared by big gainers. He created the legendary C-A-N S-L-I-M method. O’Neil’s acronym describes the seven characteristics shared bygreat performing stocks before they make their biggest moves. David and Tom Gardner, “The Motley Fools” take a practical and fun approach to investing. These lads are sharp, humorous, and providereaders with the tools needed to beat the wise men of Wall Street. Martin Zweig is one of the most respected stock pickers and market forecast- ers of our time. His disciplined trend following approachsucceeds. How to Make Money in Stocks—William J. O’NeilThe Motley Fool Investment Guide—David and Tom GardnerMartin Zweig’s Winning on Wall Street—Martin Zweig Here are three investment classics that belong on every investor’s bookshelf. These books are timeless and a joy to read. The more thingschange, the more things stay the same. Human nature is refreshingly consistent. Where Are The Customer’s Yachts?—Fred Schwed, Jr.Reminiscences of a Stock Operator—Edwin LefèvreExtraordinary Popular Delusions & the Madness of Crowds—Charles Mackay
99 Here are my last three favorites. Chilton’s The Wealthy Barber is a practical guide for financial planning. Start young, max that IRA, picka good mutual fund, and let the power of compounding interest work its magic. Schwager’s Market Wizards is awesome. This book is hard toput down. Jack D. Schwager interviewed some of the best traders of our time. These are the world’s best inves- tors; people who compoundat 25%, 30%, and even 50% a year. They all trade differently. Dr. Van Tharp’s book, Trade Your Way to Financial Freedom is thick andchunky. This is a complete, systematic, and mathematical approach to sys- tem testing and trading. It’s a great read. The Wealthy Barber—David ChiltonMarket Wizards—Jack D. SchwagerTrade Your Way to Financial Freedom—Dr. Van K. Tharp Web sitesHere are three Web sites with great stock tools Google Financehttp://www.google.com/finance Yahoo! Financehttp://finance.yahoo.com/ StockCharts.comhttp://www.stockcharts.com Investors.comhttp://www.investors.com StockCharts.com has exceptional charting tools. Stock & Commodities magazine recently published their 2004 Reader’s Choice Awards.Reader’s picked StockCharts.com as the best technical analysis Web site, and Investors.com as a semi-finalist. These are great Web sites.
100 Newsletter, Newspaper, BrokersThe newspaper Investors Business Daily; the front page and page two are filled with important financial events from the previous day. I wantmy news fast, financial, and concise, and Investors Business Daily gives this. One thing that kept me optimistic during the last bear market wasLouis Rukeyser’s Wall Street newsletter. Rukeyser’s overall market wisdom kept me calm. I wanted to panic. I wanted to jump ship.Rukeyser’s logic and critical thinking kept me rational. He is missed by many. http://www.investors.com/

There are many good online brokers. I use Scottrade and OptionsXpress. Etrade is also great. http://www.scottradehttp://www.etrade.comhttp://www.optionsxpress.com/
101
Great Returns
Section 1—Stock PickingWow. It’s the last chapter! Here is a quick review of the three sections followed by my final comments. In the first section, I described how Ipick stocks. I use both technical and fundamental research to find stocks that should outperform the market. The stocks I want to ownrepresent financially superior companies with great looking stock charts. I don’t bargain shop; I look for the best. Online stock screening toolsmake searching fast and easy. I scan by using a few simple rules. I believe simplicity makes for a heartier trading system. Price is $15+Net Profits 15%+EPS 5yr 15%+ I tweak the screening parameters based on market conditions. The criteria above will produce a short list of stocks. I then examine the three-year and three-month price charts for each symbol on the short list. I use a logarithmic scale on all charts. I want to find the charts starting inthe lower left corner, moving to the upper right corner, while exhibiting as little volatility as possible. I take stocks that pass the chart stage, andthen examine their revenue and EPS bar graphs. I look for the bars to steadily increase with time, year over year, when comparing quarters. Iwork through the list until I find the six to 10 equities that best meet my criteria. I prefer to purchase stocks in different industries to avoidcorrelation. This increases the robustness of the system.

102
Section 2—Entering and Exiting TradesIt’s easy to get into a trade; most people can’t get out. In the second section of this book, I look at the trading range for any stock during a 90-day period. This range is used to determine when the stock will be bought and when it will be sold. Just above the highest high of the range iswhere I place my buy stop order. Just below the lowest low of the range is where I place my sell stop order. I enter a trade when the stockmakes a new high, breaking up and through its 90-day channel. Breakouts often foreshadow a continued run up. The trading channel is used tocreate a trailing stop. Once a trade is in motion, I move my sell stop based on the size of the channel. Three simple trailing stop techniques are price difference, overall percent, and pro-level percent. I use the pro-level percent technique. Thismethod divides the channel high by the channel low to get a percentage figure. This number is used to calculate the stop for each stock. If astock has been fluctuating between $100 and $80, the sell stop would be 80% of the new high. If this stock moved to $120, the stop would bemoved to 80% of $120 which is $96. This style of stop incorporates a stock’s individual volatility into each trade. The buy stop, sell stop, and trading range methods, automatically determine when an investor is in or out of the market. In an up market, thebuy stops are usually triggered and an investor becomes fully invested. In a down market, the sell stops are usually triggered and the investoroften holds a whole or partial cash position. Trading range can also be used as a risk allocation tool for dividing capital between new stockpurchases. Section 3—The Power of Compounding InterestMany investors have unrealistic expectations—the sky is the limit with many market gurus. They are crooks or, at the very least, confused.Realistic returns can amass a fortune over time with the power of compounding interest. Almost anyone can become a millionaire if they startearly enough and achieve an average rate of return. You could even become a billionaire. If a 16-year-old began investing $3,000 a year in anIRA that realized a 17% return, he or she would reach billionaire status at age 85. It would not be easy, but it could be done. This is the powerof compounding interest.
103

The great thing about stocks as an investment is growth is easily managed. It’s difficult to maintain high levels of return with a small business—the owner must continually find new avenues of growth. Real estate also shares this awkward growth challenge. A real estate investor mustmake larger and larger deals to compound at a continuous rate of return. The American Individual Retirement Account, or IRA, and the Canadian Registered Retirement Savings Plan, or RRSP, are tax fee retirementinvestment accounts. These accounts offer one of the last great tax shelters. IRAs and RRSPs allow investments to grow tax-free untilretirement. “Tax-free” turbo charges the power of compounding interest. Not everyone is comfortable investing on their own.Mutual funds offer a simple alternative for those looking to utilize the benefits of an IRAwith minimal effort. One of the best mutuals a person can purchase is an Indexed Fund. These funds track the overall market indices. Thesefunds are simple to manage and charge lower fees. Historically, they outperform the vast majority of mutual funds. Spiders, Diamonds, and Qubes are Closed-End Equity Funds. These investment trusts trade like stocks, but act like mutual funds. The decisionto choose spiders, diamonds, qubes, or indexed funds, will be based on liquidity needs, investment size, market knowledge, and additionalfactors. One of the biggest dangers in the stock market is Penny Stocks. Cheap stocks are cheap for a reason and must be avoided. Newinvestors often want to hold a large quantity of a low-priced stock rather than a small quantity of a high-priced stock. There is no advantage toholding larger quantities of stock. It’s important to think about investments in terms of percentages and not points or absolute values. Stocks fluctuate in price, based onpercentages. If you’re holding 50 shares of a $20 stock, it’s the $1,000 investment that increases or decreases. Percent growth is the reason touse logarithmic scale rather than arithmetic scale on price charts. If you’re going to buy real estate, open a small business, or trade stocks, you must have a plan. Before buying a stock, you must know whenand why you’re going to sell that same equity. Think through all aspects of your trading strategy before making any trades. Answer the toughquestions now, not under the stress of difficult market conditions. Read, read, read, and read some more. Books are cheap and jam packed with incredible information. The stock market is a competition. Youcan get good at the game and compete with the best. Knowledge will make you a better player. No two trader’s trade in the exact samemanner and no two books describe exactly the same stock selection methods or risk management techniques. There is more than one way tobecome a successful investor. Learn several ways and find the style that’s right for you.
104
Great ReturnsGreat Companies, Great Charts is intended to offer investors innovative trading tools for achieving great returns. Often times the media makesthe stock market out to be frighteningly complex, and controlled by the elusive “insider.” The stock market is made up of people like you andme. Stocks move up and down for fundamental and technical reasons. The market model in chapter 1 provides a simple and logical frameworkto divide publicly-traded companies into four groups. It’s easier to achieve great returns by selecting companies that exhibit strong fundamentaland technical characteristics. Picking the best stocks is one element of a successful investing strategy. A complete system should also provide answers to these questions: When should I buy?When should I sell?How much should I buy? Trading well, is as much about self-discipline, as it is about the “system.” Daily subjective decisions are often detrimental to long-terminvestment returns. A rule-based, trend-following system, creates an atmosphere that encourages self-discipline; this offers investors the bestchance at great returns! I continue to be fully invested in the markets. In the strong up market of 2003, the indexes had the following returns: Using the techniquesexplained in this book, my stock portfolio was up +61.9% in that same period. NASDAQ …......+50.0%S&P 500 …......+26.4%DJIA ….............+25.3%AMEX …...........+42.4%
Today is February 27th, 2004, and the year-to-datereturns of these indexes are: NASDAQ ….....+1.32%S&P 500 …......+2.97%DJIA ….............+1.24%AMEX …...........+6.89% My stock portfolio is currently +7.33% ytd 2004.
105
Legal Disclaimer No. 2The above statements have not been audited. No financial statements in this book have been audited. There are frequently differencesbetween theory and actual results subsequently achieved by any particular trading system. Theoretical trading ideas do not involve financialrisk, and no theoretical trading ideas can account for the financial risk in actual trading. Past performance is not an indicator of futureperformance. The stocks I’m currently holding, have held in the past, and will buy in the future, do not represent a recommendation to buy,hold, or sell that or any other equity. The risk of loss in trading stocks can be substantial. I want to leave you with one last thought…in the last 60 days, I’ve made just two trades.
“After spending many years in Wall Street and after making and losing mil-lions of dollars I want to tell you this: It never was my thinking that made
the big money for me. It always was sitting.”
—Edwin Lefévre, author of Reminiscences of a Stock Operator

106
IndexNumerics20/20/20 17, 18, 33, 4252 week high 8, 2080/20 Rule 98 AAbbott Laboratories 60Alan Greenspan 70Amazon.com 37, 38AMEX 105, 106 BBad charts 26Bear markets 70, 71, 75Berkshire Hathaway 79, 94BigCharts.com 101billionaire 82, 103Bonds 79, 84Boston Properties 11Breakouts 45, 48, 71, 91, 103Brown & Brown 39, 62, 63Bull markets 70, 75buy stop 47, 49, 50, 51, 52, 54, 55, 56, 58, 60, 64, 65, 73, 74, 75, 90, 91, 103 CCapital gains 38, 47, 48, 73, 85casino 5Charles LeBeau and David Lucas 53chart reading 12, 13Chico’s FAS 37commission 30, 31, 47, 48, 56, 73, 83, 88,90Compounding Interest viii, 76, 78, 79, 81, 82, 83, 85, 86, 87, 88, 90, 96, 97, 100, 103, 104crooks 79, 103curve-fitting 4 DDavid and Tom Gardner 35, 88, 99David Chidley 68, 75Diamonds 88, 104discretionary ideas 29, 33, 38DJIA 105, 106Dow Jones 72, 77, 87, 88 EEarning per share 10EBay 56, 57Ed Seykota 80Edwin Lefévre 106EPS 10, 11, 13, 15, 16, 17, 18, 19, 20, 21, 25, 27, 28, 34, 39, 42, 102equity risk 56, 57, 69, 73, 74, 75Exceptional Investors 34Exiting Trades 53, 103 FFlat Markets 70, 71Forest Laboratories 11, 38, 62, 63Fundamental Screens 17Futures 2, 17, 31, 45, 53, 69, 84
GGood charts 25, 71GTC 50, 51, 55gurus 70, 78, 79, 103 HHigh-Low Price Difference 58Hot Topic 24human nature 3, 5, 99 IIndex Funds 88, 89Indexed Fund 80, 104Initial Risk 56, 57, 64, 65, 66, 68, 69, 73, 75International Game Tech 37Investment Retirement Account 30Investors Business Daily 17, 101Investors.com 17, 101IPO 93IRA 30, 78, 85, 87, 100, 103, 104 JJack Schwager 79Jeff Bezos 38 Lleverage 83Limit orders 51log scale 97, 98logarithmic 22, 74, 97, 102, 104Louis Rukeyser 90, 101 Mmarket capitalization 13, 35, 40Market Wizards 79, 91, 100Martin Zweig 35, 36, 92, 99Mechanical trading 5, 33, 49Microsoft 8, 45, 46, 48millionaire 77, 78, 81, 82, 103minimum stock price 18, 33Mobile TeleSystems 37MoneyChimp 85Morningstar 7, 13MSN Money 17, 19, 20, 21, 25, 100Mutual funds 3, 35, 79, 87, 88, 104 NNASDAQ 5, 8, 11, 24, 31, 38, 39, 45, 50, 56, 58, 64, 67, 72, 88, 97, 105, 106Net profit margin 8, 9, 10, 11, 16, 17, 18, 19, 20, 21, 34, 37, 39, 42, 102NetBank 5Nvidia Corp 58 OOverall Percent 60, 74, 103 PP/E 14, 15, 16, 36, 40, 90, 91, 92penny stocks 18, 93, 94, 104

Percent vs. Points 96Pfizer 65poker 32, 91power of compounding interest viii, 76, 78,81, 82, 85, 86, 87, 88, 100, 103, 104Previous day’s closing price 8, 9, 20, 21, 42,102pro-level percent stop 74 QQlogic 31, 62, 63quadrillion 78Quantity of stocks held 33, 34Qubes 88, 104Quicken.com 7, 15, 18, 20, 21, 100 RRandomness 90, 91Real estate 11, 83, 84, 104Red Hat 67Registered Retirement Savings Plan 30, 84, 104Return on equity 14, 17, 20, 21, 34, 39, 42,102Revenue 6, 14, 15, 16, 20, 21, 25, 27, 28, 34, 39, 41, 42, 102Risk allocation 69, 75, 103risk of ruin 29risk tolerance 5, 29, 30, 33, 34, 71RRSP 30, 104ruler 23, 57, 74 SS&P 500 105, 106self-discipline 2, 4, 5, 75, 105sell stop 45, 47, 49, 53, 54, 56, 57, 58, 59, 64, 65, 71, 73, 74, 75, 90, 91, 103Shuffle Master 11, 39, 51sign shop 82Spiders 88, 104Spock 32stair step 25, 27, 42Standard & Poor’s 500 88Steve Martin 77Stock Screening 6, 7, 9, 13, 20, 35, 100, 102stop orders 49, 51, 53, 73 Ttax professional 48tax rates 48tax shelter 78, 85, 86, 104tax-free 78, 81, 82, 84, 85, 86, 104Technical Screens 17The Cooper Corporation 37The Millionaire Next Door 82The Mills 32, 37The Motley Fools 88, 99Three-Month 11, 19, 22, 24, 25, 27, 39, 42, 54, 58, 73, 102Three-Year 11, 19, 22, 23, 24, 25, 27, 39, 42, 102Timing 90Toggling 33, 75Tracking stocks 88, 89trading channel 48, 103trading range 45, 46, 47, 48, 49, 56, 57, 58, 59, 64, 73, 74, 103trailing stop 57, 58, 59, 60, 62, 63, 73, 74, 75, 103trend-following 2, 45, 105Tulip Bulb 12
tweak 102 Uugly charts 25, 26Unemotional 29, 32 VVanguard 500 79Venture capital 84Virginia Commerce Bancorp 37volatility 15, 24, 29, 30, 34, 42, 45, 47, 61, 62, 63, 73, 74, 75, 87, 102, 103 WWarren Buffet 8, 79, 92, 94William J. O’Neil 18, 35, 92, 99 YYahoo! 14, 19, 100