Grappling with Inordinate Uncertainty - World...
39
A Report by World Growth Foreword by Dr. David F Smith AM, Senior Fellow, Melbourne School of Land and Environment, University of Melbourne June 2011 Grappling with Inordinate Uncertainty Measuring the Carbon Footprint of Tropical Land-Use Change
Transcript of Grappling with Inordinate Uncertainty - World...
A Report by World GrowthForeword by Dr. David F Smith AM, Senior Fellow, Melbourne School of Land and Environment, University of Melbourne
June 2011
Grappling with Inordinate Uncertainty Measuring the Carbon Footprint ofTropical Land-Use Change

Grappling with Inordinate Uncertainty
Alleviating Poverty through Wealth CreationPalm oil provides developing nations and the poor a path out of poverty. Expanding efficient and sustainable agriculture such as Palm Oil Plantations providessmall and large plantation owners and their workers with a means to improve theirstandard of living.
Sustainable DevelopmentSustainable development of palm oil plantations and growth of the palm oil industryin developing nations can and will be achieved through consultation and collaborationwith industry, growers, lobby groups and the wider community.
Climate and the EnvironmentPalm Oil is a highly efficient, high yielding source of food and fuel. Palm Oilplantations are an efficient way of producing fossil fuel alternatives and capturingcarbon from the atmosphere.
Opportunity and ProsperityDeveloping nations must be allowed the chance to grow and develop without political intervention by environmental groups or developed nations. It is crucial thatdeveloping nations be given the same opportunities which developed nations havebenefited from.
Property RightsEfficient palm oil plantations and the growing demand for palm oil give smaller landholders greater opportunities to make a living off their land, maintain theirownership and support their rights to property and prosperity.

Grappling with Inordinate Uncertainty
Table of Contents
Foreword by Dr. David Smith . . . . . . . . . . . . . . . . . . . 1
Overview . . . . . . . . . . . . . . . . . . . . . . . . . . . . . . . . . . . . 2
I. Introduction . . . . . . . . . . . . . . . . . . . . . . . . . . . . . 5
II. Problems with the Concept . . . . . . . . . . . . . . . . . 6
III. Emissions from Land-Use Change . . . . . . . . . . . 8
The Global Carbon Cycle . . . . . . . . . . . . . . . . . . . 8
Emissions from Global Land Use Change . . . . . 9
A Missing Carbon Sink? . . . . . . . . . . . . . . . . . . . 12
Key Conclusions . . . . . . . . . . . . . . . . . . . . . . . . . 15
IV. Emissions from Land-Use Conversion . . . . . . . 16
Above-Ground Biomass (AGB) in Forests . . . . 16
Below-Ground Biomass (BGB) in Forests . . . . . 19
Biomass in Grasslands . . . . . . . . . . . . . . . . . . . . 19
Soil Organic Carbon (SOC) . . . . . . . . . . . . . . . . . 20
Key Conclusions . . . . . . . . . . . . . . . . . . . . . . . . . 22
V. Carbon Sequestered by Oil Palm . . . . . . . . . . . 23
Above-Ground Biomass . . . . . . . . . . . . . . . . . . . 23
Below-Ground Biomass . . . . . . . . . . . . . . . . . . . 24
Ground Cover & Plant Litter . . . . . . . . . . . . . . . 24
Key Conclusions . . . . . . . . . . . . . . . . . . . . . . . . . 25
VI. Emissions from Oil Palm Plantation Operations . . . . . . . . . . . . 26
Palm Oil Mill Effluent . . . . . . . . . . . . . . . . . . . . 26
Emissions from Fertiliser & Pesticide Use . . . .27
Emissions from Energy Use . . . . . . . . . . . . . . . 28
Key Conclusions . . . . . . . . . . . . . . . . . . . . . . . . . 29
References . . . . . . . . . . . . . . . . . . . . . . . . . . . . . . . . . 30
Grappling with Inordinate Uncertainty • 1
Foreword by Dr. David Smith
Dr. David F Smith AM, Medal of Australian Agriculture, is a Senior Fellow at the Melbourne School of Land andEnvironment at The University of Melbourne. He has had wide experience in the developing countries where suchproduction systems are being developed.
In producing this paper, World Growth has made a welcome addition to the literature on transitions from one form ofland use to another, in this case to the production of palm oil from plantations. The work recognizes that the palms maybe planted on land that has had forest cover removed long ago for farming, or has recently been cleared, specifically forpalm oil production.
The paper includes a very thorough review of the literature, highlights the unreliability of some efforts to quantifythis impact and throws into relief the gaps in knowledge.
In the modern era, all production systems must be based precisely on ‘knowing’— such things as levels of nutrientsin the soil, the exact inputs required, target ranges for operations — as so much depends on the efficiency of eachstage and the supporting critical analysis. Far too often assertions are made about the footprint of such land-usechanges; unfortunately, too often by groups wishing for a bad result for any alternative to trees. The absence ofaccurate data plays into their hands.
One common practice is to lump all land having some trees present in the landscape with other areas of dense talltrees and describe all as forest. In fact it is not axiomatic that tree cover is superior in environmental terms to groundcover by crops or pasturage. Here in Australia, over the years we have seen tree cover replaced by pasture and cropsystems with greatly increased interception of solar energy. Key elements have been the precise addition of fertilizersand the introduction of legumes, enhancing the capture of nitrogen from the atmosphere. Thus there is a substantialincrease in the annual capture of carbon dioxide and other emissions, and over the years a major sequestration ofcarbon in soil organic matter molecules comprised of carbon, nitrogen, sulphur and phosphorus.
This paper is an excellent example of a study embracing all aspects from vegetation removal, planting crops andfield practices, describing the engineering aspects of extraction, waste reduction and use and marketing of the oil.It melds economic and agronomic analysis and engineering aspects. It identifies elements that must be moreprecisely measured — reducing what can only be described as guess work.
PREF
ACE
BY D
R DA
VID
SM
ITH

2 • Grappling with Inordinate Uncertainty
Overview
It is fashionable to consider the ‘carbon footprint’ thatday-to-day activities of humans have on planet earth.The rationale for this concept is that it will give us areadily understood indication of the emissions ofcertain gases – especially carbon dioxide and methane– that are implicated in raising the earth’s temperatureand the level of the sea which has become the focus ofmuch contemporary concern in the community.
However, the concept also has utility as an indicationof how efficiently humans conduct the activities thatgive rise to these emissions; the production of wastehas an economic cost regardless of the consequencesof its disposal.
In the application of the concept two considerationsare paramount: the calculations must include allaspects of the chain of activities in production,distribution, and utilization, and the values attributedto each step must be based on sound science.
In the case of a product like palm oil, the chain mustinclude:
• Removal and disposal of existing vegetation whichmay involve clearing of primary or secondary forestor replacing other human activities such as farmingand grazing;
• Establishment of the oil palms;
• Net accumulation of carbon during development ofthe palms and their ground cover;
• Management of the oil palms for weed and pestcontrol and the application of fertilizer;
• Field operations to harvest the fresh fruit bunchesand transport them to the processing mill
• Milling the fruit and extracting its oils;
• Treating and disposal of mill waste, including thepalm oil mill effluent (POME); and
• Transporting and distributing the oil products towhere they are to be utilized.
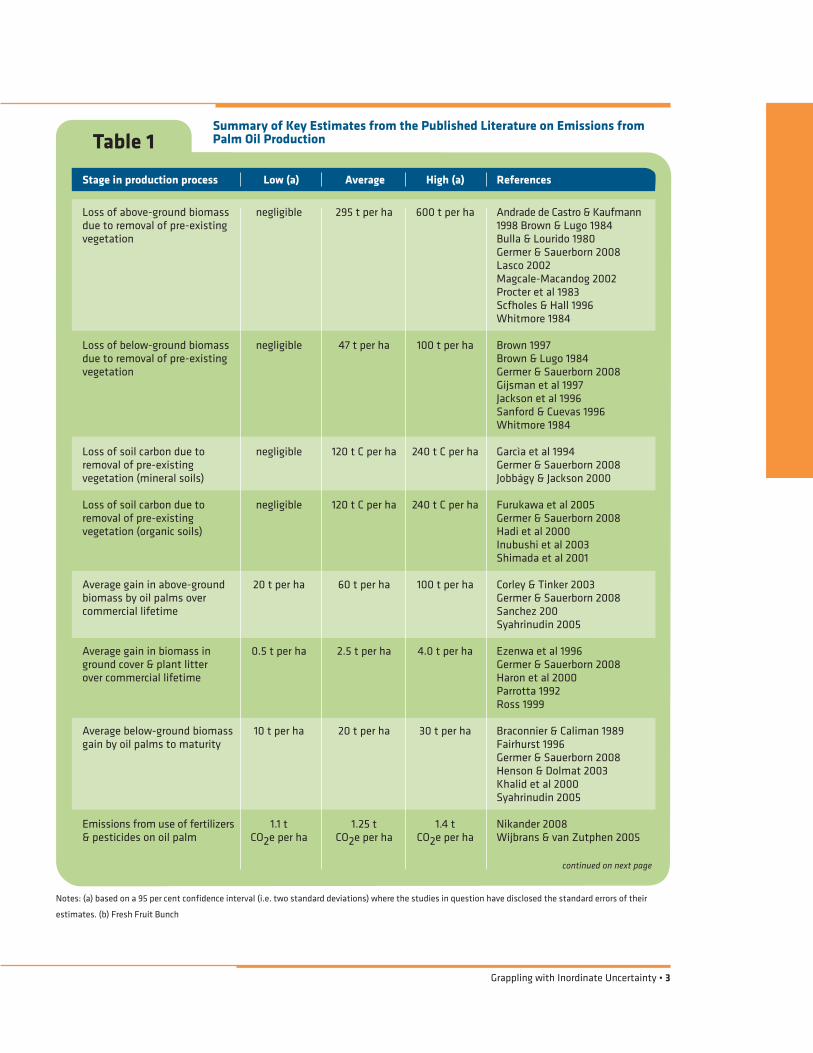
In each of these activities, the emissions intensity ishighly variable, with a wide range of values that maybe observed despite intensity metric is used. Table 1shows just how wide is the range of values in theprofessional literature.
There is a tendency for different groups to aggregatevalues along this chain to support their bias.Frequently it is the condemnation of the clearing offorest and production of palm oil. There is scope toarrive at nearly any answer. To illustrate, the biomass oftropical forest suitable for conversion to palm oilproduction ranges from 10 to 20 tonnes per hectare forpastures or crops to 600 tonnes of above-groundbiomass per hectare for closed, mature forest.Choosing a figure within this range can overwhelm allthe other data inputs — and ‘prove’ just about anyclaim.
The published research has concentrated on primaryforest and permanent grassland. Little has beenpublished on secondary forest or degraded forestland.What has been documented, however, highlights thehigh degree of spatial and temporal variation thatexists in such cases due to differences in localenvironmental factors.
This is highly significant for any assessment of the‘carbon footprint’ for palm oil. Most of the recent oilpalm development has been on tropical forest land,which has been extensively disturbed or degraded by acombination of fire, harvesting, and clearance forshifting cultivation.
The FAO has sought to overcome these shortcomingsby directly estimating forest biomass from timberinventory data provided by national governments. Asfew national inventories are collected on tropicalforests, the FAO relies on ‘educated guesswork’ to fillthe gaps. However, the rigor of such an approach ishighly questionable.
The object of this paper is, therefore, to set out logicallyand coherently the chain of carbon-related eventswhich deliver the palm oil product, to review theliterature relating to each stage, and to bring togetherthe data available in a framework which will haveutility for a range of readers. The analysis will alsoidentify weaknesses and unreliability in theinformation and so make recommendations for moreresearch and analysis.
OVERV
IEW
Grappling with Inordinate Uncertainty • 3
Table 1Summary of Key Estimates from the Published Literature on Emissions fromPalm Oil Production
Loss of above-ground biomassdue to removal of pre-existingvegetation
Loss of below-ground biomassdue to removal of pre-existingvegetation
Loss of soil carbon due toremoval of pre-existing vegetation (mineral soils)
Loss of soil carbon due toremoval of pre-existing vegetation (organic soils)
Average gain in above-groundbiomass by oil palms over commercial lifetime
Average gain in biomass inground cover & plant litter over commercial lifetime
Average below-ground biomassgain by oil palms to maturity
Emissions from use of fertilizers& pesticides on oil palm
negligible 295 t per ha 600 t per ha
negligible 47 t per ha 100 t per ha
negligible 120 t C per ha 240 t C per ha
negligible 120 t C per ha 240 t C per ha
20 t per ha 60 t per ha 100 t per ha
0.5 t per ha 2.5 t per ha 4.0 t per ha
10 t per ha 20 t per ha 30 t per ha
1.1 t 1.25 t 1.4 t CO2e per ha CO2e per ha CO2e per ha
Andrade de Castro & Kaufmann1998 Brown & Lugo 1984 Bulla & Lourido 1980 Germer & Sauerborn 2008 Lasco 2002Magcale-Macandog 2002Procter et al 1983Scfholes & Hall 1996 Whitmore 1984
Brown 1997Brown & Lugo 1984Germer & Sauerborn 2008Gijsman et al 1997Jackson et al 1996Sanford & Cuevas 1996Whitmore 1984
Garcìa et al 1994Germer & Sauerborn 2008Jobbágy & Jackson 2000
Furukawa et al 2005Germer & Sauerborn 2008Hadi et al 2000Inubushi et al 2003Shimada et al 2001
Corley & Tinker 2003Germer & Sauerborn 2008Sanchez 200Syahrinudin 2005
Ezenwa et al 1996Germer & Sauerborn 2008Haron et al 2000Parrotta 1992Ross 1999
Braconnier & Caliman 1989Fairhurst 1996Germer & Sauerborn 2008Henson & Dolmat 2003Khalid et al 2000Syahrinudin 2005
Nikander 2008Wijbrans & van Zutphen 2005
Stage in production process Low (a) Average High (a) References
Notes: (a) based on a 95 per cent confidence interval (i.e. two standard deviations) where the studies in question have disclosed the standard errors of their
estimates. (b) Fresh Fruit Bunch
continued on next page
4 • Grappling with Inordinate Uncertainty
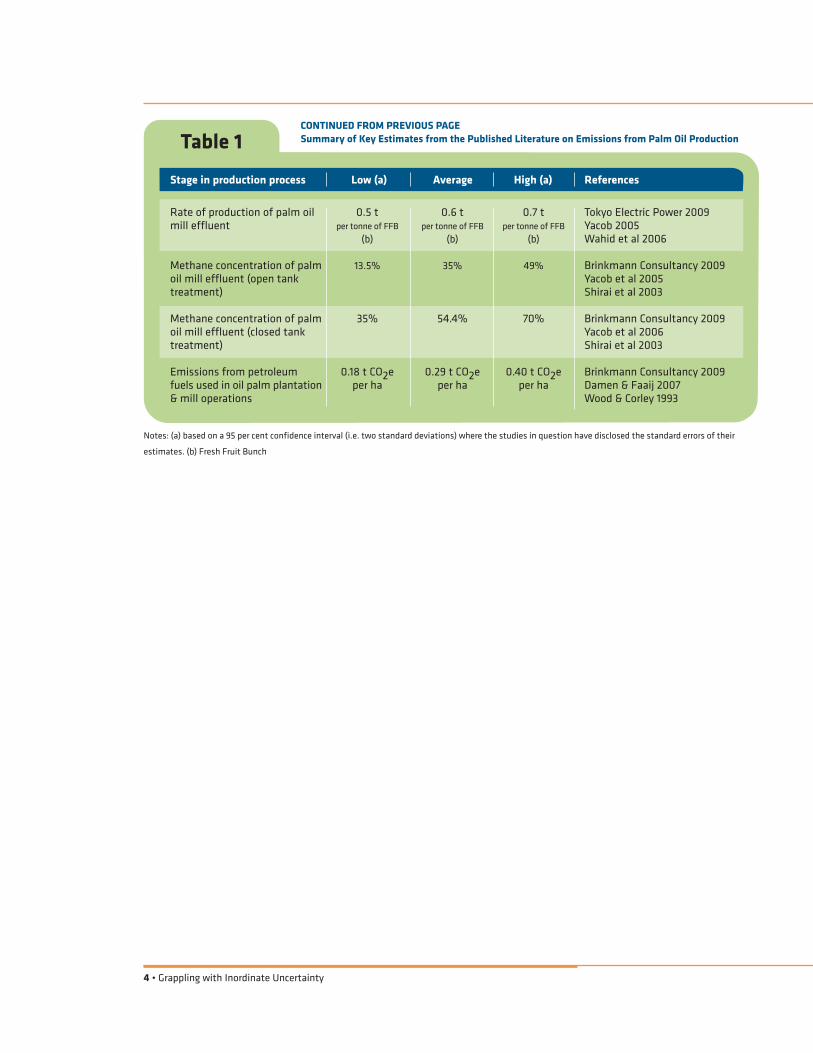
Table 1CONTINUED FROM PREVIOUS PAGESummary of Key Estimates from the Published Literature on Emissions from Palm Oil Production
Rate of production of palm oilmill effluent
Methane concentration of palmoil mill effluent (open tanktreatment)
Methane concentration of palmoil mill effluent (closed tanktreatment)
Emissions from petroleumfuels used in oil palm plantation& mill operations
0.5 t 0.6 t 0.7 t per tonne of FFB per tonne of FFB per tonne of FFB
(b) (b) (b)
13.5% 35% 49%
35% 54.4% 70%
0.18 t CO2e 0.29 t CO2e 0.40 t CO2e per ha per ha per ha
Tokyo Electric Power 2009Yacob 2005Wahid et al 2006
Brinkmann Consultancy 2009Yacob et al 2005Shirai et al 2003
Brinkmann Consultancy 2009Yacob et al 2006 Shirai et al 2003
Brinkmann Consultancy 2009Damen & Faaij 2007Wood & Corley 1993
Stage in production process Low (a) Average High (a) References
Notes: (a) based on a 95 per cent confidence interval (i.e. two standard deviations) where the studies in question have disclosed the standard errors of their
estimates. (b) Fresh Fruit Bunch
I. IN
TRO
DU
CTIO
N
Grappling with Inordinate Uncertainty • 5
I. Introduction
The conversion of forest land to agriculture hasbecome increasingly controversial in recent years. Thecontroversies have been most acute over deforestation,forest degradation, and land use change in tropicaldeveloping countries. In large part the controversieshave reflected increasing public concern about theirlonger-term consequences for the global climate.
This is driving a growing demand for information onthe environmental impact of agricultural products ingeneral and of those grown in tropical countries inparticular. This demand has led to calls for theapplication of concepts such as the ‘carbon footprint’with a focus on those tropical agricultural products,such as palm oil, whose global consumption has beenamong the fastest growing agricultural products inworld markets.
The idea that the carbon footprint of products andprocesses can and should be measured is becomingpopular, particularly in the industrialized world.Supermarket chains in the UK are now giving carbonratings to some products. The European Parliamenthas mandated that the carbon emissions from indirectland use change be assessed for inclusion in the EURenewable Energy Directive. Environmental Non-Governmental Organizations, such as WWF, are nowproposing a carbon footprint standard be made anadditional indicator in the system used to certify the‘sustainability’ of palm oil production, which has beendeveloped by the WWF-sponsored Roundtable onSustainable Palm Oil.
This paper examines what is entailed in defining andmeasuring the carbon footprint of a product when achange of land use occurs and assesses the reliabilityand availability of the information that is required toproduce a robust estimate. This question has particularcurrency because of the ongoing negotiations to createa new global instrument to regulate emissions ofgreenhouse gases. It is considered to be particularlyrelevant to the impact of deforestation and conversionof forest land for other uses, including agriculturalproduction.
Against that background, this paper critically examinesthe concept of a carbon footprint and its practicalapplication to issues of land-use change, particularly
in the context of developing countries for the purposeof expanding their agricultural sectors to feed growingpopulations. In doing so, it reviews the publishedliterature on the estimation of greenhouse gasemissions, including the availability of comprehensiveand robust data along the supply chain for tropicalagricultural products, such as palm oil.
This paper examines what is entailed in defining
and measuring the carbon footprint of a product
when a change of land use occurs and assesses the
reliability and availability of the information that
is required to produce a robust estimate.

process of producing and distributing it, to finalconsumption and ultimate disposal, as appropriate.
There are, however, a number of fundamentalimpediments to the practical application of the carbonfootprint concept and they are most pronounced inthe case of tropical agricultural products, such as palmoil.
Firstly, every product necessarily has a multiplicity ofemission ‘signatures’ in terms of the total amount ofgreenhouse gas emissions, which are generated ateach stage in the process of its production andconsumption — from the extraction of its rawmaterials, through its manufacture and distribution,to its use and ultimate disposal. At every stage thereare multiple possibilities for how or where the activityis to be conducted, each characterized by differencesin emission intensity. The feasible combinations ofeconomic stages produce a series of uniqueproduction-distribution pathways, each with adifferent emissions ‘signature’.
A kilogram of palm oil grown on a plantation inMalaysia will have a different emissions ‘signature’ toone grown by a small holder in West Africa, where thenature of the land and the production system iscompletely different. Equally, if either kilogram wereto be transported to the EU and consumed there, thedownstream emissions would be significantly differentto what would happen were the oil to be consumedlocally. The same is true for most other environmentalimpacts.
It is therefore impossible to speak coherently of aproduct having a single ‘carbon footprint’ or a singleenvironmental footprint for that matter.
Secondly, few products have a supply chain where theemissions ‘signature’ associated with each linkage inthat chain is, more or less, a given. From an emissionsperspective, most products have a multiplicity of supplychains at any one time. As a consequence, every producthas a multiplicity of ‘carbon footprints’ at any one time.
II. Problems with the Concept
Conceptually, a product’s ‘carbon footprint’ is the totalamount of greenhouse gas emissions that aregenerated as a consequence of the production andconsumption of a given amount of the product.
For this purpose, greenhouse gas emissions aregenerally measured in terms of the Global WarmingPotential of each gas, as defined by theIntergovernmental Panel on Climate Change (IPCC).1
Sometimes the concept is extended to include thesubsequent reuse or recycling of the product, as well asits ultimate disposal. As yet there is no consensus onthe scope of the concept or its application.
Life cycle assessment (LCA) is an internationallystandardized method for evaluating theenvironmental burdens produced and theenvironmental resources consumed over the life cycleof a product. It covers the extraction of the rawmaterials, the manufacture of the product, its use bythe final consumer, any subsequent recycling or reuse,and its ultimate disposal. The International StandardsOrganisation (ISO) has formally recognized the LCAconcept and given it operational expression in ISO140402 and ISO 14044.3 In contrast with the ‘carbonfootprint’ concept, LCA is concerned with allenvironmental impacts of a product and not just withits greenhouse gas emissions.
The application of the ‘carbon footprint’ concept to aproduct requires a sound understanding of the scienceof those parts of the carbon cycle that affect and areaffected by its production and consumption, androbust and comprehensive data on the relevant carbonstocks and flows.
The idea of constructing a ‘carbon footprint’ for aproduct has some immediate appeal. It holds out thepromise of providing a comprehensive and internallyconsistent picture of all greenhouse gas emissionsalong the entire supply chain of a good or service —from the extraction of the raw materials, through the
6 • Grappling with Inordinate Uncertainty
1 IPCC [Intergovernmental Panel on Climate Change], 2007, Climate Change 2007: The Physical Science Basis, in IPCC, 2007a, FourthAssessment Report of the Intergovernmental Panel on Climate Change, Cambridge University Press, Cambridge UK & New York, NY
2 ISO [International Standards Organization] 14040:2006 Environmental Management — Life Cycle Assessment — Principles andFramework
3 ISO 14044:2006 Environmental Management – Life Cycle Assessment – Requirements and Guidelines
II. PROBLEM
S WITH
THE CO
NCEPT
Grappling with Inordinate Uncertainty • 7
This is particularly true for the production ofagricultural tree crops, such as palm oil. Theprovenance of the land that is used to grow themmatters greatly from an emissions perspective. Theemissions implications of converting primary tropicalforest land are quite different to those involved inusing existing agricultural land or forest land that hasbeen degraded by shifting agriculture over a longperiod of time. For each type of tropical forest land,the emission implications of its conversion varyenormously.
Thirdly, the emissions ‘signature’ that is associatedwith a given product is constantly changing. Anyestimate of a product’s emissions ‘signature’ iscontingent on the pattern of final consumption for theproduct in question and the nature of the varioussupply chains that support that pattern. Both arechanging constantly in response to changes in pricesalong the supply chain and for substitutes.
Every time the composition of final demand or itssupply chain changes, the ‘carbon footprint’ of theproduct also changes. This is so, even though there maybe no change in the total amount of the product that isconsumed globally. As a product’s final consumptionpatterns and supply chains are changing constantly, thismeans its ‘carbon footprint’ is also constantly changingin response to constantly changing relative prices ateach and every stage of the process.
Finally there are significant problems with ourunderstanding of the science of greenhouse gasemissions from land-use change and the data that areavailable for estimating emissions from land-usechange. These problems are most severe for theestimation of emissions from tropical land-use changeand the conversion of forest land to agriculturalproduction. These issues are taken up in greater detailin the following chapters.
There are, however, a number of fundamental
impediments to the practical application of the
carbon footprint concept and they are most
pronounced in the case of tropical agricultural
products, such as palm oil.

8 • Grappling with Inordinate Uncertainty
terrestrial organisms absorb CO2 from theatmosphere through photosynthesis. As aconsequence, large amounts of carbon are stored inmarine sediment, trees, and other terrestrial plants,but the quantity can be affected whenever a reservoiris disturbed by human activity or natural change. Suchdisturbances can affect both the rates of absorption ofgreenhouse gases and of their release.
In any given accounting period, the net change in thegreenhouse gases released to the earth’s atmospherecan be defined by the sum of the change in each of itscarbon reservoirs or sinks:
Net emissions = Δ Fossil fuel stocks + Δ Ocean sink + Δ Terrestrial sink4
For its Fourth Assessment Report on climate change— its most recent — the Intergovernmental Panel onClimate Change (IPCC) has estimated that, over the1990s, the net greenhouse gas emissions released tothe atmosphere averaged around 3.2 Gt of carbon (C)a year.5 The total was made up as follows:
3.2 Gt C = 6.4 Gt C − 2.2 Gt C − 1.0 Gt C
(± 0.1 GtC) (± 0.4 GtC) (± 0.4 Gt C) (± 0.6 Gt C)
[Net emissions] [Δ Fossil fuel stocks] [Δ Ocean sink] [Δ Terrestrial sink]6
The above estimates were based on measurements ofchanges in:
• concentration of each of the greenhouse gases in theatmosphere [Net emissions];
• global primary energy use [Fossil fuel use]; and
• concentration of CO2 in the oceans and modeling oftheir movement [Ocean sink].7
Most importantly, the contribution of terrestrialecosystems to global emissions was unable to beestimated independently by the IPCC. The IPCC hasinferred its value from its other three estimates.8
Taken at their face value, the IPCC estimates indicate
III. Emissions from Land-Use Change
The conversion of primary forest to oil palm is seen asthe major source of greenhouse gas emissionsassociated with the production and use of palm oilover its life cycle. There are, however, profound andsubstantial uncertainties involved in the identificationand measurement of greenhouse gas emissionsassociated with changes in land use in general, letalone those associated with the conversion ofparticular land uses — such as forest, peat lands, orpermanent pasture — to oil palm plantations.
This chapter will address the general issues in land useconversion, while the following one will canvass theparticular issues associated with conversion for thegrowing of oil palm.
The global carbon cycle
The Earth’s climate is characterized by numerouscomplex and interrelated physical, chemical, andbiological processes that encompass the atmosphere,the continents, and the oceans. These processes aredominated by the global carbon cycle, which is theultimate determinant of the concentration ofgreenhouse gases in the atmosphere.
The global carbon cycle involves the movement ofcarbon between its major global reservoirs or sinks. Inbroad terms, these reservoirs or sinks are the:
• stocks of fossil fuel resources — such as crude oil,natural gas, and coal — both above- and below-ground;
• ocean ecosystems; and
• terrestrial ecosystems.
The use of carbon compounds, such as fossil fuels,releases carbon into the atmosphere in the form ofcarbon dioxide (CO2), methane (CH4), nitrous oxide(N20) and other greenhouse gases, while marine and
4 By convention, the change in fossil fuel stocks includes the release of greenhouse gases from the industrial use of carbonate minerals,such as the production of cement from limestone.
5 IPCC 2007, Table 7.1, p. 516 6 The estimation errors calculated by the IPCC (2007b) are in the round brackets. They are the equivalent to ±one standard deviation of
the central estimate. The standard deviation for a sample or population is a statistical measure of the dispersion in the individual valuesaround the mean.
7 IPCC 2007, p. 5198 ΔTerrestrial sink = Δ Fossil fuel stocks − Δ Ocean sink − Net emissions
III. EMISSIO
NS FRO
M LA
ND
-USE CH
AN
GE

Grappling with Inordinate Uncertainty • 9
breakdown the total terrestrial ecosystem emissionsbetween their various components, particularly thosedirectly associated with land use change.
Emissions from global land use change
In its Fourth Assessment Report, the IPCC estimatedthat global land use change over the decade of the1990s — principally the removal and degradation offorests — accounted for greenhouse emissions thatwere equivalent to about 1.6 Gt of carbon a year, withthe vast bulk of the emissions originating in thetropics.10 This figure is half of the global net emissionsthat the IPCC estimated for each year of the decade.Table 2 has a breakdown of the IPCC global estimateby broad geographical region.
In making its estimate, the IPCC drew on the resultsof two empirical studies of greenhouse gas emissionsfrom global land use change in the 1990s (which havebeen published in peer-reviewed journals).11 The firststudy was conducted by DeFries and her colleagues,12
while the second was undertaken by Houghton.13
(Houghton was also one of DeFries’ co-authors.) Bothsets of results, with estimation errors, are summarizedin Table 2.
DeFries and her colleagues estimated that theemissions from land use change in the tropics duringthe 1990s had averaged around 1.0 Gt C per year.14
This work was based on a terrestrial carbonaccounting model developed by Houghton andothers.15 16 The Houghton model tracks the carbon inliving vegetation, dead plant material, wood products,and soils for each hectare of land that has beencultivated, harvested, or forested. The model is basedon changes in certain types of land use and in thecarbon stored on or in each hectare of land. The land
that around half of the global emissions from fossilfuel use were absorbed by the oceans and terrestrialecosystems.
In the case of the IPCC estimate of the carbon that isabsorbed by terrestrial ecosystems, the estimation error— based on one standard deviation — is ±60 per cent.This is much larger than the equivalent error for any ofthe other estimates. One standard deviation means thatthere is a 68 per cent chance that the actual amount ofcarbon absorbed by terrestrial ecosystems wassomewhere between 0.4 Gt C per year and 1.6 Gt C peryear9 — and a 32 per cent chance that it was outsidethis range, which is an extremely high risk given theseriousness of the consequences of being wrong.
Reducing that probability necessarily widens the errorrange around the central estimate. For example, anestimation error of two standard deviations would give a95 per cent confidence interval around the centralestimate — in other words, it reduces the chance of theactual carbon emissions being outside this interval to just5 per cent — which is more in line with the benchmarkthat is generally used for econometric and statisticalanalysis. In the case of the IPCC estimate of the netcontribution of terrestrial ecosystems to the atmosphere,the 95 per cent confidence interval would be ± 1.2Gt Cper year. This means that there is a 95 per cent chancethat its contribution was somewhere between a netaddition of 0.2 Gt C per year to the atmosphere and anet removal of 2.2 Gt C per year from it.
On the face of it, the error associated with thisestimate is so great that one cannot be confident aboutits significance and therefore cannot determinewhether terrestrial ecosystems were a net source orsink over the 1990s. The uncertainty has beenhighlighted by successive attempts by the IPCC to
9 This is known as the 68 per cent confidence interval. 10 IPCC 2007, p. 51611 IPCC 2007, Table 7.2, p. 51812 Ruth S. DeFries, Richard A. Houghton, Matthew C. Hansen, Christopher B. Field, David Skole, & John Townshend, 2002, ‘Carbon
emissions from tropical deforestation and regrowth based on satellite observations for the 1980s and 1990s’, Proceedings of the NationalAcademy of Sciences, 99(22), pp. 14,256–14,261
13 R.A. Houghton, 2003, ‘Revised estimates of the annual net flux of carbon to the atmosphere from changes in land use and land management 1850-2000’, Tellus, 55B(2), pp. 378–390.
14 DeFries et al 200215 R.A. Houghton, J.E. Hobbie, J.M. Melillo, B. Moore, B.J. Peterson, G.R. Shaver, & G.M. Woodwell, 1983, ‘Changes in the carbon
content of terrestrial biota and soils between 1860 and 1980: A net release of CO2 to the atmosphere’, Ecological Monographs, 53, pp.235–262
16 Richard A. Houghton & Joseph L. Hackler, 1995, Continental scale estimates of the biotic carbon flux from land cover change:1850–1980, ORNL/CDIAC-79, NDP-050, Oak Ridge National Laboratory, Oak Ridge, TN

10 • Grappling with Inordinate Uncertainty
17 Houghton et al 1983 and Houghton and Hackler 1995 18 P.A. Agbu & M.E. James, 1994, The NOAA/NASA Pathfinder AVHRR Land Data Set User’s Manual, Goddard Distributed Active Archive
Centre, Greenbelt, MD19 Houghton (2003) estimated that land use change in non-tropical regions of the world represented a net carbon sink but its contribution
was negligible in extent. 20 DeFries et al 200221 FAO [Food & Agriculture Organization of the United Nations], 2000, ‘Assessing state and change in global forest cover: 2000 and
beyond’, Forest Resources Assessment Programme Working Paper, Working Paper 31, FAO, Rome22 FAO [Food and Agriculture Organization of the United Nations], 2001, Global forest resources assessment 2000: Main report, FAO
Forestry Paper No 140, FAO, Rome, Italy
In sharp contrast, Houghton estimated that the globalgreenhouse gas emissions from land use changeaveraged 2.2 Gt C per year, all of which originated inthe tropics.19 Even though he had used the samecarbon accounting model as DeFries and hercolleagues20 — which he had also been instrumentalin developing — every one of Houghton’s results wassubstantially higher than those estimated by DeFriesand her colleagues. This was true both for the landuse emissions from tropics as a whole as well as thosefrom each of the major tropical regions.
Houghton used the data on changes in land use andforest cover over the 1990s that were collected by theFAO as part of its regular Forest Resource Assessment(FRA) process over that decade.21 22 However, theestimates of the changes in forest cover that have been
use changes in question included land clearing forcultivation and pasture, abandonment of agriculturalland, harvesting of wood and timber, reforestation,afforestation, and shifting cultivation.
To parameterize the Houghton carbon accountingmodel, DeFries and her colleagues used data oncarbon storage rates under different land uses, whichhad been previously collected from a range of sourcesby Houghton and his colleagues, including officialstatistics together with ecological and anthropologicalstudies.17 DeFries and her colleagues also used spatialdata on tree coverage that they derived from the coarsesatellite data collected by the Advanced Very HighResolution Radiometer (AVHRR), which is operatedby the US National Oceanic and AtmosphericAdministration (NOAA).18
Table 2Estimates of Greenhouse Gas Emissions from Changes in Land Use by Geographical Region, 1990 to 1999, Gt C Per Year (a) (b)
Source
DeFries et al 2002
Houghton 2003
Achard et al 2004
IPCC 2007b
TropicalAmericas
0.5(0.2 to 0.7)
0.8(0.5 to 1.1)
0.3(0.3 to 0.4)
0.7(0.4 to 0.9)
Tropical Africa
0.1(0.1 to 0.2)
0.40.2 to 0.6)
0.2(0.1 to 0.2)
0.3(0.2 to 0.4)
Tropical Asia
0.4(0.2 to 0.6)
1.1(0.6 to 1.6)
0.4(0.3 to 0.5)
0.8(0.4 to 1.1)
All TropicalRegions
1.0(0.5 to 1.6)
2.2(1.6 to 2.8)
0.9(0.5 to 1.4)
1.6(1.0 to 2.2)
Non-TropicalRegions
N.A.
−0.02(0.48 to 0.52)
N.A.
−0.02(0.48 to -0.52)
World
N.A.
2.2(1.4 to 3.0)
N.A.
1.6(0.5 to 2.7)
Notes: (a) estimation errors are in round brackets and represent ± one standard deviation (b) n.a. = not available.
Source: IPCC 2007, Table, 7.2, p. 518.

Grappling with Inordinate Uncertainty • 11
23 Energy Directorate-General [of the European Commission], 2010, ‘The Impact of Land Use Change On Greenhouse Gas Emissionsfrom Biofuels and Bioliquids: Literature Review’, An in-house review by the Energy Directorate-General for the European Commission’sanalytical work on indirect land use change, Brussels, July
24 DeFries et al 2002 25 R.A. Houghton, undated, ‘Data Note: Emissions (and Sinks) of Carbon from Land-Use Change’, Mimeo, The Woods Hole Research
Centre, Falmouth, MA [accessed on 14 December 2010 at http://www.earthtrends.wri.org/downloads/DN-LUCF.pdf] 26 Frédéric Achard, Hugh D. Eva, Philippe Mayaux, Hans-Jürgen Stibig, & Alan Belward, 2004, ‘Improved estimates of net carbon
emissions from land cover change in the tropics for the 1990s’, Global Biogeochemical Cycles, 18, GB2008, doi:10.1029/2003GB00214227 DeFries et al 200228 Houghton undated29 In the case of the non-tropical regions, the IPCC (2007) used the results from Houghton (2003). 30 Achard et al 200431 IPCC 2007, Table 7.2, p. 5188
Houghton has subsequently admitted that the errorsthat are associated with his 2003 estimates ofemissions at a national or regional level aresubstantial.25 In the light of the research by Achard etal26and DeFries et al27, Houghton concluded that his2003 estimates of emissions from tropical countriesmay be too high by a factor of two. Given theuncertainty in calculating carbon stocks in tropicalforests, Houghton has admitted that an additionalerror of +50 per cent is a possibility. On this basis hehas concluded that
‘If one considers the uncertainty in estimates ofcarbon stocks in tropical forests, an additionalerror of +50% is possible. Thus, these estimatesof national sources and sinks of carbon fromland-use change are uncertain on the order of +150% for large fluxes, and + 50 MtC/yr forestimates near zero.’28
For its part the IPCC took an unweighted average ofthe results obtained by DeFries et al and byHoughton.29 In doing so, the IPCC explicitly ignoredAchard et al.30 Its stated rationale was that the firsttwo studies were the only ones that covered land usechanges in both the 1980s and 1990s.31 This isunconvincing and does not inspire confidence in itsresults.
Achard et al have estimated the greenhouse emissionsfrom land use change in the tropics over the 1990swere even lower than those published by DeFries etal. They calculated that the emissions were equivalentto 0.9 Gt C per year. Had the IPCC simply includedthese results in its estimation method, they wouldhave lowered the IPCC estimate of global greenhousegas emissions from land use change from 1.6 t C peryear to 1.4 t C per year — a reduction of nearly 17 per
derived from satellite observations for all the majortropical regions over the same period, which have beenpublished by DeFries and her colleagues, gave rates ofchange in forest cover that were significantly less thanthose suggested by the FRA data.
As has been pointed out many times in the literatureto date, questions remain over the accuracy of the FAOdata on land use and forest cover.23 24 For the FRAprocess, the data in question are obtained fromnational governments, with only limited satelliteconfirmation of its accuracy in the case of the datacollected for the 1990s.
The participation of individual countries means thatvarying definitions of forest cover and time intervalshave been used for the collection. Moreover, thedatabase contains a significant number of values thathave been estimated by FAO staff, which could alsoresult in unreliability or bias. Although most of the dataquality concerns relate to the data on smallerdeveloping countries that lack an established localauditing capacity, there are significant concerns aboutthe quality of the data reported by a number of thelarger developing countries, such as China, and thesharpness of the definitions that are used to collectthem. In other words, the problems are most acutewhere most of the tropical deforestation is thought tooccur.
As has been pointed out many times in
the literature to date, questions remain
over the accuracy of the FAO data on land
use and forest cover.

12 • Grappling with Inordinate Uncertainty
cent. The lower figure is 42 per cent of the IPCCestimate of net global emissions.
More recent research suggests that the result obtainedby Achard et al is itself a substantial overestimationand that the global emissions from land-use changeare, in fact, less than half of those reported by theIPCC in its Fourth Assessment Report. Using state-of-the-art and spatially explicit datasets on forest area,forest loss, and forest carbon stocks, Harris and hercolleagues have estimated the emissions from forestloss in 96 developing countries around the world.32
They undertook this work as part of the backgroundresearch that was commissioned by the World Bankfor the World Development Report 2010.33
Harris and her colleagues have estimated that thegross emissions from the loss of tropical forest coverbetween 2000 and 2005 were only 0.7 Gt C per year.They also calculated that the standard error of theirestimate was ± 0.3 Gt C per year.34 Based on twostandard deviations, the 95 per cent confidenceinterval around their estimate is ± 0.6 Gt C per year,which is almost as large as the estimate itself.
Unlike Houghton’s 2003 estimate, theirs explicitlyexcludes any allowance for the carbon that is
sequestrated by annual forest regrowth. Based on theirpreliminary analysis of that impact, Harris et alestimate that forest regrowth absorbs 2 to 7 per cent ofthe gross emissions from the global loss of forestbiomass.35
A missing carbon sink?
This does not resolve the uncertainty about theterrestrial contribution. It simply means that thecarbon accounting identity has to include anothercarbon sink to make the two sides of the identitybalance. The IPCC has attributed the differencebetween the estimate of the net accumulation ofcarbon by terrestrial ecosystems and that for theemissions associated with land use change to what ithas termed the ‘residual terrestrial sink’. Theimplication is that, over the decade of the 1990s, this‘residual terrestrial sink’ absorbed some 2.6 Gt C peryear from the atmosphere.36
The nature of the ‘residual sink’ and the science behindit are the subject of considerable and ongoingcontroversy. Some researchers have hypothesized thatincreased atmospheric concentrations of CO2 hasaccelerated the growth of plants. Although mostbiological models predict enhanced growth and carbonsequestration by plants in response to rising CO2levels, the experimental evidence in support of themhas been mixed. Controlled experiments have shownthat increased concentration of CO2 in the atmosphereenhances plant growth — at least initially — butnutrient availability and other limitations may emergeas constraints, depending upon the agriculturalmanagement responses that farmers implement.Long-term observations of biomass change and growthrates suggest that such fertilization effects are too smallto account for the residual carbon sink on land.
As the amount of organic carbon in soils is far greaterthan that in living vegetation, soil carbon might be all
32 Nancy L. Harris, Sassan S. Saatchi, Stephen Hagen, Sandra Brown, Willian Salas, Matthew C. Hansen, & Alexander Lotsch, 2009,‘New Estimate of Carbon Emissions from Land-Use Change’, Forest Day 2010 Poster, Winrock International & Applied GeoSolutionsLLC, Arlington VA & Durham NC [accessed on 30 May 2010 at http://www.winrock.org/Ecosystems/files/Winrock%20%20New%20Estimate%20of%20Carbon%20Emission%20from%20Land%20Use%20Change%20%20Forest%20Day%20Poster%202010.pdf].
33 World Bank, 2009, World Development Report 2010: Development and Climate Change, World Bank, Washington, DC 34 Harris et al 200935 Harris et al 200936 IPCC 2007, p. 516
More recent research suggests that the
result obtained by Achard et al is itself a
substantial overestimation and that the global
emissions from land-use change are, in fact,
less than half of those reported by the IPCC
in its Fourth Assessment Report.
Grappling with Inordinate Uncertainty • 13
or part of the explanation of the ‘missing sink’.37 38 Soilorganic carbon includes plant, animal, and microbialresidues in various stages of decomposition. The half-life of each varies according to the complex biological,chemical, and physical interactions that take place inthe soil. Over the long run the amount of organiccarbon stored in soil reflects the balance between therate of accumulation of soil organic carbon inputs andrate of mineralization in each of the organic carbonpools.39
The concentration of organic carbon in soil affects thegrowth of plants and is affected by them. Soil organiccarbon has been long recognized as playing a key rolein soil fertility and agricultural production. In thehumid tropics, forests store more soil organic carbonthan the total amount under temperate and borealforests combined.40 Accordingly it is critical tounderstand the role of soil carbon in the global carboncycle and its potential as a candidate to fulfill the roleof the ‘residual terrestrial sink’.
The capacity of forests to store carbon in their soilsover long periods depends upon the net changes in thestorage of those physical forms of soil organic carbonthat are most resistant to decomposition.41 The factorsthat control the accumulation of organic carbon belowthe ground, its decomposition, and its retention,however, are very poorly understood.42
Practical difficulties have constrained directmeasurement of the take-up of organic carbon by soilsand little is known about how well it is retained onceit is there. Moreover, the sheer complexity of theunderground carbon cycle is a major obstacle toaccurately modeling how it works. For example, therehas to be an adequate supply of other nutrients and
they, in part, depend upon fertilizer use. Science hasonly rudimentary techniques for categorizing theunderground carbon cycle into units that can be usedto test basic concepts in plant ecology and to modelecosystem response to change.43
Soil organic carbon stocks and emissions ofgreenhouse gases are primarily determined by the soiltype. For this reason, the IPCC approach to carbonaccounting differentiates between mineral and organicsoils, such as those that are associated with peat lands.Oil palm can be grown commercially on both.
A major uncertainty is the vertical distribution oforganic carbon over the soil profile and itsrelationships with climate and vegetation cover.44 Soilsurveys usually measure the soil carbon down to agiven depth, typically the first meter of the soil profile.Global surveys based on vegetation and soil categoriesindicate that soils store between 1,500 and 1,600 Gtof carbon in the top meter of the soil profile.45 Usingthe FAO soil classification system, Batjes hasestimated that the inclusion of the second meter of thesoil profile increases this by 60 per cent.46
The only other global assessment of the verticaldistribution of soil organic carbon has been made byJobbágy and Jackson.47 They estimated that the soil
The nature of the ‘residual sink’ and the science
behind it are the subject of considerable and
ongoing controversy.
37 W.M. Post & K.C. Kwon, 2000, ‘Soil Carbon Sequestration and Land-Use Change: Processes and Potential’, Global Change Biology, 6,pp. 317–328
38 IPCC 200739 Post & Kwon 2000 40 Estaban G. Jobbágy & Robert B. Jackson, 2000, ‘The vertical distribution of soil organic carbon and its relation to climate and vegetation’,
Ecological Applications, 10(2), pp.423–43641 Willam H. Schlesinger & John Lichter,2001, ‘Limited carbon storage in soil and litter of experimental forest plots under increased
atmospheric CO2, Nature, 411, p. 466–46942 Christian P. Giardina, Dan Binkley, Michael G. Ryan, James H. Fownes, & Randy S. Senock, 2004, ‘Belowground carbon cycling in a
humid tropical forest decreases with fertilization’, Oecologia, 139(4), pp. 545–55043 Giardina et al 2004 44 Jobbágy & Jackson 200045 Jobbágy & Jackson 200046 N.H. Batjes, 1996, ‘Total carbon and nitrogen in the soils of the world’, European Journal of Soil Science, 47, pp. 151–16347 Jobbágy & Jackson 2000
organic carbon in the top three meters of the soilprofile amounts to some 2,344 Gt C globally — 56 percent more than that found in the first meter of theprofile (1,502 Gt) which has been the more or lessexclusive focus of most of the IPCC carbon accountingguidelines. The vertical distribution of the global totaldeclined rapidly with increasing soil depth — 64 percent in the first meter, 21 per cent in the second meter,and 15 per cent in the third.48 This is in line with theresults of earlier research.49
This work was based on 2,700 soil profiles taken fromthree global databases. Although the databasescharacterize the diversity of agricultural and non-agricultural soils in temperate and tropical plantcommunities, the sizes of the sub-samples for thetropical plant communities were relatively small — 29were from tropical deciduous forests; 36 from tropicalevergreen forests; and 35 from tropical grasslands orsavannas. There are therefore question marks over thestatistical robustness of any estimates based on them.
The published estimation error for these estimates —based on one standard deviation — was relatively largeand increased with soil depth. Jobbágy and Jacksonconcluded that their estimation error was, at best,coarse as they did not include the effect of any biasesdue to non-random sampling of the soil profiles.
Other major uncertainties involve the rates of loss andrecovery in soil carbon in the wake of particularchanges in land-use. A number of such changes havelong been known to cause very rapid declines in soilorganic matter.50 51 52 53 54 Much of the loss in soilorganic matter reflects one or more of the following:
• reductions in the return of organic matter to the soil;
• increases in the rate of decomposition of plantresidues; and
• reductions in the physical protection of soil organicmatter from decomposition, which occur followingcertain tillage practices.
After reviewing the literature on the subject, Post andKwon have concluded that there was insufficient dataat the time (2000) to determine the amount of soilcarbon accumulating in any large region or plot ofland with any precision but sufficient to infer the orderof the sequestration rate.55 They found that themaximum rates of accumulation of soil carbon duringthe early stages of vegetation growth, althoughsubstantial, are usually much less than one tonne ofcarbon per hectare per year.
Post and Kwon estimate that the average rate ofaccumulation in the density of soil carbon under forest— 0.34 t C per ha per year — is similar to that undergrassland — 0.33 t C per ha per year — which is in linewith earlier research.56 In light of the relatively smallareas that were involved globally, they have concludedthat such rates of carbon sequestration were not enoughto account for the missing terrestrial carbon sink.
14 • Grappling with Inordinate Uncertainty
A major uncertainty is the vertical distribution
of organic carbon over the soil profile and its
relationships with climate and vegetation cover.
48 Jobbágy & Jackson 200049 Anwar Ghani, Alex Mackay, Brent Clothier, Denis Curtin, & Graham Sparling, 2009, A literature review of soil carbon under pasture,
horticulture and arable land uses, Report prepared for AGMARDT [the New Zealand Agricultural and Marketing Research andDevelopment Trust], AgResearch Limited, Hamilton, New Zealand, October
50 H. Jenny, 1941, Factors of Soil Formation. McGraw-Hill, New York51 E.A. Davidson & I.L. Ackerman, 1993, ‘Changes in soil carbon inventories following cultivation of previously untilled soils’,
Biogeochemistry, 20, pp. 161-19352 L. K. Mann, 1986, ‘Changes in soil carbon after cultivation’, Soil Science, 142, pp. 279-28853 W.H. Schlesinger, 1985, ‘Changes in soil carbon storage and associated properties with disturbance and recovery’, in J. R. Trabalka and
D .E. Reichle (eds.), 1985, The Changing Carbon Cycle: A Global Analysis, Springer-Verlag, New York, NY54 W.M. Post & L.K. Mann, 1990, ‘Changes in soil organic carbon and nitrogen as a result of cultivation’, in A. F. Bouwman (ed.), 1990, Soils
and the Greenhouse Effect, pp. 401-406, John Wiley & Sons, New York, NY.55 Post & Kwon 200056 William H. Schlesinger, 1990, ‘Evidence from chronosequence studies for a low carbon-storage potential of soils’, Nature, 348, pp. 232-234

Grappling with Inordinate Uncertainty • 15
Key conclusions
Estimates of greenhouse gas emissions rely heavily ona sound understanding of the density of the biomassand the fate of its carbon when the vegetation cover isremoved. The published research on this subject hasconcentrated on primary forest and permanentgrassland. Little has been conducted on secondaryforest or degraded forestland. This is highly significantfor any assessment of the ‘carbon footprint’ for palmoil. Most of the recent oil palm development has beenon former tropical forestland, which had already beenextensively disturbed or degraded by a combination offire, harvesting, and clearance for shifting cultivation.
The FAO has sought to overcome the lack of specificdata by directly estimating forest biomass fromnational timber inventories provided by nationalgovernments. As few of them cover tropical forests,however, the FAO relies on ‘educated guesswork’ to fillthe gaps, the reliability of which is highlyquestionable.
As a consequence the published estimates ofgreenhouse gas emissions from such changes aresubject to very large estimation errors (knownunknowns) and substantial uncertainty (unknownunknowns). The known unknowns reflect the lack ofcomprehensive, robust and finely-grained data onland-use change discussed above. The unknownunknowns are more fundamental: they reflect our lackof understanding about the science that underpinsterrestrial carbon stocks and flows.
To illustrate the point, the published biomassestimates imply that there is a 95 per cent probabilitythat the biomass density of tropical forest suitable forconversion to oil palm is somewhere betweennegligible and 600 tonnes of biomass per hectare.Given this, we really have little idea of the implicationsof conversion for greenhouse gas emissions. Thismeans that a case-by-case evaluation of each hectareof land is necessary to establish those implicationswith any accuracy.

IV. Emissions from Land-Use Conversion
On the face of it, one of the major sources of thegreenhouse gas emissions associated with palm oilover its life cycle are those associated with theconversion of certain land uses — particularly suitableprimary and secondary forest, peat lands, andpermanent pasture — to the growing of oil palm. Suchconversions generally involve a substantial loss of thecarbon that is stored in both above- and below-groundbiomass, as well as in the soil which supports thebiomass in question. The stored carbon is released bythe decomposition or burning of in situ biomass toclear the land for the establishment of oil palm.
The literature on this subject has concentrated onestimating the carbon that is lost when primary forestor permanent grassland is cleared to make way for thecultivation of oil palm.57 There is relatively little on thecarbon lost from the removal of other types ofvegetation, including secondary forest such as stuntedregrowth. This is significant as much of the recent oilpalm development has been on forest land that haspreviously been extensively disturbed (secondaryforest) or degraded by fire, timber harvesting, orclearance for shifting cultivation.
Many estimates of the density of forest biomass havebeen published in peer-reviewed scientific literature.For example, the International Biological Program(IBP) has covered most of the major forest regions ofthe world.58 Brown and Lugo have prepared detailedestimates for tropical forests.59 In all cases, however,the data for the estimates of biomass density have beensourced from ecological studies.60
For a number of reasons, the results from ecologicalstudies cannot readily be extrapolated to much largerscales, such as those that are required for a global,continental or national perspective on the carbon cycle:
• Ecological studies are generally designed tocharacterize local forest structure and the forest siteschosen for examination are neither randomlyselected nor representative of the forest populationas a whole.61 Accordingly, they do not provide a validbasis for making inferences about whole forestpopulations.62
• The total area of forest that is covered by ecologicalstudies represents an extremely small sample of theworld’s forests.63 Brown and Lugo have calculatedthe tropical forest sites that had been studied up tothat time (1984) represent less than 0.00001 percent of the global area of tropical forest.64
Subsequent research is unlikely to have changed thatsituation.
• Ecologists tend to select study sites based on theirideas about what a forest should look like, namelyones with many large diameter trees.65 This bias insite selection leads to an overestimation of biomassdensity for particular types of forest.66
Above-ground biomass in forests
In the case of forests, the FAO has sought to overcomethese statistical sampling problems by directlyestimating the above-ground biomass (AGB) densityusing the data that it collects from nationalgovernments for its global Forest ResourcesInformation System (FORIS).67
16 • Grappling with Inordinate Uncertainty
57 Brinkmann Consultancy, 2009, Greenhouse Gas Emissions from Palm Oil Production: Literature review and proposals from RSPO[Roundtable on Sustainable Palm Oil] Working Group on Greenhouse Gases, Brinkmann Consultancy, Hoevelaken, The Netherlands,9 October
58 David E. Reichle (ed.), 1981, Dynamic properties of forest ecosystems, International Biological Programme Synthesis Series No. 23,Cambridge University Press, UK
59 S. Brown & A.E. Lugo, 1982, ‘The storage and production of organic matter in tropical forests and their role in the global carbon cycle’,Biotropica, 14, pp. 161-187
60 Brown 199761 S. Brown & A.E. Lugo, 1992, ‘Above ground biomass estimates for tropical moist forests of the Brazilian Amazon, Interciencia, 17, pp. 8-1862 S. Brown, A.J.R. Gillespie, & A.E. Lugo, 1989, ‘Biomass estimation methods for tropical forests with applications to forest inventory
data’, Forest Science, 35, pp. 881-902.63 Sandra Brown, 1997, Estimating Biomass and Biomass Change of Tropical Forests: A Primer, FAO Forestry Paper No. 134, FAO, Rome,
Italy [accessed on 17 December 2010 at http://www.fao.org/docrep/w4095e/w4095e00.htm] 64 S. Brown & A.E. Lugo, 1984, ‘Biomass of tropical forests: A new estimate based on forest volumes, Science, 223, pp. 1,290-1,29365 Brown & Lugo 199266 Brown et al. 198967 FAO[Food and Agriculture Organization of the United Nations], 1993, Forest resources assessment 1990: Tropical countries, FAO
Forestry Paper No 112, FAO, Rome, Italy
IV. CARBO
N SEQ
UESTERED
BY OIL PA
LM

Grappling with Inordinate Uncertainty • 17
The FAO has calculated AGB density for each forestestate based on the volume of merchantable timber perhectare in the estates covered by FORIS.68 The formulafor doing so is as follows:
AGB density [t per ha] = VOB * WD * BEF
where
VOB is the volume over bark 69
WD is the volume-weighted average density of wood
BEF is the biomass expansion factor70
In principle, this method of estimating the AGBdensity of a forest slightly underestimates the densityof a closed forest — by less than 5 per cent. For an openforest, the inherent error is unknown.71
VOB is a commonly used measure of the stock ofcommercially valuable timber. VOB values aregenerally estimated from large random samples basedon statistically sound sampling designs. In practice fewnational or sub-national VOB inventories have beencollected for tropical forests. Accordingly, the FAO hashad to rely on ‘educated guesswork for that region’. Thereliability of this approach is highly questionable as anyerrors would be compounded in converting VOB datato biomass density.72
Germer and Sauerborn have undertaken the mostrecent and most comprehensive review of the relevant
scientific literature in relation to land use conversionfor the establishment of oil palm.73 The followingdiscussion draws extensively on their results regardingthe density of above-ground biomass (AGB) in tropicalrain forests.
Germer and Sauerborn found that forest biomassdensity varies substantially between different localenvironments. For example, case studies in theMalaysian state of Sarawak have estimated that theAGB density was between 210 t per ha and 650 t per hafor the different forest types in that state. This is morethan a three-fold difference.74
Some of the disparity in AGB density estimates reflectsinconsistencies in the different methods of estimationthat have been used. Brown and Lugo have calculatedtropical forest AGB density in two quite different ways —by measuring the volume of the wood and by destructivesampling.75 76 Based on data on the volume of wood,Germer and Sauerborn have calculated the AGB densityof closed primary tropical forest at 176 t per ha.Destructive sampling, however, gave a figure of 283 t perha — which represents a difference of 61 per cent.
The biomass density of tropical lowland forest — thetype that is most frequently converted to oil palm — is
68 Sandra Brown, Louis R. Iverson, & Anantha Prasad, 2001, Geographical Distribution of Biomass Carbon in Tropical Southeast AsianForests: A Database, ORNL/CDIAC-119, NDP-068, Carbon Dioxide Information Analysis Centre Oak Ridge National Laboratory, OakRidge, TN, USA
69 VOB is a measure of timber stocks and is expressed as their gross volume in cubic metres per hectare. It is a measure taken over barkof the free bole — from stump or buttresses to the crown point of the first main branch — of all living trees that are more than (usually)10 centimetres in diameter at breast height. Estimation of AGB on this basis therefore omits the biomass in the stump and in any forest litter.
70 BEF is the ratio of above-ground oven-dry biomass of trees to oven-dry biomass of inventoried volume.71 Sandra Brown, Louis R. Iverson, Anantha Prasad, & Dawning Liu, 1993, ‘Geographical distributions of carbon in biomass and soils of
tropical Asian forests’, Geocarto International, 4, pp. 45–5972 Brown 199773 J. Germer & J. Sauerborn, 2008, ‘Estimation of the impact of oil palm plantation establishment on greenhouse gas balance’,
Environment, Development and Sustainability, 10, pp. 697–71674 John Proctor, J.M. Anderson, S.C.L. Fogden, & H.W. Vallack, 1983, ‘Ecological studies in four contrasting lowland rainforests in Gunung
Mulu National Park, Sarawak: II Litterfall, litter standing crop and preliminary observations on herbivory’, Journal of Ecology, 71, pp.261–283
75 S. Brown & A.E. Lugo, 1982, ‘The storage and production of organic matter in tropical forest and their role in the global carbon cycle’,Biotropica, 14, pp. 161–187
76 Brown & Lugo, 1984
The reliability of this approach is highly questionable
as any errors would be compounded in converting
VOB data to biomass density.

usually higher than that of upland forest.77 Whitmorehas reported that the AGB density of lowland primaryforest is typically 400 t per ha.78 The AGB densityvaries considerably, however, due to the differentenvironmental and human influences that occur at thelocal level.79 For example, logging and forestfragmentation can markedly reduce AGB density.80
Lasco has estimated that logging generally reducesAGB density by between 22 and 67 per cent.81
Germer and Sauerborn have estimated that the averageAGB density of lowland forests in a climate, which issuitable for the growing oil palm commercially, was 295t per ha.82 They calculated the estimation error — basedon one standard deviation around the average — was± 152 t per ha. In other words, 68 per cent of theindividual AGB density measurements were between143 t per ha and 447 t per ha. As a comparison, the 95per cent confidence interval is from zero to 600 t perha. These very wide ranges underline the considerablespatial variation that can occur with such forests.
Although the IPCC has proposed somewhat lowerdefault values for forest biomass density — 275 t per hain the case of insular Asia and 225 t per ha forcontinental Asia — a critical issue that remains is thelarge divergence of possible values around thosedefault values.83
The establishment of oil palm requires the removal ofthe existing vegetation from the land in question. Anycommercially valuable timber is normally harvested
18 • Grappling with Inordinate Uncertainty
during the clearance process but the residual biomassis either burned, left to decompose naturally, or somecombination of the two. The greenhouse gas emissionsfrom harvesting, burning, and decomposition eachvary significantly in terms of both emissioncomposition and time horizon.
For any given area that has been cleared of vegetation,the proportion of the removed biomass carbon that isoxidized by fire varies tremendously, even over shortdistances.84 Although the IPCC guidelines propose adefault fraction of 50 per cent for cleared forestbiomass, they recognize that that this value has to beadjusted to reflect local conditions.85 In contrast, asingle burn will often only immediately oxidize lessthan 20 per cent of the available carbon.86 Andreaeestimates that repeated burning would only releasesome 40 per cent of the carbon in forest biomassthrough combustion, while the rest is released rathermore slowly through subsequent decomposition.87
Germer and Sauerborn agree.88
The biological decomposition of forest biomassreleases nutrients that are taken up by other plants,with most of the remaining carbon emitted as CO2. Inthe tropics, the half-life of small litter — leaves andtwigs — can be less than a year but that for hardwoodtree species is much longer.89 A study of the centralAmazon forest found that 95 per cent of the forestbiomass decomposes over 18 years.90 Although termitescan release some of the organic carbon as methane(CH4), uncertainty over this process has led the IPCC
77 Brown & Lugo 198478 T.C. Whitmore, 1984, Tropical rain forest of the Far East, Clarendon Press, Oxford, UK79 Brown et al 199380 W. F. Laurance, S. G. Laurance, & P. Delamonica, 1998, ‘Tropical forest fragmentation and greenhouse gas emissions, Forest Ecology and
Management, 110, pp. 173–18081 R. D. Lasco, 2002, ‘Forest carbon budgets in Southeast Asia following harvesting and land cover change’, Science in China Series C-Life
Sciences, 45, pp. 55–6482 Germer & Sauerborn 200883 IPCC [Intergovernmental Panel on Climate Change], 1997, Revised 1996 IPCC Guidelines for National Greenhouse Gas Inventories, Vol.
2 Workbook, IPCC, Geneva [accessed on xx November 2010 at http://www.ipcc.ch]84 Philip M. Fearnside, 2000, ‘Global warming and tropical land-use change: Greenhouse gas emissions from biomass burning, decomposition
and soils in forest conversion, shifting cultivation and secondary vegetation’, Climatic Change, 46(1-2), pp. 115–15885 IPCC 199786 T.M. Araújo, J.A. Carvalho, N. Higuchi, A.C.P. Brasil Jr, & A.L.A. Mesquita, 1999, ‘A tropical rainforest clearing experiment by biomass
burning in the state of Pará, Brazil’, Atmospheric Environment, 33(13), pp. 1991–199887 M.O. Andreae, 1991, ‘Biomass burning: Its history, use and distribution and impact on environmental quality and global climate’ in J.
S. Levine (ed.), 1991, Global biomass burning: Atmospheric, climatic and biospheric implications (pp. 3–21). MIT Press, Cambridge,MA, USA
88 Germer & Sauerborn 200889 J. M. Anderson & M.J. Swift, 1983, ‘Decomposition in tropical forests’, in S. L. Sutton, T. C. Whitmore, & A. C. Chadwick (eds.), 1983,
Tropical rain forest: ecology and management (pp. 287-309), Blackwell, Oxford, UK90 Jeffrey Q. Chambers, Niro Higuchi, Joshua P. Schimel, Leandro V. Ferreira, & John M. Melack, 2000, ‘Decomposition and carbon
cycling of dead trees in tropical forests of the central Amazon’, Oecologia, 122, pp. 380–388.

Grappling with Inordinate Uncertainty • 19
to assume that any biomass carbon, which is left aftercombustion, is emitted as CO2.91
Below-ground biomass in forests
In any tropical forest a significant part of the biomassis below the ground in the root systems of its flora. Theratio of the below- ground (BGB) to above-groundbiomass — the BGB-AGB ratio— varies considerably.This can be seen from the estimates of the BGB-AGBratio reported in the following sources:
• Brown: 0.03 to 0.82 for all tropical forests (based ona series of case studies); 92
• IPCC: 0.13 for tropical lowland forests;93
• Sanford and Cuevas: 0.14 for all tropical forests(based on a literature review);94
• Brown and Lugo: 0.17 for tropical moist forests and0.20 for tropical wet forests;95
• Whitmore: 0.20 to 0.25 for tropical forests in EastAsia;96 and
• Germer and Sauerborn: 0.18 for all tropical forests(a meta-analysis of 41 studies).97
Based on their estimate of the BGB-AGB ratio, Germerand Sauerborn have calculated the average BGBdensity for tropical lowland forests at 47 t per ha. Givenan estimation error of ± 26 t per ha — based on onestandard deviation — there is a 68 per cent chance thatthe BGB density for a given tropical lowland forest willbe somewhere between 21 t per ha and 73 t per ha.
The wide confidence interval underlines the veryconsiderable variation that exists with density
measurements at the local level due to differences in treespecies, soil, climate, and history of human intervention.
After the removal of the above-ground biomass, a smallproportion of the below-ground biomass decomposesrapidly but a large fraction tends to be resistant todecomposition.98 A study of converted pasture hasfound the remains of forest tree roots to a depth of 6 cmat least seven years after clearance.99 There is, however,little published research into the fate of the resistantroot fraction in the deeper soil profiles and the IPCCguidelines provide no guidance on this issue.100
Biomass in grasslands
The density of the biomass in grasslands is determinedby many factors. They include the composition of theplant species, precipitation patterns, soil properties,incidence of fire, and the wildlife populations that theysupport, directly or indirectly.101
The IPCC carbon accounting guidelines definesavannas as vegetation formations with apredominantly continuous grass cover and specifydefault AGB density values of between 4.9 t per ha and6.6 t per ha.102 In sharp contrast, the literature reportsa much wider range of AGB density estimates. They
There is, however, little published research into
the fate of the resistant root fraction in the
deeper soil profiles and the IPCC guidelines
provide no guidance on this issue.
91 IPCC 199792 Sandra Brown, 1997, Estimating Biomass and Biomass Change of Tropical Forests: A Primer, FAO Forestry Paper No. 134, FAO, Rome,
Italy [accessed on 17 December 2010 at http://www.fao.org/docrep/w4095e/w4095e00.htm] 93 IPCC 199794 J.R.L. Sanford & E. Cuevas, 1996, ‘Root growth and rhizosphere interactions in tropical forests’, in S.S. Mulkey, R.L. Chazdon, and A.P.
Smith (eds.), 1996, Tropical forest plant ecophysiology, Chapman and Hall, New York, NY, USA95 Brown & Lugo 198496 Whitmore 1984 97 Germer & Sauerborn 200898 A. J. Gijsman, H.F. Alarcón, & R. J. Thomas, 1997, ‘Root decomposition in tropical grasses and legumes, as affected by soil texture and
season’, Soil Biology & Biochemistry, 29(9-10), pp. 1443-145099 Felipe Garcìa-Oliva, Isabel Casar, Pedro Morales, & José M. Maass, 1994, ‘Forest-to-pasture conversion influences on soil organic carbon
dynamics in a tropical deciduous forest’, Oecologia, 99(3-4), pp. 392–396100 Germer & Sauerborn 2008101 Jayalaxshmi Mistry, 2000, ‘Savannas’, Progress in Physical Geography, 24(4), pp. 601–608.102 IPCC 1997
range from 2 t per ha for grass-dominated savannas onpoor sandy soils in Venezuela103 to over 25 t per ha forgrasslands with an increasing incidence of shrubs andtrees.104 105
In their literature review, Germer and Sauerborn haveidentified a total of eight studies of the Imperatagrasslands that dominate the regions that can grow oilpalm in South-East Asia.106 They report AGB densitiesof between 3.8 t per ha and 23 t per ha. Germer andSauerborn estimate an average AGB density of 11.2 tper ha for the eight studies, together with a 68 per centconfidence interval for the estimate from 3.9 to 18.5 tper ha.
In all likelihood, the large standard deviation reflectsnot only local environmental conditions but also thecontinuous loss of soil fertility that is known to occur infire-controlled grasslands. Magcale-Macandog hasestimated that the annual loss of biomass due to firereduces new leaf production in Imperata grasslands by47 per cent within 28 years.107
The IPCC carbon accounting guidelines do not providea default value for the BGB density of grasslandsgenerally, let alone those that are suitable forconversion to oil palm.
According to Germer and Sauerborn, moreover, fewstudies of BGB in grasslands of the humid tropics haveeven been published.108 The five studies that they haveidentified report dramatically different results for theAGB-BGB ratio in tropical grasslands. Their estimatedAGB-BGB ratios range from 0.7 — based on a global
estimate109 — to 3.1 — which was an estimate for theBrazilian cerrado (or scrub savannah).110 On the basisof these studies, Germer and Sauerborn estimated amean AGB-BGB ratio of 1.4 for grasslands suitable forconversion to oil palm.111
Soil organic carbon
It is important to recognize that soil is a livingecosystem that constitutes an important store oforganic carbon. While the humid tropics are known tostore a disproportionate share of all terrestrial carbon,the distribution of carbon within the relevantecosystems is poorly quantified, as are the rates atwhich they lose and acquire the carbon.112 113 Theseparameters are primarily determined by the type of thesoil so any approach to estimating them has todifferentiate between mineral and organic soils. Thelatter are found in tropical peat lands. Both types canbe suitable for growing oil palm commercially.
Jobbágy and Jackson have made the mostcomprehensive estimates of the carbon content oftropical soils. 114 They estimated that the organic carbonin the top three meters of the soil profile under tropicalevergreen forest is, on average, around 279 t C per ha,which is substantially more than is generally found inthe forest biomass, both above- and below-ground.
In line with earlier research in this area, Jobbágy andJackson found that the soil carbon declines rapidlywith the depth of the soil — see Table 3 for the details.They estimated that two-thirds of the soil carbon wasin the first meter of the profile, 19 per cent in the
20 • Grappling with Inordinate Uncertainty
103 L. Bulla, & J. Lourido, 1980, ‘Production, decomposition and diversity in three savannas of the Amazonas territory (Venezuela)’, in J.I.Furtado (ed.), 1980, Tropical Ecology and Development, Proceedings of the Fifth International Symposium on Tropical Ecology,International Society of Tropical Ecology, Kuala Lumpur, Malaysia, pp. 73–77
104 Elmar Andrade de Castro & J. Boone Kauffman, 1998, ‘Ecosystem structure in the Brazilian cerrado: A vegetation gradient of aboveground biomass, root mass and consumption by fire’, Journal of Tropical Ecology, 14, pp. 263–286.
105 R.J. Scholes & D.O. Hall, 1996, ‘The carbon budget of tropical savannas, woodlands and grasslands’, in A.I. Breymeyer, D.O. Hall, J.M.Melillo, & G.I. Ågren (eds.), Global change: Effects on coniferous forests and grasslands, Wiley, Chichester, UK, pp 69-100
106 Germer & Sauerborn 2008107 D.B. Magcale-Macandog, 2002, ‘Soil erosion and sustainability of different land uses of smallholder Imperata grasslands in SEA’ in J.
Juren, W. Lianxiang, W. Deyi, T. Xiaoning, & N. Jing (eds.), 12th International Soil Conservation Organization (ISCO) Conference:Sustainable utilization of global soil and water resources, Tsinghua University Press, Beijing, People’s Republic of China, pp. 306–312
108 Germer & Sauerborn 2008109 R.B. Jackson, J. Canadell, J.R Ehleringer, H.A. Mooney, O.E. Sala, & E.D. Schulze, 1996, ‘A global analysis of root distributions for
terrestrial biomes’, Oecologia, 108, pp. 389–411110 Fernside 2000111 Germer & Sauerborn 2008112 Giardina at al 2004113 R.A. Houghton, 2005, ‘Aboveground forest biomass and the global carbon balance’, Global Change Biology, 11(6), pp. 945–958114 Jobbágy & Jackson 2000

second meter, and 14 per cent in the third. They alsoconcluded that the relationship between theconcentration of soil organic carbon, on the one hand,and climate and soil texture, on the other, wasstatistically significant at the global level.
That said, there is a large amount of unexplainedvariation in the density of the soil carbon but it tootends to decline with soil depth.
In the case of native forestland on mineral soils in themoist to wet tropics, the IPCC has proposed defaultvalues of between 5 t C per ha and 180 t C per ha for thedensity of their organic soil carbon. These valuesexplicitly represent the soil carbon in the uppermost30 cm of the soil profile, depending on soil activity.115
After excluding those regions with extended dry periodsor sandy soils that are unsuitable for oil palm from theIPCC default values, the density of soil carbon undertropical forest, which is suitable for conversion to oilpalm, would range from 60 t C per ha to 180 t C perha.116 Again the most notable aspect of these estimatesis the extreme breadth of the 68 per cent confidence
interval. Its replacement by a 95 per cent chance of notbeing wrong, would widen the confidence interval toone from zero to 240 t C per ha — which represents anextraordinarily broad range.
In the case of organic soils — such as those associatedwith tropical peat lands — the amount of soil carbondepends on the depth of the organic layer in the soilprofile. In the extensive peat lands of South-east Asia,this organic layer can be several meters thick and isusually waterlogged.117 In this state, tropical peat landsare a natural source of methane emissions. InIndonesia and Malaysia, substantial areas of peat landhave been drained for conversion to oil palm. Drainageaccelerates the microbial oxidation of the peat, whichgenerates CO2 emissions.118
On the other hand, drainage reduces methane emissionsto the point where the soil eventually becomes a carbonsink.119 120 Where peat lands have been converted to oilpalm to date, however, the depth of the peat layer hasnot been well-established.121 This, in turn, means thatthe precise extent of the net emissions from conversionof peat lands has yet to be determined.
Grappling with Inordinate Uncertainty • 21
115 IPCC 1997 116 Germer & Sauerborn 2008117 S. Shimada, H. Takahashi, A. Haraguchi, & M. Kaneko, 2001, ‘The carbon content characteristics of tropical peats in Central
Kalimantan, Indonesia: Estimating their spatial variability in density’, Biogeochemistry, 53(3), pp. 249–267118 K. Inubushi, Y. Furukawa, A. Hadi, E. Purnomo, & H. Tsuruta, 2003, ‘Seasonal changes of CO2, CH4 and N2O fluxes in relation to land-use
change in tropical peat lands located in coastal area of South Kalimantan, Chemosphere, 52(3), pp. 603–608 119 Y. Furukawa, K. Inubushi, M. Ali, A. M. Itang, & H. Tsuruta, 2005, ‘Effect of changing groundwater levels caused by land-use changes
on greenhouse gas fluxes from tropical peat lands’, Nutrient Cycling in Agroecosystems, 71(1), pp.81–91120 A. Hadi, K. Inubushi, E. Purnomo, F. Razie, K. Yamakawa, & H. Tsuruta, 2000, ‘ Effect of landuse changes on nitrous oxide (N2O) emission
from tropical peat lands. Chemosphere: Global Change Science, 2(3), pp. 347–358121 Germer & Sauerborn 2008
Notes: (a) ± one standard deviation
Source: Jobbágy and Jackson 2000
Table 3Distribution of the Density of Organic Soil Carbon Over the Soil Profile of Tropical Evergreen Forest, Tonnes of Carbon Per Hectare
Depth of soil profile
Zero to one metre
One to two metres
Two to three metres
Zero to three metres
Global average
186
54
39
279
Lower estimate (a)
82
23
17
190
Upper estimate (a)
290
85
61
368

Key conclusions
There are significant gaps and quality problems withthe knowledge base and data that are available forestimating ‘carbon footprints’ from land-use change,particularly in the tropical regions of the world. Theseproblems are most severe for the estimation ofemissions from the conversion of tropical forest and
peat lands to agricultural crops.
Estimates of greenhouse gas emissions rely heavily ona sound understanding of the density of the biomassand the fate of its carbon when vegetation cover isremoved. The published research on this subject hasconcentrated on primary forest and permanentgrassland. Little has been conducted on secondaryforest or degraded forestland. What has beenconducted has highlighted the high degree of spatialand temporal variation that exists in such forest due todifferences in a wide range of local environmentalfactors.
This is highly significant for any assessment of the‘carbon footprint’ for palm oil. Most of the recent oilpalm development has been on tropical forest land,which has been extensively disturbed or degraded by acombination of fire, harvesting, and clearance forshifting cultivation. Most of the raw data that havebeen used to estimate forest biomass have beensourced from either small scale ecological studies orthe global forest resource database maintained by theFAO. There are serious problems with the data fromboth sources.
Data on forest biomass from ecological studies cannotbe extrapolated as the studies do not provide astatistically valid basis for making inferences about the
relevant forest populations. The sites studied wereneither randomly selected nor representative of theforest population in question. They were selected byecologists based on what they thought a forest shouldlook like, namely one with many large diameter trees;this leads to an overestimation of forest biomass.Moreover, the total forest area covered by such studiesis a vanishingly small sample of the forests in question.
To date the attempts to address these shortcomings bydirectly estimating forest biomass from timberinventories have not succeeded. There are few reliableinventories of tropical forests and ‘educated guesswork’has been used to fill the gaps. Their reliability is highlyquestionable.
This means that the published estimates of greenhousegas emissions from land use changes are subject of verylarge estimation errors and substantial uncertainty.The estimation errors former are due to an absence ofhigh quality data on land-use changes. The uncertaintyreflects our lack of understanding of the basic sciencethat underpins the terrestrial carbon cycle.
To illustrate the point, the published biomass estimatesimply that there is a 95 per cent probability that thebiomass density of tropical forest suitable forconversion to oil palm is somewhere between zero and600 tonnes of biomass per hectare. Given this, wereally have little idea of the implications of conversionfor greenhouse gas emissions. This means that a case-by-case evaluation of each hectare of land is necessaryto establish those implications with any accuracy.
22 • Grappling with Inordinate Uncertainty
Given this, we really have little idea of the
implications of conversion for greenhouse gas
emissions. This means that a case-by-case
evaluation of each hectare of land is necessary to
establish those implications with any accuracy.
V. C
ARB
ON
SEQ
UES
TERE
D B
Y O
IL P
ALM
Grappling with Inordinate Uncertainty • 23
V. Carbon Sequestered by Oil Palm
Following its establishment, a commercial oil palmplantation extracts a substantial amount of carbondioxide from the atmosphere and converts it tobiomass as the palms grow to maturity. The amount ofcarbon that is stored as biomass over the longer term asa result of this process depends on many factors. Theprimary ones are the size of the palms, the nature ofthe understory, and the frequency of replanting, whichcollectively determine the amount of biomassmaintained on the land over the longer term.
This chapter canvasses the scientific basis forestimating the carbon that is sequestered as biomassin commercial oil palm plantations. For this purposeit draws heavily on a literature review by Germer andSauerborn.122
Above-ground biomass
The estimates of the above-ground biomass (AGB) inmature oil palm plantations, which have beenpublished in the literature to date, range between50 t per ha and 100 t per ha.123 Most of these estimateshave been made for oil palms of a given age, ratherthan for those with specific physical characteristics,such as their actual and maximum trunk height.Moreover, the commercially optimal time forreplanting depends more on the height, diameter, andhealth of the oil palms than on their age.
Most of the published references on the extent of thebiomass in a commercial oil palm plantation do notspecify the planting density of the palms or the natureof the local environment, both of which significantlyinfluence the physical characteristics of the palms atmaturity and the time taken to reach that state.124 They
also contain inherent errors due to the lack ofstandardized methods for the collection of the fielddata on which they rely. While some researchers haveincluded the plantation understory in their estimates,others have considered only the oil palms and some ofthe latter also excluded the biomass in the productiveorgans of the palms in question.
The most important issue, however, is that the relevantreferences are not always clear whether their biomassestimate includes the leaf bases on the trunk of the oilpalms.125 There is also the question of accounting forthe biomass in the ground cover and the on-groundplant litter; this issue is addressed in section 5.3 laterin this chapter.
Typically the rate of biomass formation in a tree crop,such as oil palm, is highest immediately after plantingbut it progressively slows as the palms approachmaturity.126 For carbon accounting purposes, the IPCChas proposed a linear equation should be used toestimate the growth in forest biomass over time.127
In the case of commercial oil palm plantations,however, the IPCC approach has been shown to bebiased. It consistently underestimates the relevantbiomass by a substantial margin. Based on data fromthe destructive sampling of oil palms aged between 3and 25 years in plantations in Sumatra and EastKalimantan, Syahrinudin has specified and estimatedan exponential equation to represent the growth of oilpalm biomass over time.128 Compared to his equation,the linear approach that has been proposed by the IPCCunderestimates oil palm biomass by around 23per cent,when averaged over the commercial life of the palms.129
Germer and Sauerborn have undertaken a meta-analysis of the published studies of the biomass density
122 Germer & Sauerborn 2008123 Germer & Sauerborn 2008124 J. Germer & J. Sauerborn, 2004, ‘Solar radiation below the oil palm (Elaeis guineensis Jacq.) canopy and its impact on the undergrowth
species composition’, The Planter, 80(934), pp. 13–27; Henson, 1998; Henson & Dolmat, 2003125 Corley and Tinker, 2003126 Pedro A. Sanchez, 2000, ‘Linking climate change research with food security and poverty reduction in the tropics’, Agriculture,
Ecosystems and Environment, 82(1-3), pp. 371–383127 IPCC [Intergovernmental Panel on Climate Change], 2003, Good Practice Guidance for Land Use, Land-use Change and Forestry,
Institute for Global Environmental Strategies, Hayama, Japan [accessed on 28 January 2011 at http://www.ipcc-nggip.iges.or.jp/public/gpglulucf/gpglulucf.htm]
128 Syahrinudin, 2005, ‘The potential of oil palm and forest plantations for carbon sequestration on degraded land in Indonesia’, Ecologyand Development Series, No. 28, Zentrum für Entwicklungsforschung [Center for Development Research], University of Bonn, Bonn,Germany
129 Germer & Sauerborn 2008

of oil palm plantations. It was based on their review of11 studies involving samples from a total of51 plantations. From their analysis they estimated thatthe AGB density of oil palm was 60 t per ha, whenaveraged over the 25-year life of the palms. Theestimation error of one standard deviation gives a 68per cent confidence interval for their estimate, from 40t per ha to 80 t per ha.130 The 95 per cent confidenceinterval is from 20 t per ha to 100 t per ha.
Below-ground biomass
In oil palm plantations the density of the below-groundbiomass (BGB) generally increases in line with that forAGB, at least up to some limit. While this limit isstrongly influenced by the characteristics of the soiland the availability of moisture, most of the BGB isconcentrated in the upper four centimeters of the soilprofile.131 In less favorable environments, however, asignificant proportion of the root system may be foundat much greater depths.132
There are very wide variations in the publishedestimates of the BGB density for particular oil palmplantations, as the following make clear:
• Fairhurst estimated 7 t per ha of biomass in the top40 cm of the soil profile under 13-year-old palms inWest Sumatra;133
• Khalid, Zin, and Anderson found 16 t per ha in thetop 60 centimeters of the soil profile under 23-year-old palms in West Malaysia;134 and
• Braconnier and Caliman calculated 59 t per ha forthe top 6 meters of the soil profile under 16-year-oldpalms on degraded and highly leached soil in WestAfrica.135
The combination of the discrepancies in the depth ofthe soil profiles studied and the methods that wereused to measure the BGB call into question theaccuracy of estimating growth functions for oil palmbased on either palm age or AGB. Two recent studieshave estimated linear equations for the growth of oilpalm BGB based on its AGB.136 137 While bothexplained a high proportion of the observed variationin the BGB of adult oil palms over time, theyoverestimated the root biomass in the younger plants.
After reviewing the relevant literature, Germer andSauerborn have concluded that the time-averaged BGBdensity in oil palm plantations was 20 t her ha. Anestimation error of one standard deviation gives the 68per cent confidence interval for this estimate — whichis from 15 t per ha to 25 t per ha. The 95 per centconfidence interval is from 10 t per ha to 30 t per ha.
Ground cover & plant litter
In commercial oil palm plantations it is commonpractice to establish a ground cover to prevent soilerosion, control weeds, minimize the leaching ofnutrients, and enrich the organic content of the soil.The latter improves soil structure leading to betteraeration, and infiltration and retention of moisture.Legumes are generally essential as ground cover in oilpalm plantations; 138 they fix nitrogen in the soilthereby making it available for the palms and also helpto build up the concentration of soil organic carbonmolecules (complex compounds of carbon, nitrogen,sulphur, and phosphorus).
The amount of biomass in the ground cover vegetationcultivated in an oil palm plantation tends to decreaseas the oil palms grow to maturity and provideprogressively more shade to the vegetation in the
24 • Grappling with Inordinate Uncertainty
130 Germer & Sauerborn 2008131 Christophe Jourdan and Hevré Rey, 1997, ‘Modelling and simulation of the architecture and development of the oil-palm (Elaeis
guineensis Jacq.) root system’, Plant and Soil, 190(2), pp. 235–246 132 Germer & Sauerborn 2008133 T. Fairhurst, 1996, ‘Management of nutrients for efficient use in smallholder oil palm plantations’, PhD Thesis, Department of Biology,
Imperial College at Wye, University of London, Wye, Ashford UK134 H. Khalid, Z.Z. Zin, & J.M. Anderson, 2000,’Decomposition processes and nutrient release patterns of oil palm residues’, Journal of Oil
Palm Research, 12(1), pp. 46–63135 S. Braconnier & J.-P. Caliman, 1989, ‘Premiers résultats concernant l’étude du systéme racinaire du palmier a` huile en sol dégradé’,
Rapport Interne, L’Institut de recherches pour les huiles et oléagineux, Paris, France136 Ian E. Henson & Mohd T. Dolmat, 2003, ‘Physiological analysis of an oil palm density trial on a peat soil’, Journal of Oil Palm Research,
15(2), pp. 1–27137 Syahrinudin 2005138 C.W.S. Hartley, 1977, The Oil Palm, West African Institute for Oil Palm Research, Longman, London & New York, NY

understory. The amount of biomass also varies with thephysical characteristics of the species that is selectedfor the ground cover, as well as the proportion of deadplant matter — or necromass in the technical jargon —that accumulates on the ground with the living groundcover. Necromass alone can account for more than halfof all the biomass that is on or above the ground.
The following results from the published literaturegives an idea of the substantial variation that has beenobserved in the field to date on the density of the on-ground biomass in oil palm plantations:
• Ross calculated the on-ground biomass to bebetween 8.6 t per ha and 9.3 t per ha. His data werebased on fully established ground cover dominatedby Pueraria phaseoloides Benth. Some 27 per cent ofthe biomass in question was dry matter.139
• Khalid, Zakaria, and Anderson estimated there was11.4 t per ha in the biomass of the ground coverunder 18-month-old oil palms. Of this 56 per centwas dry matter.140
• Ezenwa, Aribisala and Aken’ova found theunderstory accounted for about four tonnes per haof biomass under light shade in a 35-year-oldplantation.141
• In contrast, Parrotta calculated that the on-groundbiomass to be less than one tonne per ha under aclosed canopy of oil palm.142
Assuming a ground cover with a maximum AGB of 10t per ha and a minimum of 1 t per ha — at canopyclosure five years after planting — together with alinear loss of ground cover biomass due to theincreasing shade from growing oil palms over theintervening period, Germer and Sauerborn haveestimated an average biomass density of 2.5 t per hafor the ground cover over the commercial life of the oilpalms.143 The absolute error for their estimate — based
on one standard deviation — is relatively large at ± 1.0t per ha. In other words, the 68 per cent confidenceinterval for their estimate ranges from 1.5 t per ha to3.5 t per ha, while the 95 per cent confidence interval isfrom 0.5 t per ha to 4.0 t per ha.
Key conclusions
As with the emissions from conversion of primary orsecondary forest, there are significant gaps and qualityproblems with the knowledge base and the data that areavailable for estimating the greenhouse gas removals byoil palm grown on the commercial plantations thathave replaced such forest. The problems, however, arenot as severe as in the former case.
As with the conversion emissions, estimation ofgreenhouse gas removals rely heavily on a soundunderstanding of the density of the biomass of oil palmon commercial plantations and the fate of its carbonwhen the palms are replanted or replaced at the end oftheir commercial life. The published research on thissubject is relatively sparse compared to the knownvariation in biomass density due to differences in itsgrowing environment related to factors such as the ageof palms, soil type, amount and distribution of annualrainfall, temperature, nature of ground cover,agronomic and harvesting practices, etc. These factorsare significant for any assessment of annual removalsof greenhouse gases.
As a consequence, the published estimates ofgreenhouse gas removals by commercial oil palmplantations are subject to relatively large estimationerrors. The published biomass estimates imply thatthere is a 95 per cent probability that the biomassdensity of commercial oil palm is somewhere between30.5 t per ha and 134 t per ha. In other words, theupper endpoint of the range is more than four times itslower endpoint.
Grappling with Inordinate Uncertainty • 25
139 M. Ross, 1999, Auswirkungen verschiedener Rodeverfahren und des Unterbewuchses auf Bodenfruchtbarkeit, Bodenwasserhaushalt,Erosion, und Bestandsentwicklung eines lpalmenbestandes, Shaker Verlag, Aachen, Germany
140 Khalid Haron, Zin Z. Zakaria, & J.M. Anderson, 2000, ‘Nutrient cycling in an oil palm plantation: The effects of residue managementpractices during replanting on dry matter and nutrient uptake of young palms’, Journal of Oil Palm Research, 12(2), pp. 29-37
141 Ike Ezenwa, Oluwatoyin A. Aribisala, & M.E. Aken’ova, 1996, ‘Research note: Dry matter yields of Panicum and Brachiaria with nitrogenfertilisation or Pueraria in an oil palm plantation, Tropical Grasslands, 30, pp. 414–417
142 John A. Parrotta, 1992, ‘The role of plantation forests in rehabilitating degraded tropical ecosystems’, Agriculture, Ecology andEcosystems, 41, pp. 115–133
143 Germer & Sauerborn 2008

26 • Grappling with Inordinate Uncertainty
144 Tokyo Electric Power Environmental Engineering Co. Inc.,2009, Feasibility Study Report Palm Oil Effluent (POME) Treatment Co-benefitsCDM Project (Summary), GEC CDM/JI Support Programme commissioned by the Ministry of the Environment, Japan [accessed on 8December 2010 at: http://gec.jp/gec/en/Activities/cdm-fs/2008/200812TEE_eMalaysia_rep.pdf ]
145 Mohd Basri Wahid, Chan Kook Weng, Choo Yuen May, & Chow Mee Chin, 2006, ‘The Need to Reduce National Greenhouse Emissions:Oil Palm Industry’s Role’, Journal of Oil Palm Research, Special Issue , April, pp. 1-23
146 Shahrakbah Yacob, Mohd Ali Hassan, Yoshihito Shiraia, Minato Wakisakaa, & Sunderaj Subash, 2005, ‘Baseline study of methane emissionfrom open digesting tanks of palm oil mill effluent treatment’, Chemosphere, 59(11), pp. 1,575-1,581
147 Ma A.N., Choo, Y.M., Toh Chua, N.S., 1999, ‘Renewable energy from palm oil industry’, in G. Singh, L.K. Huan, T. Leng, and D.L. Kow(eds.), 1999, Oil Palm and the Environment: A Malaysian Perspective, Malaysian Oil Palm Growers’ Council, Kuala Lumpur, Malaysia
148 Yacob et al 2005149 Foo-Yuen Ng, Foong-Kheong Yew, Yusof Basiron, Kalyana Sundram, 2011, ‘A Renewable Future Driven with Malaysian Palm Oil-based
Green Technology’, Journal of Oil Palm & The Environment, 2, pp.1-7, doi:10.5366/jope.2011.01
VI. Emissions from Oil Palm PlantationOperations
The commercial operation of an oil palm plantationgenerally involves the initial establishment andsubsequent maintenance of the estate and its mill,harvesting fresh fruit bunches (FFBs), and processingthem to extract crude palm oil and palm kernel oil.Greenhouse gas emissions are mostly produced by thewastewater from the processing mill, the fertilizers andpesticides that are used on the plantation to maximizefruit yields, and the energy used to power the vehicles,plant and equipment on the plantation estate and inthe processing mill.
Palm Oil Mill Effluent
Palm Oil Mill Effluent (POME) is produced as FFBsare processed to extract their oils — crude palm oil andpalm kernel oil. Each tonne of FFB that is processedgenerates about 0.5 to 0.7 tonnes of wastewater.144 145 146
As POME contains organic materials, it has to betreated prior to disposal. The conventional treatment isanaerobic digestion by bacteria in enclosed ponds orlagoons, followed by extended aeration. Open digestion
VI. EM
ISSION
S FROM
OIL PA
LM
PLAN
TATION
OPERATIO
NS
tanks are used occasionally, when available land islimited. Other treatment methods are less commonbut include membrane treatment, evaporation, andsolidification to separate the waste.
POME produces a biogas, which is a mixture ofmethane (CH4) and CO2 with traces of hydrogendisulphide (H2S). Laboratory experiments havesuggested that methane makes up around 65 per centof POME biogas under completely anaerobicconditions, although this is generally significantlyhigher than the small number of measurements thathave been taken in a commercial production setting.147
On that basis, POME biogas represents the largestsingle source of greenhouse gas emissions from thecommercial production of crude palm oil, excludingany emissions from land-use conversion prior to theestablishment of the plantation in question. At present,however, data remains unavailable on the total amountof greenhouse gas emissions from the actual wastetreatment system used in production of palm oil incountries such as Malaysia.148
In terms of the IPCC’s Global Warming Potentialindex, a tonne of methane makes a significantly greatercontribution to the greenhouse effect than a tonne ofCO2. Hence the composition of POME biogas and theeffectiveness of the treatment of that biogas by theprocessing mill are critical to any assessment of thetotal emissions contribution from this source.Moreover there is considerable scope to capture themethane in POME and to use it to generate electricitythat could, among other things, power the processingmill; the required technology is already available anddemonstration projects are being undertaken toadvance its commercialization.149
Under commercial operating conditions, the methaneconcentration of POME varies significantly. It varies
On that basis, POME biogas represents the
largest single source of greenhouse gas emissions
from the commercial production of crude
palm oil, excluding any emissions from land-use
conversion prior to the establishment of the
plantation in question.

Grappling with Inordinate Uncertainty • 27
150 Yoshihito Shirai, Minato Wakisaka, Shahrakbah Yacob, Mohd Ali Hassan, & Shin’ichi Suzuki, 2003, ‘Reduction of Methane Releasedfrom Palm Oil Mill Lagoon in Malaysia and Its Countermeasures’, Mitigation and Adaption Strategies for Global Change, 8(3), pp. 237-252
151 Yacob et al 2005152 Shahrakbah Yacob, Mohd Ali Hassan, Yoshihito Shiraia, Minato Wakisakaa, & Sunderaj Subash, 2006, ‘Baseline study of methane emission
from anaerobic ponds of palm oil mill effluent treatment’, Science of the Total Environment, 366(1), pp 187-196.153 FELDA is the Federal Land Development Authority of Malaysia and is responsible for resettling the rural poor into newly developed
areas. In doing so it has focused on the development of smallholder farms to grow cash crops, such as palm oil. It is now the largest palmoil processor in Malaysia (Yacob et al 2005).
154 Shirai et al 2003155 Yacob et al 2005156 Yacob et al 2006157 Yacob et al 2006
with differences in the method of treatment,differences in the sites using the same treatmentmethod, and seasonal differences in operatingconditions at the treatment site.
There are, however, only a few primary studies thathave directly measured such variations at a commercialscale of mill operation. 150 151 152 While there are a greatmany more articles in the literature that have soughtto estimate the extent of the methane emissions fromthe treatment of POME, all of them rely on the resultsof the few primary sources that have been reportedhere for their raw data .
Shirai and his colleagues have measured the methaneconcentration in the biogas produced by opendigesting tank and lagoon systems at two FELDA palmoil mills — Serting Mill and Serting Hilir Mill — in thestate of Negri Sembilan in Malaysia.153 They found thatthe methane concentrations averaged 35 percent forthe open digesting tanks and 45 per cent for the closedlagoon system.154
Shirai and his colleagues noted differences betweentheir results and those obtained in the laboratory byMa et al (1999). They concluded that they were likelyto be due to differences in the operating conditionsunder which the two studies were conducted. Theyfound differences of over 130 percent in the rate ofbiogas emissions from treatment tanks using the sametechnology.
Yacob and his colleagues have analyzed POME biogassamples from two open digestion tanks at the FELDASerting Hilir Palm Oil Mill in Malaysia for each weekof a 52-week period.155 Their measured methaneconcentrations ranged from 13.5 to 49 percent byweight. They concluded that the fluctuations in biogasproduction that they had observed were the result of a
number of factors. These factors included seasonalcropping of the fruit, operational conditions at the mill,and variations in the quality and quantity of theeffluent that was discharged from the mill.
The same authors conducted a similar study of twoclosed (anaerobic) ponds at the same site over anequivalent period in the following year. In this case,they found that the methane concentration of thePOME biogas averaged 54.4 percent by weight.156 Thiswas significantly higher than the average result formethane in the open digestion tanks from their earlierstudy. The individual readings from the closed ponds— which ranged from 35 to 70 percent — were alsohigher than those from open tanks.
Yacob and his colleagues concluded that closed pondswere more efficient than open digesting tanks fortreating POME and that two main factors affectingmethane emissions were operational conditions at themill and seasonal variations in the cropping of thefruit.157
Emissions from fertilizer & pesticide use
Greenhouse gases are emitted whenever fertilizers andpesticides are used on commercial oil palmplantations. The commonly used fertilizers includeurea or ammonia nitrate, phosphate, potash andmagnesium, although a better alternative may be touse legumes as ground cover in combination withsmaller amounts of chemical fertilizers.
The major greenh ouse gas emissions are nitrous oxide(N2O). Although emissions also occur when fertilizersand pesticides are produced and transported to theplantations, these emissions are much smaller inquantity than those from the use of those products.

28 • Grappling with Inordinate Uncertainty
The emissions from fertilizer and pesticide use aregenerally measured in the following way. The firstinvolves estimating the rate of usage of each chemical.The results are then multiplied by an estimate of theaverage greenhouse gas emission intensity factor for theuse of the input in question. However, the methodologybehind the two sets of estimates is not alwaystransparent and there is considerable uncertainty aboutthe extent of estimation errors in each case. All of thissuggests that there is considerable scope for relativelystraightforward research to advance our relativelymeager understanding of these issues.
Following an extensive review of the relevant literatureon this subject, the Brinkman Consultancy concludedthat the emissions intensity associated with fertilizerand pesticide use in oil palm plantations was between1.0 and 1.5 t CO2e per ha.158 Their conclusion largelysupported the estimates that have been made byNikander (1, 086 kg CO2e per ha)159 and by Wijbransand van Zutphen (1,409 kg CO2e per ha).160
Many of the published studies, such as that byNikander, have relied on the default emission intensityvalues for various emission sources proposed by theUK Renewable Fuels Authority (RFA) as part of theUK Government’s obligations under the EuropeanUnion (EU) Directive 2009/28/EC on renewablefuels.161 These default values include emission intensityfactors in relation to fertilizer and pesticide use.
Emissions from energy use
Diesel distillate is used to power the vehicles, plant andmachinery that are used on oil palm plantations in the
cultivation of the palms and the processing of the fruit.
Despite a large number of studies into fuel use in thetransport sector, there are very few original studies thatdirectly estimate fuel use on commercial oil palmplantations. The studies that have been undertakenhave mostly sought to measure emissions from the oilpalm sector and have been based on estimates of dieseluse per hectare and of emissions intensity of fuel usemade by other authors. As such, the differences in theestimates are generally based on assumptions about theaverage distance travelled, fuel usage, etc.
Based on its extensive review of the relevant literature,The Brinkman Consultancy has concluded that thegreenhouse gas emissions from diesel use in vehicles,plant and equipment on oil palm plantations totaledsomewhere between 180 and 404 kg CO2e per ha.162
Its conclusion was largely based on the findings ofthree published studies.163 164 165 The estimates made bythese studies, however, are relatively crude.
Wood and Corley have estimated that diesel usage bythe oil palm sector generates 404 kg CO2e perhectare.166 This estimate was based on the default valueof 0.086 kg CO2e per MJ of diesel consumed by thepalm oil sector, which has been proposed by the (RFA)for the implementation of the EU Directive onrenewable fuels.167
Damen and Faaij estimated diesel consumption in theoil palm sector at 1.8 MJ per tonne-kilometer.168 Whilethe data used were from personal sources andaccordingly cannot be verified, the results wereconsistent with those of the RFA169 and Nikander170
158 Brinkmann Consultancy 2009159 Sami Nikander, 2008, Greenhouse gas and energy intensity of product chain: case transport biofuel, Master of Science in Engineering
Thesis, Helsinki University of Technology, Helsinki, Finland, 9 May160 Rokus Wijbrans and Hans van Zutphen, 2005, Environmental impact study for combustion of fatty acid distillate in a power plant,
Zwolle, The Netherlands, May161 UK Renewable Fuels Agency, 2008, Carbon and sustainability reporting within the Renewable Transport Fuel Obligation: Technical
guidance, Parts 1 & 2, Office of the Renewable Fuels Agency, London, UK, January 162 Brinkmann Consultancy 2009163 B.J. Wood & R.H.V. Corley, 1993, ‘The energy balance of oil palm cultivation’ in Proceedings of the 1991 PORIM International Palm oil
Conference – Agriculture, Palm Oil Research Institute of Malaysia, Kuala Lumpur, Malaysia, pp 130-143164 Kay Damen & André Faaij, 2007, Greenhouse Gas Balances of Biomass Import Chains for ‘Green’ Electricity Production in The
Netherlands, IEA Bio-energy Task 38, International Energy Agency, Paris, France 165 Nikander 2008166 Wood & Corley 1993167 RFA 2008168 Damen & Faaij 2007169 RFA 2008170 Nikander 2008

Grappling with Inordinate Uncertainty • 29
(discussed below). Based on an average distancetravelled of between one and ten kilometers, Damenand Faaij put the emission intensity of the sector at 36kg CO2e per hectare. They were, however, primarilyconcerned with biomass imports for electricitygeneration.
Nikander estimated emissions at 267 kg per ha, madeup of 50.2kg CO2e per ha from the vehicles used on oilpalm plantations and 217 kg CO2e per ha from theirplant and equipment.171 His estimate was based on thedefault values published by the RFA. These values werebased on RFA estimates that the average distancetravelled from oil palm plantation to mill was 17kilometers and the average yield was 19 tonnes of FFBper hectare. The RFA proposes default values for theemission intensity of diesel use of 0.086 kg CO2e perMJ and for the fuel efficiency of trucks in Asia of 1.8MJ per tonne-kilometer. The RFA default values are aquestionable foundation on which to base emissionestimates and they therefore need to be confirmed byfurther research.
Key conclusions
Greenhouse gas emissions are produced at every stageof the process of growing and cultivating oil palms,harvesting their fruit, and processing that fruit toextract its oils. In comparison to the potentialemissions from forest conversion or their sequestrationas biomass in oil palm as they grow to maturity, theseon-plantation sources collectively account for relativelysmall quantities of greenhouse gas emissions.
The most notable emissions sources are palm oil milleffluent (POME) together with agrochemical andenergy use. POME is by far the most significant ofthese as mill wastewater tends to be rich in dissolvedmethane and carbon dioxide, both of which arereleased to the atmosphere as the wastewater istreated. The quantity of greenhouse gas emissionsvaries considerably over the year, with the treatmenttechnology used and the operating practices of the mill.
171 Nikander 2008

30 • Grappling with Inordinate Uncertainty
References
IPCC [Intergovernmental Panel on Climate Change], 2007, Climate Change 2007: The Physical Science Basis, in IPCC,2007a, Fourth Assessment Report of the Intergovernmental Panel on Climate Change, Cambridge University Press,Cambridge UK & New York, NY
ISO [International Standards Organization] 14040:2006 Environmental Management – Life Cycle Assessment – Principlesand Framework
ISO 14044:2006 Environmental Management – Life Cycle Assessment – Requirements and Guidelines
Ruth S. DeFries, Richard A. Houghton, Matthew C. Hansen, Christopher B. Field, David Skole, & John Townshend, 2002,‘Carbon emissions from tropical deforestation and regrowth based on satellite observations for the 1980s and 1990s’,Proceedings of the National Academy of Sciences, 99(22)
R.A. Houghton, 2003, ‘Revised estimates of the annual net flux of carbon to the atmosphere from changes in land use andland management 1850-2000’, Tellus, 55B(2)
R.A. Houghton, J.E. Hobbie, J.M. Melillo, B. Moore, B.J. Peterson, G.R. Shaver, & G.M. Woodwell, 1983, ‘Changes in thecarbon content of terrestrial biota and soils between 1860 and 1980: A net release of CO2 to the atmosphere’, EcologicalMonographs, 53
Richard A. Houghton & Joseph L. Hackler, 1995, Continental scale estimates of the biotic carbon flux from land coverchange: 1850–1980, ORNL/CDIAC-79, NDP-050, Oak Ridge National Laboratory, Oak Ridge, TN
P.A. Agbu & M.E. James, 1994, The NOAA/NASA Pathfinder AVHRR Land Data Set User’s Manual, Goddard DistributedActive Archive Centre, Greenbelt, MD
FAO [Food & Agriculture Organization of the United Nations], 2000, ‘Assessing state and change in global forest cover:2000 and beyond’, Forest Resources Assessment Programme Working Paper, Working Paper 31, FAO, Rome
FAO [Food and Agriculture Organization of the United Nations], 2001, Global forest resources assessment 2000: Mainreport, FAO Forestry Paper No 140, FAO, Rome, Italy
Energy Directorate-General [of the European Commission], 2010, ‘The Impact of Land Use Change On Greenhouse GasEmissions from Biofuels and Bioliquids: Literature Review’, An in-house review by the Energy Directorate-General for theEuropean Commission’s analytical work on indirect land use change, Brussels, July
R.A. Houghton, undated, ‘Data Note: Emissions (and Sinks) of Carbon from Land-Use Change’, Mimeo, The Woods HoleResearch Centre, Falmouth, MA [accessed on 14 December 2010 at http://www.earthtrends.wri.org/downloads/DN-LUCF.pdf]
Frédéric Achard, Hugh D. Eva, Philippe Mayaux, Hans-Jürgen Stibig, & Alan Belward, 2004, ‘Improved estimates of netcarbon emissions from land cover change in the tropics for the 1990s’, Global Biogeochemical Cycles, 18, GB2008,doi:10.1029/2003GB002142
Nancy L. Harris, Sassan S. Saatchi, Stephen Hagen, Sandra Brown, Willian Salas, Matthew C. Hansen, & Alexander Lotsch,2009, ‘New Estimate of Carbon Emissions from Land-Use Change’, Forest Day 2010 Poster, Winrock International &Applied GeoSolutions LLC, Arlington VA & Durham NC [accessed on 30 May 2010 athttp://www.winrock.org/Ecosystems/files/Winrock%20-%20New%20Estimate%20of%20Carbon%20Emission%20from%20Land%20Use%20Change%20-%20Forest%20Day%20Poster%202010.pdf]
REFERENCES
Grappling with Inordinate Uncertainty • 31
World Bank, 2009, World Development Report 2010: Development and Climate Change, World Bank, Washington, DC
W.M. Post & K.C. Kwon, 2000, ‘Soil Carbon Sequestration and Land-Use Change: Processes and Potential’, Global ChangeBiology, 6,
Estaban G. Jobbágy & Robert B. Jackson, 2000, ‘The vertical distribution of soil organic carbon and its relation to climateand vegetation’, Ecological Applications, 10(2)
Willam H. Schlesinger & John Lichter,2001, ‘Limited carbon storage in soil and litter of experimental forest plots underincreased atmospheric CO2, Nature, 411
Christian P. Giardina, Dan Binkley, Michael G. Ryan, James H. Fownes, & Randy S. Senock, 2004, ‘Belowground carboncycling in a humid tropical forest decreases with fertilization’, Oecologia, 139(4)
N.H. Batjes, 1996, ‘Total carbon and nitrogen in the soils of the world’, European Journal of Soil Science, 47
Anwar Ghani, Alex Mackay, Brent Clothier, Denis Curtin, & Graham Sparling, 2009, A literature review of soil carbon underpasture, horticulture and arable land uses, Report prepared for AGMARDT [the New Zealand Agricultural and MarketingResearch and Development Trust], AgResearch Limited, Hamilton, New Zealand, October
H. Jenny, 1941, Factors of Soil Formation. McGraw-Hill, New York
E.A. Davidson & I.L. Ackerman, 1993, ‘Changes in soil carbon inventories following cultivation of previously untilled soils’,Biogeochemistry, 20
L. K. Mann, 1986, ‘Changes in soil carbon after cultivation’, Soil Science, 142
W.H. Schlesinger, 1985, ‘Changes in soil carbon storage and associated properties with disturbance and recovery’, in J. R.Trabalka and D .E. Reichle (eds.), 1985, The Changing Carbon Cycle: A Global Analysis, Springer-Verlag, New York, NY
W.M. Post & L.K. Mann, 1990, ‘Changes in soil organic carbon and nitrogen as a result of cultivation’, in A. F. Bouwman(ed.), 1990, Soils and the Greenhouse Effect, pp. 401-406, John Wiley & Sons, New York, NY.
William H. Schlesinger, 1990, ‘Evidence from chronosequence studies for a low carbon-storage potential of soils’, Nature, 348
Brinkmann Consultancy, 2009, Greenhouse Gas Emissions from Palm Oil Production: Literature review and proposals fromRSPO [Roundtable on Sustainable Palm Oil] Working Group on Greenhouse Gases, Brinkmann Consultancy, Hoevelaken,The Netherlands, 9 October
David E. Reichle (ed.), 1981, Dynamic properties of forest ecosystems, International Biological Programme Synthesis SeriesNo. 23, Cambridge University Press, UK
S. Brown & A.E. Lugo, 1982, ‘The storage and production of organic matter in tropical forests and their role in the globalcarbon cycle’, Biotropica, 14
S. Brown & A.E. Lugo, 1992, ‘Above ground biomass estimates for tropical moist forests of the Brazilian Amazon, Interciencia, 17
S. Brown, A.J.R. Gillespie, & A.E. Lugo, 1989, ‘Biomass estimation methods for tropical forests with applications to forestinventory data’, Forest Science, 35
S. Brown & A.E. Lugo, 1984, ‘Biomass of tropical forests: A new estimate based on forest volumes, Science, 223

32 • Grappling with Inordinate Uncertainty
FAO[Food and Agriculture Organization of the United Nations], 1993, Forest resources assessment 1990: Tropicalcountries, FAO Forestry Paper No 112, FAO, Rome, Italy
Sandra Brown, Louis R. Iverson, & Anantha Prasad, 2001, Geographical Distribution of Biomass Carbon in TropicalSoutheast Asian Forests: A Database, ORNL/CDIAC-119, NDP-068, Carbon Dioxide Information Analysis Centre OakRidge National Laboratory, Oak Ridge, TN, USA
Sandra Brown, Louis R. Iverson, Anantha Prasad, & Dawning Liu, 1993, ‘Geographical distributions of carbon in biomassand soils of tropical Asian forests’, Geocarto International, 4
J. Germer & J. Sauerborn, 2008, ‘Estimation of the impact of oil palm plantation establishment on greenhouse gas balance’,Environment, Development and Sustainability, 10
John Proctor, J.M. Anderson, S.C.L. Fogden, & H.W. Vallack, 1983, ‘Ecological studies in four contrasting lowland rainforestsin Gunung Mulu National Park, Sarawak: II Litterfall, litter standing crop and preliminary observations on herbivory’,Journal of Ecology, 71
S. Brown & A.E. Lugo, 1982, ‘The storage and production of organic matter in tropical forest and their role in the globalcarbon cycle’, Biotropica, 14
T.C. Whitmore, 1984, Tropical rain forest of the Far East, Clarendon Press, Oxford, UK
W. F. Laurance, S. G. Laurance, & P. Delamonica, 1998, ‘Tropical forest fragmentation and greenhouse gas emissions, ForestEcology and Management, 110
R. D. Lasco, 2002, ‘Forest carbon budgets in Southeast Asia following harvesting and land cover change’, Science in ChinaSeries C-Life Sciences, 45
IPCC [Intergovernmental Panel on Climate Change], 1997, Revised 1996 IPCC Guidelines for National Greenhouse GasInventories, Vol. 2 Workbook, IPCC, Geneva [accessed on xx November 2010 at http://www.ipcc.ch]
Philip M. Fearnside, 2000, ‘Global warming and tropical land-use change: Greenhouse gas emissions from biomass burning,decomposition and soils in forest conversion, shifting cultivation and secondary vegetation’, Climatic Change, 46(1-2)
T.M. Araújo, J.A. Carvalho, N. Higuchi, A.C.P. Brasil Jr, & A.L.A. Mesquita, 1999, ‘A tropical rainforest clearing experimentby biomass burning in the state of Pará, Brazil’, Atmospheric Environment, 33(13)
M.O. Andreae, 1991, ‘Biomass burning: Its history, use and distribution and impact on environmental quality and globalclimate’ in J. S. Levine (ed.), 1991, Global biomass burning: Atmospheric, climatic and biospheric implications (pp. 3–21).MIT Press, Cambridge, MA, USA
J. M. Anderson & M.J. Swift, 1983, ‘Decomposition in tropical forests’, in S. L. Sutton, T. C. Whitmore, & A. C. Chadwick(eds.), 1983, Tropical rain forest: ecology and management (pp. 287-309), Blackwell, Oxford, UK
Jeffrey Q. Chambers, Niro Higuchi, Joshua P. Schimel, Leandro V. Ferreira, & John M. Melack, 2000, ‘Decomposition andcarbon cycling of dead trees in tropical forests of the central Amazon’, Oecologia, 122
Sandra Brown, 1997, Estimating Biomass and Biomass Change of Tropical Forests: A Primer, FAO Forestry Paper No. 134,FAO, Rome, Italy [accessed on 17 December 2010 at http://www.fao.org/docrep/w4095e/w4095e00.htm]
J.R.L. Sanford & E. Cuevas, 1996, ‘Root growth and rhizosphere interactions in tropical forests’, in S.S. Mulkey, R.L.Chazdon, and A.P. Smith (eds.), 1996, Tropical forest plant ecophysiology, Chapman and Hall, New York, NY, USA

Grappling with Inordinate Uncertainty • 33
A. J. Gijsman, H.F. Alarcón, & R. J. Thomas, 1997, ‘Root decomposition in tropical grasses and legumes, as affected by soiltexture and season’, Soil Biology & Biochemistry, 29(9-10)
Felipe Garcìa-Oliva, Isabel Casar, Pedro Morales, & José M. Maass, 1994, ‘Forest-to-pasture conversion influences on soilorganic carbon dynamics in a tropical deciduous forest’, Oecologia, 99(3-4)
Jayalaxshmi Mistry, 2000, ‘Savannas’, Progress in Physical Geography, 24(4)
L. Bulla, & J. Lourido, 1980, ‘Production, decomposition and diversity in three savannas of the Amazonas territory(Venezuela)’, in J.I. Furtado (ed.), 1980, Tropical Ecology and Development, Proceedings of the Fifth InternationalSymposium on Tropical Ecology, International Society of Tropical Ecology, Kuala Lumpur, Malaysia
Elmar Andrade de Castro & J. Boone Kauffman, 1998, ‘Ecosystem structure in the Brazilian cerrado: A vegetation gradientof aboveground biomass, root mass and consumption by fire’, Journal of Tropical Ecology, 14
R.J. Scholes & D.O. Hall, 1996, ‘The carbon budget of tropical savannas, woodlands and grasslands’, in A.I. Breymeyer, D.O.Hall, J.M. Melillo, & G.I. Ågren (eds.), Global change: Effects on coniferous forests and grasslands, Wiley, Chichester, UK
D.B. Magcale-Macandog, 2002, ‘Soil erosion and sustainability of different land uses of smallholder Imperata grasslands inSEA’ in J. Juren, W. Lianxiang, W. Deyi, T. Xiaoning, & N. Jing (eds.), 12th International Soil Conservation Organization(ISCO) Conference: Sustainable utilization of global soil and water resources, Tsinghua University Press, Beijing, People’sRepublic of China
R.B. Jackson, J. Canadell, J.R Ehleringer, H.A. Mooney, O.E. Sala, & E.D. Schulze, 1996, ‘A global analysis of rootdistributions for terrestrial biomes’, Oecologia, 108
R.A. Houghton, 2005, ‘Aboveground forest biomass and the global carbon balance’, Global Change Biology, 11(6)
S. Shimada, H. Takahashi, A. Haraguchi, & M. Kaneko, 2001, ‘The carbon content characteristics of tropical peats in CentralKalimantan, Indonesia: Estimating their spatial variability in density’, Biogeochemistry, 53(3)
K. Inubushi, Y. Furukawa, A. Hadi, E. Purnomo, & H. Tsuruta, 2003, ‘Seasonal changes of CO2, CH4 and N2O fluxes inrelation to land-use change in tropical peat lands located in coastal area of South Kalimantan, Chemosphere, 52(3)
Y. Furukawa, K. Inubushi, M. Ali, A. M. Itang, & H. Tsuruta, 2005, ‘Effect of changing groundwater levels caused by land-use changes on greenhouse gas fluxes from tropical peat lands’, Nutrient Cycling in Agroecosystems, 71(1)
A. Hadi, K. Inubushi, E. Purnomo, F. Razie, K. Yamakawa, & H. Tsuruta, 2000, ‘ Effect of landuse changes on nitrous oxide(N2O) emission from tropical peat lands. Chemosphere: Global Change Science, 2(3)
J. Germer & J. Sauerborn, 2004, ‘Solar radiation below the oil palm (Elaeis guineensis Jacq.) canopy and its impact on theundergrowth species composition’, The Planter, 80(934), pp. 13–27; Henson, 1998; Henson & Dolmat, 2003
Pedro A. Sanchez, 2000, ‘Linking climate change research with food security and poverty reduction in the tropics’,Agriculture, Ecosystems and Environment, 82(1-3)
IPCC [Intergovernmental Panel on Climate Change], 2003, Good Practice Guidance for Land Use, Land-use Change andForestry, Institute for Global Environmental Strategies, Hayama, Japan [accessed on 28 January 2011 at http://www.ipcc-nggip.iges.or.jp/public/gpglulucf/gpglulucf.htm]
Syahrinudin, 2005, ‘The potential of oil palm and forest plantations for carbon sequestration on degraded land in Indonesia’,Ecology and Development Series, No. 28, Zentrum für Entwicklungsforschung [Center for Development Research],University of Bonn, Bonn, Germany

Christophe Jourdan and Hevré Rey, 1997, ‘Modelling and simulation of the architecture and development of the oil-palm(Elaeis guineensis Jacq.) root system’, Plant and Soil, 190(2)
T. Fairhurst, 1996, ‘Management of nutrients for efficient use in smallholder oil palm plantations’, PhD Thesis, Departmentof Biology, Imperial College at Wye, University of London, Wye, Ashford UK
H. Khalid, Z.Z. Zin, & J.M. Anderson, 2000,’Decomposition processes and nutrient release patterns of oil palm residues’,Journal of Oil Palm Research, 12(1)
S. Braconnier & J.-P. Caliman, 1989, ‘Premiers résultats concernant l’étude du systéme racinaire du palmier a` huile en soldégradé’, Rapport Interne, L’Institut de recherches pour les huiles et oléagineux, Paris, France
Ian E. Henson & Mohd T. Dolmat, 2003, ‘Physiological analysis of an oil palm density trial on a peat soil’, Journal of OilPalm Research, 15(2)
C.W.S. Hartley, 1977, The Oil Palm, West African Institute for Oil Palm Research, Longman, London & New York, NY
M. Ross, 1999, Auswirkungen verschiedener Rodeverfahren und des Unterbewuchses auf Bodenfruchtbarkeit,Bodenwasserhaushalt, Erosion, und Bestandsentwicklung eines lpalmenbestandes, Shaker Verlag, Aachen, Germany
Khalid Haron, Zin Z. Zakaria, & J.M. Anderson, 2000, ‘Nutrient cycling in an oil palm plantation: The effects of residuemanagement practices during replanting on dry matter and nutrient uptake of young palms’, Journal of Oil Palm Research,12(2)
Ike Ezenwa, Oluwatoyin A. Aribisala, & M.E. Aken’ova, 1996, ‘Research note: Dry matter yields of Panicum and Brachiariawith nitrogen fertilisation or Pueraria in an oil palm plantation, Tropical Grasslands, 30
John A. Parrotta, 1992, ‘The role of plantation forests in rehabilitating degraded tropical ecosystems’, Agriculture, Ecologyand Ecosystems, 41
Tokyo Electric Power Environmental Engineering Co. Inc.,2009, Feasibility Study Report Palm Oil Effluent (POME)Treatment Co-benefits CDM Project (Summary), GEC CDM/JI Support Programme commissioned by the Ministry of theEnvironment, Japan [accessed on 8 December 2010 at: http://gec.jp/gec/en/Activities/cdm-fs/2008/200812TEE_eMalaysia_rep.pdf ]
Mohd Basri Wahid, Chan Kook Weng, Choo Yuen May, & Chow Mee Chin, 2006, ‘The Need to Reduce National GreenhouseEmissions: Oil Palm Industry’s Role’, Journal of Oil Palm Research, Special Issue , April
Shahrakbah Yacob, Mohd Ali Hassan, Yoshihito Shiraia, Minato Wakisakaa, & Sunderaj Subash, 2005, ‘Baseline study ofmethane emission from open digesting tanks of palm oil mill effluent treatment’, Chemosphere, 59(11)
Ma A.N., Choo, Y.M., Toh Chua, N.S., 1999, ‘Renewable energy from palm oil industry’, in G. Singh, L.K. Huan, T. Leng, andD.L. Kow (eds.), 1999, Oil Palm and the Environment: A Malaysian Perspective, Malaysian Oil Palm Growers’ Council, KualaLumpur, Malaysia
Foo-Yuen Ng, Foong-Kheong Yew, Yusof Basiron, Kalyana Sundram, 2011, ‘A Renewable Future Driven with MalaysianPalm Oil-based Green Technology’, Journal of Oil Palm & The Environment, 2, pp.1-7, doi:10.5366/jope.2011.01
Yoshihito Shirai, Minato Wakisaka, Shahrakbah Yacob, Mohd Ali Hassan, & Shin’ichi Suzuki, 2003, ‘Reduction of MethaneReleased from Palm Oil Mill Lagoon in Malaysia and Its Countermeasures’, Mitigation and Adaption Strategies for GlobalChange, 8(3)
Shahrakbah Yacob, Mohd Ali Hassan, Yoshihito Shiraia, Minato Wakisakaa, & Sunderaj Subash, 2006, ‘Baseline study of
34 • Grappling with Inordinate Uncertainty
Grappling with Inordinate Uncertainty • 35
methane emission from anaerobic ponds of palm oil mill effluent treatment’, Science of the Total Environment, 366(1)
Sami Nikander, 2008, Greenhouse gas and energy intensity of product chain: case transport biofuel, Master of Science inEngineering Thesis, Helsinki University of Technology, Helsinki, Finland, 9 May
Rokus Wijbrans and Hans van Zutphen, 2005, Environmental impact study for combustion of fatty acid distillate in a powerplant, Zwolle, The Netherlands, May
UK Renewable Fuels Agency, 2008, Carbon and sustainability reporting within the Renewable Transport Fuel Obligation:Technical guidance, Parts 1 & 2, Office of the Renewable Fuels Agency, London, UK, January
B.J. Wood & R.H.V. Corley, 1993, ‘The energy balance of oil palm cultivation’ in Proceedings of the 1991 PORIMInternational Palm oil Conference – Agriculture, Palm Oil Research Institute of Malaysia, Kuala Lumpur, Malaysia
Kay Damen & André Faaij, 2007, Greenhouse Gas Balances of Biomass Import Chains for ‘Green’ Electricity Production inThe Netherlands, IEA Bio-energy Task 38, International Energy Agency, Paris, France

PO Box 3693Arlington, VA 22203-3693
(866) 467-7200
www.worldgrowth.org