Graphs of the form y = x n for n ≥ 1. Graphs of the form y = x n all go through the point (1, 1)...
36
Graphs of the form y = x n for n 1 ≥
-
Upload
ariel-banks -
Category
Documents
-
view
216 -
download
1
Transcript of Graphs of the form y = x n for n ≥ 1. Graphs of the form y = x n all go through the point (1, 1)...

Graphs of the form y = xn
for n ≥ 1
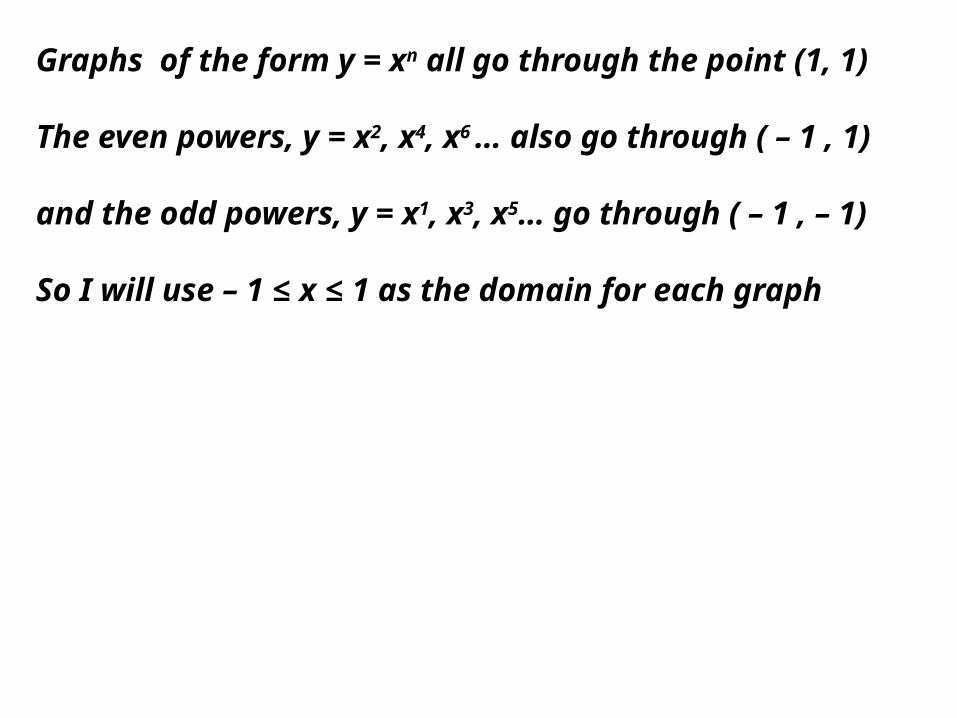
Graphs of the form y = xn all go through the point (1, 1)
The even powers, y = x2, x4, x6 … also go through ( – 1 , 1)
and the odd powers, y = x1, x3, x5… go through ( – 1 , – 1)
So I will use – 1 ≤ x ≤ 1 as the domain for each graph

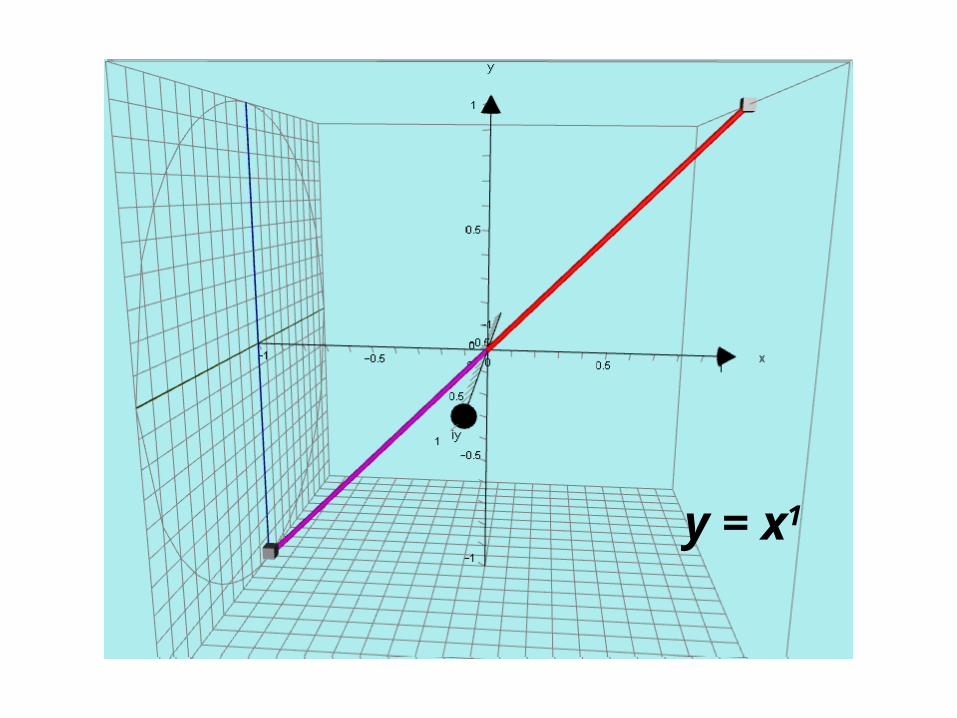
y = x1
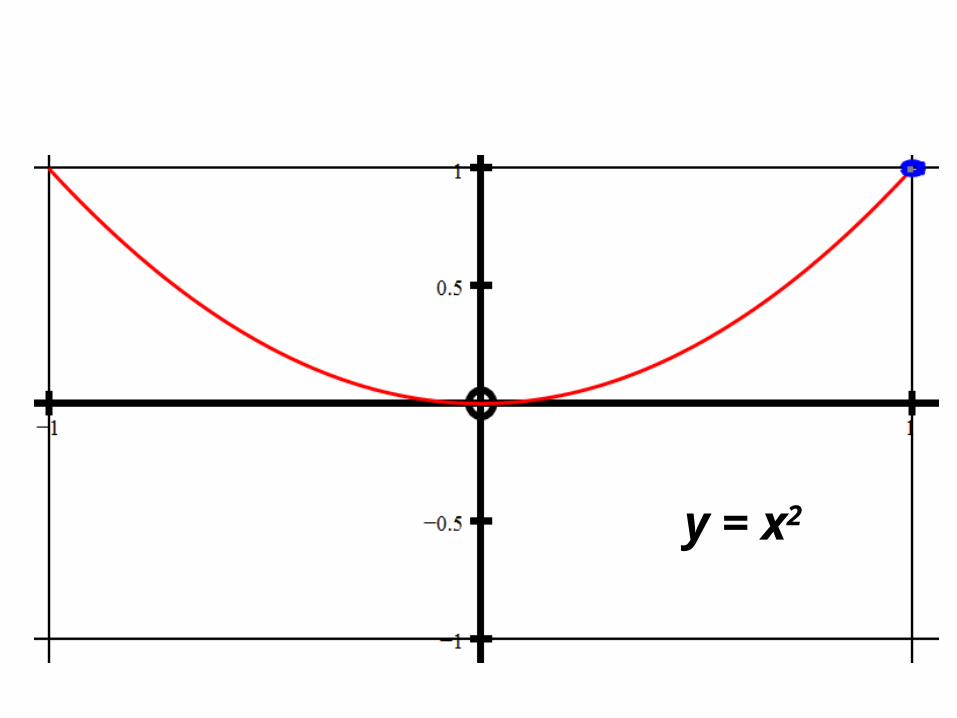
y = x2
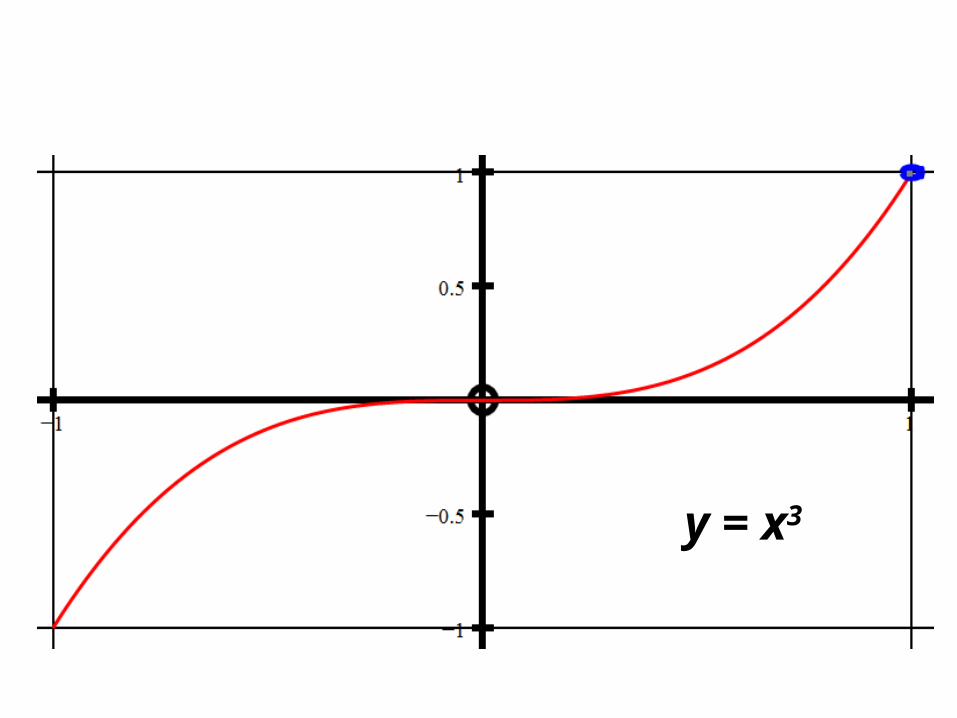
y = x3

y = x4

y = x5

However, if we increase the power n in steps of 0.1 a strange thing happens.
When n = 1, 2, 3, 4, 5… we get the familiar curves as we just saw but when n takes the values 1.1, 1.2, 1.3, …..up to 1.9 the left hand side of the curve vanishes!
The same thing happens for n = 2.1 to 2.9 and again for n = 3.1 to 3.9 etc
The left hand side of the curve appears to vanish for non whole number values of n because it does not exist in 2 dimensional space!

y = x1

y = x1.5
?

y = x2
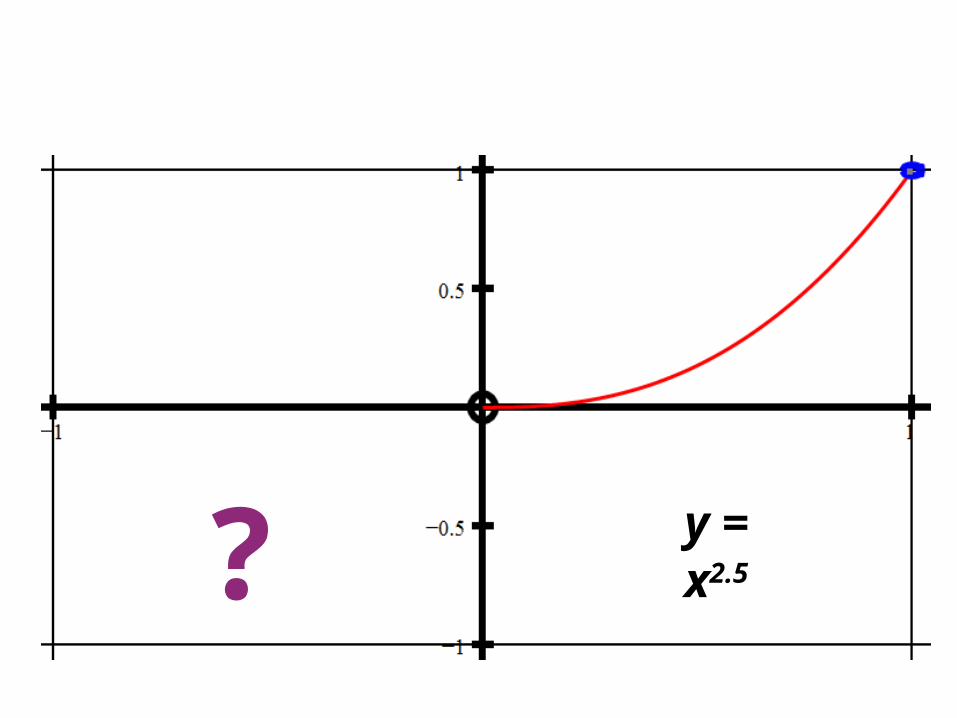
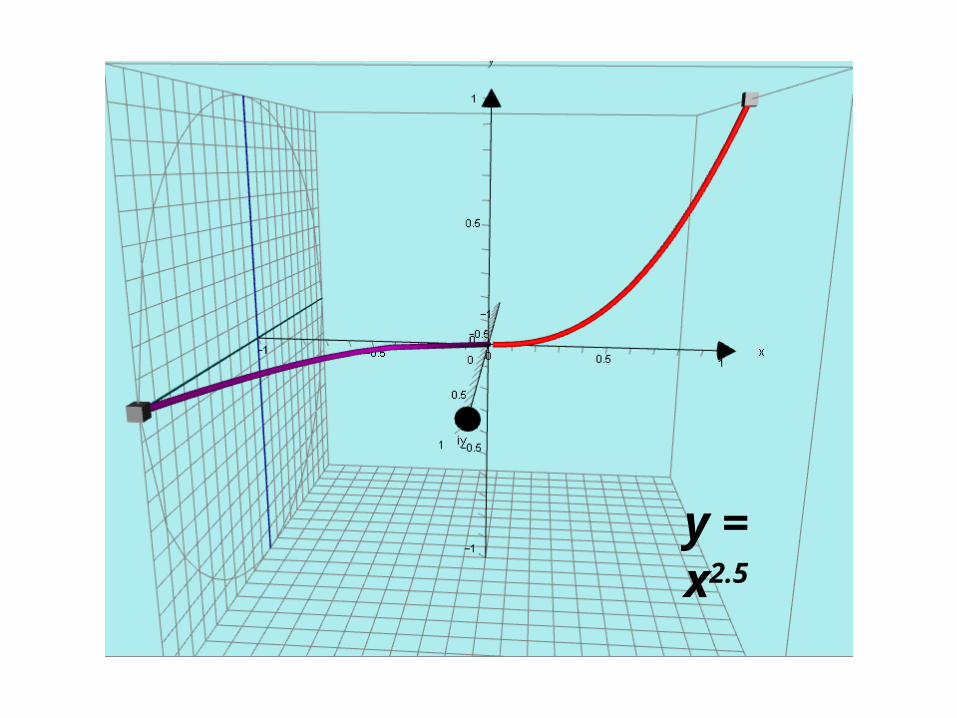
y = x2.5
?

y = x3

y = x3.5
?
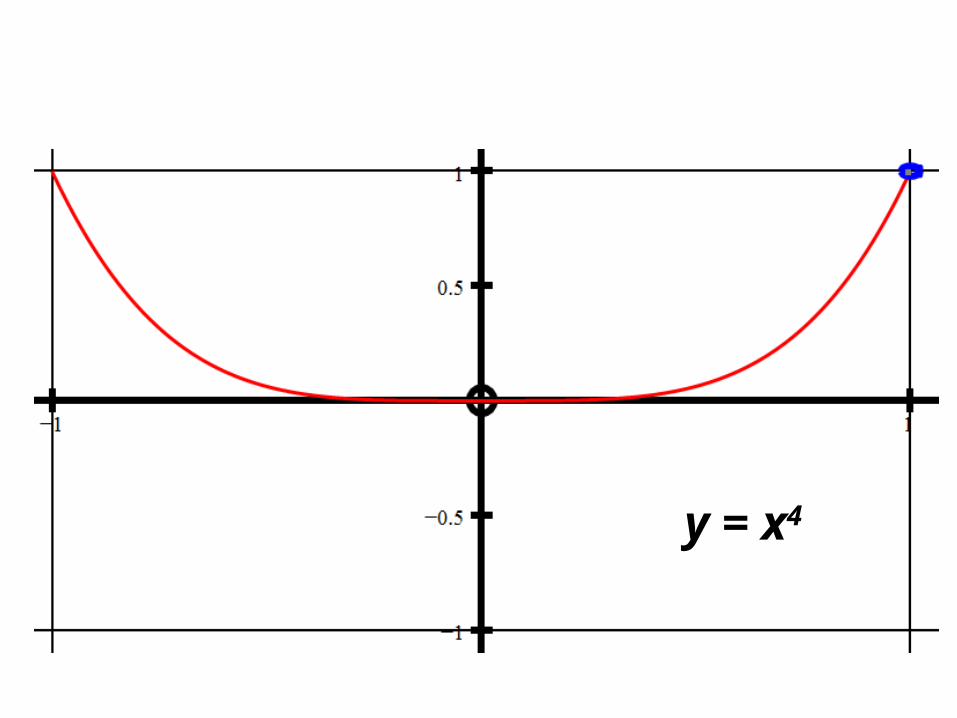
y = x4
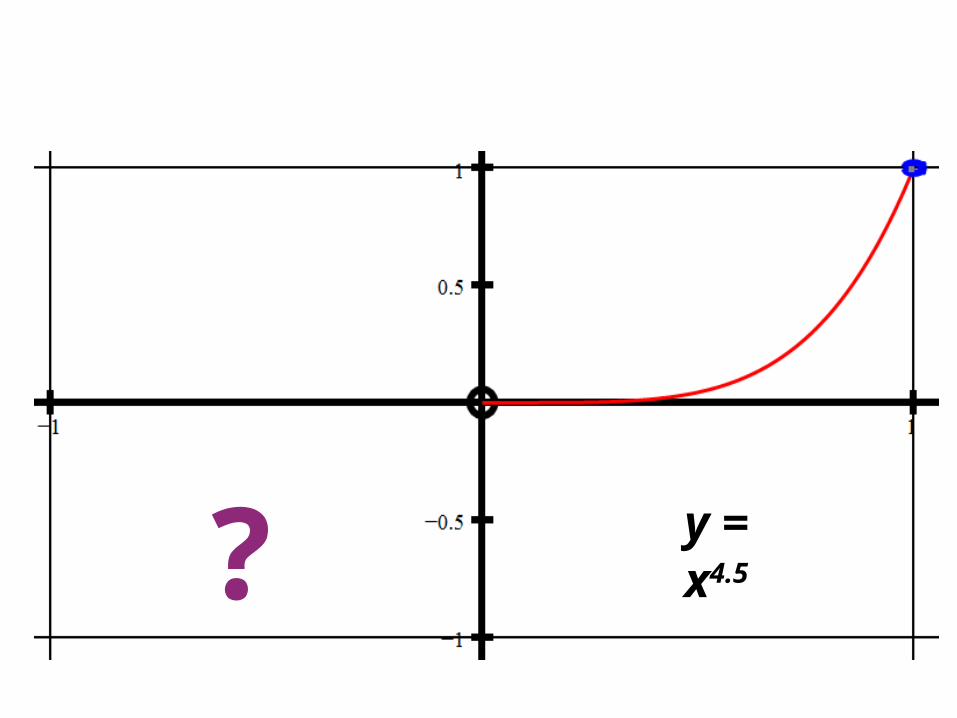
y = x4.5
?

y = x5

This is different from the normal “phantom graph” theory
where we have REAL y values and a COMPLEX x plane

In this situation we have REAL x values and a COMPLEX y plane.
y = x1y = x1

y = x1.25
y = x1.25

y = x1.5
y = x1.5
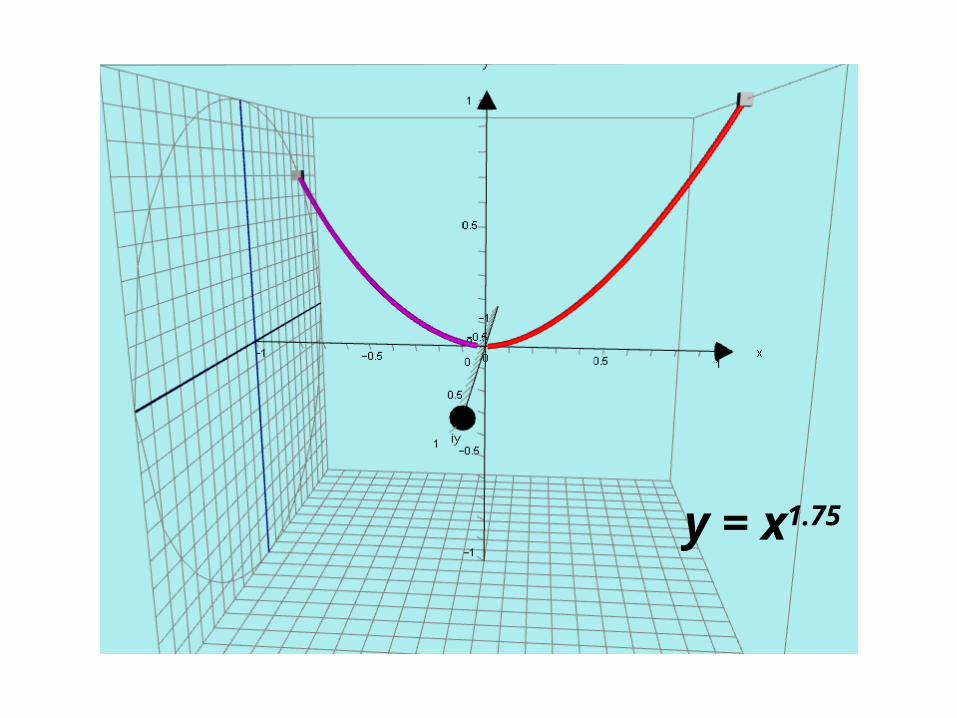
y = x1.75
y = x1.75

y = x2
y = x2

y = x2.25
y = x2.25
y = x2.5
y = x2.5
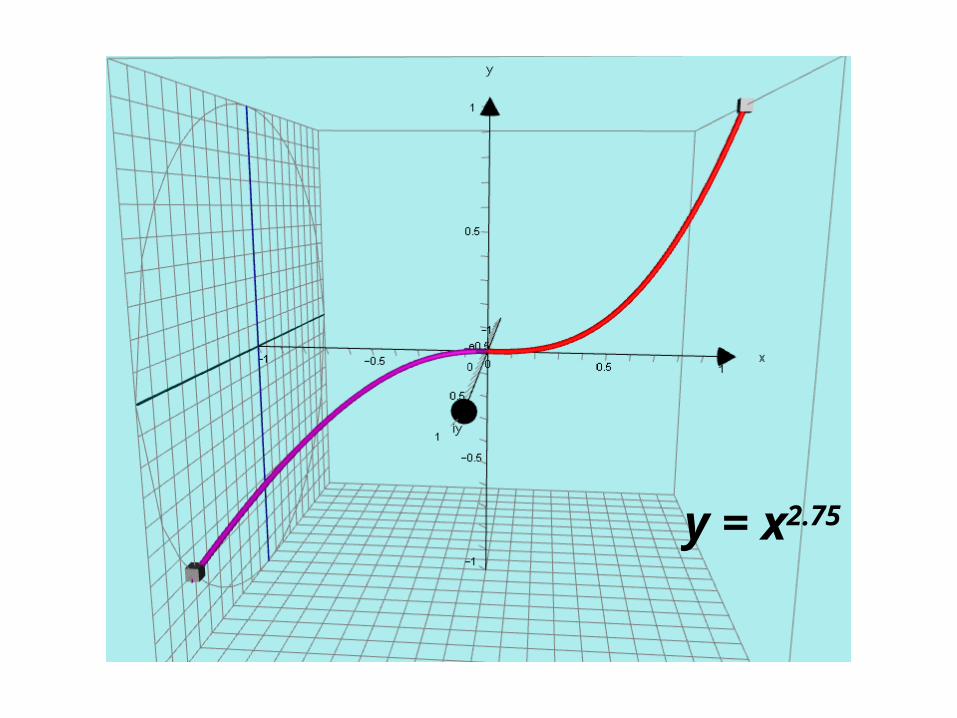
y = x2.75
y = x2.75

y = x3
y = x3

y = x3.25
y = x3.25

y = x3.5
y = x3.5

y = x3.75

y = x4

y = x4.25
y = x4.25
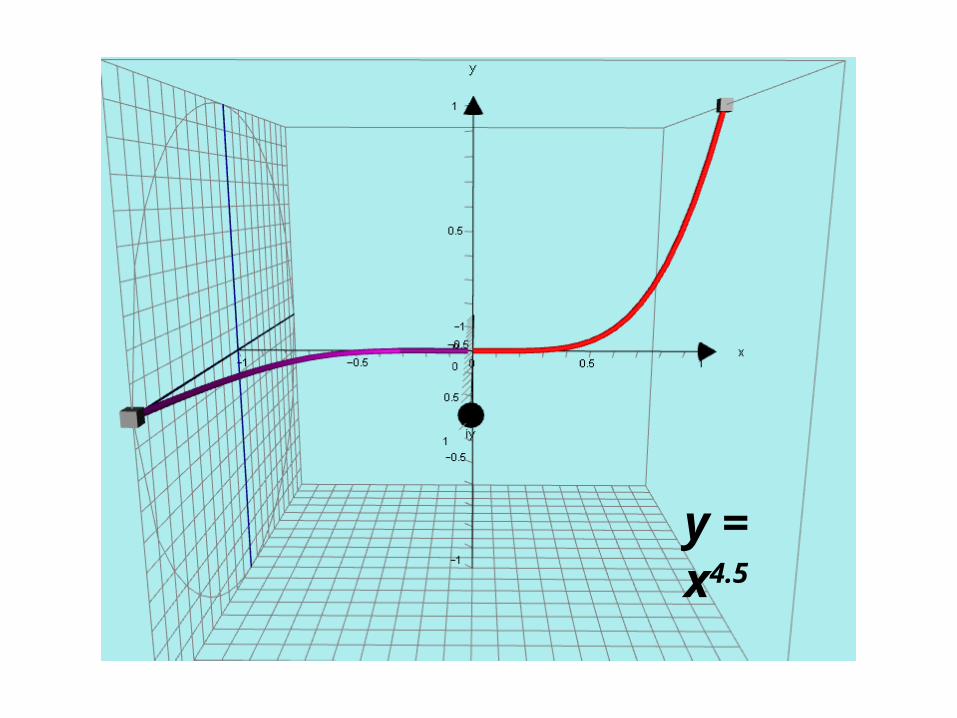
y = x4.5
y = x4.5

y = x4.75
y = x4.75

y = x5
y = x5