Graphing Motion. Before we begin though…..a few things 1.When we look at a line with no numbers we...
30
Graphing Motion
-
Upload
berniece-underwood -
Category
Documents
-
view
217 -
download
0
Transcript of Graphing Motion. Before we begin though…..a few things 1.When we look at a line with no numbers we...
Graphing Motion

Before we begin though…..a few things
1. When we look at a line with no numbers we are just looking at the shape, analyzing the shape of the line. Slope can help with that.
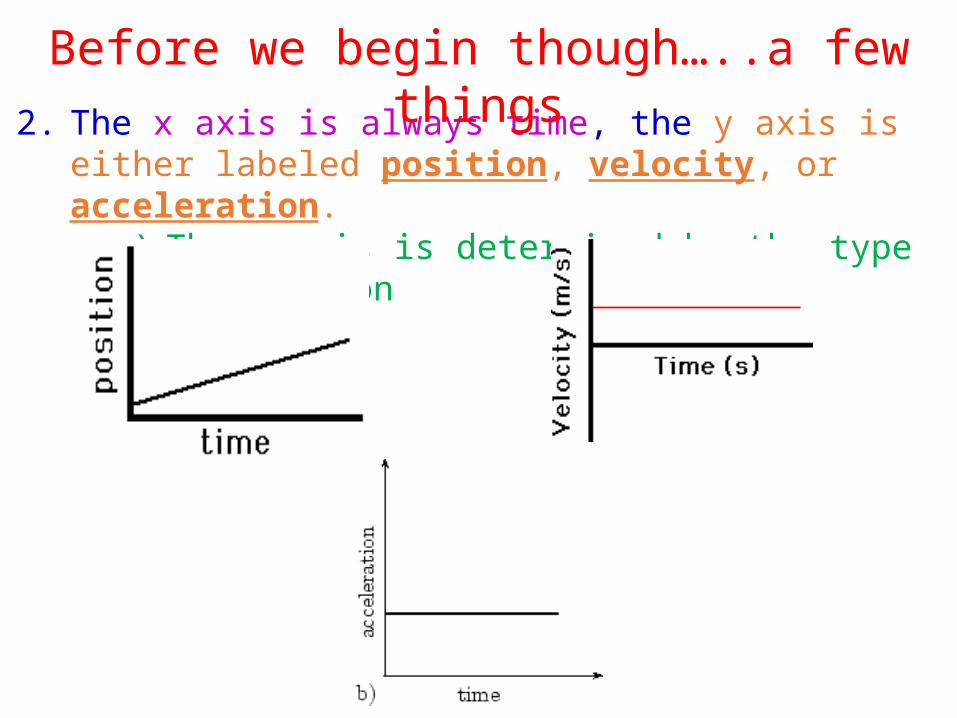
2. The x axis is always time, the y axis is either labeled position, velocity, or acceleration.
a) The y axis is determined by the type of question
Before we begin though…..a few things
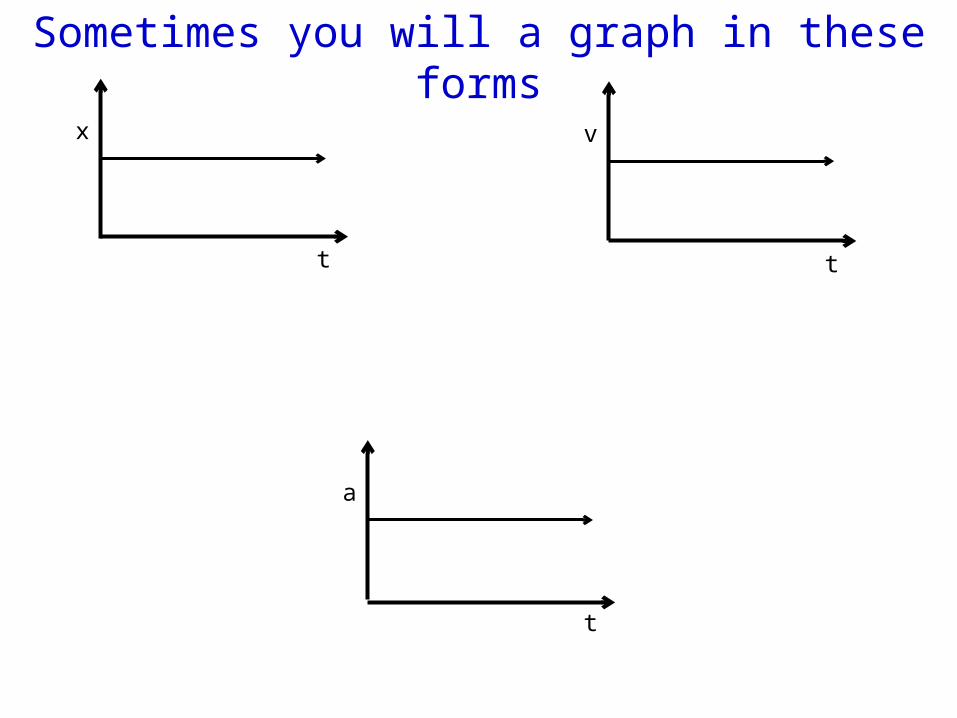
x
t
a
t
v
t
Sometimes you will a graph in these forms
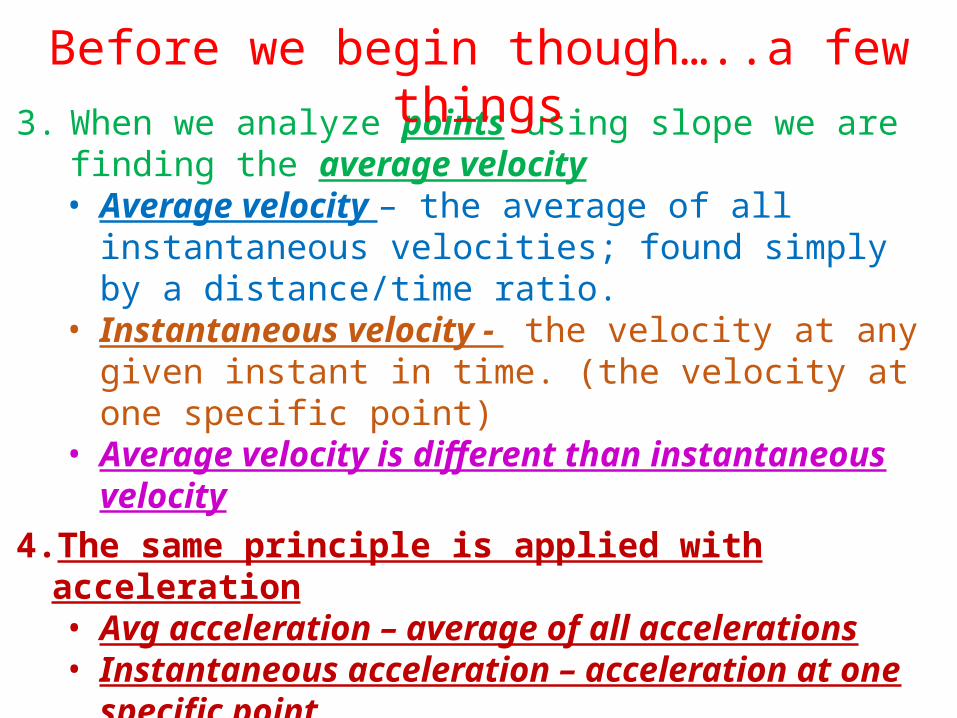
3. When we analyze points using slope we are finding the average velocity• Average velocity – the average of all instantaneous
velocities; found simply by a distance/time ratio.• Instantaneous velocity - the velocity at any given instant in
time. (the velocity at one specific point)• Average velocity is different than instantaneous velocity
4. The same principle is applied with acceleration• Avg acceleration – average of all accelerations• Instantaneous acceleration – acceleration at one specific
point
Before we begin though…..a few things
There are three main types of graphs in Kinematics. -Displacement vs. time graphs.-Velocity vs. time graphs.-Acceleration vs. time
Let’s look at the displacement vs. time graph.
***Kinematics is the science of describing the motion of objects using words, diagrams, numbers, graphs, and equations
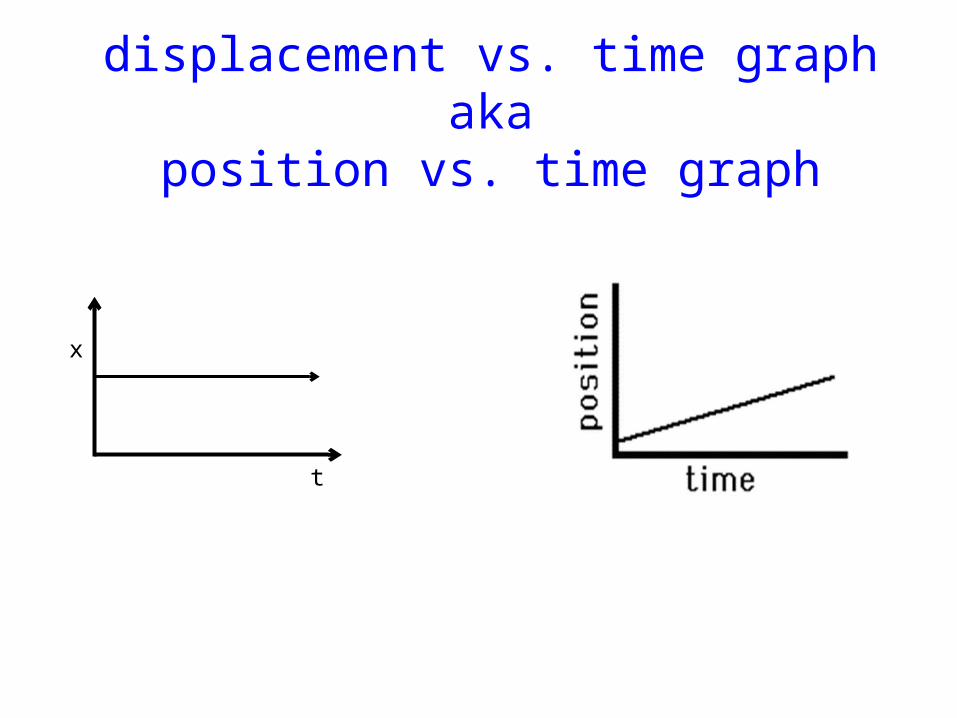
displacement vs. time graphaka
position vs. time graph
x
t
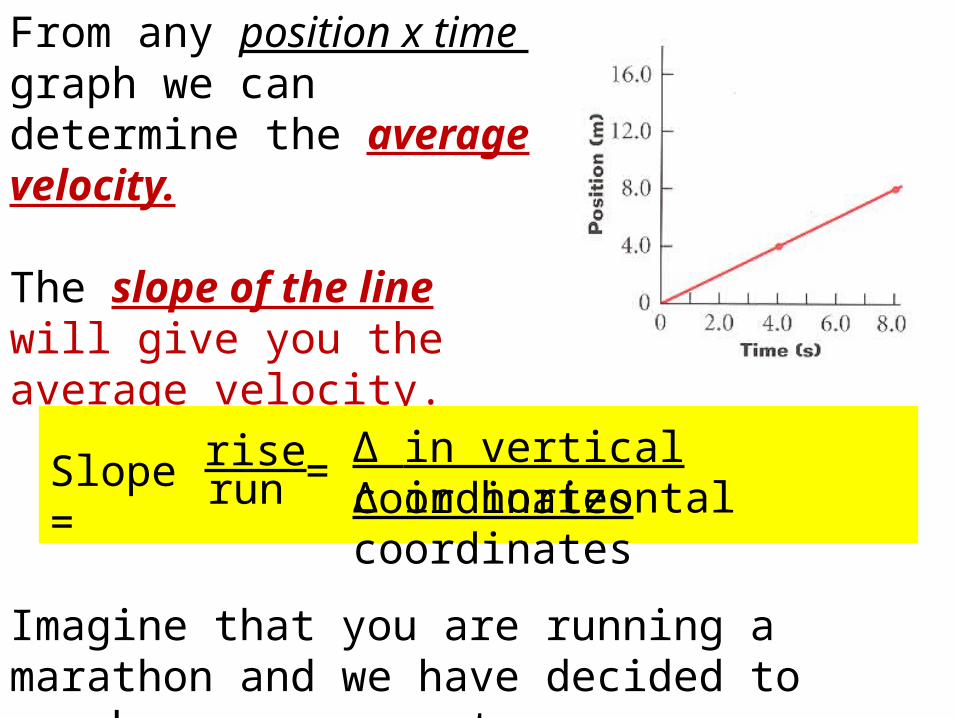
From any position x time graph we can determine the average velocity.
The slope of the line will give you the average velocity.
Slope =
riserun = ∆ in vertical coordinates
∆ in horizontal coordinates
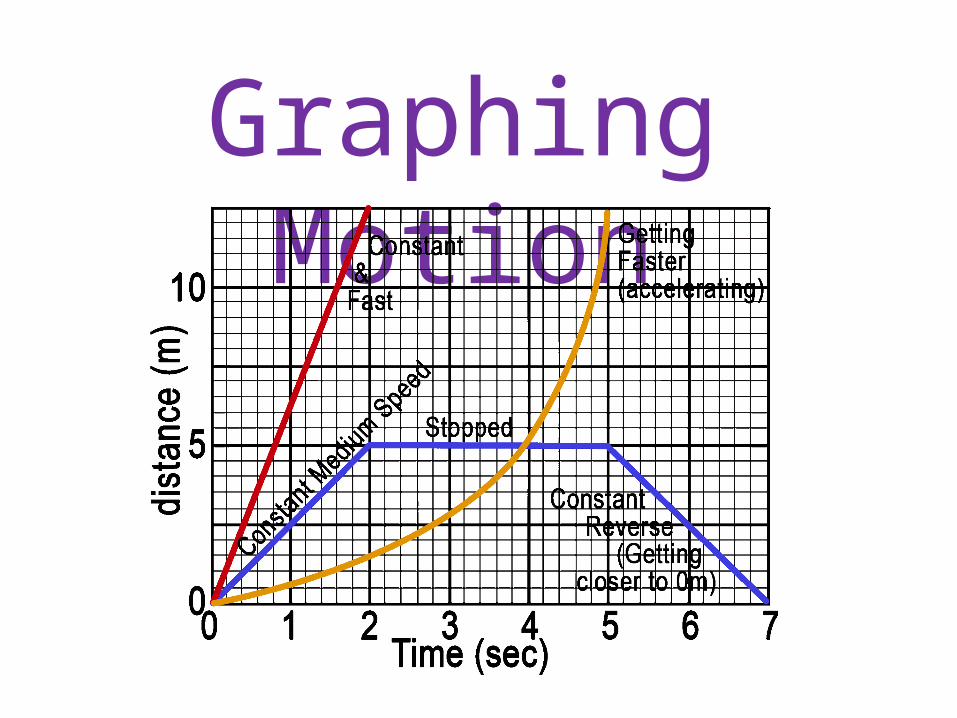
Imagine that you are running a marathon and we have decided to graph your movement.
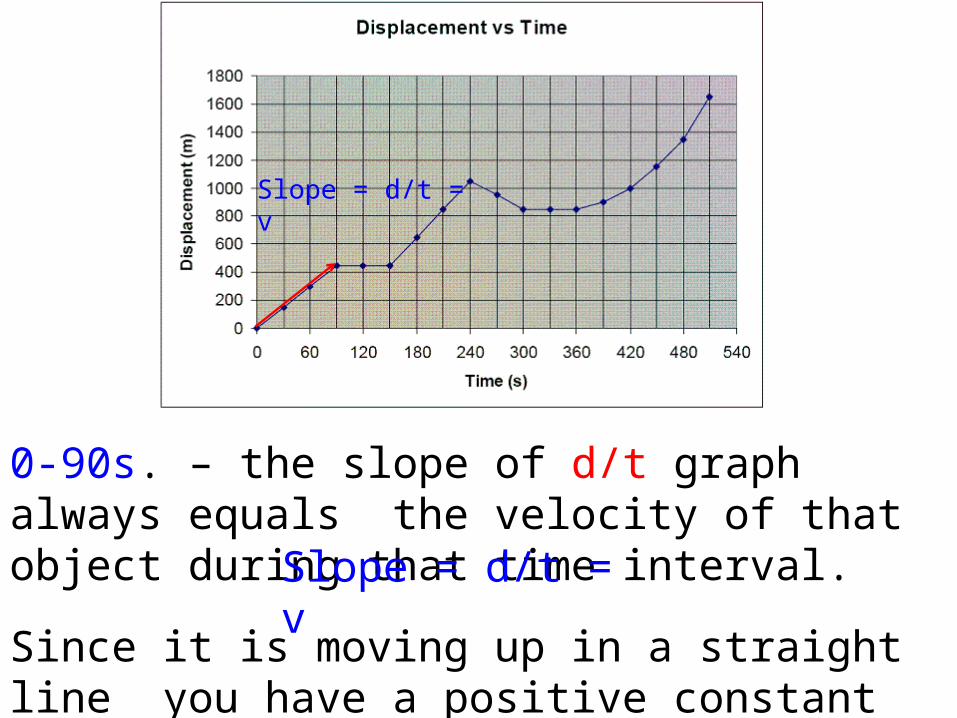
0-90s. – the slope of d/t graph always equals the velocity of that object during that time interval.
Slope = d/t = v
Slope = d/t = v
Since it is moving up in a straight line you have a positive constant velocity.
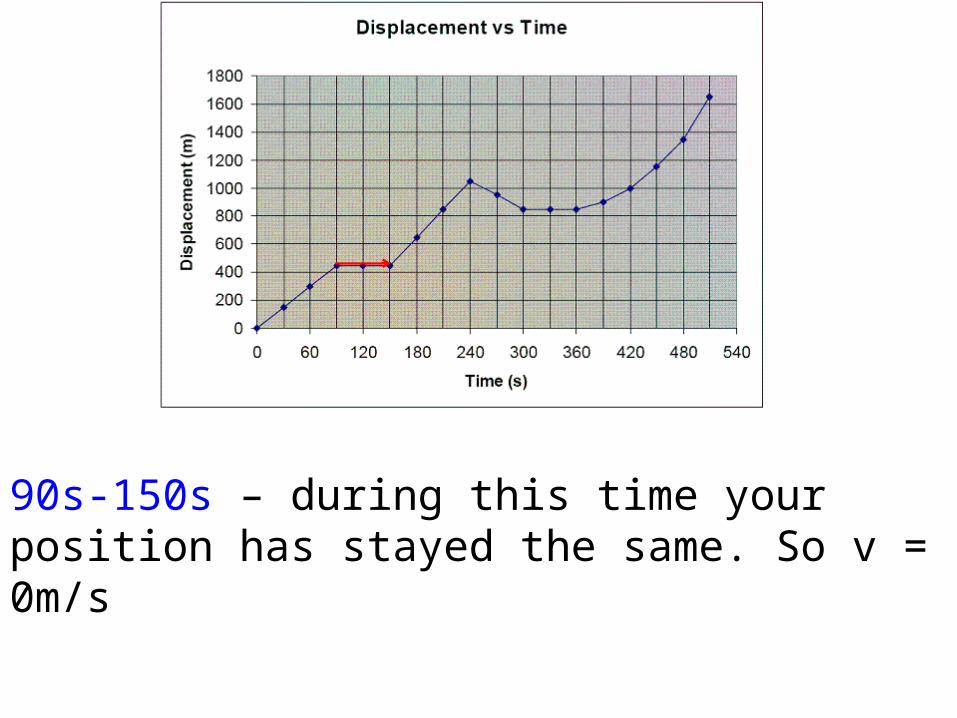
90s-150s – during this time your position has stayed the same. So v = 0m/s
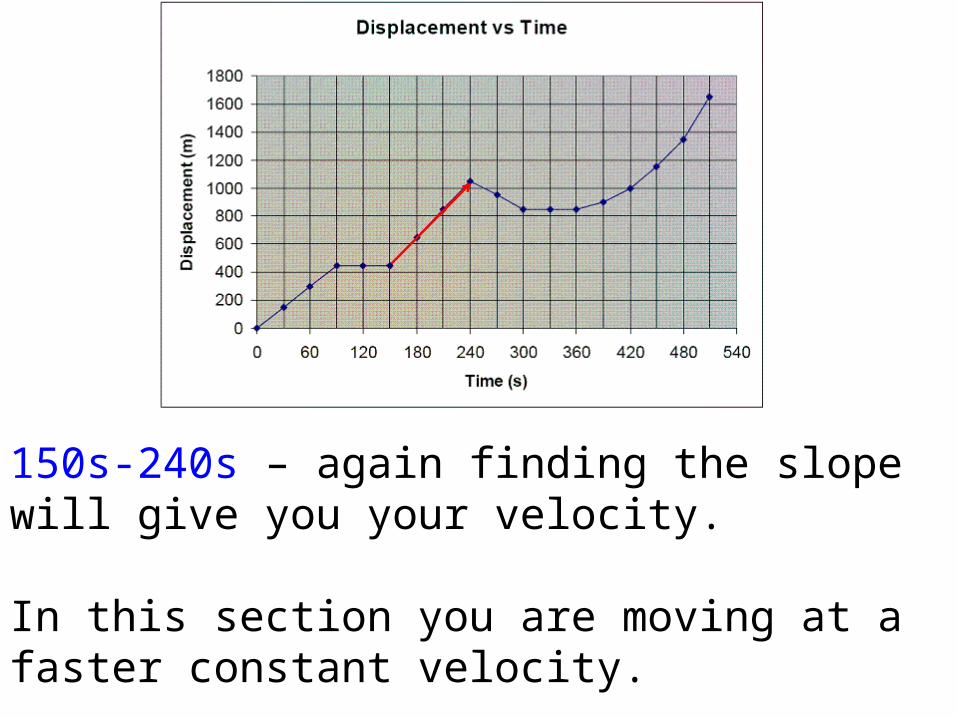
150s-240s – again finding the slope will give you your velocity.
In this section you are moving at a faster constant velocity.
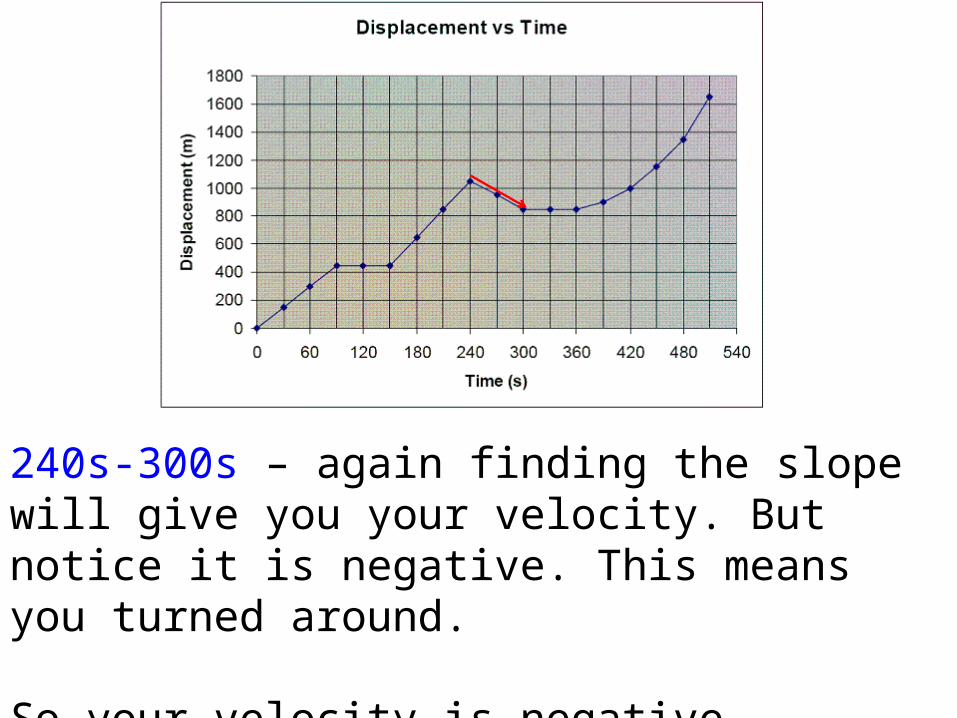
240s-300s – again finding the slope will give you your velocity. But notice it is negative. This means you turned around.
So your velocity is negative.
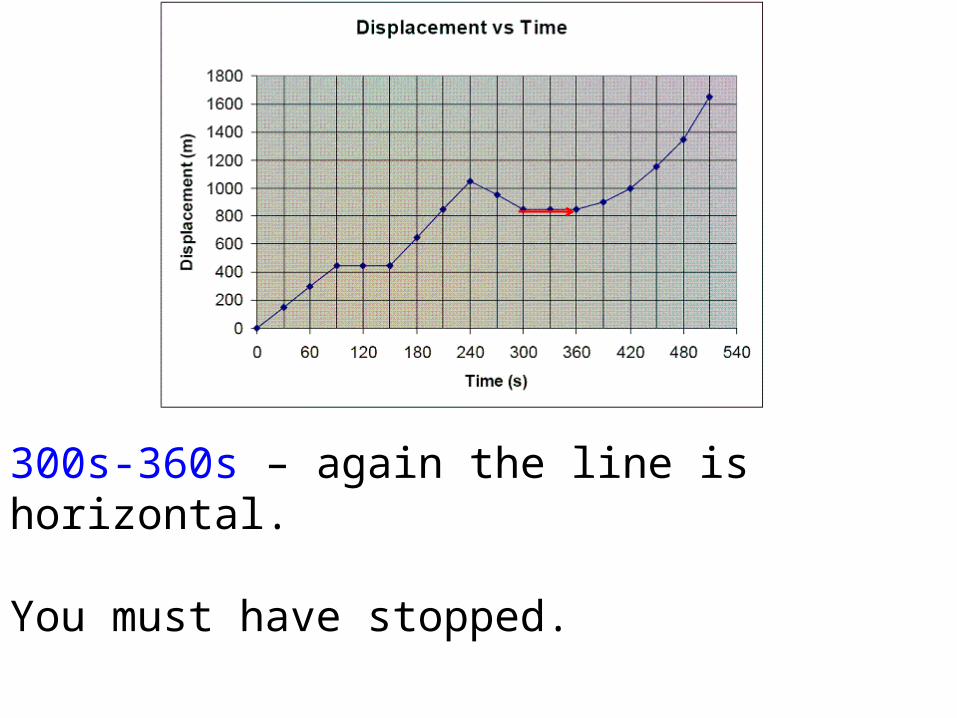
300s-360s – again the line is horizontal.
You must have stopped.
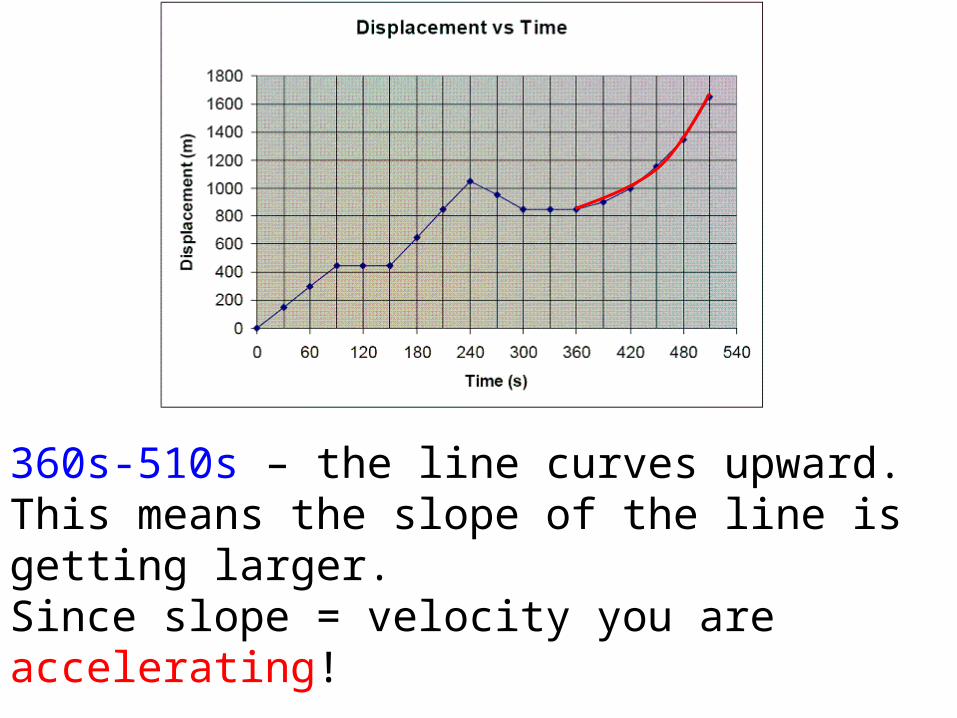
360s-510s – the line curves upward.This means the slope of the line is getting larger. Since slope = velocity you are accelerating!
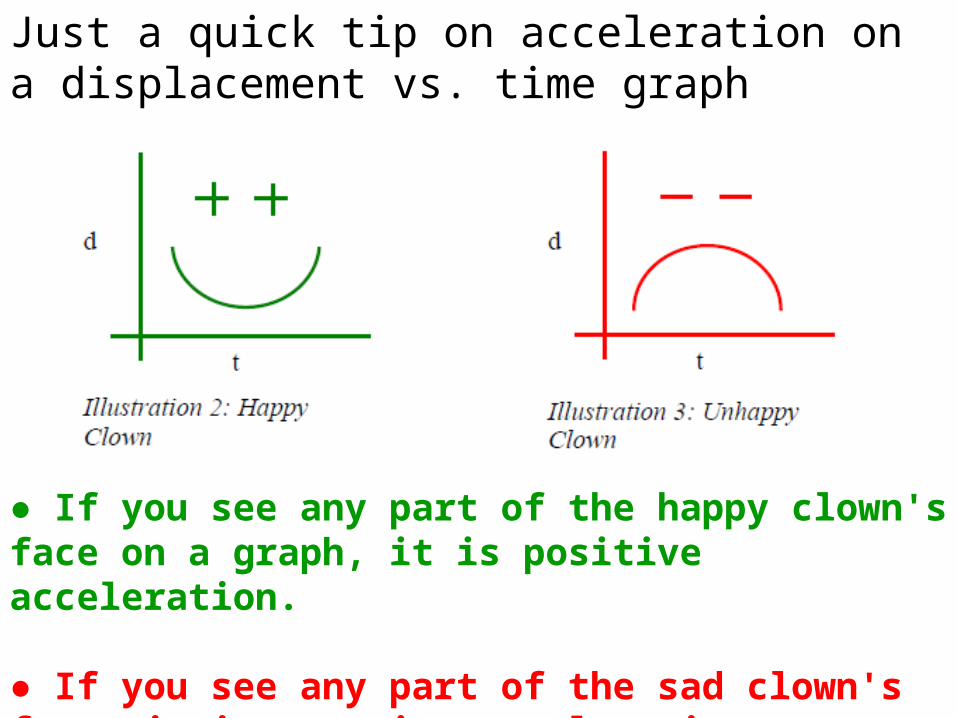
Just a quick tip on acceleration on a displacement vs. time graph
● If you see any part of the happy clown's face on a graph, it is positive acceleration.
● If you see any part of the sad clown's face, it is negative acceleration.
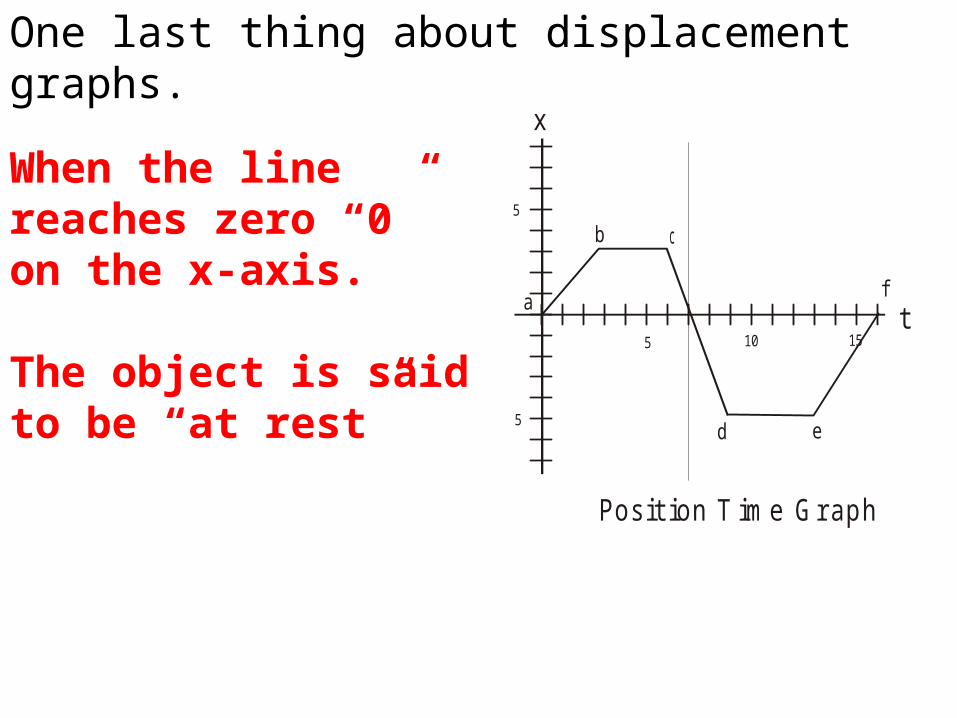
One last thing about displacement graphs.
t
x
Posit ion T ime Gr aph
a
b
5
5
10 15
c
5d e
f
When the line reaches zero “0” on the x-axis.
The object is said to be “at rest”
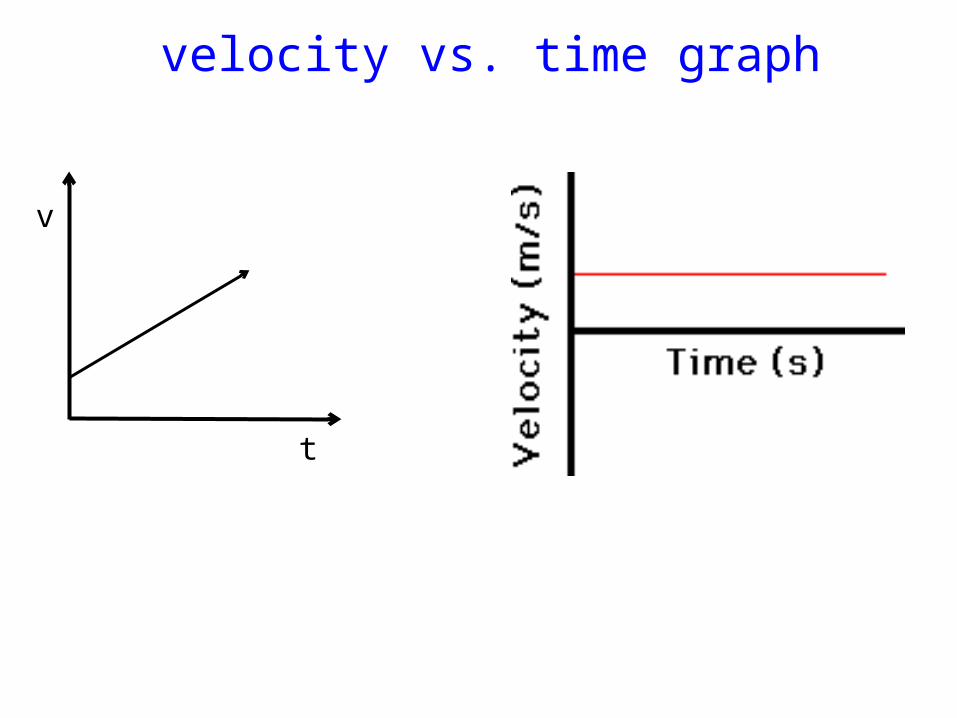
velocity vs. time graph
v
t
Velocity vs. time graphs.
• First thing to remember. – The rules are not the same for both
displacement vs time and velocity vs time graphs!
• The lines mean different things.– For the next example, the graph is from
the same data (the marathon)
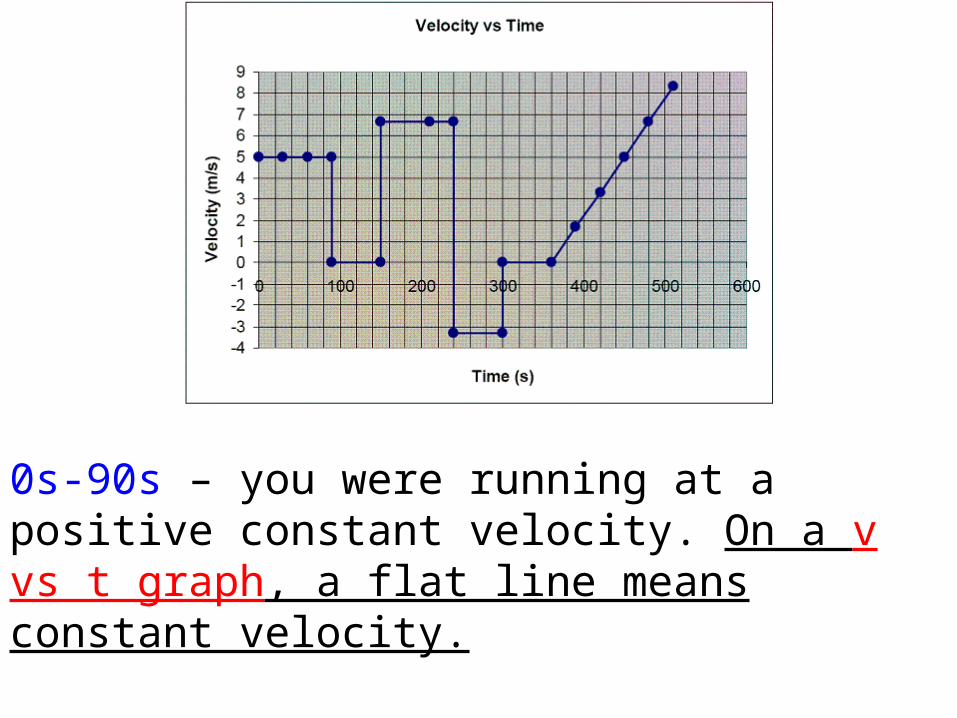
0s-90s – you were running at a positive constant velocity. On a v vs t graph, a flat line means constant velocity.
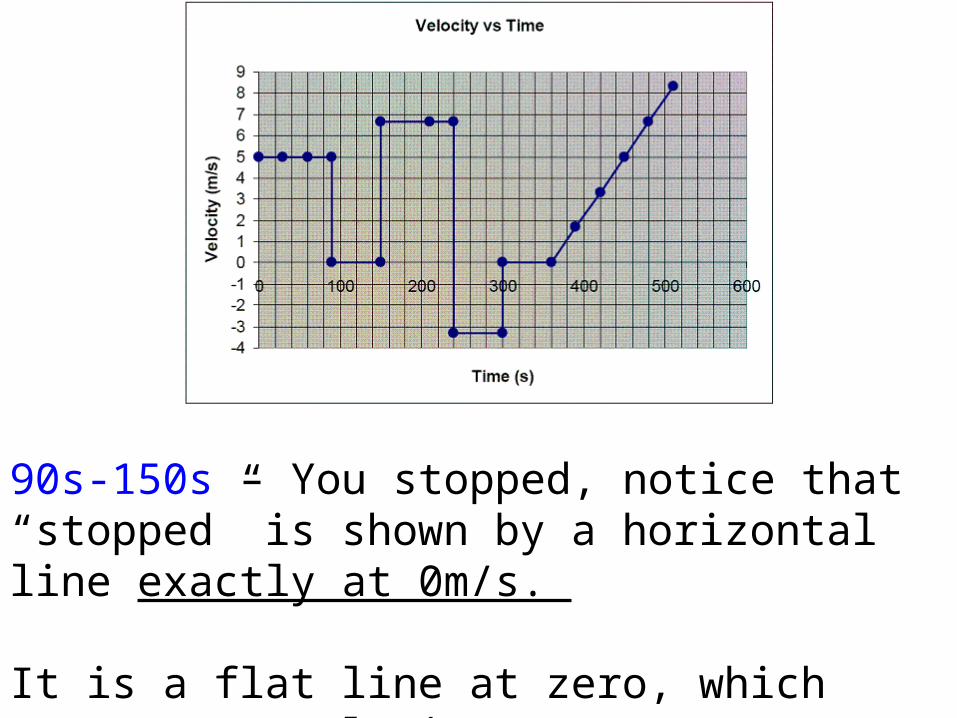
90s-150s – You stopped, notice that “stopped” is shown by a horizontal line exactly at 0m/s.
It is a flat line at zero, which means your velocity was zero.
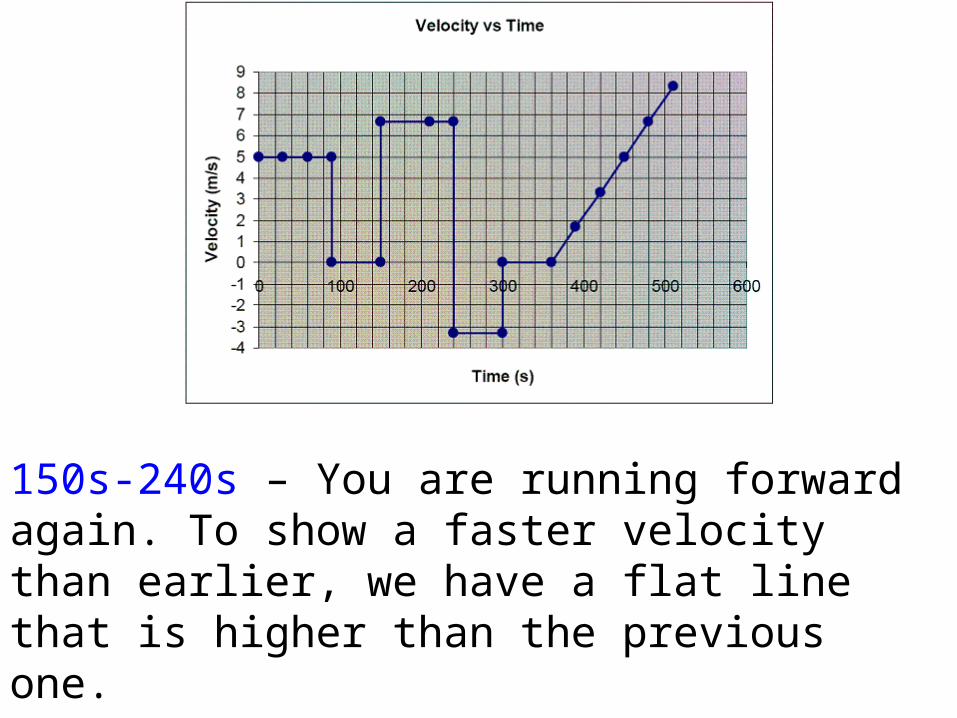
150s-240s – You are running forward again. To show a faster velocity than earlier, we have a flat line that is higher than the previous one.
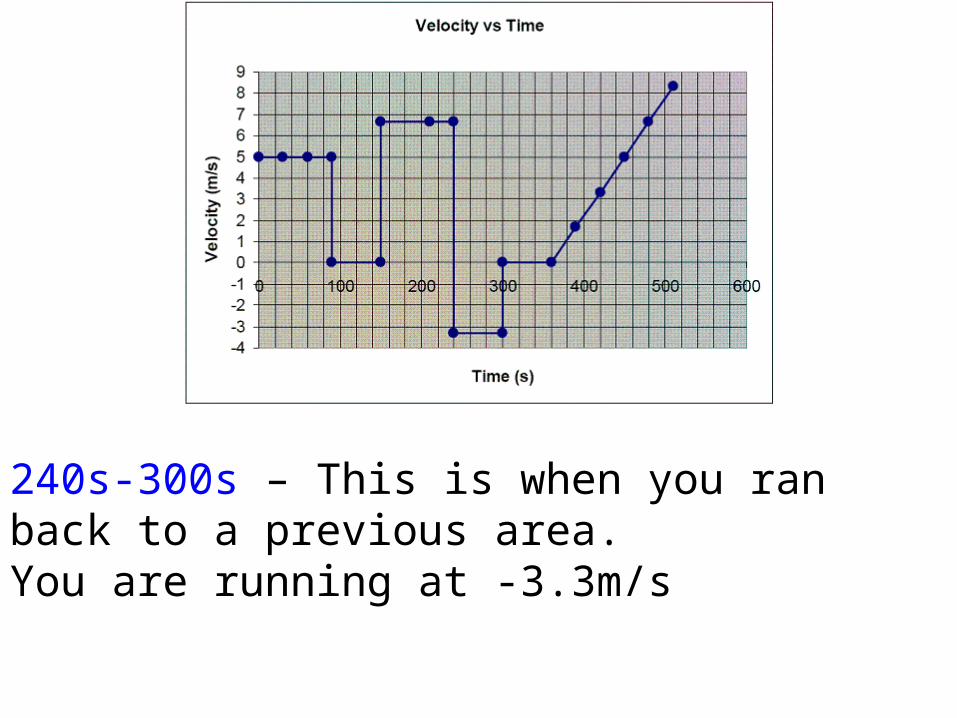
240s-300s – This is when you ran back to a previous area.You are running at -3.3m/s
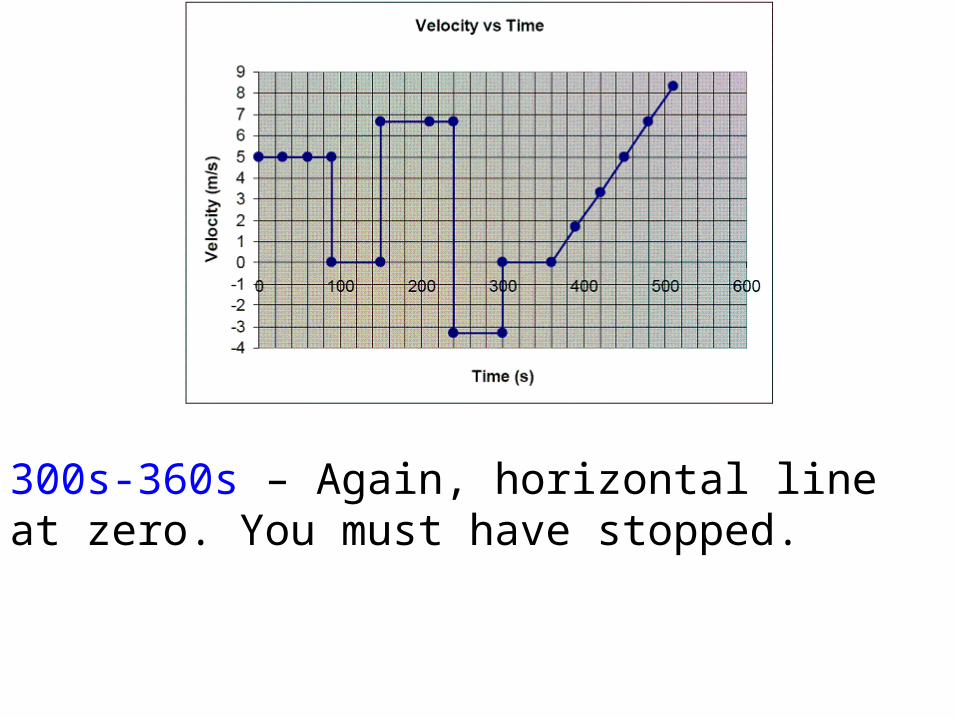
300s-360s – Again, horizontal line at zero. You must have stopped.
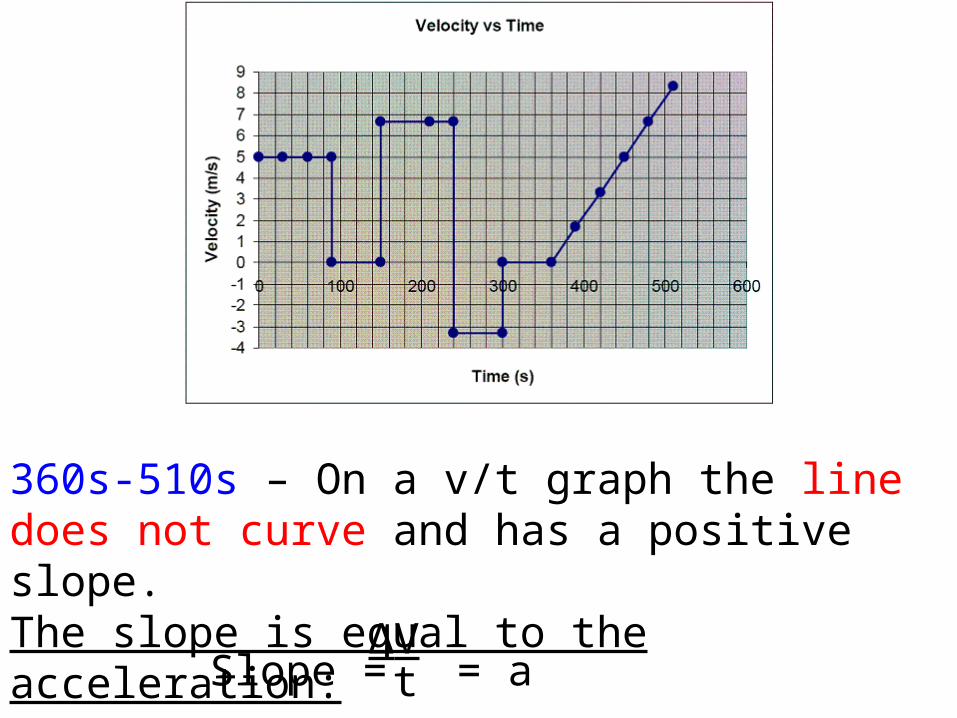
360s-510s – On a v/t graph the line does not curve and has a positive slope. The slope is equal to the acceleration:
Slope = ∆Vt = a
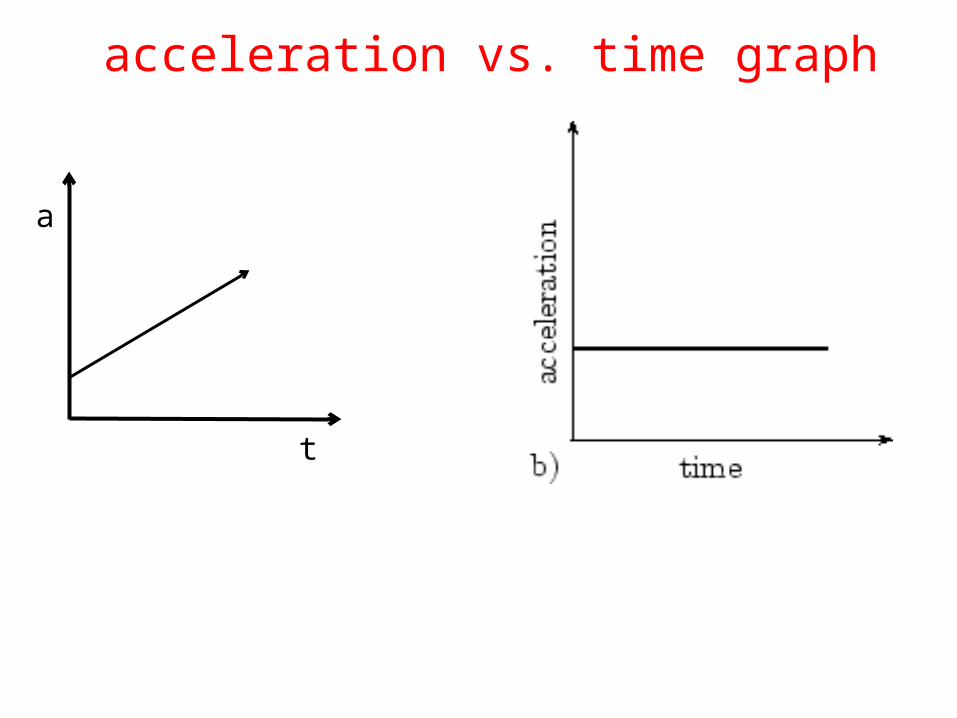
acceleration vs. time graph
a
t
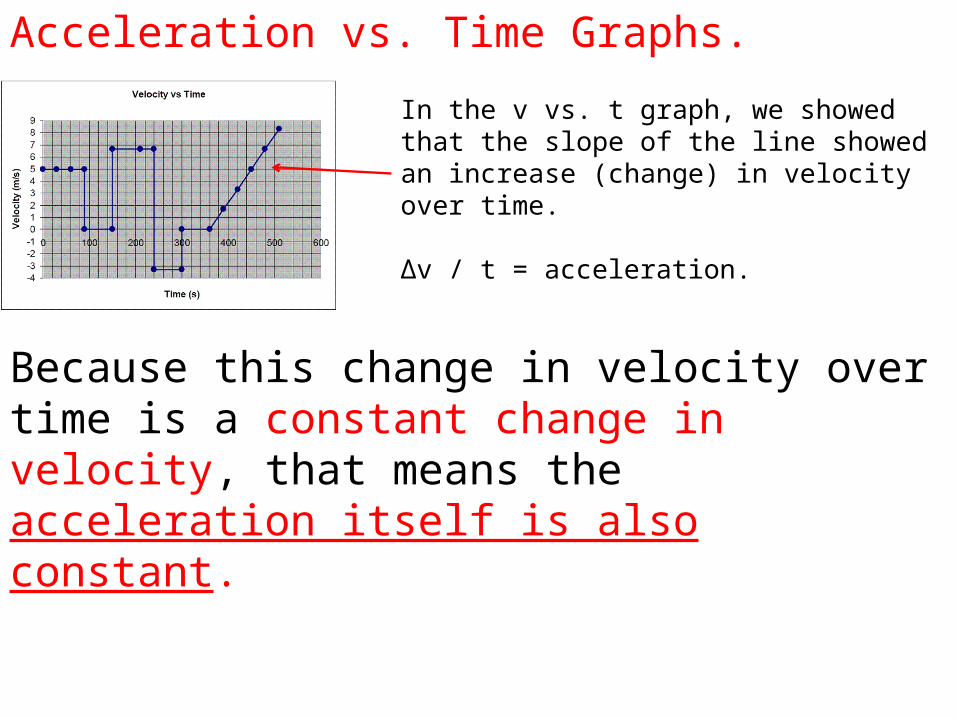
Acceleration vs. Time Graphs.
In the v vs. t graph, we showed that the slope of the line showed an increase (change) in velocity over time.
∆v / t = acceleration.
Because this change in velocity over time is a constant change in velocity, that means the acceleration itself is also constant.
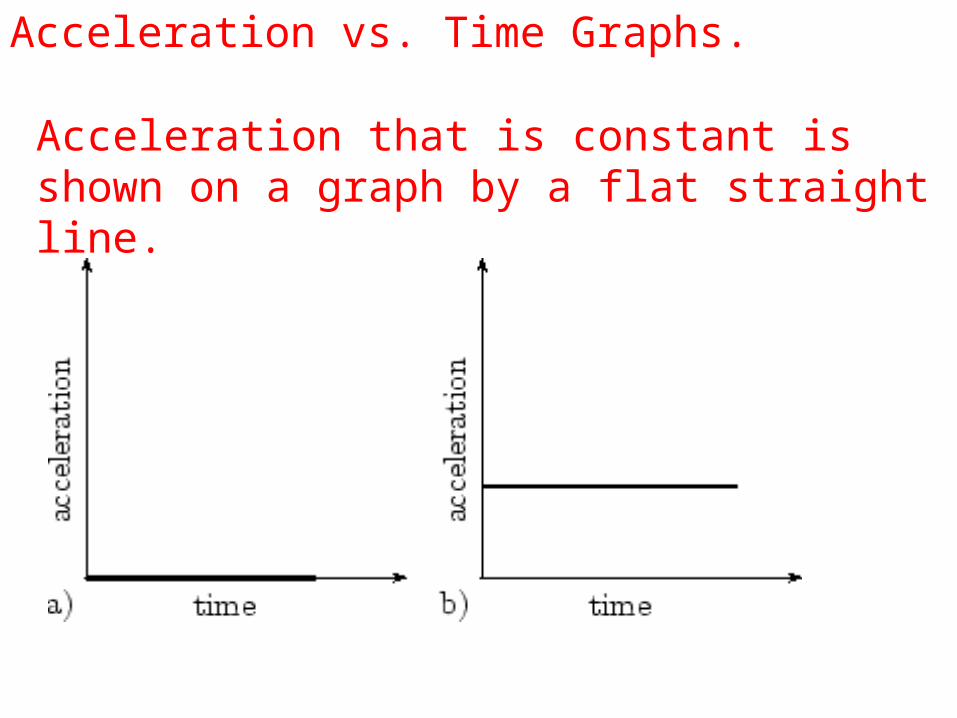
Acceleration vs. Time Graphs.
Acceleration that is constant is shown on a graph by a flat straight line.
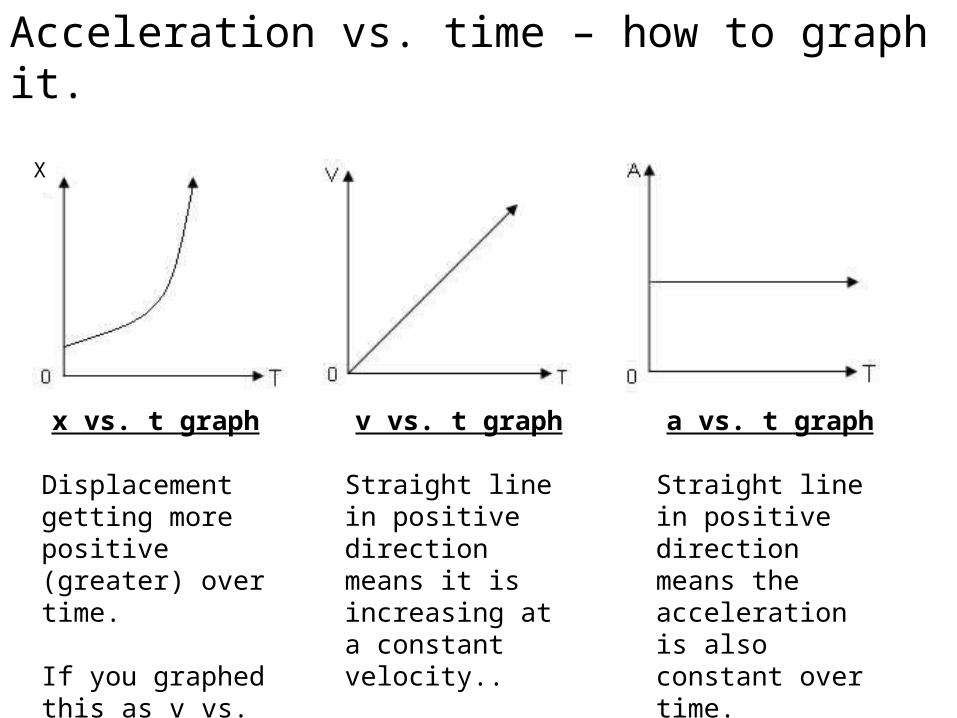
Acceleration vs. time – how to graph it.
X
x vs. t graph
Displacement getting more positive (greater) over time.
If you graphed this as v vs. t it would be…
v vs. t graph
Straight line in positive direction means it is increasing at a constant velocity..
a vs. t graph
Straight line in positive direction means the acceleration is also constant over time.
X
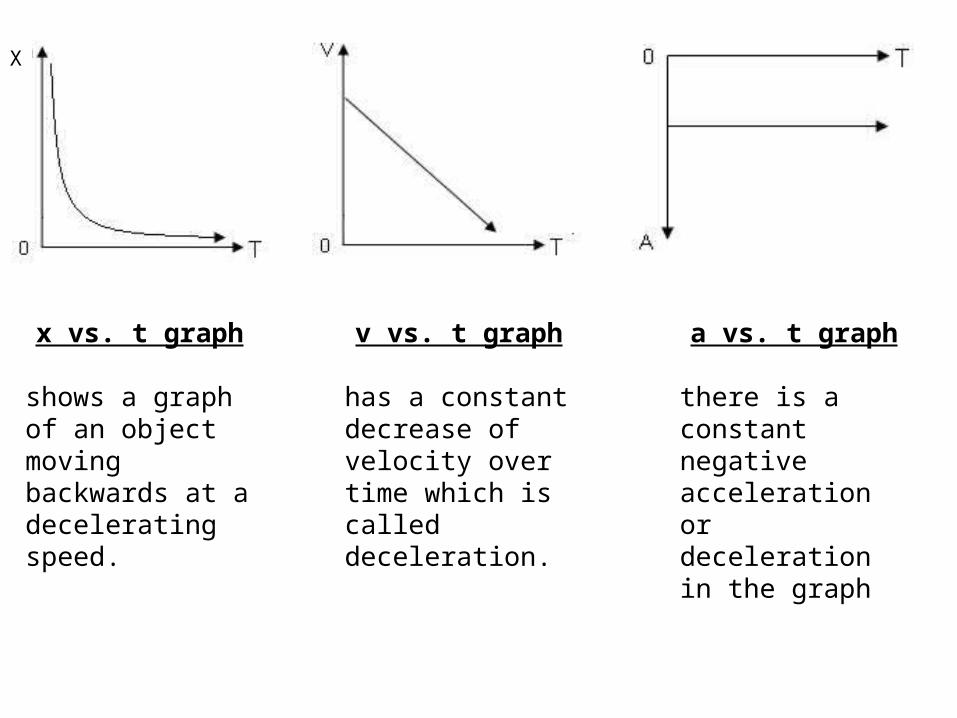
x vs. t graph
shows a graph of an object moving backwards at a decelerating speed.
v vs. t graph
has a constant decrease of velocity overtime which is called deceleration.
a vs. t graph
there is a constant negative acceleration or deceleration in the graph
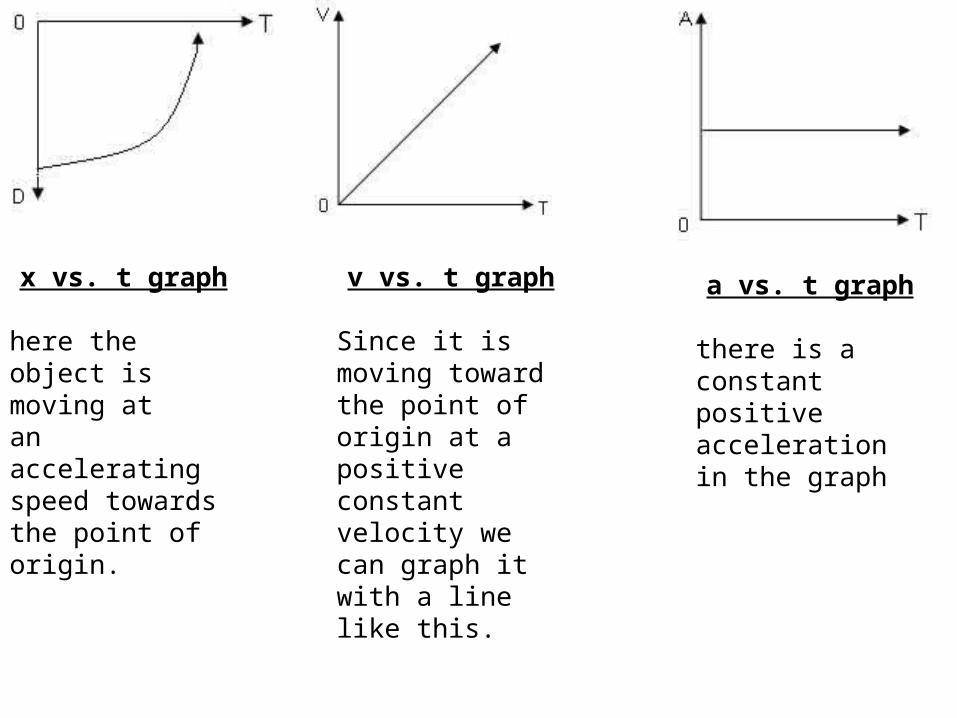
x vs. t graph
here the object is moving atan accelerating speed towards the point of origin.
v vs. t graph
Since it is moving toward the point of origin at a positive constant velocity we can graph it with a line like this.
a vs. t graph
there is a constant positive acceleration in the graph