Graphing Functions. Restricted Domain Sometimes, you are given a specific domain to graph. This...
16
Graphing Functions Graphing Functions
-
Upload
avice-freeman -
Category
Documents
-
view
231 -
download
1
Transcript of Graphing Functions. Restricted Domain Sometimes, you are given a specific domain to graph. This...

Graphing FunctionsGraphing Functions

Restricted DomainRestricted Domain
Sometimes, you are given a specific Sometimes, you are given a specific domain to graph. domain to graph.
This means those are the ONLY points This means those are the ONLY points that can be graphed or the only part of that can be graphed or the only part of the line or curve (segment) that can be the line or curve (segment) that can be graphed. graphed.

Example 1Example 1
Graph the function for the given domain: Graph the function for the given domain: x – 3y = -6; D: {-3, 0, 3, 6}x – 3y = -6; D: {-3, 0, 3, 6}
Replace x with each of these values and solve Replace x with each of these values and solve for y.for y.
-3 – 3y = -6 y = 1-3 – 3y = -6 y = 1 0 – 3y = -6 y = 20 – 3y = -6 y = 2 3 – 3y = -6 y = 33 – 3y = -6 y = 3 6 – 3y = -6 y = 46 – 3y = -6 y = 4 Ordered pairs are (-3, 1)(0, 2)(3, 3)(6, 4)Ordered pairs are (-3, 1)(0, 2)(3, 3)(6, 4) Graph them, but do not connect the dots.Graph them, but do not connect the dots.

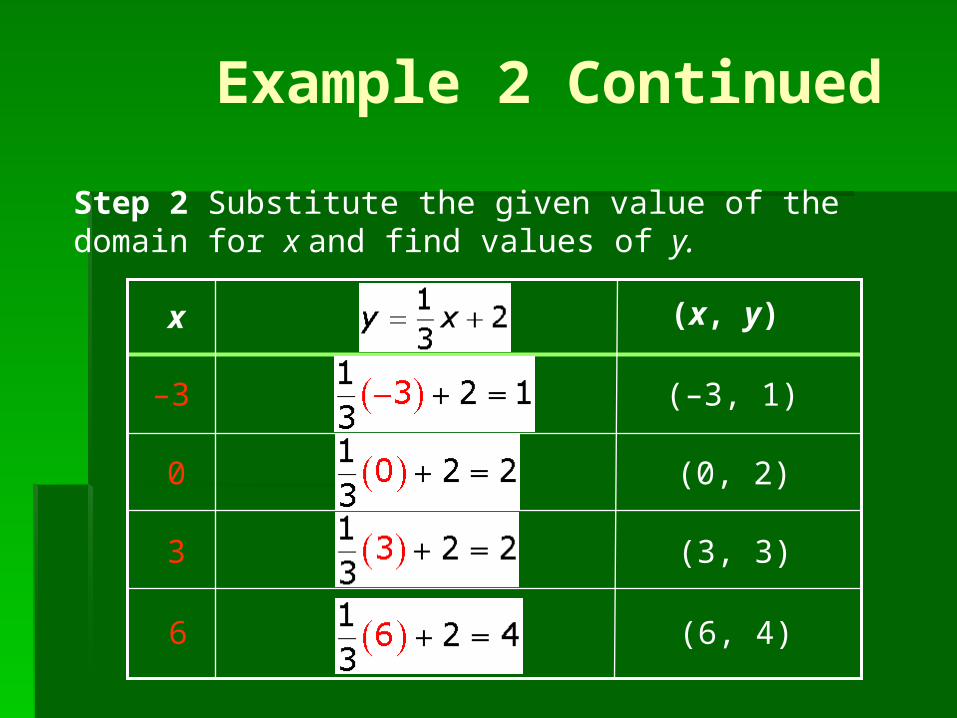
Example 2Example 2Graph the function for the given domain.
x – 3y = –6; D: {–3, 0, 3, 6}
Step 1 Solve for y since you are given values of the domain, or x.
–x –x
–3y = –x – 6
Subtract x from both sides.
Since y is multiplied by –3, divide both sides by –3.
Simplify.
x – 3y = –6
Example 2 Continued
Step 2 Substitute the given value of the domain for x and find values of y.
x (x, y)
–3 (–3, 1)
0 (0, 2)
3 (3, 3)
6 (6, 4)

••
••
y
x
Step 3 Graph the ordered pairs.
Graph the function for the given domain.
Example 2 Continued
If the domain of a function is all real numbers, any number can be used as an input value. This process will produce an infinite number of ordered pairs that satisfy the function. Therefore, arrow are drawn at both “ends” of a smooth line or curve to represent the infinite number of ordered pairs. If a domain is not given, assume that the domain is all real numbers.

Recall that in real-world situations you Recall that in real-world situations you may have to limit the domain to make may have to limit the domain to make answers reasonable. For example, answers reasonable. For example, quantities such as time, distance, and quantities such as time, distance, and number of people can be represented number of people can be represented using only nonnegative values. When using only nonnegative values. When both the domain and the range are both the domain and the range are limited to nonnegative values, the limited to nonnegative values, the function is graphed only in Quadrant I.function is graphed only in Quadrant I.
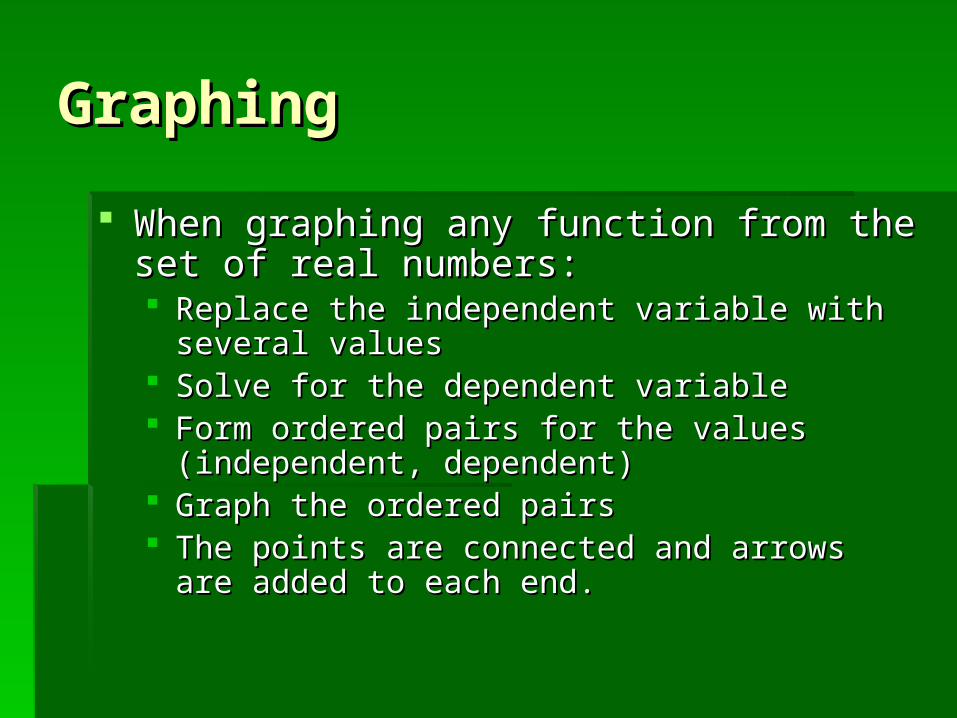
GraphingGraphing
When graphing any function from the set of When graphing any function from the set of real numbers:real numbers: Replace the independent variable with several Replace the independent variable with several
valuesvalues Solve for the dependent variableSolve for the dependent variable Form ordered pairs for the values (independent, Form ordered pairs for the values (independent,
dependent)dependent) Graph the ordered pairsGraph the ordered pairs The points are connected and arrows are added to The points are connected and arrows are added to
each end.each end.
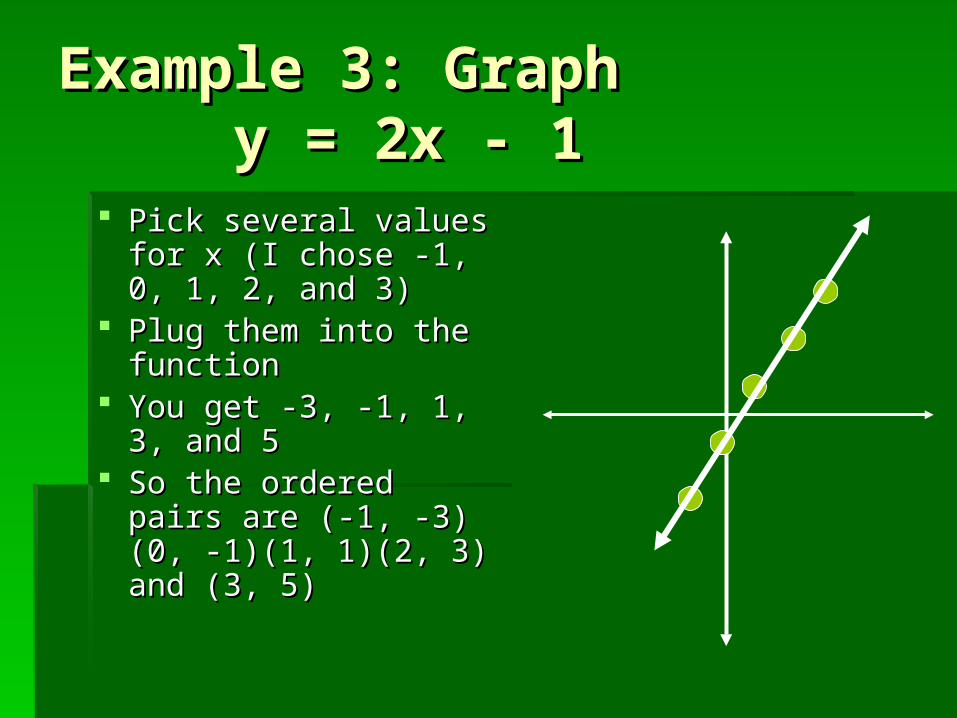
Example 3: Graph Example 3: Graph y = 2x - 1y = 2x - 1
Pick several values Pick several values for x (I chose -1, 0, 1, for x (I chose -1, 0, 1, 2, and 3)2, and 3)
Plug them into the Plug them into the functionfunction
You get -3, -1, 1, 3, You get -3, -1, 1, 3, and 5and 5
So the ordered pairs So the ordered pairs are (-1, -3)(0, -1)(1, are (-1, -3)(0, -1)(1, 1)(2, 3) and (3, 5)1)(2, 3) and (3, 5)

Example 4Example 4
xx – –33xx + 2 = + 2 = yy ((x, yx, y))
Graph the function –3x + 2 = y.
–3(1) + 2 = –11 (1, –1)
0 –3(0) + 2 = 2 (0, 2)
Step 1 Choose several values of x and generate ordered pairs.
–1 (–1, 5)–3(–1) + 2 = 5
–3(2) + 2 = –42 (2, –4)
3 –3(3) + 2 = –7 (3, –7)
–3(–2) + 2 = 8–2 (–2, 8)
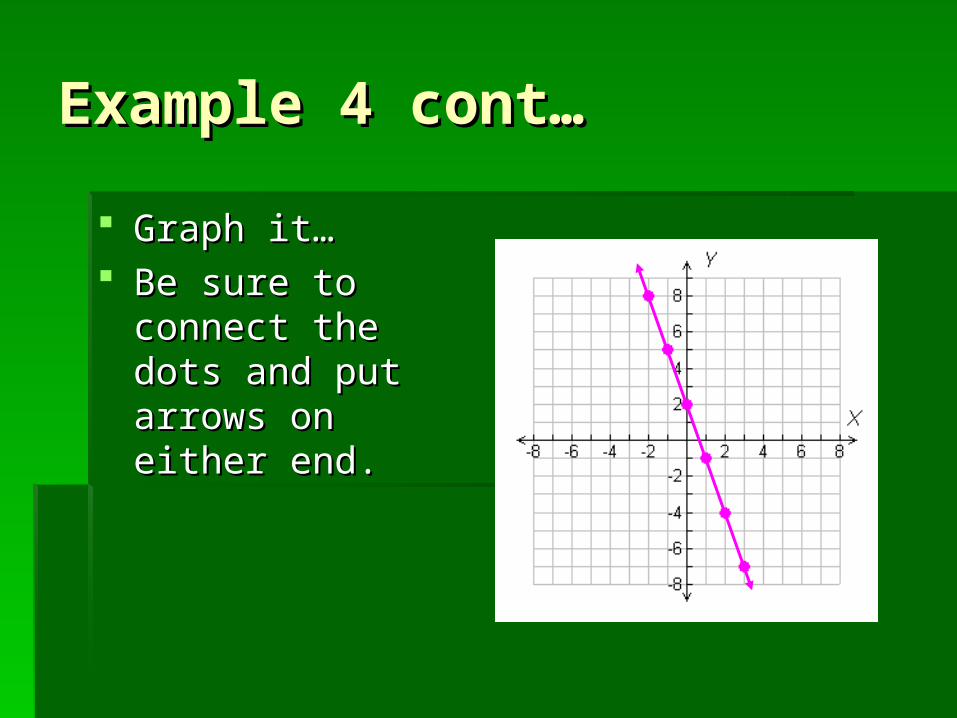
Example 4 cont…Example 4 cont…
Graph it…Graph it… Be sure to connect Be sure to connect
the dots and put the dots and put arrows on either end.arrows on either end.

Use a graph of the function
to find the value of f(x) when x = –4. Check
your answer.
Locate –4 on the x-axis. Move up to the graph of the function. Then move right to the y-axis to find the corresponding value of y.
f(–4) = 6
Example 5Example 5
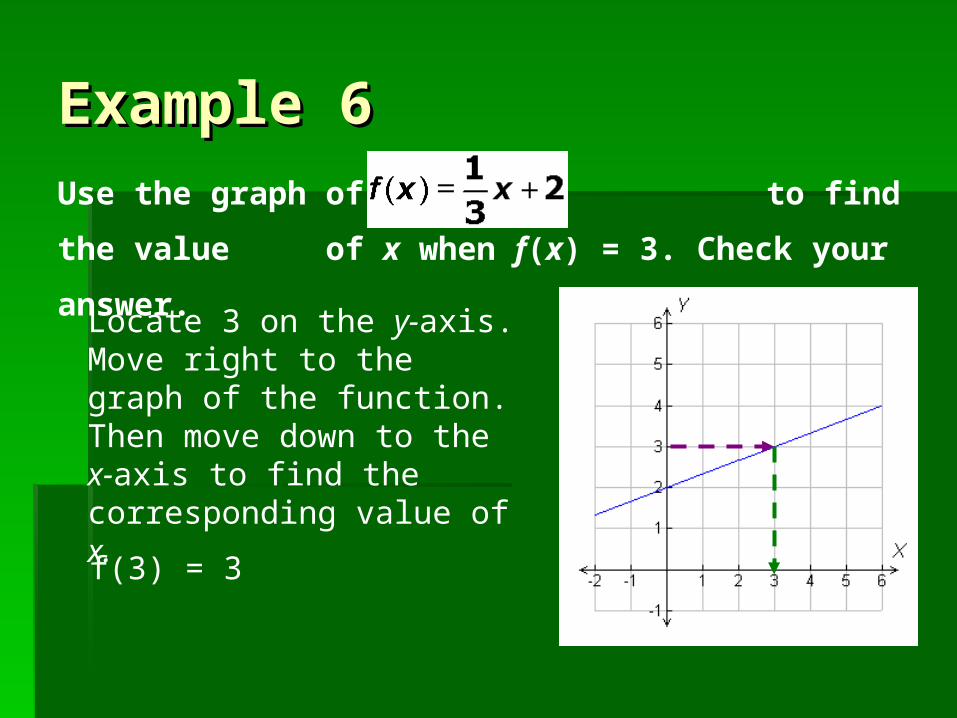
Example 6Example 6Use the graph of to find the value
of x when f(x) = 3. Check your answer.
Locate 3 on the y-axis. Move right to the graph of the function. Then move down to the x-axis to find the corresponding value of x.
f(3) = 3

Try these…Try these…1. Graph the function for the given domain.
3x + y = 4D: {–1, 0, 1, 2}

2. The function y = 3x describes the distance (in inches) a giant tortoise walks in x seconds. Graph the function. Use the graph to estimate how many inches the tortoise will walk in 5.5 seconds.
Answer: About 16.5 in.
Try these (cont)…Try these (cont)…