Graphical Representations AIMS Math Review Spring, 2008.
13
Graphical Representations AIMS Math Review Spring, 2008
-
Upload
callie-lusty -
Category
Documents
-
view
216 -
download
1
Transcript of Graphical Representations AIMS Math Review Spring, 2008.
Graphical RepresentationsAIMS Math ReviewSpring, 2008

Period 1
1. Which situation could this graph depict?a. A person jumped from a tree to the ground.b. A plane landed safely.c. A plane crashed into the runway.d. A person dove into the water.
2. Which of the following real-world situations could best be modeled by the graph?a. the temperature of a pizza after it has been taken out of an ovenb. the height of a person growing from child to adultc. the altitude of a plane during a trip, from take-off to landingd. the amount of gasoline in a car gas tank during a trip
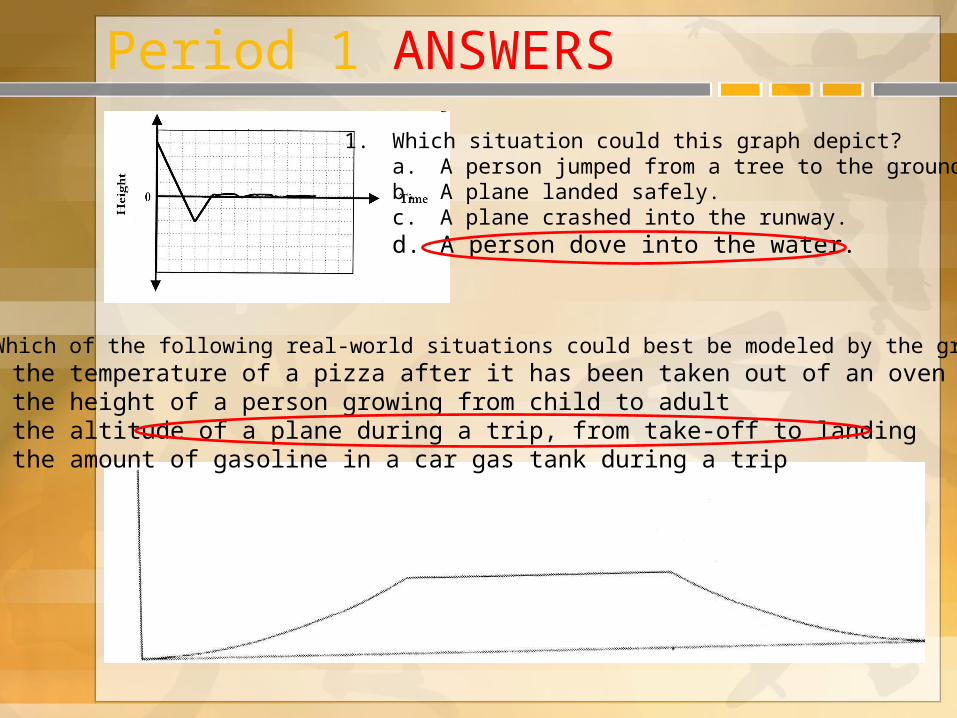
Period 1 ANSWERS
1. Which situation could this graph depict?a. A person jumped from a tree to the ground.b. A plane landed safely.c. A plane crashed into the runway.d. A person dove into the water.
2. Which of the following real-world situations could best be modeled by the graph?a. the temperature of a pizza after it has been taken out of an ovenb. the height of a person growing from child to adultc. the altitude of a plane during a trip, from take-off to landingd. the amount of gasoline in a car gas tank during a trip

Period 2

Period 2 ANSWERS
time time time
time
distance
height
distancedistance
Grams eaten
Calories
Gallons
temperature
time
time
timetime
population height

Period 3
1. What was Ginger’s maximum distance from home?2. When was Ginger furthest away from home?3. What does a distance of 0 mean?4. At what times was she at home?

Period 3 ANSWERS
1. What was Ginger’s maximum distance from home? 2 miles2. When was Ginger furthest away from home?4:15 – 4:45 pm3. What does a distance of 0 mean? She was at home.4. At what times was she at home? 3:15, 3:45 – 4:00, 5:00

Period 4Stem and Leaf
1. Write the numbers represented by the stem and leaf chart.
2. What is the minimum value of situps?3. What is the maximum value of situps?4. What is the mode of situps?5. What is the median of situps?6. What is the mean of situps?
Key: 3 | 6 = 36

Period 4 ANSWERS
Stem and Leaf
1. Write the numbers represented by the stem and leaf chart. 34, 36, 38, 38, 40, 43, 46, 47, 47, 50, 50, 51, 52
2. What is the minimum value of situps? 34
3. What is the maximum value of situps? 52
4. What is the mode of situps? 38, 47, 50 (mode means the most frequently occurring value)
5. What is the median of situps? 46 (middle number of a sequential group is the median)
6. What is the mean of situps? 44 (mean is another name for average)
Key: 3 | 6 = 36

Period 5Box-and-Whisker Graphs
In the sample shown, the minimum (lower extreme) is 15 and the maximum (upper extreme) is 29. The median (middle value) is 21.5. The lower quartile is 19 and the upper quartile is 25. Quartiles split a group into 4. Each box and each whisker represents ¼ or 25% of the total items.
TEST SCORES
To the right is a box-and-whiskers
graph of the most recent test results
for this class.
1. What was the minimum score earned?
2. What was the maximum score earned?
3. What percent of the scores were 80% or better?
4. What percent of the scores fell below 70%?
5. What is the median test score?
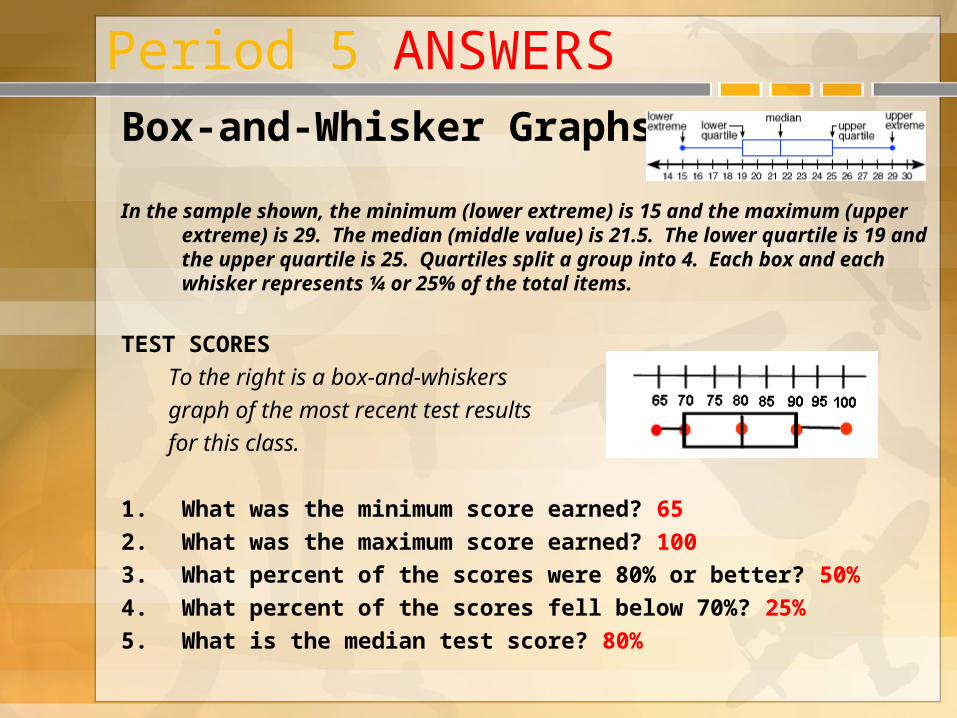
Period 5 ANSWERSBox-and-Whisker Graphs
In the sample shown, the minimum (lower extreme) is 15 and the maximum (upper extreme) is 29. The median (middle value) is 21.5. The lower quartile is 19 and the upper quartile is 25. Quartiles split a group into 4. Each box and each whisker represents ¼ or 25% of the total items.
TEST SCORES
To the right is a box-and-whiskers
graph of the most recent test results
for this class.
1. What was the minimum score earned? 65
2. What was the maximum score earned? 100
3. What percent of the scores were 80% or better? 50%
4. What percent of the scores fell below 70%? 25%
5. What is the median test score? 80%
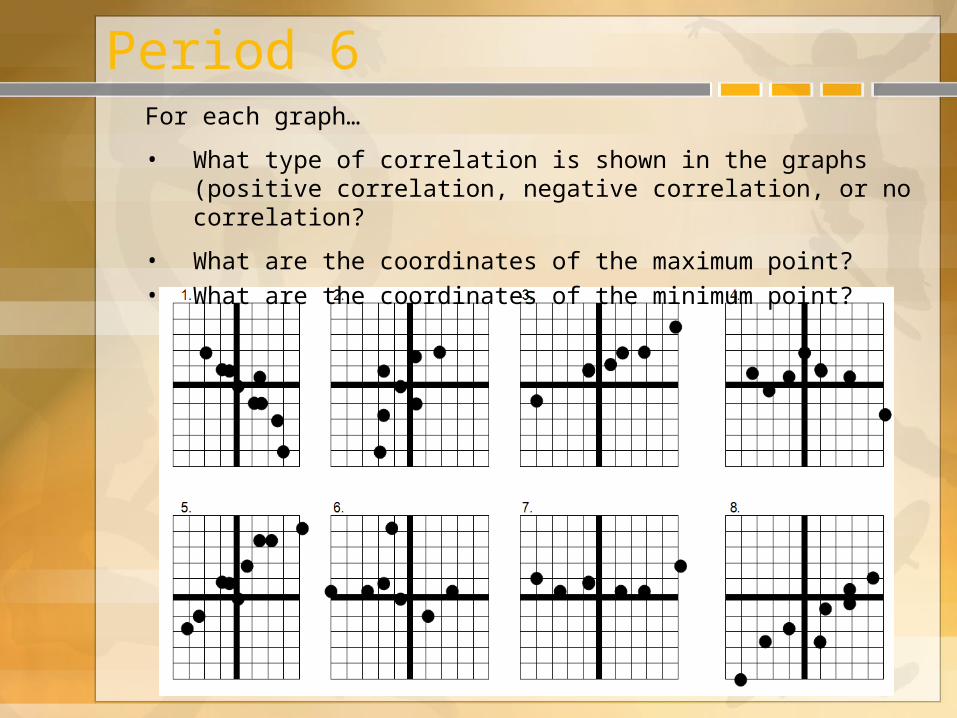
Period 6For each graph…
• What type of correlation is shown in the graphs (positive correlation, negative correlation, or no correlation?
• What are the coordinates of the maximum point?
• What are the coordinates of the minimum point?

Period 6 ANSWERSFor each graph…
• What type of correlation is shown in the graphs (positive correlation, negative correlation, or no correlation?
• What are the coordinates of the maximum point?
• What are the coordinates of the minimum point?
negative positive positive none
positive none none positive