Graphene Quantums Dots Combined with Endonuclease...
7
Graphene Quantums Dots Combined with Endonuclease Cleavage and Bidentate Chelation for Highly Sensitive Electrochemiluminescent DNA Biosensing Jing Lou, Shanshan Liu, Wenwen Tu,* and Zhihui Dai* Jiangsu Collaborative Innovation Center of Biomedical Functional Materials and Jiangsu Key Laboratory of Biofunctional Materials, College of Chemistry and Materials Science, Nanjing Normal University, Nanjing, 210023, P. R. China * S Supporting Information ABSTRACT: A novel strategy for highly sensitive electro- chemiluminescence (ECL) detection of DNA was proposed based on site-specific cleavage of BamHI endonuclease combined with the excellent ECL activity of graphene quantum dots (GQDs) and bidentate chelation of the dithiocarbamate DNA (DTC-DNA) probe assembly. The difference between photoluminescence and ECL spectral peaks suggested that a negligible defect existed on the GQDs surface for generation of an ECL signal. The formed DTC-DNA was directly attached to the gold surface by bidentate anchoring (S−Au−S bonds), which conferred a strong affinity between the ligands and the gold surface, increasing the robustness of DNA immobilization on the gold surface. BamHI endonu- clease site-specifically recognized and cleaved the duplex symmetrical sequence, which made the double-stranded DNA fragments and GQDs break off from the electrode surface, inducing a decrease of the ECL signal. Using hepatitis C virus-1b genotype complementary DNA (HCV-1b cDNA) as a model, a novel signal-off ECL DNA biosensor was developed based on variation of the ECL intensity before and after digestion of the DNA hybrid. Electrochemical impedance spectroscopy confirmed the successful fabrication of the ECL DNA biosensor. This ECL biosensor for HCV-1b cDNA determination exhibited a linear range from 5 fM to 100 pM with a detection limit of 0.45 fM at a signal-to-noise ratio of 3 and showed satisfactory selectivity and good stability, which validated the feasibility of the designed strategy. The proposed strategy may be conveniently combined with other specific biological recognition events for expansion of the biosensing application, especially in clinical diagnoses. R apid and sensitive detection of specific DNA with ultralow concentrations has attracted considerable interest because of its broad applications in infectious diseases, genetic therapy, and early screening of diseases. 1 In recent years, numerous DNA detection systems have been proposed for the detection of DNA sequences by photoelectrochemical, 2 optical, 3,4 electrochemical, 5 or electrochemiluminescence (ECL) 6,7 tech- niques. The effective immobilization of the DNA probe has been considered as an essential factor to develop an efficient DNA biosensor for its applications in clinical assay and diagnoses. 8 In order to enhance the stability of the DNA probe immobilized on the electrode surface, various immobilization strategies such as covalent coupling, 9,10 adsorption, 11 cross- linking, 12 and copolymerization 13 have been explored. Among these methods, a self-assembled monolayer of thiolated single- stranded DNA (ssDNA) chemisorbed on the gold surface was the most widespread immobilization strategy. 14,15 However, the thiolated ssDNA was easily oxidized by the oxidizing agents present in solution. 16 Thus, it was urgent to establish a simple and effective strategy for DNA immobilization on the gold electrode (GE) surface. In this work, amine-modi fied oligonucleotides easily reacted with CS 2 to generate DNA with dithiocarbamate (DTC) ligands in situ. 17 The formed DTC-DNA directly attached onto the gold surface by bidentate anchoring (S−Au−S bonds), which conferred a stronger affinity between the ligands and the gold surface than that of the thiolated ssDNA linked to the gold surface (Au−S bond), increasing the robustness of DNA immobilization on the gold surface. In addition, the restriction endonuclease was a well- studied class of DNA-binding proteins, which played significant roles in life processes, such as DNA replication, recombination, repair, and genotyping. 18−20 Its highly specific interactions with their DNA recognition sites provided exciting possibilities for the advanced development of novel analytical methods. 21 Through the endonuclease-stimulated regeneration of the analyte, the fluorescent aptasensors have been designed to detect adenosine triphosphate, vasopressin, and cocaine. 22 On the basis of site-specific cleavage of BamHI endonuclease and enzymatic signal amplification, a electrochemical method to detect the hepatitis C virus was developed. 23 Received: October 5, 2014 Accepted: December 19, 2014 Published: December 19, 2014 Article pubs.acs.org/ac © 2014 American Chemical Society 1145 DOI: 10.1021/ac5037318 Anal. Chem. 2015, 87, 1145−1151
-
Upload
dinhnguyet -
Category
Documents
-
view
215 -
download
0
Transcript of Graphene Quantums Dots Combined with Endonuclease...

Graphene Quantums Dots Combined with Endonuclease Cleavageand Bidentate Chelation for Highly SensitiveElectrochemiluminescent DNA BiosensingJing Lou, Shanshan Liu, Wenwen Tu,* and Zhihui Dai*
Jiangsu Collaborative Innovation Center of Biomedical Functional Materials and Jiangsu Key Laboratory of Biofunctional Materials,College of Chemistry and Materials Science, Nanjing Normal University, Nanjing, 210023, P. R. China
*S Supporting Information
ABSTRACT: A novel strategy for highly sensitive electro-chemiluminescence (ECL) detection of DNA was proposedbased on site-specific cleavage of BamHI endonucleasecombined with the excellent ECL activity of graphenequantum dots (GQDs) and bidentate chelation of thedithiocarbamate DNA (DTC-DNA) probe assembly. Thedifference between photoluminescence and ECL spectral peakssuggested that a negligible defect existed on the GQDs surfacefor generation of an ECL signal. The formed DTC-DNA wasdirectly attached to the gold surface by bidentate anchoring(S−Au−S bonds), which conferred a strong affinity betweenthe ligands and the gold surface, increasing the robustness ofDNA immobilization on the gold surface. BamHI endonu-clease site-specifically recognized and cleaved the duplex symmetrical sequence, which made the double-stranded DNA fragmentsand GQDs break off from the electrode surface, inducing a decrease of the ECL signal. Using hepatitis C virus-1b genotypecomplementary DNA (HCV-1b cDNA) as a model, a novel signal-off ECL DNA biosensor was developed based on variation ofthe ECL intensity before and after digestion of the DNA hybrid. Electrochemical impedance spectroscopy confirmed thesuccessful fabrication of the ECL DNA biosensor. This ECL biosensor for HCV-1b cDNA determination exhibited a linear rangefrom 5 fM to 100 pM with a detection limit of 0.45 fM at a signal-to-noise ratio of 3 and showed satisfactory selectivity and goodstability, which validated the feasibility of the designed strategy. The proposed strategy may be conveniently combined with otherspecific biological recognition events for expansion of the biosensing application, especially in clinical diagnoses.
Rapid and sensitive detection of specific DNA with ultralowconcentrations has attracted considerable interest because
of its broad applications in infectious diseases, genetic therapy,and early screening of diseases.1 In recent years, numerousDNA detection systems have been proposed for the detectionof DNA sequences by photoelectrochemical,2 optical,3,4
electrochemical,5 or electrochemiluminescence (ECL)6,7 tech-niques. The effective immobilization of the DNA probe hasbeen considered as an essential factor to develop an efficientDNA biosensor for its applications in clinical assay anddiagnoses.8 In order to enhance the stability of the DNA probeimmobilized on the electrode surface, various immobilizationstrategies such as covalent coupling,9,10 adsorption,11 cross-linking,12 and copolymerization13 have been explored. Amongthese methods, a self-assembled monolayer of thiolated single-stranded DNA (ssDNA) chemisorbed on the gold surface wasthe most widespread immobilization strategy.14,15 However, thethiolated ssDNA was easily oxidized by the oxidizing agentspresent in solution.16 Thus, it was urgent to establish a simpleand effective strategy for DNA immobilization on the goldelectrode (GE) surface. In this work, amine-modifiedoligonucleotides easily reacted with CS2 to generate DNA
with dithiocarbamate (DTC) ligands in situ.17 The formedDTC-DNA directly attached onto the gold surface by bidentateanchoring (S−Au−S bonds), which conferred a strongeraffinity between the ligands and the gold surface than that ofthe thiolated ssDNA linked to the gold surface (Au−S bond),increasing the robustness of DNA immobilization on the goldsurface. In addition, the restriction endonuclease was a well-studied class of DNA-binding proteins, which played significantroles in life processes, such as DNA replication, recombination,repair, and genotyping.18−20 Its highly specific interactions withtheir DNA recognition sites provided exciting possibilities forthe advanced development of novel analytical methods.21
Through the endonuclease-stimulated regeneration of theanalyte, the fluorescent aptasensors have been designed todetect adenosine triphosphate, vasopressin, and cocaine.22 Onthe basis of site-specific cleavage of BamHI endonuclease andenzymatic signal amplification, a electrochemical method todetect the hepatitis C virus was developed.23
Received: October 5, 2014Accepted: December 19, 2014Published: December 19, 2014
Article
pubs.acs.org/ac
© 2014 American Chemical Society 1145 DOI: 10.1021/ac5037318Anal. Chem. 2015, 87, 1145−1151
ECL combined chemiluminescence with electrochemistrytechniques and exhibited unique advantages, such as simplifiedsetup, low background signal, and high sensitivity.24 As ECLluminophores, gold clusters, cadmium-containing quantumdots (QDs), and carbon dots have been extensively reportedin recent years.25−27 Graphene quantum dots (GQDs), as thenew member of the nanocarbon family, compared with the goldcluster, cadmium-containing QDs, and carbon dots, exhibitedlow cost, large specific surface area, unique electro-opticalproperties, low toxicity, robust chemical inertness, andattractive biocompatibility.28−32 Especially, GQDs have beenused to construct a few ECL sensors, such as the ECL sensorfor detection of Cd2+29 and Pb2+,33 which became promising tosubstitute traditional QDs as ECL luminophores. Moreover,only one work has referred to the ECL DNA biosensors basedon GQDs up to now,34 which was based on resonance energytransfer between GQDs and gold nanoparticles for DNAdetection. However, its low sensitivity limited its application.This work designed a novel strategy for highly sensitive ECLdetection of DNA based on site-specific cleavage of BamHIendonuclease combined with the excellent ECL activity ofGQDs and bidentate chelation of the DTC-DNA probeassembly. Obviously, its strategy was different from that ofthe previous report.34 In addition, its analytical performancewas much better than that of the previous report.34
Herein, a novel strategy for the highly sensitive ECLdetection of DNA was proposed based on site-specific cleavageof BamHI endonuclease combined with the excellent ECLactivity of GQDs and bidentate chelation of the DTC-DNAprobe assembly. Using hepatitis C virus-1b genotypecomplementary DNA (HCV-1b cDNA) as a model, theBamHI endonuclease site-specifically recognized and cleavedthe duplex symmetrical sequence 5′-GGATCC-3′,35 whichmade the double-stranded DNA (dsDNA) fragments and theGQDs break off from the electrode surface, leading to a declineof the ECL intensity. On the basis of variation of the ECLintensity before and after digestion of the DNA hybrid, a novelsignal-off ECL DNA biosensor was developed (Scheme 1).Moreover, the probe DTC-DNA with DTC ligands directlyassembled on the gold surface by bidentate chelation enhancedthe robustness of DNA immobilization, improving the stabilityof this biosensor. This designed signal-off ECL DNA biosensorexhibited good analytical performance, which provided an
alternative method for the highly sensitive determination ofDNA.
■ EXPERIMENTAL SECTION
Materials and Reagents. Tris(hydroxymethyl)-aminomethane (Tris) was purchased from Alfa Aesar Co. 3-Mercapto-1-hexanol (MCH), N-hydroxysuccinimide (NHS;98%), and N-[3-(dimethylamino)propyl]-N′-ethylcarbodiimide(EDC) were purchased from Sigma-Aldrich Co. BamHIendonuclease was obtained from New England Biolabs Ltd.(United Kingdom). Citric acid monohydrate (CA), carbondisulfide (CS2), and ethylenediamine were obtained fromSinopharm Chemical Reagent Co., Ltd. (Shanghai, China).Other chemicals were of analytical reagent grade. Tris-HClbuffer saline (0.05 mol L−1, pH 7.4) containing 0.1 M K2S2O8and 0.1 M KCl was used as the test solution. The pH value ofthe Tris-HCl buffer saline was 7.4 except where otherwiseindicated. The washing solution was 0.01 M Tris-HCl buffersaline. Ultrapure water obtained from a water purificationsystem (≥18 MΩ·cm, MST-I-10, Shanghai Mosu ScienceEquipment Co, Ltd., China) was used in all measurements. TheDNA strands were purchased from Sangon Biological Engineer-ing Technology & Company Ltd. (Shanghai, China) andpurified with high-performance liquid chromatography. Theirbase sequences are as follows: probe DNA, 5′-COOH-AACGTCGGATCCCGCGTCGCC-(CH2)6-NH2-3′; targetDNA, 5′-GGCGACGCGGGATCCGACGTT-3′; M1, 5′-GGCGACGCGGGTTCCGACGTT - 3 ′ ; M 2 , 5 ′ -GGCGTCGCGGGATCCGACGTT - 3 ′ ; M 3 , 5 ′ -GGCGAGGCGGGATCCCACGTT-3′.
Apparatus. The ECL emission was detected with an MPI-AECL analyzer (Xi’An Remax Electronic Science & TechnologyCo. Ltd., Xi’An, China). All experiments were carried out atroom temperature using a conventional three-electrode systemwith a modified GE (2 mm diameter) as the working electrode,a platinum wire as the auxiliary electrode, and an Ag/AgClelectrode as the reference electrode. The emission window wasplaced in front of the photomultiplier tube, which was biased at800 V. Ultraviolet−visible (UV−vis) absorption spectra wereobtained on a Cary 50 spectrophotometer (Varian, USA).Photoluminescence (PL) spectra were recorded on a CaryEclipse spectrometer (Varian, USA). Electrochemical impe-dance spectroscopy (EIS) was carried out with an Autolabpotentiostat/galvanostat PGSTAT302N (Eco Chemie BV, TheNetherlands) and controlled by Nova 1.10 software with athree-electrode system, in KCl solution (0.1 mol L−1)containing a 1:1 K3Fe(CN)6/K4Fe(CN)6 (5.0 mmol L−1)mixture as a redox probe from 0.1 Hz to 100 kHz with a signalamplitude of 10 mV. A transmission electron microscopy(TEM) image was taken using a Hitachi H-7650 typetransmission electron microscope at an accelerating voltage of80 kV (Hitachi, Japan). A Fourier transform infrared (FTIR)spectrum was acquired on Tensor 27 (Bruker, Germany) in therange of 400−4000 cm−1 at room temperature.
Synthesis of GQDs and DTC-DNA. The GQDs weresynthesized according to the previous report36 with mod-ification. Briefly, 2 g of citric acid was placed in a 5 mL beakerand heated to 200 °C by a heating mantle for 30 min, until thewhite solid citric acid changed to an orange liquid. Then, acertain amount of a 10 mg mL−1 NaOH solution was added inthe orange liquid drop by drop, with continuous vigorousstirring, until the pH value of the solution was adjusted to 7 to
Scheme 1. Schematic Illustration of the ECL BiosensorBased on GQDs Combined with Endonuclease Cleavage andBidentate Chelation
Analytical Chemistry Article
DOI: 10.1021/ac5037318Anal. Chem. 2015, 87, 1145−1151
1146

obtain a GQDs solution. The attained GQDs solution wasstored at 4 °C in a refrigerator.DTC-DNA was prepared with amine-modified ssDNA
according to the previous work.17 Briefly, 100 μM CS2 reactedwith an equimolar concentration of amine-modified ssDNA in10 mM borate buffer saline (pH 9.0) for 1 h under stirring, andthen DTC-DNA was obtained.Fabrication of an ECL DNA Biosensor. The GE was
polished carefully with 0.05 μm α-Al2O3 powders on chamoisleathers and washed ultrasonically with water and ethanol,respectively. Then the electrode was electrochemically cleanedin a 0.5 M H2SO4 solution with scanning from −0.3 and 1.6 V,followed by drying under nitrogen. DTC-DNA (4 μL, 1 μM)was dropped onto the GE and kept overnight at 4 °C, followedby washing to remove non-grafted DNA. The amount of probeDNA on the electrode surface was excessive, which shouldresult in a saturated layer on the surface of the electrode. Thus,the probe DNA fully covered the electrode surface. DTC-DNAassembled on the GE via bidentate chelation (S−Au−S bonds).Afterward, the DTC-DNA-modified GE was immersed in a 1mM MCH solution for 1 h to block the uncovered surface andreduce the nonspecific adsorption and then rinsed. Sub-sequently, the DTC-DNA/MCH-modified GE was activatedby immersion in a EDC/NHS mixture (5 mM EDC, 10 mMNHS in 10 mM Tris-HCl buffer saline, pH 7.4) for 40 min.Then 4 μL of an ethylenediamine solution (4.0 wt %) wasdropped on the electrode surface and dried under air to obtaina DTC-DNA/MCH/ethylenediamine-modified GE. Finally, 4μL of a GQDs solution was dropped onto the electrode. Afterrinsing with 0.01 M Tris-HCl buffer saline, the ECL DNAbiosensor was obtained.Measurement Procedure. A total of 5 μL of different
concentrations of target DNA was applied to a DTC-DNA/MCH/ethylenedianmine/GQDs-modified GE and incubated at37 °C for 2 h. The different electrodes were used forhybridization of target DNA from low to high concentration.Subsequently, the modified GE was swilled thoroughly toremove unbounded target DNA. Then BamHI endonucleasecleavage was performed by incubating the dsDNA hybrid inTris-HCl buffer saline containing BamHI endonuclease (20 U/μL), MgCl2 (10 mM), and NaCl (100 mM) at 37 °C for 2 h.After cleavage, the DTC-DNA/MCH/ethylenedianmine/GQDs/target/BamHI-modified GE was thoroughly washedand transferred into Tris-HCl buffer saline (0.05 M, pH 7.4)containing 0.1 M K2S2O8 and 0.1 M KCl to record the ECLresponse of the biosensor between 0 and −2.0 V at 100 mV s−1.The emission window was placed in front of the photo-multiplier tube, which was biased at 800 V.
■ RESULTS AND DISCUSSION
Characterization. As shown in the TEM image (Figure1A), although some parts of the GQDs were shown to be inclose contact, they were well dispersed in aqueous solution.The well dispersion of GQDs was beneficial for electrontransfer between GQDs and the electrode, which wasadvantageous for the construction of highly sensitive ECLbiosensors. In addition, the size of the GQDs was estimated tobe 20 nm (Figure 1A, inset). A FTIR spectrum was used tocharacterize the carboxyl group on GQDs (Figure 1B). TheCO and O−H stretching vibrations of the carboxyl groupwere observed at 1729 and 3454 cm−1, respectively. In addition,the C−O and O−H deformation peak at 1404 and 1220 cm−1,
respectively, also appeared. These results suggested that thesurface of GQDs existed as a carboxyl group.UV−vis absorption and PL spectra were used to further
confirm the formation of GQDs (Figure 2). The UV−vis
absorption of GQDs showed a well-defined absorption band at348 nm, while that of citric acid exhibited no obviousabsorption from 305 to 800 nm (Figure 2A), indicating theformation of GQDs prepared by direct pyrolysis of citric acid.36
At a concentration of 1.4 mg mL−1, the solution of GQDs washomogeneous and very stable, even for a storage period ofseveral months (Figure 2A, inset). The solution of GQDspresented as blue under UV-light irradiation, while it wascolorless and transparent under visible-light irradiation. Thedeeper color of GQDs under UV-light irradiation suggested theformation of GQDs. The PL spectra of GQDs solutionexhibited a maximum emission wavelength at 465 nm and amaximum excitation wavelength at 385 nm (Figure 2B), whichalso verified the successful preparation of GQDs.36
EIS effectively investigated the stepwise assembly process ofthe DNA biosensor. As shown in Figure 3A, the bare gold
Figure 1. (A) TEM image of GQDs. Inset: size distribution of GQDs.(B) FTIR spectrum of GQDs.
Figure 2. (A) UV−vis absorption spectra of CA and the GQDs. Inset:photographs of the GQDs solution taken under visible-light (left) andUV-light (365 nm, right) irradiation. (B) PL spectra of the GQDs.
Figure 3. (A) EIS spectra of (a) bare GE, (b) DTC-DNA, (c) DTC-DNA/MCH, (d) DTC-DNA/MCH/ethylenediamine, (e) DTC-DNA/MCH/ethylenedianmine/GQDs, (f) DTC-DNA/MCH/ethyl-enedianmine/GQDs/target (0.5 pM), and (g) DTC-DNA/MCH/ethylenedianmine/GQDs/target/BamHI-modified GEs. Inset: ex-panded view of the EIS spectra of parts a and d−g. (B) EIS spectraof the proposed DNA biosensor to different concentrations of targetDNA: 0.5 pM (a); 1 pM (b); 5 pM (c); 10 pM (d).
Analytical Chemistry Article
DOI: 10.1021/ac5037318Anal. Chem. 2015, 87, 1145−1151
1147
electrode exhibited a lowest electron-transfer resistance (Ret)toward the redox couple (curve a). When DTC-DNA wascoated onto the gold electrode, Ret increased significantly(curve b), which was attributed to the fact that the negativelycharged phosphate backbone of DTC-DNA repelled transfer ofthe negatively charged probe (Fe(CN)6
3−/4−). After the DTC-DNA-modified electrode was immersed into a 1 mM MCHsolution, Ret further increased owing to its poor conductivity(curve c). However, Ret decreased dramatically after ethyl-enediamine was immobilized on the electrode via EDC/NHSactivation (curve d), which might be attributed to the fact thatethylenediamine with a positive charge attracted the negativelycharged probe (Fe(CN)6
3−/4−). Subsequently, Ret increased alittle when the GQDs covalently bonded to ethylenediaminethrough the interaction between the amine and carboxyl groups(curve e), which indicated that the GQDs were successfullybonded to ethylenediamine. Ret further increased afterhybridization with target DNA (curve f), implying that efficientDNA hybridization occurred on the modified electrode surface.In order to demonstrate efficient hybridization, probe DNAhybridized with a series of concentrations of target DNA. Asshown in Figure 3B, Ret increased step by step afterhybridization with 0.5 pM (curve a), 1 pM (curve b), 5 pM(curve c), and 10 pM (curve d) target DNA, indicating efficienthybridization. After the DTC-DNA/MCH/ethylenedianmine/GQDs/target-modified electrode was treated with BamHI, Retdecreased (curve g). The decreased Ret could be attributed tothe following reason. BamHI cleaved the dsDNA, and then thedsDNA fragments and GQDs were broken off from theelectrode surface, which weakened the steric hindrance andaccelerated electron transfer between the redox probe andelectrode surface. These changes of electron-transfer resistanceverified the successful fabrication of the ECL DNA biosensinginterface.ECL Behaviors. As shown in Figure S-1A of the Supporting
Information, upon successive scans for 8 cycles, the DTC-DNA/ethylenediamine/GQDs/target (0.5 pM)/BamHI-modi-fied GE showed stabile cyclic voltammetry (CV) peaks; apartfrom the reduction peak of S2O8
2− at about −0.85 V,29 the CVcurve of the DTC-DNA/ethylenediamine/GQDs/target/BamHI-modified GE showed a weak reduction peak at about−1.33 V (Figure 4A). This weak peak might be assigned to thereduction peak of GQDs.29 The control experiments (Figure S-2 of the Supporting Information) were performed to furtherconfirm that the weak peak was attributed to GQDs. The bareGE showed a reduction peak of S2O8
2− (curve a), and afterlayer-by-layer assembly, the DTC-DNA-modified (curve b),DTC-DNA/MCH-modified (curve c), and DTC-DNA/MCH/ethylenediamine-modified (curve d) GEs also showed areduction peak of S2O8
2−. However, when the GQDs covalentlybonded to ethylenediamine through interaction between theamine and carboxyl groups, apart from the reduction peak ofS2O8
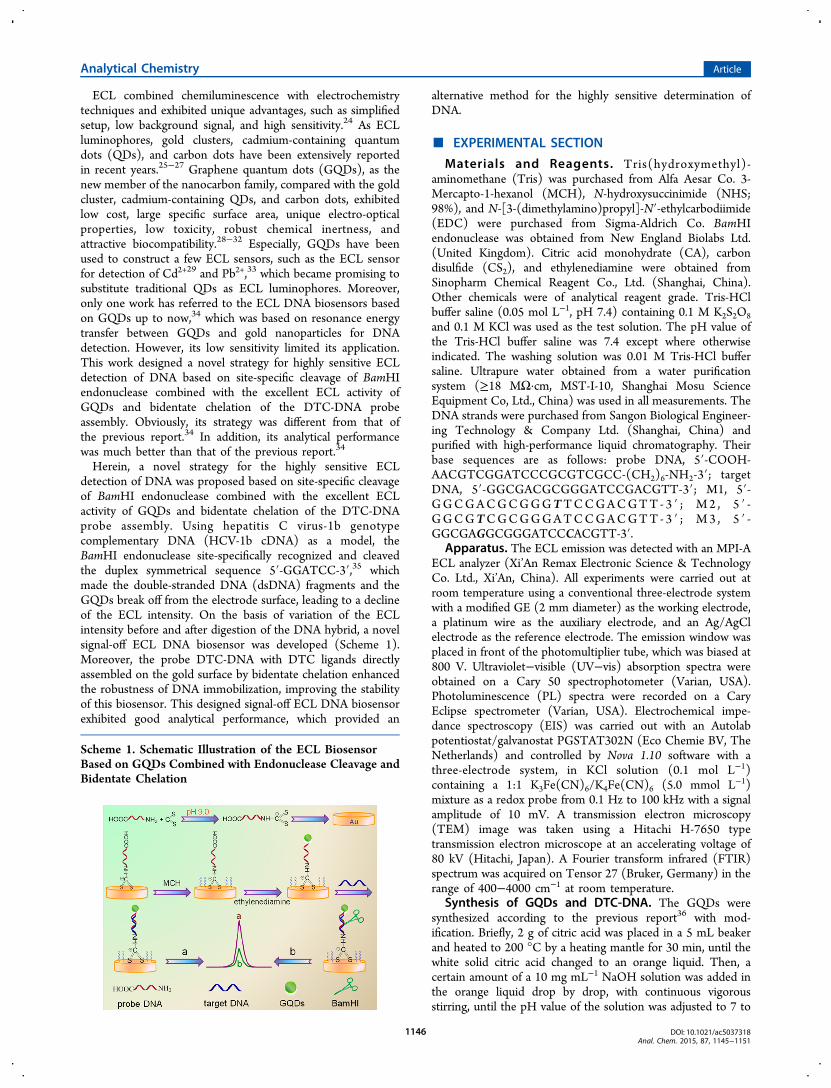
2−, the DTC-DNA/MCH/ethylenediamine/GQDs-modi-fied GE showed another weak peak (curve e), which might beattributed to the reduction of GQDs. As shown in Figure 4B,the ECL spectra of GQDs obtained from an optical filter with aseries of wavelengths showed an emission peak at 474 nm,while the PL emission spectrum of GQDs exhibited a peak at464 nm (excited at 385 nm). This 10 nm difference of spectralpeaks suggested that the GQDs surface contained a negligibledefect for producing an ECL signal.29,37
As shown in Figure 4C, the reduction of GQDs started atabout −0.85 V with an intense ECL emission at −1.97 V. The
GQDs-modified GE was obtained when 4 μL of GQDs wasdropped on the GE and then dried under the air. Subsequently,the GQDs-modified GE was transferred into Tris-HCl buffersaline (0.05 M, pH 7.4) containing 0.1 M K2S2O8 and 0.1 MKCl to record the ECL response between 0 and −2.0 V at 100mV s−1. The emission window was placed in front of thephotomultiplier tube, which was biased at 800 V. In Figure 7B,upon successive scans for 7 cycles, the ECL intensity tended tolevel off with a relative standard deviation of 1.9%, whichsuggested that the DNA biosensor possessed good stability.These results validated that desorption of the thiol moleculesand other derivatives has little effect on the ECL DNAbiosensor. Herein, it needs be pointed out that the potentialrange scanned from 0 to −2 V has been extensivelyreported,24,38,39 and some papers have reported that thepotential was more negative than −0.8 V when the thiolmolecules were applied to the fabrication of ECL biosen-sors.40−42 Moreover, no obvious change of the ECL intensitywas observed after scanning by consecutive cyclic voltammo-grams for 8 cycles (Figure S-1B of the SupportingInformation), indicating good stability of GQDs. To be honest,−2 V is not a good potential for ECL. Under this potential,many side reactions, typically including hydrogen evolution anddesorption of the materials, would lower the stability of thefabricated biosensors. We will focus on finding suitablematerials with redox activity before −1 V or +1 V in ourfuture work.The bare GE was transferred into Tris-HCl buffer saline
(0.05 M, pH 7.4; Figure S-3A of the Supporting Information)and Tris-HCl buffer saline (0.05 M, pH 7.4) containing 0.1 MKCl (Figure S-3B of the Supporting Information) to record theECL response between 0 and −2.0 V at 100 mV s−1. Theemission window was placed in front of the photomultipliertube, which was biased at 800 V. The ECL signal was notobserved in Figures S-3A and S-3B of the SupportingInformation. However, when the bare GE was transferredinto Tris-HCl buffer saline (0.05 M, pH 7.4) containing 0.1 MK2S2O8, an obvious ECL response appeared (Figure S-3C ofthe Supporting Information). The results indicated that the
Figure 4. (A) CV curve of the DTC-DNA/ethylenediamine/GQDs/target (0.5 pM)/BamHI-modified GE. (B) PL emission (λex = 385nm) and ECL spectra of GQDs. (C) ECL response of the GQDs-modified GE during a continuous potential scan between 0 and −2.0V. (D) ECL responses of (a) bare GE and (b) DTC-DNA/MCH/ethylenediamine/GQDs/target-modified (0.5 pM), and (c) DTC-DNA/MCH/ethylenediamine/GQDs/target (0.5 pM)/BamHI-modi-fied GEs in 0.05 M Tris-HCl buffer saline containing 0.1 M K2S2O8and 0.1 M KCl.
Analytical Chemistry Article
DOI: 10.1021/ac5037318Anal. Chem. 2015, 87, 1145−1151
1148

origination of the ECL response of the bare GE might be fromK2S2O8. A similar phenomenon was reported in previousresearches.43,44 K2S2O8 was the coreactant of the GQDs, whichwas essential for this system. Nevertheless, the ECL intensity ofK2S2O8 was negligible compared with the ECL intensity ofGQDs. After stepwise assembly of the electrode, the ECLintensity (Figure 4D, curve b) is about 5.6-fold that observedfrom bare GE (Figure 4D, curve a) owing to its immobilizationof GQDs on the GE. Excitingly, an obvious decrease of theECL intensity occurred after the electrode was treated withBamHI (Figure 4D, curve c). This phenomenon was becauseBamHI endonuclease could recognize the duplex symmetricalsequence 5′-GGATCC-3′ and catalyze dsDNA cleavage,35
which made the dsDNA fragments and GQDs break off fromthe electrode surface. The abscission of GQDs greatly declinedthe ECL intensity.The probable ECL mechanism of the GQDs was proposed as
follows.29 For one thing, the GQDs immobilized on theelectrode were reduced to GQDs•− by charge injection, whilethe strongly oxidative SO4
•− radicals were generated byelectrochemical reduction of the coreactant S2O8
2−. Foranother, GQDs•− could react with SO4
•− to emit light inaqueous solution. The possible ECL mechanisms are describedwith the following equations:
+ →− •−n nGQDs e GQDs (1)
+ →− − • −S O e S O2 82
2 82
(2)
→ +• − − •−S O SO SO2 82
42
4 (3)
+ → * +•− •− −GQDs SO GQDs SO4 42
(4)
ν* → + hGQDs GQDs (5)
Optimization of the Detection Conditions. Theconcentration of the probe DNA was a significant factorrelevant to the ECL response. Because the concentration of theprobe DNA was in the range of 0.1−1 μM, the quantity of theGQDs attached on the GE depended on the quantity of probeDNA. Therefore, the ECL intensity was enhanced when theconcentration of the probe DNA was increased from 0.1 to 1μM (Figure 5A). It arrived at a maximum of 1 μM. When theconcentration of the probe DNA was over 1 μM, the ECLresponse decreased. Excessive probe DNA immobilized on theelectrode increased the steric hindrance and hindered electrontransfer between GQDs and the GE surface, leading to a sharpdecline of the ECL intensity. Therefore, 1 μM was selected asthe optimal concentration for ECL DNA biosensing.
The concentration of the GQDs was an important parameterfor producing an ECL signal. As shown in Figure 5B, withincreasing concentration of the GQDs from 0.07 to 1.4 mgmL−1, the intensity of the photocurrent increased dramaticallyand then tended to level off with only a slight decline from 1.4to 3.5 mg mL−1, indicating equilibrium of the GQDsconcentration for generating an ECL signal. As an ECL signalsource, a concentration of 1.4 mg mL−1 was sufficient for ECLmeasurement in this system. As a result, 1.4 mg mL−1 waschosen as the optimal concentration.
ECL DNA Biosensing. Under optimal conditions, the ECLresponses to different concentrations of target DNA wereinvestigated. Figure 6 displayed the ECL intensity of the DNA
biosensor without (a) and with (b−j) target DNA withdifferent concentrations. In the presence of target DNA, theECL intensity was lower than that in the absence of targetDNA. The ECL intensity exhibited a linear decrease withincreasing target DNA concentrations from 5 fM to 100 pM(Figure 6, inset). When the target DNA concentration wasmore than 100 pM, it would deviate the linear calibration curve.The calibration plot was constructed by plotting the ECLintensity (I) against log C (C is different concentrations oftarget DNA). The linear equation is
= − ( )I C7300 1015 log target (6)
The sensitivity was 32324 (ECL intensity in cm−2), which wasmuch higher than 2547 (ECL intensity in cm−2) obtained by anultrasensitive ECL DNA biosensor based on luminol-function-alized gold nanoparticles.1 The correlation coefficient was0.9978, and the detection limit was estimated to be 0.45 fM at asignal-to-noise ratio of 3. The linear range was much wider orthe detection limit was lower than some previously reportedworks (Table 1).2−5,7,34,45 Therefore, this signal-off ECL DNAbiosensor exhibited a wide linear response range and highsensitivity in the determination of DNA.
Selectivity and Reproducibility of the ECL DNABiosensor. To assess the selectivity of the proposed ECLdetection method, the ECL responses of the designed
Figure 5. Effects of (A) the probe DNA and (B) GQDsconcentrations on the ECL response of the DNA biosensor in 0.05M Tris-HCl buffer saline containing 0.1 M K2S2O8 and 0.1 M KCl.The concentration of the target was 0.5 pM.
Figure 6. ECL responses of the proposed DNA biosensor to differentconcentrations of target DNA (0, 5 fM, 10 fM, 50 fM, 0.1 pM, 0.5 pM,1 pM, 5 pM, 10 pM, 100 pM, 200 pM, and 500 pM from top tobottom) in 0.05 M Tris-HCl buffer saline containing 0.1 M K2S2O8and 0.1 M KCl between 0 and −2.0 V at 100 mV s−1. The emissionwindow was placed in front of the photomultiplier tube, which wasbiased at 800 V. Inset: linear calibration curve between the ECLintensity and logarithm of the target DNA concentrations.
Analytical Chemistry Article
DOI: 10.1021/ac5037318Anal. Chem. 2015, 87, 1145−1151
1149

biosensor to three mismatched target DNAs with the sameconcentration (M1, with one mismatched base (T) within therecognition sequence; M2, with one mismatched base (T) notwithin the recognition sequence; M3, with two mismatchedbases (G and C) not within the recognition sequence) wereinvestigated under the same experimental conditions (Figure7A). In the presence of target DNA (column b) and M1
(column c), the ECL response decreased 43% and 16%,respectively, compared with that in the blank solution (columna), indicating a satisfactory selectivity of the as-prepared DNAbiosensor. In addition, the decline of the ECL response totarget DNA (column b) was more obvious than that to M2(column d) and M3 (column e). This level of mismatchdiscrimination ability was better than that of other previouslyreported endonuclease cleavage-based DNA biosensors.46
Upon successive scans for 7 cycles (Figure 7B), the ECLintensity tended to level off with a relative standard deviation of1.9%, which suggested that the DNA biosensor possessed goodstability. These results validated the feasibility of the proposedstrategy.
■ CONCLUSIONUsing GQDs as a label and an ECL signal source, combinedwith site-specific recognition of BamHI endonuclease andbidentate chelation of DTC ligands for a DNA probe assembly,a universal ECL biosensing platform was proposed. Thesolution of GQDs was homogeneous and stable, exhibitingblue under UV-light irradiation. This difference between the PLand ECL spectral peaks suggested that the GQDs surfacecontained a negligible defect for producing an ECL signal. The
probe DTC-DNA with DTC ligands directly assembled on thegold surface by bidentate chelation (S−Au−S bonds) enhancedthe robustness of DNA immobilization, improving the stabilityof this biosensor. BamHI endonuclease recognized the duplexsymmetrical sequence and catalyzed dsDNA cleavage, whichmade the dsDNA fragments and GQDs break off from theelectrode surface, leading to an obvious decline of the ECLintensity. Using HCV-1b cDNA as a model combined withendonuclease cleavage and bidentate chelation, a novel ECLDNA biosensor was designed based on variation of the ECLintensity before and after digestion of the DNA hybrid. Thissignal-off ECL DNA biosensor displayed good analyticalperformance, such as wide linear response range, highsensitivity, satisfactory selectivity, and good stability. Thisdesigned strategy provided an alternative method for the highlysensitive detection of DNA. Because different probes couldspecifically bind to different targets, this platform could beconveniently combined with other specific biological recog-nition events for extensive biosensing application.
■ ASSOCIATED CONTENT*S Supporting InformationAdditional information as noted in text. This material isavailable free of charge via the Internet at http://pubs.acs.org/.
■ AUTHOR INFORMATIONCorresponding Authors*Tel./Fax: +86-25-85891051. E-mail: [email protected].*Tel./Fax: +86-25-85891051. E-mail: [email protected] authors declare no competing financial interest.
■ ACKNOWLEDGMENTSThis work was supported by the National Natural ScienceFoundation of China for the project (Grants 21475062,21175069, and 21205061), Natural Science Foundation ofJiangsu (Grant BK2012448), Research Fund for the DoctoralProgram of Higher Education of China (Grants20113207110005 and 20123207120007), and Foundation ofthe Jiangsu Education Committee (Grants 11KJA150003 and12KJB150016). We appreciate the financial support from thePriority Academic Program Development of Jiangsu HigherEducation Institutions.
■ REFERENCES(1) Chai, Y.; Tian, D.; Wang, W.; Cui, H. Chem. Commun. 2010, 46,7560−7562.(2) Yin, H. S.; Sun, B.; Zhou, Y. L.; Wang, M.; Xu, Z. N.; Fu, Z. L.;Ai, S. Y. Biosens. Bioelectron. 2014, 51, 103−108.(3) Hu, R.; Liu, T.; Zhang, X. B.; Huan, S. Y.; Wu, C.; Fu, T.; Tan,W. Anal. Chem. 2014, 86, 5009−5016.
Table 1. Performance Comparison of the Proposed Strategy with That of the Previously Reported Researches
method detection limit (M) linear range (M) material ref
ECL 1.3 × 10⁻⁸ 2.5 × 10⁻⁸−4 × 10⁻⁷ GQDs 34fluorescence 2 × 10⁻¹¹ 5 × 10⁻¹¹−1 × 10⁻¹⁰ perylene diimide 3ECL 4 × 10⁻¹¹ 1 × 10⁻¹⁰−1 × 10⁻⁷ Ru(bpy)3
2+ 7colorimetry 5 × 10⁻¹¹ 5 × 10⁻¹¹−6 × 10⁻⁹ gold nanoparticles 45electrochemistry 1 × 10⁻¹³ 1 × 10⁻¹³−1 × 10⁻¹⁰ ferrocene 5chemiluminescence 3.4 × 10⁻¹² 1 × 10⁻¹⁰−3 × 10⁻⁹ luminol 4photoelectrochemistry 3.5 × 10⁻¹⁴ 1 × 10⁻¹³−5 × 10⁻⁹ Bi2S3 nanorods 2ECL 4.5 × 10⁻¹⁶ 5 × 10⁻¹⁵−1 × 10⁻¹⁰ GQDs this work
Figure 7. (A) ECL responses of the proposed DNA biosensor without(a) and with (b) 1 pM target DNA, (c) 1 pM M1, (d) 1 pM M2, and(e) 1 pM M3 in 0.05 M Tris-HCl buffer saline containing 0.1 MK2S2O8 and 0.1 M KCl between 0 and −2.0 V at 100 mV s−1. Theemission window was placed in front of the photomultiplier tube,which was biased at 800 V. (B) ECL response of the DNA biosensorwith 0.5 pM target DNA under a continuous cyclic potential scanbetween 0 and −2.0 V for 7 cycles at 100 mV s−1. The emissionwindow was placed in front of the photomultiplier tube, which wasbiased at 800 V.
Analytical Chemistry Article
DOI: 10.1021/ac5037318Anal. Chem. 2015, 87, 1145−1151
1150
(4) Luo, M.; Chen, X.; Zhou, G. H.; Xiang, X.; Chen, L.; Ji, X. H.;He, Z. K. Chem. Commun. 2012, 48, 1126−1128.(5) Liu, S. F.; Lin, Y.; Wang, L.; Liu, T.; Cheng, C. B.; Wei, W. J.;Tang, B. Anal. Chem. 2014, 86, 4008−4015.(6) Shan, Y.; Xu, J. J.; Chen, H. Y. Chem. Commun. 2009, 905−907.(7) Li, F.; Yu, Y. Q.; Li, Q.; Zhou, M.; Cui, H. Anal. Chem. 2014, 86,1608−1613.(8) Sassolas, A.; Blum, L. J.; Leca-Bouvier, B. D. Biotechnol. Adv.2012, 30, 489−511.(9) Nie, G. M.; Bai, Z. M.; Yu, W. Y.; Chen, J. Biomacromolecules2013, 14, 834−840.(10) Wu, M. S.; Yuan, D. J.; Xu, J. J.; Chen, H. Y. Anal. Chem. 2013,85, 11960−11965.(11) Kaufmann, R.; Averbukh, I.; Naaman, R.; Daube, S. S. Langmuir2008, 24, 927−931.(12) Arrabito, G.; Reisewitz, S.; Dehmelt, L.; Bastiaens, P. I.;Pignataro, B.; Schroeder, H.; Niemeyer, C. M. Small 2013, 9, 4243−4249.(13) Krpetic, Z.; Singh, I.; Su, W.; Guerrini, L.; Faulds, K.; Burley, G.A.; Graham, D. J. Am. Chem. Soc. 2012, 134, 8356−8359.(14) Lou, X. H.; Zhao, T.; Liu, R.; Ma, J.; Xiao, Y. Anal. Chem. 2013,85, 7574−7580.(15) Hun, X.; Sun, W.; Zhu, H.; Du, F.; Liu, F.; Xu, Y.; He, Y. Chem.Commun. 2013, 49, 9603−9605.(16) Schoenfisch, M. H.; Pemberton, J. E. J. Am. Chem. Soc. 1998,120, 4502−4513.(17) Sharma, J.; Chhabra, R.; Yan, H.; Liu, Y. Chem. Commun. 2008,2140−2142.(18) Huang, Y.; Zhao, S. L.; Shi, M.; Chen, J.; Chen, Z. F.; Liang, H.Anal. Chem. 2011, 83, 8913−8918.(19) Lee, J.; Kim, Y. K.; Min, D. H. Anal. Chem. 2011, 83, 8906−8912.(20) Liu, S. N.; Hu, Y. J.; Jin, J.; Zhang, H.; Cai, C. X. Chem.Commun. 2009, 1635−1637.(21) Gerasimova, Y. V.; Kolpashchikov, D. M. Chem. Soc. Rev. 2014,43, 6405−6438.(22) Lu, C. H.; Wang, F.; Willner, I. Chem. Sci. 2012, 3, 2616−2622.(23) Tang, D. P.; Tang, J.; Su, B. L.; Li, Q. F.; Chen, G. N. Chem.Commun. 2011, 47, 9477−9479.(24) Wu, L.; Wang, J.; Ren, J.; Li, W.; Qu, X. Chem. Commun. 2013,49, 5675−5677.(25) Li, L. L.; Liu, H. Y.; Shen, Y. Y.; Zhang, J. R.; Zhu, J. J. Anal.Chem. 2011, 83, 661−665.(26) Han, E.; Ding, L.; Lian, H.; Ju, H. X. Chem. Commun. 2010, 46,5446−5448.(27) Zhang, P. J.; Xue, Z. J.; Luo, D.; Yu, W.; Guo, Z. H.; Wang, T.Anal. Chem. 2014, 86, 5620−5623.(28) Yang, H. M.; Liu, W. Y.; Ma, C.; Zhang, Y.; Wang, X.; Yu, J. H.;Song, X. R. Electrochim. Acta 2014, 123, 470−476.(29) Li, L. L.; Ji, J.; Fei, R.; Wang, C. Z.; Lu, Q.; Zhang, J. R.; Jiang, L.P.; Zhu, J. J. Adv. Funct. Mater. 2012, 22, 2971−2979.(30) Li, Y.; Hu, Y.; Zhao, Y.; Shi, G. Q.; Deng, L. E.; Hou, Y. B.; Qu,L. T. Adv. Mater. 2011, 23, 776−780.(31) Peng, J.; Gao, W.; Gupta, B. K.; Liu, Z.; Romero-Aburto, R.; Ge,L.; Song, L.; Alemany, L. B.; Zhan, X.; Gao, G.; Vithayathil, S. A.;Kaipparettu, B. A.; Marti, A. A.; Hayashi, T.; Zhu, J. J.; Ajayan, P. M.Nano Lett. 2012, 12, 844−849.(32) Wang, Y.; Zhang, L.; Liang, R. P.; Bai, J. M.; Qiu, J. D. Anal.Chem. 2013, 85, 9148−9155.(33) Dong, Y. Q.; Tian, W. R.; Ren, S. Y.; Dai, R. P.; Chi, Y. W.;Chen, G. N. ACS Appl. Mater. Interfaces 2014, 6, 1646−1651.(34) Lu, Q.; Wei, W.; Zhou, Z.; Zhou, Z.; Zhang, Y.; Liu, S. Analyst2014, 139, 2404−2410.(35) Biggins, J. B.; Prudent, J. R.; Marshall, D. J.; Ruppen, M.;Thorson, J. S. Proc. Natl. Acad. Sci. U.S.A. 2000, 97, 13537−13542.(36) Dong, Y. Q.; Shao, J. W.; Chen, C. Q.; Li, H.; Wang, R. X.; Chi,Y. W.; Lin, X. M.; Chen, G. N. Carbon 2012, 50, 4738−4743.(37) Ji, J.; He, L.; Shen, Y. Y.; Hu, P. P.; Li, X. H.; Jiang, L. P.; Zhang,J. R.; Li, L. L.; Zhu, J. J. Anal. Chem. 2014, 86, 3284−3290.
(38) Zhang, J. J.; Wang, W. T.; Chen, S. H.; Ruo, Y.; Zhong, X.; Wu,X. P. Biosens. Bioelectron. 2014, 57, 71−76.(39) Wu, L.; Wang, J. S.; Yin, M. L.; Ren, J. S.; Miyoshi, D.;Sugimoto, N.; Qu, X. G. Small 2014, 10, 330−336.(40) Zhang, H.; Li, M.; Fan, M.; Gu, J.; Wu, P.; Cai, C. Chem.Commun. 2014, 50, 2932−2934.(41) Zhang, H. R.; Wu, M. S.; Xu, J. J.; Chen, H. Y. Anal. Chem.2014, 86, 3834−3840.(42) Divsar, F.; Ju, H. X. Chem. Commun. 2011, 47, 9879−9881.(43) Li, L. L.; Liu, K. P.; Yang, G. H.; Wang, C. M.; Zhang, J. R.; Zhu,J. J. Adv. Funct. Mater. 2011, 21, 869−878.(44) Huang, H. P.; Zhu, J. J. Biosens. Bioelectron. 2009, 25, 927−930.(45) Liu, P.; Yang, X. H.; Sun, S.; Wang, Q.; Wang, K. M.; Huang, J.;Liu, J. B.; He, L. L. Anal. Chem. 2013, 85, 7689−7695.(46) Shen, Z. L.; Nakayama, S.; Semancik, S.; Sintim, H. O. Chem.Commun. 2012, 48, 7580−7582.
Analytical Chemistry Article
DOI: 10.1021/ac5037318Anal. Chem. 2015, 87, 1145−1151
1151


![Preparation of titania/hydroxyapatite (TiO2/HAp) composite ...or.nsfc.gov.cn/bitstream/00001903-5/77915/1/1000007277269.pdf · Pentachlorophenol (PCP) ... synthesis of TiO ... [17]](https://static.fdocuments.us/doc/165x107/5a7333487f8b9a9d538e6543/preparation-of-titaniahydroxyapatite-tio2hap-composite-ornsfcgovcnbitstream00001903-5779151.jpg)