Grant Thornton - UNB · Grant Thornton An instinct for growth"' University of ew Brunswick Review...
36
Grant Thornton An instinct for growth"' University of ew Brunswick Review of shared services cost allocation methodology August28,2013
Transcript of Grant Thornton - UNB · Grant Thornton An instinct for growth"' University of ew Brunswick Review...

Grant Thornton An instinct for growth"'
University of ew Brunswick
Review of shared services cost allocation methodology
August28,2013

Grant Thornton An instinct for growth"
Mr. Dan Murray Vice President, Finance and Corporate Services University of New Brunswick 3 Bailey Drive, Room 1 OS Fredericton, NB E3B SA3
August 28, 2013
Dear Mr. Murray:
Grant Thornton LLP 4t11 Floor, Brunswick House 44 Chipman Hill Saint John, NB E2L 2A9
T + 1 506 634 2900 F+ 1 506 634 4569
www.GrantThornton.ca
Grant Thornton lLP is pleased to submit our review of your shared services cost allocation methodology (the report). The report was compiled for the University of New Brunswick
(UNB) in response to your request for a review of your current state model and recommendations on how to appropriately and fairly allocate these costs in a future state model
as outlined in out engagement letter dated June 19, 2012.
Our report, along with f1ndings, considerations, analyses and recommendations should be considered as a whole. Selecting portions of our analysis or the factors we considered, without considering all factors and analysis could create a misleading view of the process and fmal recommendations.
We thank you for the opportunity to provide you with our business risk services and will be pleased to discuss the foregoing with you at your convenience.
Yours sincerely,
Grant Thornton lLP
Matthew McKenna, CA Partner Advisory Services
Audit • Tax • Advisory ©Grant Thornton LLP. A Canadian Member of Grant Thornton international Ltd. All rights reserved.

University of New Brunswick- Review of shared services cost allocation methodology
Contents
Executive summary
Introduction
Scope of review and objectives
Documentation and information relied upon
Approach
Current state model
Future state model
Annual process
Appendix A- Current shared services
Appendix B - Interview list
Appendix C - Non-shared budget amounts
Appendix C - Non-shared budget amounts
Appendix D - Space operating costs
Appendix E - Fringe benefits
Appendix F- Administrative costs comparative
Appendix G- Administrative costs comparative small schools (UNBSJ)
Appendix H- Administrative costs comparative large schools (UNBF)
Audit • Tax • Advisory ©Grant Thornton LLP. A Canadian Member of Grant Thornton International Ltd. All rights reserved,
Page
2
4
6
8
9
11
13
20
25
26
27
28
29
30
31
32
33

University of New Brunswick- Review of shared services cost allocation methodology
Executive summary
This report was prepared for UNB to provide the University Management Committee (UMC) with an independent, objective review of current cost sharing of shared services between the UNB Fredericton
campus (UNBF) and the UNB Saint John campus (UNBSJ) and to provide recommendations on allocating these services appropriately.
Our objectives and approach focused on gaining an understanding of the current state model and addressed issues or areas for improvement by developing and recommending a future state modeL
The observations and recommendations that arose from our review are summarized below:
Observation Recommendation
·:· The current state model is not transparent or ~ The future state model clearly identifies all
well understood costs that should be shared between UNBF
and UNBSJ and the methodology to allocate
these costs
~ Costs specific to an individual campus have been removed from the future state model
2
•!• No one appears to be responsible or ~ UNB should establish a separate budget for
accountable for the performance of the the shared services centre and assign a senior
shared services executive to be responsible and accountable
for that centre ·:· There is also no interaction with the
customers of the shared service to review the
services being offered and to gauge customer
satisfaction/ obtain feedback
•!• Certain shared services activities are not ~ The future state model includes all current
currently being allocated costs that should be allocated between UNBF
and UNBSJ
·:· The current state model includes salary and ~ Best practice would include fringe benefits
non-salary (office supplies, travel, etc.) costs and space operating costs as costs to be allocated. \'1/e recommend these costs be
·:· The model does not include fringe benefits or
Audit • Tax • Advisory ©Grant Thornton LLP. A Canadian Mernber of Grant Thornton International Ltd. All rights reserved.

University of New Brunswick- Review of shared services cost allocation methodology 3
space operating costs included in the future state model
·:· There is no documented process for updating );;> We recommend that processes be developed
the model each year, updating for new and documented to address each of these
initiatives, dealing with budget to actual activities. We have provided input into the variances in the shared services activities development of these processes within our
and/ or addressing disputes report
·:· There is currently no written shared services );;> A written shared services agreement is best practice for shared service centres and we agreement in place would recommend that one be put in place at UNB
The application of the recommended future state model will result in an increased shared services
charge to UNBSJ. The current annual charge of $2,286,554 will increase by $1,909,148 resulting in a future annual charge of $4,195,702. A portion of this increase, $638,076 or 33.4%, results from space operating costs ($112,329) and fringe benefits ($525,747) being allocated to UNBSJ.
We have included transition options for dealing with this increase within our report.
Audit • Tax • Advisory ©Grant Thornton LLP. A Canadian Member of Grant Thornton International Ltd. All righls reserved.

University of New Brunswick- Review of shared services cost allocation methodology
Introduction
Purpose of the review and use of report
This report was prepared to provide the UMC with an .independent, objective review of the current
state model and to provide recommendations on allocating shared services appropriately and fairly.
The report will also provide a detailed set of procedures to facilitate moving UNB to a recommended
future state model. We specifically disclaim any responsibility for losses or damages .incurred through
the use of this report for a purpose other than as described .in this paragraph.
The findings and recommendations .in this report reflect .information furnished to Grant Thornton by
the management and staff of UNB. Grant Thornton believes all .information used .in this report is
reliable. Grant Thornton has not, however, .independendy verified it in all cases. No warranty is given
as to the accuracy of the information used.
We reserve the right, but will be under no obligation, to review and/ or revise the contents of this
report .in light of .information which becomes known to us after the date of this report.
Background
UNB has a long standing practice of sharing certain services between its two ma.in campuses located .in
Fredericton (UNBF) and Saint John (UNBSJ) to achieve efficiencies and to avoid duplication.
Services that have been shared between the two campuses .include the following:
11 Associated Vice President- Capital Planning and Property Development
11 Assistant Vice President - Financial and Corporate Services
0 Corporate costs
0 Financial services
0 Radiation safety
0 Risk Mana gem en t
• Assistant Vice President- Trust & Treasury
• Harriet Irving Library and Branches
• Information and Technology Services
Audit • Tax • Advisory ©Grant Thornton LLP. A Canadian Member of Grant Thornton International Ltd. All rights reserved.
4

University of New Brunswick- Review of shared services cost allocation methodology
til President
o Government Relations Office
o Human Rights Office
o President
o University Secretary
til School of Graduate Studies
• Vice President Fredericton
o Integrated Recruitment and Retention
o Registrar
o Resource Planning and Budgeting
o Scholarships
• Vice President Advancement
o Alumni
o Communications and Marketing
o Development and Donors Relations
o Vice President Advancement Office
• Vice President Finance and Corporate Services
o Human Resources and Organizational Development
o Vice President Finance and Corporate Services
• Vice President Research
• International Recruitment Centre
Currently there are mechanisms and arrangements in place to allocate the costs of shared services between the two campuses, however, these mechanisms and arrangements have not been reviewed for some time and the UMC has agreed that a comprehensive review of the allocation of shared costs is
appropriate at this time.
Audit • Tax • Advisory ©Grant Thornton LLP. A Canadian Member of Grant Thornton International ltd. All rights reserved.
5
University of New Brunswick- Review of shared services cost allocation methodology
Scope of review and objectives
Scope of review
The scope of this review focused on the shared services cost centres as outlined in Append1." A as well as a review of other coSts that are currently not shared to determine if they should be.
Out of scope
The following areas were considered out of scope and were not included in this review:
• The processes for recording revenues
6
• An analysis of benefits received from these shared semces including alternate methods of procuring such services
Objectives
We have conducted an independent review of the cost sharing of the existing shared services and have
made recommendations as to how to appropriately and fairly allocate the shared services costs on a go forward basis. Based upon the scope of review, our objectives were as follows:
• Review of existing shared services costs and cost allocation mechanisms, including:
o Identification of existing shared services
o Reviewing UNB's fmancial records to determine the costs of existing shared services
o Examining the basis for the amount of shared services costs that are allocated between the campuses
e Developing recommendations and mechnisms for the identification and allocation of shared
services costs going forward, including:
o Identifying options, criteria and methodolgies for allocating shared services costs
o Recommending appropriate criteria and methodologies for cost allocation of individual
shared services
o Recommending criteria and m~thodolgies to be used as the basis for allocating the costs of new services or changes to existing services
Audit • Tax • Advisory ©Grant Thornton LLP. A Canadian Member of Grant Thornton International Ltd. All rights reserved.

University of New Brunswick- Review of shared services cost allocation methodology
411 Recommending a process for the annual allocation of shared services costs, including:
o Recommending a process for compiling and determining the annual allocation of shared
services costs
o Recommending a format to illustrate and document shared services costs and the
allocation of these costs as part of the annual allocation process
o Recommending an approach to ensure that final cost allocations for the year represent
actual fmal costs
• Document any identified opportunities for the enhanced utilization of shared services for the mutual benefit of both campuses
Audit • Tax • Advisory ©Grant Thornton LLP. A Canadian Member of Grant Thornton International Ltd. All rights rese01ed.
7

I
University of New Brunswick- Review of shared services cost allocation methodology 8
Documentation and information relied upon
In completing our report, we reviewed and relied upon the following information, documents and data:
11 Clarkson and Gordon report on Shared Services dated June 27, 1984
• Report of the UNB Commission on Inter-Campus Relations, Funding and Governance, dated
October 31, 2008
• Current budget and other financial information for the shared services cost centres outlined in
AppendL'C A
• Current cost allocation model
• Interviews with the UNB personnel as detailed in Appendix B
• Statistical data to support the future allocation basis'
Audit • Tax • Advisory ©Grant Thornton LLP. A Canadian Member of Grant Thornton International Ltd. All rights' reserved.

University of New Brunswick- Review of shared services cost allocation methodology
Approach
Based on the scope of review, detailed in the preceding section, we followed a phased approach as outlined below which in our view would be appropriate for achieving the objectives of this review:
Current state model observation
The first phase of our approach was to gain an understanding of how the current state model works including a review of any challenges or areas for improvement with this model. The following procedures were undertaken during this phase:
• Reviewed the current cost allocation model including the history of its development
• Discussed each existing shared service with the portfolio cost centre owner to gain an understanding of the nature of all activities included
• Examined the current basis for allocating the cost of these activities between the campuses
• Through interviews gained an understanding of the timing, communication and decision-making processes relating to special initiatives and contingencies
Future state model - analysis, recommendations and reporting The second phase was to recommend a future state model that included the identification of the activities and costs to be shared, a methodology for sharing these costs between the campuses and a documented process for the operation of this model on a go forward basis. The approach taken was as follows:
• Reviewed each shared service with the portfolio cost centre owner to determine:
o which activities were specific to one campus or the other and which were truly university wide services and should be shared
o any other activities that are currently not shared that should be
o the most appropriate method to utilize in order to allocate the cost of these activities
• Reviewed the International Standard that guides shared services operations to determine the types of
costs to be included for an activity that is normally shared
• Built a model to capture the activities and costs and apply the allocation methodologies
Audit • Tax • Advisory ©Grant Thornton LLP. A Canadian Member of Grant Thornton International Ltd. All rights reserved.
9

University of New Brunswick- Review of shared services cost allocation methodology
• Used results of interview feedback and our experience working with other shared services models
to develop a recommended process for operating this model on a go forward basis
Audit • Tax • Advisory ©Grant Thornton LLP. A Canadian Member of Grant Thornton International Ltd. All rights reserved.
10

University of New Brunswick- Review of shared services cost allocation methodology 11
Current state model
Our review of the current state model was conducted through a review of the history building up to the current model, a review of the budgets and mechanics of the model and through interviews with key stakeholder, portfolio cost centre owners and the team that administers the current model.
Overall the concept of shared services is understood and there is agreement that the sharing of university wide costs, for saving and efficiencies, is the proper thing to do.
There were a number of themes arising from this review as to issues and areas for improvement with the current model. These observations are as follows:
The current state model The current state model is not well understood by.most of the people we talked to. There appears to be
limited knowledge as to what costs are shared and how they are being allocated. Not all shared costs are
being properly allocated; some identified shared services are not being allocated at all and therefore
being fully absorbed by UNBF. In the current model, the University Wide Trust and Treasury, School
of Graduate Studies and Fringe Benefit portfolios are not being allocated, nor are certain shared
administrative support functions within the Harriet Irving Library portfolio.
Presently only salary and non-salary costs are included in the costs to be allocated. Best practice would
also include fringe benefits and space operating costs as additional costs to be allocated.
The current budget structure doesn't align with a pure shared service model as the current shared
services costs are budgeted within the UNBF and UNBSJ budgets.
Although not within the scope of our review, a few of the people interviewed suggested that there are
certain services where a more central focus would achieve efficiency and/or where duplication of
certain services currently exists. These include, but are not limited, to the following areas:
• Registrar's Office
• Information Technology
• School of Graduate Studies
• Harriet Irving Library
• Resource Planning and Budgeting
Audit • Tax • Advisory ©Grant Thornton LLP. A Canadian Member of Grant Thornton International Ltd. All rights reserved.

University of New Brunswick- Review of shared services cost allocation methodology 12
Campus interaction There are certain shared services that are currently not being used by UNBSJ either due to them not
being aware of these services or choosing not to utilize them. For example, it is our understanding that
UNBSJ is not using, by their choice, certain services being provided by the Resource Planning and
Budgeting department (with the exception of institutional research services).
It was also stated by a few people that both campuses currently don't work together in certain areas and
this should be improved to enhance efficiencies between the two campuses. There is an opportunity
and capacity to share expertise between both campuses, for example, the Energy Manager in UNBF
could be shared with UNBSJ.
Accountability/transparency The current state model and methodology is not transparent or well understood by the stakeholders.
There is also no one responsible or accountable for shared services. The University may wish to
reconsider how the performance of these services is measured and monitored (quality, value for money,
actual to budget results). There is no interaction with the customers of the shared services to review
the services being offered and to gauge customer satisfaction/ obtain feedback.
An Inter-campus Relations Committee has been established to monitor the shared services functions
however the effectiveness of this body was questioned by a few of the people we interviewed.
The University Wide Budget Management Committee currently has responsibility for the annual review of shared services units and cost allocations. The method in which this function is performed should be
reviewed in light of the other related recommendations in this report.
Process issues There is a process for dealing with new shared costs however, the process is informal, is not always
clear and certain decisions with respect to shared services are made outside this current informal
agreement. Also there is no documented process for resolving disputes.
At this point there is no process for dealing with over/under budget situations in a shared services cost
centre. Certain people we interviewed were not clear on the process that was followed or if there was a
process.
There is no formal written shared services agreement in place. Best practice in shared services would
be to have a written agreement in place between the two campuses and the shared services centre. It
was also stated by a few of the people we interviewed that the UMC members spends too much time
debating shared services cost allocation as opposed to more important university matters.
Audit • Tax • Advisory © Grant Thornton LLP. A Canadian Mernber of Grant Thornton International Ltd. All rights reseiVed.

University of New Brunswick- Review of shared services cost allocation methodology 13
Future state model
The recommended future state model for capturing shared services costs and allocating identified costs to the two campuses has been developed from the feedback received during our review of the current state model, input from the interview process and from out experiences with developing shared services models for other organizations.
The guiding principles for the future state model are:
• Build a model that is not complex to administer, maintain and update
• The shared services activities included in the model need to be transparent and understood by the stakeholders
• The cost basis for these activities is transparent and understood
• The allocation methodologies are to be kept as simple as possible (based on the activity that drives the cost, if possible and based on data that is readily available and easy to update on an
annual basis)
• The allocation methodologies should align with best practice
Definition of costs for shared services cost allocation
The current shared service costs include salary and non-salary costs. The non-salary costs include such things as office supplies, travel costs, etc. It does not include space operating costs (i.e. power, cleaning,
etc.) and fringe benefits.
Best practice for shared services also include space operating and fringe benefits costs. Based upon this best practice we recommend that space operating and fringe benefits costs be included within the future state model.
Recommended model and allocation methodology The recommended future state model and allocation methodology including a brief description of each column is on the next page under Schedule 1 - summary.
Audit • Tax • Advisory ©Grant Thornton LLP. A Canadian Member of Grant Thornton International Ltd. All rights reserved.

University of New Brunswick.:.. Review of shared services cost allocation methodology
UNB shared services review
Schedule 1 - summary
A
Line Portfolio
1 UW- Assoc Vice President (Capital Planning & Property Dev)
UW -Assistant Vice President (Finance & Corporate Services)
2 Corporate costs 3 Financial services 4 Radiation safety 5 Risk management 6 UW- Assistant Vice-President (Trust and Treasury) 7 FR- Harriet Irving Library and Branches
8 UW -Information and Technology Services UW-President
9 Government Relations Office 10 Human Rights Office
11 President 12 University Secretary
13 UW -School of Graduate Studies FR- Vice-President (Fredericton)
14 Integrated Recruitment and Retention 15 Registrar
16 Resource Planning & Budgeting 17 Scholarships
UW-Vice-President (Advancement) 18 Alumni 19 Communications & Marketing 20 Development & Donor Relations 21 Vice-President (Advancement) Office
UW- Vice-President (Finance & Corporate Services) 22 Human Resources & Organizational Development 23 Vice President (Finance & Corporate Services) 24 UW- Vice-President (Research) 25 UW- Contingencies and Provisions 26 SJ Registrar- International recruitment centre
27 Total
B
Total shared cost to
allocate($) (Schedule 2)
$ 306,861
S86,838 1,906,821
93,275 546,837 174,590
3,065,335 4,549,301
132,787 92,232
1,103;803 477,874 846,867
371,612 536,598
803,314 740,120 577,092 550,327
1,503,872 379,396
1,198,284 150,000 558,344
$ 21,252,379
c D
Allocation
Allocation method ratio -----------------
Net assignable square feet 16%
Proxy 20% Finacial services proxy 21%
Proxy 20% FTE undegraduate students 22%
Proxy 20% Total students 20%
'Proxy 20%
20% 20% 20% 20%
FTE graduate students 11%
n/a n/a n/a n/a
Proxy 20% FTE undergraduate students 22%
Active alumni 14% Proxy 20%
Fundraising 22% Proxy 20%
Proxy 20% Proxy 20%
Sponsored research grants 11% Proxy 20%
International Students 42%
20%
This schedule forms part of, and should be read In conjunction with, the accompanying Grant Thornton LLP Review of Shared Services Cost Allocation Methodology dated August 28, 2013.
Audit • Tax • Advisory ©Grant Thornton LLP. A Canadian Member of Grant Thornton International Ltd. All rights reserved.
14
E F G
Proposed Currrent allocation to allocation to Difference
UNBSJ ($) UNBSJ ($) (E-F)
$ 47,714 $ 16,292 $ 31,422
116,827 36,939 79,888 409,938 165,771 244,166
18,569 11,400 7,169 119,614 106,701 12,913
34,757 34,757 627,661 470,044 157,617 905,673 173,818 731,855
26,435 115,428 (88,993) 18,361 14,600 3,761
219,745 123,854 95,891 95,135 24,850 70,285 95,414 95,414
20,326 (20,326) 61,385 (61,385)
73,980 9,456 64,524 117,374 94,210 23,164
113,604 57,586 56,017 147,343 201,508 (54,165) 128,496 141,055 (12,559)
109,559 5,886 103,673
299,390 117,339 182,051 75,530 75,530
130,909 35,554 95,355 29,862 30,000 (138)
233,811 252,551 (18,740)
$ 4,195,702 $ 2,286,554 $ 1,909,148

Audit • Tax • Advisory
University of New Brunswick- Review of shared services cost allocation methodology
Schedule 1 (continued)
Total shared costs to be allocated
This column represents the total costs within the shared services centre which will be allocated to the
two campuses. Further detail plus description is included below under Schedule 2
Allocation method
The next two columns represent the recommended method to allocate the total costs to each campus.
Each portfolio cost centre and activities with each portfolio were reviewed with the portfolio owners.
Their input plus our experience from shared service projects with other organizations were used as
input into the recommendation of each allocation method.
Please refer to Schedule 3 for further details on each allocation.
The remaining three columns detail the proposed allocation to UNBSJ, the current allocation and the
resulting change.
©Grant Thornton LLP. A Canadian Member of Grant Thornton International Ltd. All rights reserved.
15
University of New Brunswick- Review of shared services cost allocation methodology 16
UNB shared services review
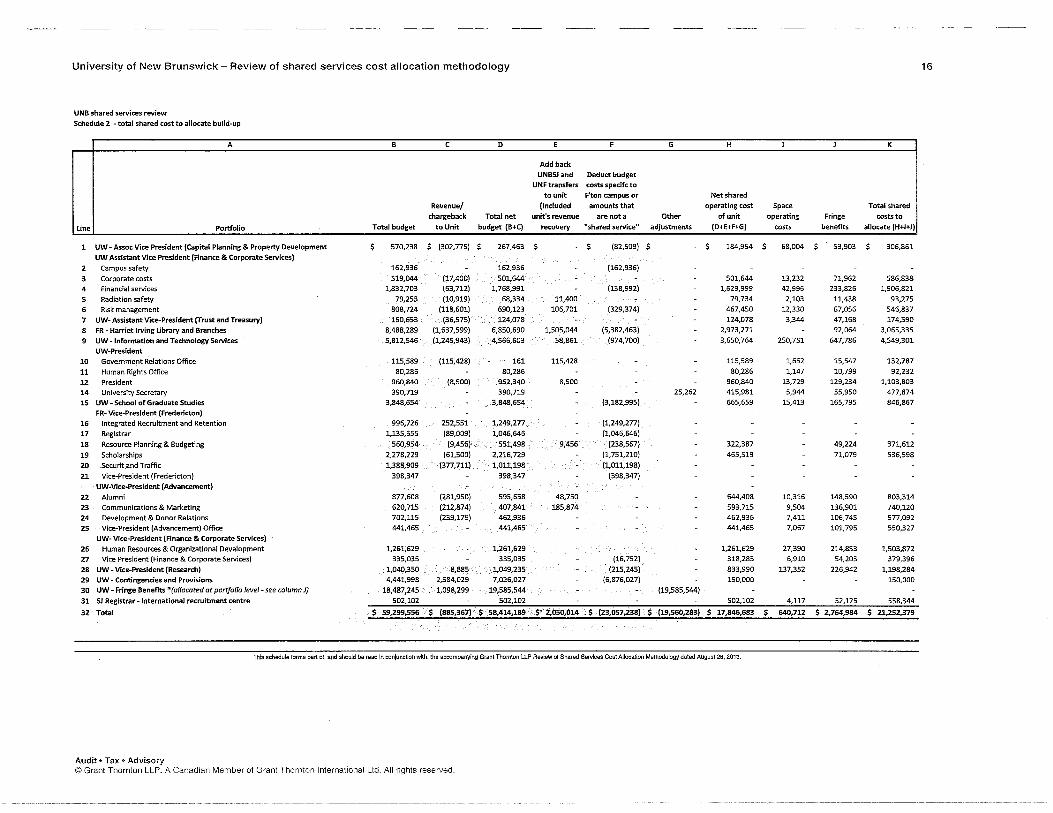
Schedule 2 -total shared cost to allocate burld-up
A B c D E F G H I J K
Add back UNBSJ and Deduct budget
UNF transfers costs specifc to
to unit F'ton campus or Net shared
Revenue/ llncluded amounts that operating cost Space Total shared
chargeback Total net unit's revenue are nota Other of unit operating Fringe costs to
line Portfolio Total budget to Unit budget (B+C) recovery "shared service" adjustments (D+E+F+G) costs benefits allocate (H+I+J)
1 UW- Assoc Vice President (Capital Planning & Property Development $ 570,238 $ (302,775) $ 267,463 $ $ (82,509) $ - $ 184,954 $ 68,004 $ 53,903 $ 306,861
UW Assistant Vice President (Finance & Corporate Services)
2 Campus safety 162,936 162,936 (162,936)
3 Corporate costs 519,044 (17,400) 501,644 501,644 13,232 71,962 586,838 4 Financial services 1,832,703 (63,712) 1,768,991 (138,992) 1,629,999 42,996 233,826 1,906,821
5 Radiation safety 79,253 (10,919) 68,334 11,400 79,734 2,103 11,438 93,275
6 Risk management 808,724 (118,601) 690,123 106,701 (329,374) 467,450 12,330 67,056 546,837
7 UW- Assistant Vice-Presfdent (Trust and Treasury) 160,653~ (36,575) 124,078 124,078 3,344 47,168 174,590
8 FR ~ Harriet Irving Library and Branches 8,488,289 (1,637,599) 6,850,690 1,505,044 (5,382,463) 2,973,271 92,064 3,065,335
9 UW ~Information and Technology Services 5,812,546 (1,245,943) 4,566,603 58,861 (974,700) 3,650,764 250,751 647,786 4,549,301
UW~President
10 Government Relations Office 115,589 (115,428) 161 115,428 115,589 1,652 15,547 132,787
11 Human Rights Office 80,286 80,286 80,286 1,147 10,799 92,232
12 President 960,840 (8,500) 952,340 8,500 960,840 13,729 129,234 1,103,803
14 University Secretary 390,719 390,719 25,262 415,981 5,944 55,950 477,874
15 UW ~ School of Graduate Studies 3,848,654 ~3,848,654 (3,182,995) 665,659 15,413 165,795 846,867 FR~ Vice~Presldent {Fredericton)
16 Integrated Recruitment and Retention 996,726 252,551 ,1,249,277 (1,249,277)
17 Registrar 1,135,655 (89,009) 1,046,646 (1,046,646)
18 Resource Planning & Budgeting 560,954' (9,456) ~,~ 551,498' 9,456 (238,567) 322,387 49,224 371,612
19 Scholarships 2,278,229 (61,500) 2,216,729 (1,751,210) 465,519 71,079 536,598
20 Securit and Traffic 1,388,909 (377,711) 1,011,198 (1,011,198)
21 Vice-President (Fredericton) 398,347 398,347 (398,347)
UW-Vice-Presldent (Advancement)
22 Alumni 877,608 (281,950) 595,658 48,750 644,408 10,316 148,590 803,314
23 Communications & Marketing 620,715 (212,874) 407,841 185,874 593,715 9,504 136,901 740,120
24 Development & Donor Relations 702,115 (239,179) 462,936 462,936 7,411 106,745 577,092
25 Vice-President (Advancement) Office 441,465 441,465~ 441,465 7,067 101,795 550,327 UW- Vrce-President {Finance & Corporate Services)
26 Human Resources & Organizational Development 1,261;629 1,261,629 1,261,629 27,390 214,853 1,503,872 27 Vice President (Finance & Corporate Services) 335,035 335,035 (16,752) 318,283 6,910 54,203 379,396
28 UW- Vice-President (Research) 1,040,350 8,885 1,049,235 (215,245) 833,990 137,352 226,942 1,198,284 29 UW ~Contingencies and Provisions 4,441,998 2,584,029 7,026,027 (6,876,027) 150,000 150,000
30 UW- Fringe Benefits *(allocated at portfolio level- see column J) 18,487,245 '1,098,299 ~ 19,585,544 (19,585,544)
31 SJ Registrar -International recruitment centre 502,102 502,102 502,102 4,117 52,125 558,344
32 Total $ 59,299,556 $ (885,367) $ 58.414,189 $" 2,050,014 $ (23,057,238) $ (19,560,283) $ 17,846,683 $ 640,712 $ 2,764,984 $ 21,252,379
This schedule forms part of, and should be read In conjunction with, the accompanying Giant Thornton LLP Review ol Shared Services Cost Allocation Methodology dated August 2B, 2013.
Audit • Tax • Advisory @Grant Thornton LLP. A Canadian Member of Grant Thornton International Ltd. All rights reserved.

University of New Brunswick- Review of shared services cost allocation methodology
Schedule 2 (continued)
Schedule 2 provides the detailed build up of the total costs to be shared. The build up starts from the
current portfolio cost centre budgets. The build up adjustments are as follows:
till Total revenues within these portfolios that are earned from any source other than UNBSJ ate
deducted from the corresponding cost to arrive at a net budget amount to be shared
17
till Revenues currently earned from UNBSJ as part of the current allocation method ate included in
the total revenues numbers and therefore they need to be added back to arrive at the total costs
to be allocated
till There ate significant costs in the net budget amounts that relate to UNBF only. The current
shared services costs ate commingled with the UNBF budgets. These costs need to be deducted.
The detailed support for these adjustments is included in Appendix C
till Other adjustments include:
o University wide- President's Office- an administrative staff located at UNBSJ spends 50% of their time focused on university wide activities therefore these costs need to be
added to the model and shared between the two campuses
o University wide- Fringe Benefits -the total cost is being deducted from the model and
the portions to be shared ate added back within each individual portfolio cost centre as
discussed below
• Space operating costs and fringe benefits ate added to the costs to arrive at "total shared costs to
allocate"
o Details on space operating costs is in Appencli.\: D
o Details on fringe benefit costs is in Appencli." E
Audit • Tax • Advisory ©Grant Thornton LLP. A Canadian Member of Grant Thornton International Ltd. All rights reserved.

University of New Brunswick- Review of shared services cost allocation methodology
UNB shared services review Schedule 3 ·allocation basis
Une
A
Basis
Students /fufl W"ar fufl tfme equlvaltmt I
Undergraduate
Graduate 3 Total
Complement (full time equivalent/ Faculty
St<>ff Student
7 Total
8 Sponso~d rfi~rch grants
Net osslqnoble .squart! feet
As at 9 Net assignable square feet
Fundralslnq
7,722 1,331 9,053
672 856 291
1,819
46,720,000
Fall2011
1,487,077
Fredericton initiatives
G Percent af total
Saint John Total
~ ~ ~ 2010...2011
78% 2,162 22% 9,884
89% 169 11% 1,500 80% 2,331 20% 11,384
80% 164 20% 836 82% 184 18% 1,040
84% 57 16% 348 82% 405 18% Z.ZZ4
89% $ 5,730,000 11% $ 52,450,000
Fall 2011 ~ Fall2011 Faii20U
84% 273,802 16% 1,760,879
Unverstyw e
Percent of total Saint John Percent of total University wide Initiatives percent Fredericton Initiatives Saint John Initiatives oftot•d Total
10 Funds raised for the 5 years ending Apr!J 30, 2012 26,649,094 34% $ 8,609,615 11% $ 42,391,650 55% $ 77,650,359
11 Allocate university wide Initiatives based on total students 12 Total
Attlvea/umnl
13 As at August 2012
14 Allocate degrees from both campuses equally 1S Total
!!!!!!9£!
16 Proposed 2012·2013
FlnandaT services IJfOKV
17 Number of accounts payable vouchers, fiscal 2012 18 Number of purchase orders, fiscal 2012 19 Tuition revenue (grad and undergrad combined), fiscal 2012 20 Complement (per above) 21 Average of avbove
Prog (averoqe of total srudenU CtJmplement budqetl
22 Students {Weighted full year full time equivalent) from above B Complement (full time equivalent) from above 24 Proposed budget 2012·2013 from above
25 Average
lnternatlontJI students
26 Fredericton campus 27 Saint John campus 28 Total
I
33,711,490 60,360.=!!.
Frederctlon campus
63,706
1,778 65,484
Fredericton campus
s 140,787,000
Fredericton campus
44,357 5,505
41,698,600 1,819
Percent Of total Fredericton
80%
82% 79%
80%11
Fall2011
880 634
Lsi4
8,680,160 78% $ 17,2!9,775 ZZ%
Percent tota
Percent of total Saint John Percent of total Degrees from decrees from Fredericton campus Saint John both campuses both ampuses
84% 9,008 12% 3,556 5%
1,778 86% 10,786 14%
Percent of total Saint John Percent of total Fredericton campus Saint John Total
79% s 37,503,100 21% $ 178,290,100
Percent of total SalntJohn Percent of total Fredericton ampus Saint John Total
80% 10,784 20% 55,141 76% 1,752 24% 7,257 76% 13,227,023 24% 54,925,623
82% 405 18% 2,224 79% 21%
Percent of total Saint John
20% 18% 21%
20%1
Percent of total
58% 42%
This sclutdulolorms part ol. nnd l'>h(ltlld bO road In conjundlon wllh. lhoaCCCJmpllflYing Grant Thornton LLP RII\IIBW ol Shared &nvk:O$ COst AlloCill!oo Molhodoklgy dalad August 28.2013.
Audit • Tax • Advisory ©Grant Thornton LLP. A Canadian Member of Grant Thornton International Ltd. All rights reserved.
Total
__ 7_6,270
18

University of New Brunswick- Review of shared services cost allocation methodology
Schedule 3 (continued)
As part of our review we worked with the portfolio cost centre owners to determine the activity or
activities that drive the costs within their cost centre. Where applicable a specific cost driver was used
as the method to allocate the cost to the two campuses.
In certain portfolios or areas within certain portfolios there was no specific cost driver or allocation
basis to align with activity in the portfolio. Absent a clear cost driver, we felt that it was reasonable to
use a "Proxy" as shown in schedule 3 above to allocate these costs. The "Proxy" has been calculated
using the average percentage of students, complement and budgets.
Administrative costs comparative
19
We completed an additional analysis to test the reasonableness of this shared services increase to UNBSJ. The analysis compared Library, Computing (IT) and all other Administrative Costs for UNBSJ and UNBF to a number of other Maritime Universities. The numbers used in this analysis are based on 2010-2011 Caubo Expenditures by Fund. These costs are shown as a percentage of that university's total general operating expenditures. The UNBSJ and UNBF costs are shown using the current state model as well as what they would be factoring in the recommended increases from this report.
The results of this analysis show that the increased administrative costs at UNBSJ are not out of line
when compared to similar sized universities in the Maritimes. The analysis is attached as Appendix F.
We also compared the increased administrative costs at UNBSJ to smaller schools which further
supports the methodology is not out of line when compared to similar sized universities. The analysis is
attached as AppendL'\: G.
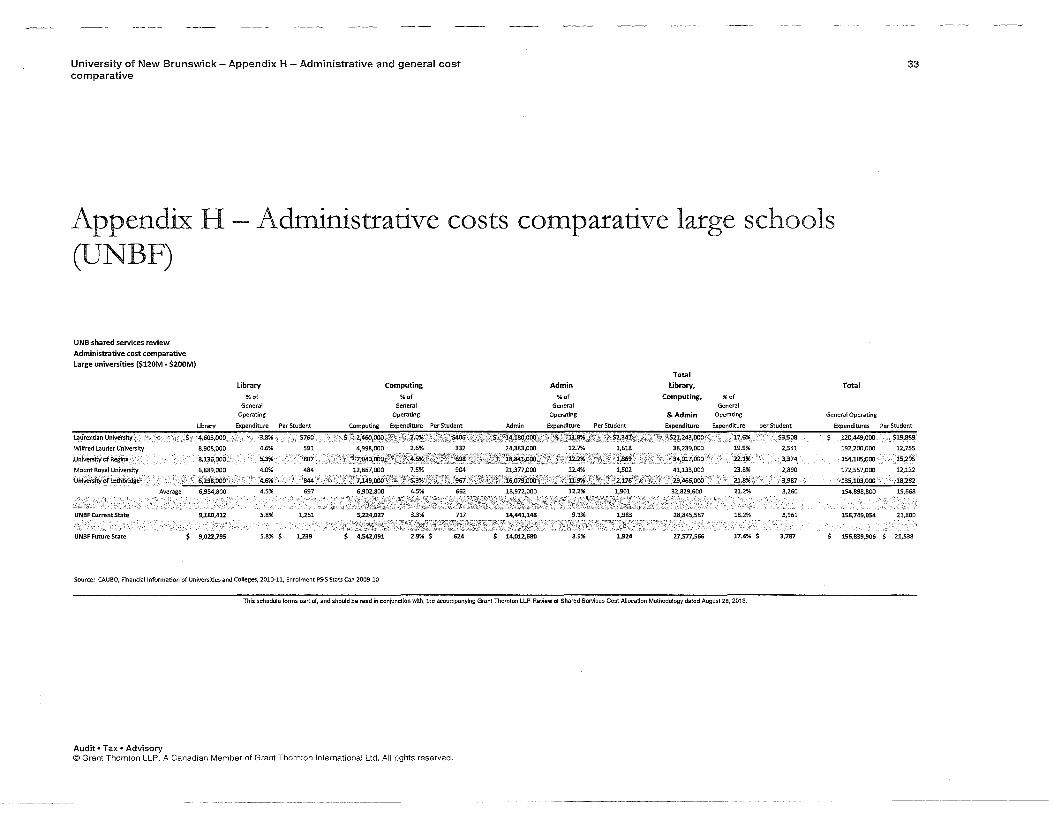
Finally we also compared the administrative costs at UNBF to larger schools which supports the
methodology is not out of line when compared to similar sized universities. The analysis is attached as
AppendL'< H.
The future state model and instruction guide
The future state model including an instruction guide has been developed in excel and this model will
be given to UNB to enable the ongoing operations, maintenance and updating of the shared services
cost allocation.
Audit • Tax • Advisory ©Grant Thornton LLP. A Canadian Member of Grant Thornton International Ltd. All rights reserved.

University of New Brunswick- Review of shared services cost allocation methodology
Annual process
We have developed a recommended set of procedures to facilitate the annual process and regular updating of the future state model and methodologies.
1 Shared service agreement A written shared services agreement is best practice for shared service centres and we would recommend that one be put in place at UNB.
2 Separate budgets for the shared services cost centre
20
It is our understanding that UNB plans to create three sets of budgets for 2013, one for each campus plus one for the shared services cost centre. The creation of a separate budget for the shared service centre will enhance the clarity of these costs. It should become very transparent as to the costs for UNBF, UNBSJ and those costs that ate shared.
This approach follows best practice for shared services cost centres and should improve the transparency and understanding of these costs.
3 Updating model for each budget year The future state model should be updated for each new budget year. The following should be reviewed and updated as appropriate:
a Input new budget information into the model
b Review each allocation methodology and update for current year information
4 Over/under budget At the end of each fiscal year the shared services cost centres may be over or under budget in certain portfolio cost centres. If this were to happen a process needs to be documented to direct how this will be dealt with internally. We have identified four options:
a The over or under amounts stay with the shared services centre and are not allocated out to the
campuses
b An actual to budget "true up" is done and campuses ate charged or credited using the existing
allocation methodology for each cost portfolio (as documented above)
c A total over/under budget number is calculated for the entire shared services centre and the
total is allocated to each campus using the proxy methodology
Audit • Tax • Advisory ©Grant Thornton LLP. A Canadian Member of Grant Thornton International Ltd. All rights reserved.

University of New Brunswick- Review of shared services cost allocation methodology
d A materiality level is set for the over/under budget variance and the two campuses agree on
either (a), (b) or (c)
21
We have seen all of these options used within other organizations and it will be up to management
to decide on which options works best for their situation.
5 Unplanned shared services centre costs These costs will be different from the above over/under budget scenario as a conscious effort will be made to incur these costs after determining that to do so is in the best interest of the University. When this happens a process needs to be documented to direct how this will be dealt with internally. This process should include a pro-active approach where the allocation methodology is discussed and agreed to prior to actually incurring these costs.
The recommended approach would be:
a If the cost falls into an existing portfolio use the established allocation methodology for that
cost portfolio
b If the cost falls outside the existing portfolios:
Create 4 or 5 categories that these costs could fall into (i.e., based on history what are the
types of things that could happen), then develop an allocation methodology for each
category
ii If an unplanned cost does not fall into one of these categories use the proxy.
6 Dispute resolution process If process steps 4 and 5 above are documented and implemented the need for a dispute resolution process should be :minimized. However a process should be established and documented in the event an issue were to arise that falls outside processes 4 and 5.
We would recommend a person independent from this process to fulfill this role. Potential options could be:
• President
• Third party university solicitor
• Inter-campus Relation Committee
• University Wide Budget Management Committee
7 Transition plan The results of this shared services cost allocation review will increase the charge to UNBSJ by approximately $2 million. As this amount may be too much to absorb in the short term, we present the following transition options to address this increase:
a Charge the entire increase into next year's budgets
b Use the new future state model and apply a discount factor to defer all of this increase and bring the increase in over a reasonable period of time (for example five years) by reducing the
Audit • Tax • Advisory ©Grant Thornton LLP. A Canadian Member of Grant Thornton International Ltd. All rights reseiVed.

University of New Brunswick- Review of shared services cost allocation methodology 22
discount factor each year. Any new costs would be allocated at 100% with no discount. This option would create a loss within the shared services center. Schedule 4 presents an illustrative calculation of the potential impact of this option for the current cost identified as shared.
c Same approach as (b) above, however retain some agreed to level of discount for existing shared services after the transition period. This approach would recognize the long history of discounted shared services at an agreed upon transparent level for existing services. There would be no discount applied to future shared services. Schedule 5 presents an illustrative calculation of the potential impact of this option for the current cost identified as shared.
Audit • Tax • Advisory ©Grant Thornton LLP. A Canadian Member of Grant Thornton International Ltd. All rights reserved.

University of New Brunswick- Review of shared services cost allocation methodology
UNB shared services review Schedule 4- straight line transition (no permanent discount)
A
I line Portfolio
8
Currrent allocation to
UNBSJ ($)
c
Current Difference
D Annual
Increase required
E G
Projected Year Projected Year Projected Year
1 2 3
23
H
Projected Year Projected Year
4 5
1 UW- Assoc Vice President (capital Planning & Property Dev) $ 16,292 $ 31,422 $ 6,284 $ 22,576 $ 28,861 $ 35,145 $ 41,430 $ 47,714 UW- Assistant Vice President (Finance & Corporate Services)
2 Corporate costs
3 Financial services
4 Radiation safety
5 Risk management
6 UW- Assistant Vice-President (Trust and Treasury)
7 FR- Harriet Irving library and Branches
8 UW -Information and Technology Services
UW-President
9 Government Relations Office
10 Human Rights Office
11 · President
12 University Secretary
13 UW - School of Graduate Studies
14
15
16
17
FR- Vice-President (Fredericton)
Integrated Recruitment and Retention
Registrar
Resource Planning & Budgeting
Scholarships
UW-Vice-President (Advancement)
18 Alumni
19 Communications & Marketing
20 Development & Donor Relations
21 Vice-President (Advancement) Office
UW- Vice-President (Finance & Corporate Services)
22 Human Resources & Organizational Development
23 Vice President (Finance & Corporate Services)
24 UW- Vice-President (Research)
25 UW - Contingencies and Provisions
26 SJ Registrar -International recruitment centre 27 Total $
36,939
165,771
11,400
106,701
470,044
173,818
115,428
14,600
123,854
24,850
20,326
61,38S
9,456
94,210
S7,586
201,508
141,055
5,886
117,339 >
35,554
30,000
252,551· 2,286,554 $
79,888 $ 244,166 $
7,169 $ 12,913 $ 34,757 $
157,617 $ 731,855 $
(88,993} $ 3,761 $
95,891 $ 70,285 $ 95,414 $
(20,326)
(61,385)
$ $
64,524 . $ 23,164 $
56,017 $ (54,165) $ (12,559) $
103,673 $ $
·182,051 $ 75,530 $ 95,355 $
(138) $ . (18;740) $
1,909,148 $
15,978
48,833
1,434
2,583
6,951
$. . 52,917 $ $ 214,605 $ $ 12,834 $ $ 109,284 $ $ 6,951 $
31,523
146,371
$ 501,567 $ $ 320,189 $
(17,799) . $ 752 $
19,178 $ 14,057 $ 19,083 $
(4,065) $ (12,277) $ 12,905 $
4,633 $
11,203 $ (10,833) $
(2,512) $ 20,735 $
97,629 $ 15,352 $
143,032 $ 38,907 $ 19,083 .$
16,26l $ 49,108 $ 22,361 $ 98,843 $
68,790 $ 190,675 $ 138,544 $
26,621 $
68,894 $ 263,438 $
14,268 $ 111,866 $
13,903 $ 533,091 $ 466,560 $
79,831 $ 16,105 $
162,210 $ 52,964 $ 38,165 $
12,195 $ 36,831 $ 35,266 $
103,475 $
79,993 $ 179,842 $ 136,032 $ 47,355 $
84,872 $ 312,271 $
15,702 $ 114,449 $
20,854 $ 564,614 $ 612,931 $
62,032 $ 16,857 $
181,388 $ 67,021 $ 57,248 $
8,130 $ 24,5S4 $ 48,171 $
108,108 $
91,197 $ 169,009 $
133,520 $ 68,090 $
100,850 $ 361,104 $
17,135 $ 117,031 $
27,806 $ 596,138 $ 759,302 $
44,234 $ 17,609 $
200,567 $ 81,078 $ 76,331 $
4,065 $ 12,277 $ 61,075 $
112,741 $
102,400 $ 158,176 $ 131,008 $
88,824 $
116,827
409,938
18,569
119,614
34,757
627,661
905,673
26,435
18,361
219,745
95,135
95,414
73,980
117,374
113,604
147,343
128,496
109,559
36,410 $ 153,750 $ 190,160 $ 226,570 $ 262,980 $ 299,390
15,106 $ 15,106 $ 30,212 $ 45,318 $ 60,424 $ 75,530
19,071 $ 54,625 $ 73,696 $ 92,767 $ 111,838 $ 130,909
(28) $ 29,972 $ 29,945 $ 29,917 $ 29,890 $ 29,862
> (3,748) $ .· 248,803 $ 245,055 $ 241,307 $ 237,559 $ 233,811 3iii;ii3'0 $ 2,668,383 $ 3,050,213 $ 3,432,042 $ 3,813,872 $ 4,195,702
This schedule forms part ot, and should be read in conjunction with, the accompanying Grant Thornton lLP Review of Shared Services Cost Allocation Methodology dated August 28, 2013.
Audit • Tax • Advisory ©Grant Thornton LLP. A Canadian Member of Grant Thornton International Ltd. All rights reserved.

__ _)
University of New Brunswick- Review of shared services cost allocation methodology 24
UNB shared services review Schedule 5- straight line transition (30% permanent discount}
A
Line Portfolio
UW- Assoc Vice President (Capital Planning & Property Dev)
UW- Assistant Vice President (Finance & Corporate Services)
2 Corporate costs
3 Financial services
4 Radiation safety
5 Risk management
6 UW- Assistant Vice-President (Trust and Treasury)
7 FR- Harriet Irving Library and Branches
8 UW -Information and Technology Services
OW-President
9 Government Relations Office
10 Human Rights Office
11 President
12 University Secretary
13 UW- School of Graduate Studies
FR- Vice-President (Fredericton}
14 Integrated Recruitment and Retention
15 Registrar
16 Resource Planning & Budgeting
17 Scholarships
UW-Vice-Presldent {Advancement)
18 Alumni
19 Communications & Marketing
20 Development & Donor Relations
21 Vice-President (Advancement) Office
UW- Vice-President {Finance & Corporate Services}
22 Human Resources & Organizational Development
23 Vice President (Finance & Corporate Services)
24 UW- Vice-President (Research}
25 UW- Contingencies and Provisions
26 SJ Registrar -International recruitment centre
27 Total
B
Currrent
allocation to
$
UNBSJ ($)
16,292 $
36,939
165,771
11,400
106,701
470,044
173,818
$ $ $
$ $ $ $
115,428 $
14,600 $ 123,854' $
24,850 $ $
20,326 61,385
9,456
94,210
57,586 $ 201,508 $ 141,055 $
5,886 $
117,339
35,554
30,000
252,551 2,286,554
$
$
$ $ $ $
c
Current
Difference
31,422
79,888
244,166
7,169
12,913
34,757
157,617
731,855
(88,993)
3,761
95,891' 70,285
95,414'
(20;326)
(61,385)
64,524
23,164
56,017
(54,165)
(12,559)
103,673
182,051
75,530
95,355
{138)
(18,740) 1,909,148
D E F G H I J K
Current
difference to Annual Permanent discounted Increase Projected Year Projected Year Projected Year Projected Year Projected Year
discount
30% $
'30%
30%
30%
30%
30%
30%
30%
30%
30% 30%'
30%
30%
30%
30%
30%
30%
30%
30%
30% 30%,
amount
21,996' $
55,922 $
170,916 $ 5,018 '$
9,039 $
24,330 $
110,332 $ .512,299 $
(62,295) $
2,633 $
67,123 $
49,200 $ 66,790 $
required
'5,499
13,980
42,729
1,255
2,260
6,083
27,583
128,075
$
$ $ $ $ $ $ $
(15,574) $ 658 $
16,781 $ 12,300 $ 16,697 $
(14,228) $ (3,557) (42,969} $ (10,742)
45,167 $ 11,292
16,215 $ 4,054
39,212 $ (37,916) $
(8,791) $ 72,571 $
9,803 $ {9,479) $
(2,198) $
18,143 $
1
21,791
50,919 $ 208,500 $
12,655 $ 108,961 $
6,083 $
497,627 $
301,892 $
99,854 $ 15,258 $
140,635 $ 37,150 $ 16,697 $
16,769 $ 50,642 $ 20,748 $
98,264 $
67,389
192,029
138,858
24,029
2
27,290
64,900 $ 251,230 $ 13,909 $
111,220 $ 12,165 $
525,210 $ 429,967 $
84,281 $ 15,917 $
157,416 $ 49,450 $ 33,395 $
13,212 $ 39,900 $ 32,040 $
102,317 $
77,192 $
182,550 $ 136,660 $
42,171 $
3
32,789 $
78,880 $ 293,959 $
15,164 $
113,480 $ 18,248 $
552,793 $ 558,042 $
68,707 $ 16,575 $
174,197 $ 61,750 $ 50,092 $
9,655
29,158
43,331
106,371
86,995 $
173,071 $ 134,462 $
60,314 $
4
38,288 $
92,861 $ 336,688 $
16,418 $
115,740 $ 24,330 $
580,376 $
686,116 $
53,133 $ 17,233 $
190,977 $
74,049 $ 66,790 $
6,098 $ 18,415 $ 54,623 $
110,425 $
96,798
163,592
132,264
78,457
5
38,288
92,861
336,688
16,418
115,740
24,330
580,376
686,116
53,133
17,233
190,977
74,049
66,790
6,098
18,415
54,623
110,425
96,798
163,592
132,264
78,457
30% 127,436 $ 31,859 $ 149,198 $ 181,057 $ 212,916 $ 244,775 $ 244,775
30% 52,871 $ 13,218 $ 13,218 $ 26,436 $ 39,653 $ 52,871 $ 52,871
30% 66,748 $ 16,687 $ 52,241 $ 68,928 $ 85,615 $ 102,302 $ 102,302
30% (97) $ (24) $ 29,976 $ 29,952 $ 29,928 $ 29,903 $ 29,903
30% (13,118) $ ' ., (3,279) $ 249,272 $ 245,992 $ 242,713 $ 239,433 $ 239,433 $ 1,336,404 $ 334,101 $ 2,620,655 $ 2,954,755 $ 3,288,856 $ 3,622,957 $ 3,622,957
This schedule forms part of, and should be read in conjunction with, the accompanying Grant Thomton LLP Review of Shared Services Cost A!!ocatlon Methodology dated August 28, 2013.
Audit • Tax • Advisory ©Grant Thornton LLP. A Canadian Member of Grant Thornton lnlernational Ltd. All rights reserved.

University of New Brunswick- Appendix A- Current shared services 25
Appendix A - Current shared services
2011/12 2012/13 Approved Budget ProForma Budget Notes
Academic and Student SUI!(!Ort FR- Harriet Irving library and Branches
Acquisitions (Total budget is $3.1 M.) $ 1,451,000 1,500,000
UW-Schooi of Graduate Studies Total
UW-Vice President (Research) Total 937,373 956,929
Academic and Student Support Total 2,3B8,373 2,456,929
Administration and SUI!I!Ort Services FR- Vice-President (Fredericton-Academic)
Scholarships (Administration and UW Scholarships) 474,009 475,522 Office of the Registrar 773,242 779,844 Integrated Recruitment & Retention 983,881 996,727 Resource Planning & Budgeting Team (Institutional Research salaries only) 115,449 115,449
FR- Vice-President (Fredericton-Academic) Total 2,346,581 2,367,542
SJ-Assoc VP (Saint John) International Recruitment Centre 505,102 505,102
UW-Assistant Vice President (Finance & Corporate Services) Campus Safety 146,981 150,427 Corporate Costs 469,912 477,918
Financial Services 1,859,120 1,913,597 Radiation Safety 68,334 72,501 Risk Management 683,644 701,112
UW-Assistant Vice President (Finance & Corporate Services) Total 3,227,991 3,315,555
UW-Assoc Vice President(Capital Planning & Property Development) Total 263,170 272,781
UW-Chief Advancement Office Alumni 378,594 391,968 Chief Advancement Office 306,833 319,480 Communications & Marketing 482,107 509,160
Development & Donor Relations 474,733 512,195 UW-Chief Advancement Office Total 1,642,267 1,732,803
UW-integrated Technology Services Total 4,350,485 4,504,999
UW-President Government Relations Office (3,966) (1,299)
Human Rights Office 72,424 72,424
President 890,080 912,058 University Secretary 383,723 400,216
UW-President Total 1,342,261 1,383,399
UW-Vice President (Finance & Corporate Services) Human Resources & Organizational Development 1,153,596 1,189,140
Vice President (Finance & Corporate Services) 329,088 345,995
UW-Vice President (Finance & Corporate Services) Total 1,482,684 1,535,135
Administration and Support Services Total 15,160,541 15,617,316
University-wide, Corporate or Shared Service Budgets $ 17,548,914 $ 18,074,244
Notes: 1 Placehoide~ used lacking Condon/O'Sullivan methodology, 2 Removed in favour of campus-specific budgeting.
Audit • Tax • Advisory ©Grant Thornton LLP. A Canadian Member of Grant Thornton International Ltd. All rights reserved.

University of New Brunswick- Appendix B -Interview list
Appendix B - Interview list
Portfolio
Fredericton Harriet Irving Library
VP Fredericton
Registrar
Resource Planning & Budgeting
Finance & Corporate Services
Trust and Treasury
Capital Planning & Property Development
Information Technology Services
President
University Secretary
School of Graduate Studies
Advancement
Development & Donor Relations/ Alumni
VP Finance & Corporate Services
Research
Saint John
Assistant VP Finance & Corporate Services
VP Saint John
Registrar
International Recruiting Centre
Audit • Tax • Advisory
Manager
John Teskey
Anthony Secco
David Hinton
Tim Walker
Karen Cunningham, Cindy Flann, Trevor Gonnason
Larry Guitard
Barbara Nicholson
Terry Nikkel
Eddy Camp bell
Sarah De V arenne
Edmund Biden
Bob Skillen
Peter Coates
Dan Murray
Dwight Ball
Chris Callbeck, Heather Finkle
Robert McKinnon
Mark Bishop
Angelique Simpson
©Grant Thornton LLP. A Canadian Member of Grant Thornton International Ltd. All rights reserved.
26
University of New Brunswick- Appendix C- Non-sha~ed budget amounts
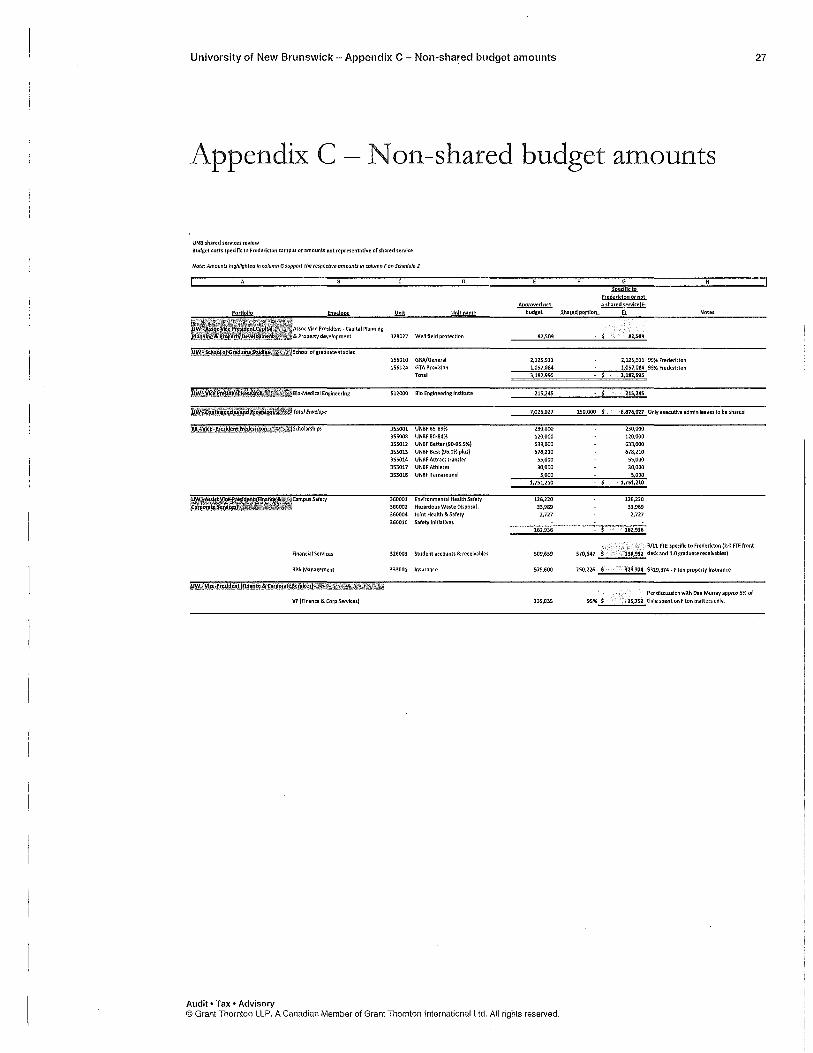
Appendix C- Non-shared budget amounts
UNBsharedservlce.srevlew Budget com sped fie to Fredericton campw or ilmounts not representative of shared service
Note: Amounts hfghlfghted in column G support the respective amounts In column F on Schedule 2
156010 GRA/Gemual 156124 GTA Provision
To till
512000 BioEngineering Institute
355001 UNBFBS-89% 355008 UNBFB0·84% 355012 UNBF Better (90·95,9%) 355013 UNBF Best (96.0% plus) 355014 UNBFAttracttransfer 355017 UNBFAthletes 355018 UNBFTurnaround
360001 Environmental Health Safety 360002 HazardousWasteO!sposal
360004 Jo!ntHealth&Safety 360010 Safety Initiatives
Flnandal5eNlces 326003 Studentaccounts&recelvables
RlikManagement 333001 Insurance
VP(Anance&Corp5ervlces)
Audit • Tax • Advisory
2,125,911 2,US,911 99% Fredericton
---,;:s:~::;~~;s:~;;::!:;------,;--;;'":~:;!~;::~5-s:_ 99% Frederltton
215,245 215,245
_ ___;7,.,,0:;,26,.,,0"'27'---'"'"'''0""00::...,;'--''"'''"'""''02.,_7 Only e~ecutlve admln leaves to be shared
230,000
120,000 633,000 678,210
55,000 30,000
5,000 1,751,210
126,220 33,989
2,727
162,936
509,639
579,600
335,035
230,000 120,(}{)()
633,000 678,210
55,000 30,000
5,000 1,751,210
126,220 33,989
2,727
3/11 FTE specific to Fredericton {2.0 FTE front
370,647 -"---';;.:;':.'•99;.;;2:..desk and 1.0 graduate receivables}
250,226
95% $
329,31-4 $329,374-F'tonpropertylnsurance
Per discussion with Dan Murray approx 5% of 16,751 time spent on F'ton matters only.
©Grant Thornton LLP. A Canadian Member of Grant Thornton International Ltd. All rights reserved.
27

University of New Brunswick- Appendix C -Non-shared budget amounts
Appendix C - Non-shared budget amounts
Budget costs spedflc to Fredericton campus or amounts not representative of shared service
Note: Amounts hfghlighted fn column G support the respf!d{ve amounts In column F on Schedule 2
Spedflcto fredericton or not
Anproved net a shared servicefE· ~ Slured portion fL
28
$50,000 USD for Slrsl.system. Increase of S%·6% 171000 HarrletlrvlngUbrary
171100 Acqul5ltlons
171104 Circulation department 171105 Collections 171108 ElectronlcTe:o:tCentre 171110 Adm!nlstrntlve 171111 llbrai)'Systems
171112 Mltrofonns 171114 SdenceandFore.5try
Library photocopying 173000 Hll·Photocopy!ng
515,653 50,000
611,467 101,352
1,908,083 125,000 237,015 108.466 278,633 509,457 384,490 168,409 302,139
561,676 5,308,613 553,227
{27,599)
Annu.;l Ave[ii!&e
465,653 annuaUy.
510,115 PerdiscusslonwlthlohnTeskey-estlmatels $125,000, time and motion study would be slgnlficantundertaklng.Representsapprox6.5%
1,783,083 oftotalcosts. 128,549
278,633 509,457 216,081 302,139 561,676
4,755,386
(27,599)
charrl!fotE Portlonofbudget Approved cross Resources related to
.!!..lli!u!. fsharedl Fredericton
LlbratYacqu!slt!ons 112000 Harriet liVIng Acquisitions 3,054,676 2,400,000
"oftotal
~budgetedsalary
676,450 16.8% 4,033,801
Per discussion with TeriY Nickel, makes sense to aUocate non·salary budget on the ratio calculated above (17~) as Fredericton staff would we a similar portion of non salary budget to supportthemlnthelrwork.Thus
$2,400,000relatedtoE·Resourcesforboth 654,616 campuses
Totalnonsalarybudget $1,n8,745 Allocation per above 16.8% Non salary related to Fredericton only 298,287
Port!onrelatedtoFrederlctoncampus
Per discussion with llm Walker approx 5 staff (m) of the total staff of 8.7 m In his department work on shared services. Thus 3.7 FfE should be allocated to Fredericton only. Allocation
Total budget l'iltlo AlloCiltlon to Fredericton only Allociltion to Fredericton (salary)
AUociltlon to Fredericton (non·salary) Total
511,896 43% 217,703
49,058 43%...,--------:.;;:!~,·:;:;:;;-
Per llm Walker 5 staff that work on shared services wlth In RPB are as follows: Staff member Department
RunuKumarl lnstltutlonalresearch RuthFreeman lnstltutlonalresearch PamMcKay Financial
Mark Warner Tim Walker
Audit • Tax • Advisory
Flnanclal As.slstantVlcePresldent
©Grant Thornton LLP. A Canadian Member of Grant Thornton International Ltd. All rights reserved.
974,700

University of New Brunswick- Appendix D- Space operating costs
Appendix D - Space operating costs
UNB shared services review
Space operating costs
Tlm_Bidg_ Dept Tim_Bldgc-Dese
Grand total -Fredericton space
Note: space operating costs include costs such as building maintenance, grounds keeping, utilities and cleaning.
UW-A&alat VIce- UW-A&aoc VIce President Prnldent(Caplt.
Total costs FA-Harriet Irving FR-VIco-
Ubrary and Pru.ldent (Finance & I Planning & UW-Infonnatfon Corpo~t111 Property Technology
LKUPSqft ($) Branch'" (Fredericton) SoMe-) Dwcdopment) Servieo.
1,487,077 $ 13,759,347 923,326 2,008,990 70,663 68,004 301,383
UWPr-ldent
22,472
AJiocatlon of Fredericton shared space costs
Add: 70,663 68,004 250,751 N1 $ 22,472
29
UW·VIco-Proal dent UW- Aso.iet Vice
UW..School of UW-Vlcc- (Ananco & UW-Vico- President Graduate Praldont Corporato President (Trust and Studloa (Advan011ment) Servh;:ea) (Research) Trouury) IRC Total
15,413 30,180 36,105 137,352 3,344 $ 13,759,247
15,413 30,180 34,300 N1 $ 137,352 $ 3,344 632,478
Allocation of Saint John shared space costs 4,117 N2 4,117 N2 8,234 Total - $ - $ 70,663 $ 68,004 $ 250,751 $ 22,472 $ 15,413 $ 34,297 $ 34,300 $ 137,352 $ 3,344 $ 4,117 $ 640,712
N1 -appropriate to reduce the ITS space operating costs by 16.8%, (see "Non shared budget amountsM tab) as this represents the portion of the UW-ITS budget that is attributed only to the Fredericton campus.
N2- UW Advancement
Mary Outley {Alumni Office) Marianne Williams (Fundralslng) Heather Campbell (Comm& Marketing) Trffany Durling (Comm & Marketing) Patty O'Brien (Comm & Marketing) Dave Emerson (Gov't relations}
IRC Angelique Simpson Chris Beardsworth Andrew Dunphy Susan Fitzgerald Leslie Dickie JenniferWaldschutz
Total SJ space costs
Audit • Tax • Advisory
Space costs 686.2
686.2 686.2
6862
6862 6862
$ 4,117
6862
686.2 686,2
686.2
686.2
686.2
~
(Note: Per discussion with Heather Ankle space operating costs are $4.70/sqtt. Tim Walker has estimated office space at 146/sqft, as Heather advised that she doesn't have this information readlty available) List of people occupying space in Saint John for Uwide portfolios as provided by
Is 8,2341
Thls schedule forms part ol, and should ba read in conjunction with, the accompanying Grant Them ton UP Review of Shored Services Cost Allocation Methodology dated August 28, 2013.
<1'1 Grant Thornton LLP. A Canadian Mernber of Grant Thornton International Ltd. All rights reseNed.

University of New Brunswick- Appendix E- Fringe benefits
Appendix E- Fringe benefits
Line Portfolio
1 FR Assist. V1te-Pres1dent Fredericton (Academic) 2 FR-AssocVice President Academic (learning Environment)
FR-Centre for Enhanced Teaching & learning FR-Facil!tles. Management
5 FR-FacultyofArts 6 FR-FacultyofBuslnessAdmlnlstratlon 7 FR-Faculty of Computer Sdence 8 FR-FacultyofEducatlon 9 fR-FacultyofEnglneerlng 10 FR·faculty of Forertry and Environmental Management 11 FR-Faculty of Kinesiology U FR-Facultyoflaw 13 FR-FacultyofNursing 14 FR-FacultyofScience 15 FR·Frederlcton campus Provisions & Allocations 16 FR-Harrlet Irving Ubr.uy and Branches 17 FR-Renalssance College 18 FR-Resldentlal Ufe, Campus & Conference Services 19 FR-Student Affairs and Services 20 FR-VIce President (Fredericton Academic) 21 UW-Asslstant VIce President (Anance & Corporate Services) 22 UW-Assoc VIce President (Capital Planning & Property Development) 23 UW-Contlngencles & Provisions 25 UW-Informatlon Technology Services 26 UW-Presfdent 21 UW-School of Graduate Studies 28 UW-Trurt and Treasury 2.9 UW-VIce President (Advancement) 30 UW-VIce President (Anance & Corporate Services) 31 UW-Vlce President (Research) 32 51-International recruitment Centre 33 Gr.tndTotal
Supportlnr documentation HarrletlrvlngUbrary
Hllsa!ary Sa!arycostspedficto Fredericton:
%of total specific to Fredericton
FR-VltePresident Total portfolio salary SalarycostspedfictoFredericton
%of total specific to Fredericton
UW • Information TechnoiO£Y Total portfolio salary Salarycostspedflcto Fredericton
~ of total specific to Fredericton
UW VIce President {Finance & Corporate Services) Total portfolio salary SalarycostspedfictoFrederfcton
%of total specific to Fredericton
Total Fringe benefits
48,077 3,330
234,756 1,147,717 2,398,176 1,089,846
567,471 920,376
1,987,346 662,786 782,140 581,076
1,537,718 2,312,901
87,177 876,860
79,051 16,060
459,538 773,708 384,282
53,903 559,925 778,304 211,529 165,795 47,168
494,031 271,909 226,942 52,U5
19,637,669
tstmatea percent of
Exclude F'ton salary costs faculty early Total subject to specific to retirements allocatlon(B-C) Fredericton
48,077 100% 3,330 100%
234,756 100% 1,147,717 100%
261,542 2,136,635 100% 115,607 974,239 100%
59,950 507,521 100% 98,451 821,925 100%
198,012 1,789,334 100% 72,484 590,302 100% 49,158 732,981 100% 60,924 520,152 100%
167,437 1,370,281 100% 238,632 2,074,269 100%
87,177 100% 876,860 90%
79,051 100% 16,060 100%
459,538 100% 773,708 84%
384,282 0% 53,903 0%
559,925 100% 778,304 17% 211,529 0% 165,795 0% 47,168 0%
494,031 0% 271,909 1% 226,942 0%
52,125 0% 1,322,197 18,315,472 -
$ 4,792,960 $ 4,289,733
I '""I
$ 3,965,.591 $ 3,348,986
I 84~1
$ 4,033,801 $ 676,450
I 17>1
$ 1,362,092 $ 16,752
I 1~1
30
st matearnnge benefit cost Fringe benefit specific to subject to Fredericton shared service
campus(DxE) allocatlon(D-F)
48,077 3,330
234,756 1,147,717 2,136,635
974,239 507,521 821,925
1,789,334 590,302 732,981 520,151
1,370,281 2,074,269
{87,177) 784,796 92,054 See below 79,051 16,060
459,538 553,405 120,303 See below
384,282 53,903
559,925 130,518 647,786 5eebelow
211,529 155,795 47,168
494,031 2,853 269,056 See below
226,942 52,125 See below
15,550,488 2,764,984
International recruitment centre 278,000 As provided by -total salary of staff working In the IRC
.....----;;2'?8,':':::~='-% As provided fringe benefits as a percent of total salary
Tha ~hedvl& forms pa!1 or. and should be rudm eonJIUICI!oo With. Ill$ aeeompatl'f!f\9 Grant Thornton llP Review ol Shared Sel"lllees Cos! Al!oeallon Methodologydaled August 28, 2Cl13.
Audit • Tax • Advisory ©Grant Thornton LLP. A Canadian Member of Grant Thornton International Ltd. All rights reserved.
mahboob
Sticky Note
Accepted set by mahboob

University of New Brunswick- Appendix F- Administrative costs comparative 31
Appendix F - Administrative costs ...
comparative
UNB shared services review Administrative costs comparative Caubo e)(penditures by fund (2010- 2011)
%of general %of general %of general General operating operating operating operating
Campus Library($) expenditure Computing($) expenditure Admin($) expenditure expenditure($)
Saint John Campus- current state model 1,517,612 4.00% 556,940 1.47% $ 4ASB,297 11.75% 37,956,729
Fredericton Campus- current state model 9,180,412 5.78% 5,224,027 3.29% 14,441,148 9.10% 158,749,054
Total 10,698,024 5.44% 5,780,967 2.94% 18,899,445 9.61% 196,705,783
Acadia University 2,750,000 4% 2,032,000 3% 5,417,000 8.60% 62,988,372
Cape Br~ton UnivefsitY ·1,497,000 4% 1,305,0~0 3% ~-4,963,000 12.80% 38,773,438
Dalhousie 15,249,000 4% 12,364,000 3% 24,486,000 6.70% 365,462,687
Moun_t-AIIIson University -2,081,000 5% 1,796,000 4% '~,048,000 7.60% 40,105,263
Mount Saint Vincent University 1,914,000 5% 2,043,000 5% 4,881,000 12.00% 40,675,000
Saint Mary's University 4:075,000 5% 3,842,000 4% 11,924,000 13.40% 88,985,075
St. Francis Xavier University 3,205,000 5% 2,340,000 3% 8,551,000 12.10% 70,669,421
st: Thomas :YnrversrtY • 1,486,000 5% 1,053,000 4% 3;757,000 13.70% 27,423,358 Universite de Moncton 4,588,000 5% 4,900,000 5% 12,139,000 12.40% 97,895,161
Unlversfty Of.Prlnce Edwa_rd Island 3,441,000 4% 2,449,000 3% 7,370,000 8.00% 92,125,000 Select Maritimes Universi!~es Average 4,635,000 5% 3,628,000 4% 9,585,000 9.40% 101,968,085
Saint John Campus- future state model (Nl) 1,675,229 3.11% 4,886,765 12.26% 39,865,877
FrederictOn Campus- future State model (Ni) 9,022,795 2.90% -14/o12;sso 8.93% 156,839,906
Total 10,698,024 5.44% 5,780,967 2.94% $ 18,899,445 9.61% 196,705,783
N1- Excludes space operating costs as these costs are not Included In Caubo expenditures
This schedule fonns part of, and should be read ln conjunction with, the accompanying Grant Thornton LLP Review of Shared Sar.ices Cost Allocation Methodology dated August 28, 2013,
Audit • Tax • Advisory ©Grant Thornton LLP. A Canadian Member of Grant Thornton International Ltd. All rights reserved.

University of New Brunswick- Appendix G- Administrative costs comparative 32
Appendix G - Administrative costs comparative small schools (UNBSJ)
UNB shared services review Administrative cost comparative Small universities ($25- $75M)
Total Library Computing Admin Library,
%of %of %of Computing, %of Total General General General General
Operating Operating Operating &Admin Operating General Operating
Ubrary Expenditure Per Student Computing Expenditure Per Student Admin Expenditure per Student Expenditure Expenditure per Student Expenditures Per Student
St. Francis Xavier $3,205,000 45% s 712 $2,340,000 3.3% s 520 $8,551,000 12.1% s 1,899 s 14,096,000 19.9% s 3,130 $70,723,000 $15,706
University of Northern BC 3.488,000 5.0% 1,192 4,631,000 6.6% 1,583 8,978,000 12.9% 3,068 17,097,000 24.5% 5,843 69,n4,000 23,846
Acadia University 2,750,000 4.4% 836 2,032,000 3.2% 618 5,417,000 8.6% 1,647 10,199,000 16.3% 3,100 62,670,000 19,049
Nlplsslng University 2,115,000 3.5% 469 2,662,000 4.4% 590 7,995,000 13.2% 1,771 12,n2,ooo 2l.OO..b 2,829 60,693,000 13,446
Brandon University 2,747,000 6.1% 1,019 1,393,000 3.1% 517 4,705,000 10.4% 1,746 8,845,000 19.6% 3,282 45,169,000 16,760
Roy<~! Ro;1ds University 1,398,000 3.2% 559 3,044,000 7.0% 1,218' 11,969,000 27.6% 4,790 16,411,000 37.9% 6,567 43,357,000 17,350
Mount Saint Vincent 1,914,000 4.7% 712 2,043,000 5.0% 760 4.881,000 12.0% 1.817 8,838,000 21.6% 3,289 40,836,000 15,198
Mount Allison University 2,081,000 5.2% 876 1,796,000 45%' 756' 3,048,000 7.6% 1,283 6,925,000 17.3% 2,915 39,983,000 16,828
Cape Breton University 1,497,000 3.9% 580 1,305,000 3.4% 505 4,963,000 12.8% 1,921 7,765,000 20.0% 3,006 38,830,000 15,033
SL Thomas University 1,486,000 5.4% 626 1,053,000 3.8% 444 3,757,000 13.7% 1,584 6,296,000 22.9% 2,654 27,489,000 11,589
Average 2,268,100 4.6% 758 2,229,900 4.4% 751 6,426,400 13.1% 2,152 10,924,400 22.1% 3,662 49,952,400 16,480
UNBSJ Current State 1.517,612 4.0% 713 556,940 15% 262 4,458,297 11.7% 2,094 6,532,849 17.2% 3,069 37,956,729 17,828
UNBSJ Future State 1,675,229 4.2% $ 787 1.238,876 3.1% $ 582 4,886,765 12.3% $ 2,295 7,800,870 1.9.6% $ 3,664 39,865,877 $ 18,725
Source: CAUBO, Financial Information of Universities and Colleges, 2010-11, Enrolment PSIS Stats Can 2009-10
This schedule forms part of, and should be read In conjunction with, the accompanying Grant Thornton LLP Review of Shared Services Cost Allocation Methodology dated August 28, 2013.
Audit • Tax • Advisory @Grant Thornton LLP. A Canadian Mernber of Grant Thornton International Ltd. All rights reserved.
University of New Brunswick- Appendix H- Administrative and general cost comparative
Appendix H - Administrative costs comparative large schools (UNBF)
UNB shared services review
Administrative cost comparative Large universities ($120M ·$200M)
Ubrary
%of General
Operating
Ubrary Expenditure Per Student
Laurentian ,Unlve~lty ·:, ,
Wilfred Laurier University
;untvers'ltv Of Regina Mount Royal University
'! $' ~,603;000· !.' ,3.8% $760.
8,908,000 4.6% 591
-·a,i3G:oOO _. 5.3% ' '·· so? ~ 6,889,000 4.0%
University' o_f-l.~~~~dge.:·.~-
UNBF Current State
Computing %of
General
Operating
Admin
%of General
Operating
Total Ubrary,
Computing,
&Admin Computing Expenditure Per Student Admin Expenditure Per Student Expenditure
I ·- ,;,·s~:·:r:~,1~~~::~:l1;- ;~~:, _:~~~·J·EtJ4:~·s.~~-Oo~ ~J.: . -~.~·.1 ~A;l;~-~ _;: :~~-:~ .. ;:~·::$~~~~3}1_,::: ;e-:,·(;:;1 ·,·A~;243,o~q~. ,. 38,289,000
12,867,000 7.5% 904 21,377,000 12.4% 1,502
Total %of
General
Operating General Operating
Expenditure per Student Expenditures
17.6% $3,508 s 120,449,000
19.9% 2,541 192,200,000
22.1% 3#374, 154,185,000
2,890 172,557,000
3,987 135,103,000
3,260 154,898,800
3,961 158,749,054
33
Per Student
-:. $19,889'
12,755
'.1S.295'
21,800
UNBF Future State 3,787 $ 156,839,906 $ 21,538
Source: CAUBO, Anandallnformatlon of Universities and Colleges, 2010-11, Enrolment PSIS Stats can 2009-10
This schedule forms part of, and should be read in conjunction with, the accompanying Grant Thornton LLP Review of Shared Services Cost Allocation Methodology dated August 2S, 2013.
Audit • Tax • Advisory ©Grant Thornton LLP. A Canadian Member of Grant Thornton International Ltd. All rights reserved.
University of New Brunswick- Review of shared services cost allocation methodology 34
Grant Thornton An instinct for growth"
www.GrantThornton.ca
Audit • Tax • Advisory
© Grant Thornton LLP. A Canadian Member of Grant Thornton International Ltd. All rights reserved.
Audit • Tax • Advisory ©Grant Thornton LLP. A Canadian Member of GrantThornton International Ltd. All rights reserved.