
Grant Agreement No.: 723576 DryFiciency
38
Grant Agreement No.: 723576 DryFiciency Waste Heat Recovery in Industrial Drying Processes H2020-EE-2016-2017-PPP Valorisation of waste heat in industrial systems (SPIRE PPP) Interim report on the heat pump technologies developed D4.5 Revision: R-2 This Deliverable is a summary of WP1, WP2 and WP3 Deliverable Leader: Michael Lauermann (AIT) Authors: Michael Lauermann (AIT), Veronika Wilk (AIT), Michael Bantle (SINTEF), Sigurd Sannan (SINTEF), Annemarie Schneeberger (AIT) Project co-funded by the European Commission within H2020 Programme Dissemination Level PU Public x CO Confidential, only for members of the consortium and the Commission Services
Transcript of Grant Agreement No.: 723576 DryFiciency
Grant Agreement No.: 723576
DryFiciency
Waste Heat Recovery in Industrial Drying Processes
H2020-EE-2016-2017-PPP
Valorisation of waste heat in industrial systems (SPIRE PPP)
Interim report on the heat pump technologies
developed
D4.5
Revision: R-2
This Deliverable is a summary of WP1, WP2 and WP3
Deliverable Leader: Michael Lauermann (AIT)
Authors: Michael Lauermann (AIT), Veronika Wilk (AIT), Michael Bantle (SINTEF), Sigurd Sannan (SINTEF), Annemarie Schneeberger (AIT)
Project co-funded by the European Commission within H2020 Programme
Dissemination Level
PU Public x
CO Confidential, only for members of the consortium and the Commission Services

D4.5 2/38
TABLE OF CONTENTS
EXECUTIVE SUMMARY ................................................................................................................ 4
1 INTRODUCTION ................................................................................................................. 4
2 CLOSED LOOP HEAT PUMP SYSTEM ............................................................................. 6
2.1 Boundary conditions for the heat pump demonstrators ........................................................ 6
2.2 Screw and Piston compressor prototypes............................................................................ 8
2.3 Lubricant ............................................................................................................................. 9
2.4 Closed loop refrigeration cycle .......................................................................................... 10
2.5 Heat pump prototypes ....................................................................................................... 21
3 OPEN LOOP HEAT PUMP SYSTEM ................................................................................ 23
3.1 Configuration of the open loop cycle .................................................................................. 23
3.2 Required De-superheating ................................................................................................ 26
3.3 Size of the open loop heat pump ....................................................................................... 28
3.4 Turbo compressor prototypes ............................................................................................ 29
3.5 Open loop heat pump test results with the C38 turbo compressor ..................................... 30
3.6 Open loop heat pump test results with the EA42 turbo compressor ................................... 35
4 CONCLUSIONS ................................................................................................................ 37
4.1 CLOSED LOOP ................................................................................................................. 37
4.2 OPEN LOOP ..................................................................................................................... 38
NOTES: For comments / suggestions / contributions to this document, contact: Leader for this Deliverable at
email: [email protected] or Coordinator of DryFiciency project at [email protected]. For
more information on the project DryFiciency, link to www.dryficiency.eu
Statement of originality:
This deliverable contains original unpublished work except where clearly indicated otherwise.
Acknowledgement of previously published material and of the work of others has been made through
appropriate citation, quotation or both.
D4.5 3/38
List of abbreviations
AT Austria
AGA Agrana
COP Coefficient of Performance
EVI Enhanced Vapor Injection
GWP Global Warming Potential
HEX Heat exchanger
HFO Hydrofluoro-Olefin
IHX Internal Heat Exchanger
MVR Mechanical Vapor Recompression
SHS Superheated steam
VHE Viking Heat Engines
WBG Wienerberger
D4.5 4/38
EXECUTIVE SUMMARY
Deliverable D4.5 Interim Report in the heat pump technologies developed reports on the design and
configuration of the three novel heat pump prototypes and the research and development work
undertaken on component and heat pump unit level so far. It provides an overview on the first project
results achieved and on the reasoning of how certain decisions were made.
More information on the high temperatures heat pump systems developed, especially their
performances in industrial environment, will be provided in D5.4. Final report on the heat pump
technologies developed at the project end.
1 INTRODUCTION
Industrial drying and dehydration processes require vast amounts of energy. Estimates show, that
in developed countries 12 to 25% of the industrial energy consumption is attributable to industrial
drying. Currently, most of this energy is based on the use of fossil fuels with no or little utilization of
waste heat streams. Hence, there is great potential for more efficient and environment-friendly
technologies within industrial drying processes.
In the DryFiciency project, three novel high temperature heat pump systems are developed and
demonstrated thereby utilizing waste heat streams from three drying processes and
applications:
In the agricultural raw material application, the heat pump technology is
used for starch drying. The technology demonstration takes place at Agrana
Stärke GmbH (www.agrana.com) in Pischelsdorf, Austria.
The application in the ceramic sector is focusing on integrating a novel heat
pump technology for green brick drying. The technology is implemented by
Wienerberger AG (www.wienerberger.com) in Uttendorf, Austria.
The application for the waste management industry is geared at sludge
respectively biomass drying. The heat pump drying system is developed by
Scanship A/S (www.scanship.no) and installed in a land-based waste
management system in Drammen, Norway.
The three advanced high temperature heat pump systems comprise of two closed loop heat
pump systems based on the novel refrigerant Opteon™ MZ (R-1336mzz(Z)) and one open loop
heat pump system using water (R-718) as refrigerant.
The main innovations on the closed loop heat pump systems include:
Two advanced compressor technologies, modified screw compressors by
Bitzer Kühlmaschinenbau GmbH (www.bitzer.de) and novel piston
compressors by Viking Heat Engines (www.vikingheatengines.com) allowing
discharge temperatures up to 160°C. Two screw compressors are integrated
in the heat pump application at Agrana for starch drying; the one for brick
drying at Wienerberger uses eight piston compressors. Details on the
development work are included in section 2.1.1 respectively 2.1.2.
D4.5 5/38
A unique synthetic lubricant for high temperature applications developed
by FUCHS (www.fuchs.com) for both compressors being sufficiently viscous
and chemically stable with the refrigerant selected, OpteonTM MZ from
Chemours, at elevated temperature levels. Details on the development work
are included in section 2.3.
OpteonTM MZ from Chemours (www.chemours.com), a synthetic refrigerant
based on HFO (hydrofluoro-olefin), was developed for high temperature
applications with heat supply temperatures of up to 160°C prior to the project.
It has a low GWP (Global Warming Potential) of 2 and shows a number of
favourable characteristics, such as non-flammability and non-toxicity. It is
also not subject to the EU legislation to control F-gases (so called F-gas
regulation).
The design of the closed loop refrigeration cycle, which is based on
numerical simulations as described in more detail in section 2.4. It was
developed by AIT, who is also responsible for coming up with an appropriate
process control for the two air drying processes. More details on the process
control will be provided in D5.4. Final report on the heat pump technologies
developed.
The main innovation on the open loop heat pump system, commonly referred to as MVR
(Mechanical Vapour Re-compression), includes:
Advanced, low-cost, oil-free turbo-compressor technology from
ROTREX AS (www.rotrex.com) originating from the automotive sector further
developed to reach condensation temperatures of up to 160°C. Details on
the compressor prototypes developed within the DryFiciency project, and
their performance, are provided in section 3.4.
The design of the MVR system, which was elaborated and implemented by
EPCON (www.epcon.no) and SINTEF (www.sintef.no) in close cooperation
considering the boundary conditions of the drying application at Drammen. It
requires de-superheating as described in more detail in section 3.2. SINTEF
and ECPON are also responsible for the process control which will be
described in more detail in D5.4. Final report on the heat pump technologies
developed.
D4.5 6/38
2 CLOSED LOOP HEAT PUMP SYSTEM
In the following section, the boundary conditions of the two closed loop heat pump demonstrators,
which are both equipped with a water-to-water compression heat pump, are presented briefly
before the development work, the results achieved, and the reasoning thereof is elaborated on
component (compressors, lubricant) and heat pump unit level (configuration of refrigeration cycle,
sizing and positioning of heat pump prototypes).
2.1 Boundary conditions for the heat pump demonstrators
2.1.1 Drying process at Agrana
The starch drying process at Agrana is a continuous process in which starch particles are dried in a
flow dryer. The drying agent is air. It is preheated by a water-to-air heat exchanger with heat from a
heat recovery circuit fed from other drying processes. The drying agent is currently heated to around
160°C in a subsequent heat exchanger operated with steam from a natural gas power plant. After
preheating the drying air, the heat recovery circuit is used as the heat source for the high temperature
heat pump (inlet temperature of about 70°C). At the condenser side of the heat pump, the heat
provided is transferred to an intermediate circuit (pressurized water) and then via a water-to-air heat
exchanger to the drying agent. The heat supply temperatures are in the range of 110 to 160°C. The
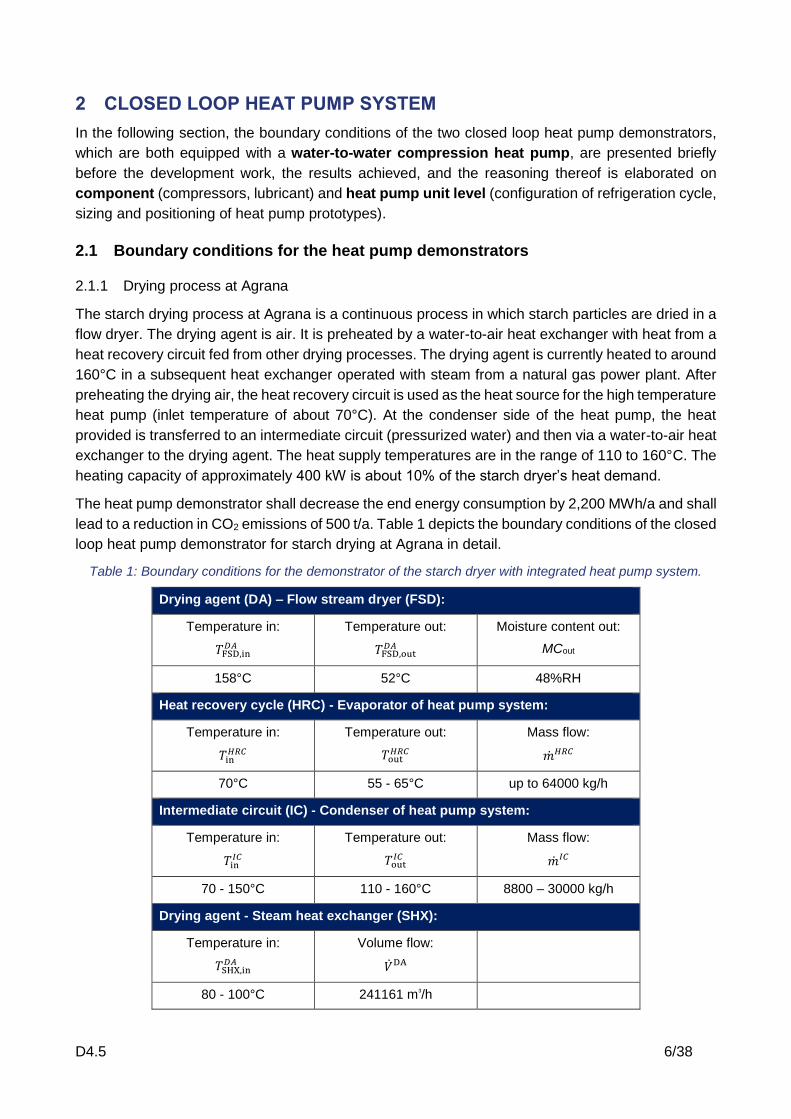
heating capacity of approximately 400 kW is about 10% of the starch dryer’s heat demand.
The heat pump demonstrator shall decrease the end energy consumption by 2,200 MWh/a and shall
lead to a reduction in CO2 emissions of 500 t/a. Table 1 depicts the boundary conditions of the closed
loop heat pump demonstrator for starch drying at Agrana in detail.
Table 1: Boundary conditions for the demonstrator of the starch dryer with integrated heat pump system.
Drying agent (DA) – Flow stream dryer (FSD):
Temperature in:
𝑇FSD,in𝐷𝐴
Temperature out:
𝑇FSD,out𝐷𝐴
Moisture content out:
MCout
158°C 52°C 48%RH
Heat recovery cycle (HRC) - Evaporator of heat pump system:
Temperature in:
𝑇in𝐻𝑅𝐶
Temperature out:
𝑇out𝐻𝑅𝐶
Mass flow:
�̇�𝐻𝑅𝐶
70°C 55 - 65°C up to 64000 kg/h
Intermediate circuit (IC) - Condenser of heat pump system:
Temperature in:
𝑇in𝐼𝐶
Temperature out:
𝑇out𝐼𝐶
Mass flow:
�̇�𝐼𝐶
70 - 150°C 110 - 160°C 8800 – 30000 kg/h
Drying agent - Steam heat exchanger (SHX):
Temperature in:
𝑇SHX,in𝐷𝐴
Volume flow:
�̇�DA
80 - 100°C 241161 m³/h

D4.5 7/38
2.1.2 Drying process at Wienerberger
In the brick drying process of Wienerberger, the drying air flows continuously in counterflow to the
bricks in the tunnel dryer. The bricks enter the tunnel dryer with a moisture content of about 28%
and are dried to about 2% moisture. A heat recovery cycle heats the drying air in the major zone of
tunnel dryer using internal heat exchangers and hot water with 90°C. The DryFiciency demonstrator
also uses this heat recovery cycle as a heat source. The evaporator of the DryFiciency demonstrator
is integrated before the hot water enters the internal heat exchangers of the tunnel dryer. The high
temperature heat pump provides hot air via an intermediate circuit (pressurized water) where supply
temperatures of up to 160°C can be achieved. The hot air is fed into the outlet zone of the tunnel
dryer, where the highest temperatures are required. The heating capacity of the heat pump
demonstrator, which is replacing a natural gas burner, is approx. 400 kW. The heat supply
temperatures are in the range of 110 to 160°C. The anticipated energy savings add up to 84% of the
current final energy demand and shall lead to a reduction in CO2 emissions of about 80%.
Table 2 shows the boundary conditions for the heat pump for brick drying at Wienerberger.
Table 2: Boundary conditions for the demonstrator of the brick dryer with integrated heat pump system
Product (P)
Mass flow in:
�̇�inP
Moisture content in:
MCin
Mass flow out,
�̇�outP
Moisture
content out
MCout
10000 kg/h 28% 7400 kg/h 2%
Drying agent (DA)
Mass flow in:
�̇�inDA
Temperature in:
𝑇inDA
Temperature out:
𝑇outDA
-
50000 kg/h 108 - 158°C 50°C -
Heat pump
Evaporating
temperature:
To
Condensing
temperature:
Tc
Capacity:
Pel
-
90°C 110 - 160°C 50 - 100kW(el) -
Water out (brick)
Mass flow:
�̇�water
Temperature:
Twater
Pressure:
Pwater
-
2600 kg/h approx. 55°C 1 bar -
More information on the boundary conditions is provided in D1.2 Performance indicators and
validation requirements.
D4.5 8/38
2.2 Screw and Piston compressor prototypes
Two types of compressors, an adapted screw compressor and a novel piston compressor, are
developed, produced, tested, operated and compared to each other in the framework of the
DryFiciency project. The work undertaken and the findings from the development phase are
described in the following.
2.2.1 Adapted screw compressor from Bitzer
Based on its proven HS series, Bitzer - one of the world’s leading manufacturer of screw and scroll
compressors - developed a modified semi-hermetic screw compressor to be applied for suction
gas temperatures up to 100°C and discharge temperatures of up to 160°C, instead of 100°C, the
state-of-the art at project start.
In total, 42 parts of the HS compressor series are affected by the high temperature application. They
were either replaced by parts made of different, more suitable, materials (in 23 cases), omitted or
replaced by other parts (in 15 cases), or simply left in place to see if they work properly when exposed
to the operational environment (4 parts).
The modified screw compressor has a two-shaft rotary displacement design with high efficiency
profile geometry and a swept volume of 300 m³/h at 60 Hz operation frequency. Its further key
features include:
Optimized for parallel operation with up to six compressors.
Optimal capacity adjustment and minimal energy requirements under full- and part-load.
Combination of various compressor sizes possible.
High efficiency rotor profile.
High efficiency suction gas cooled motor.
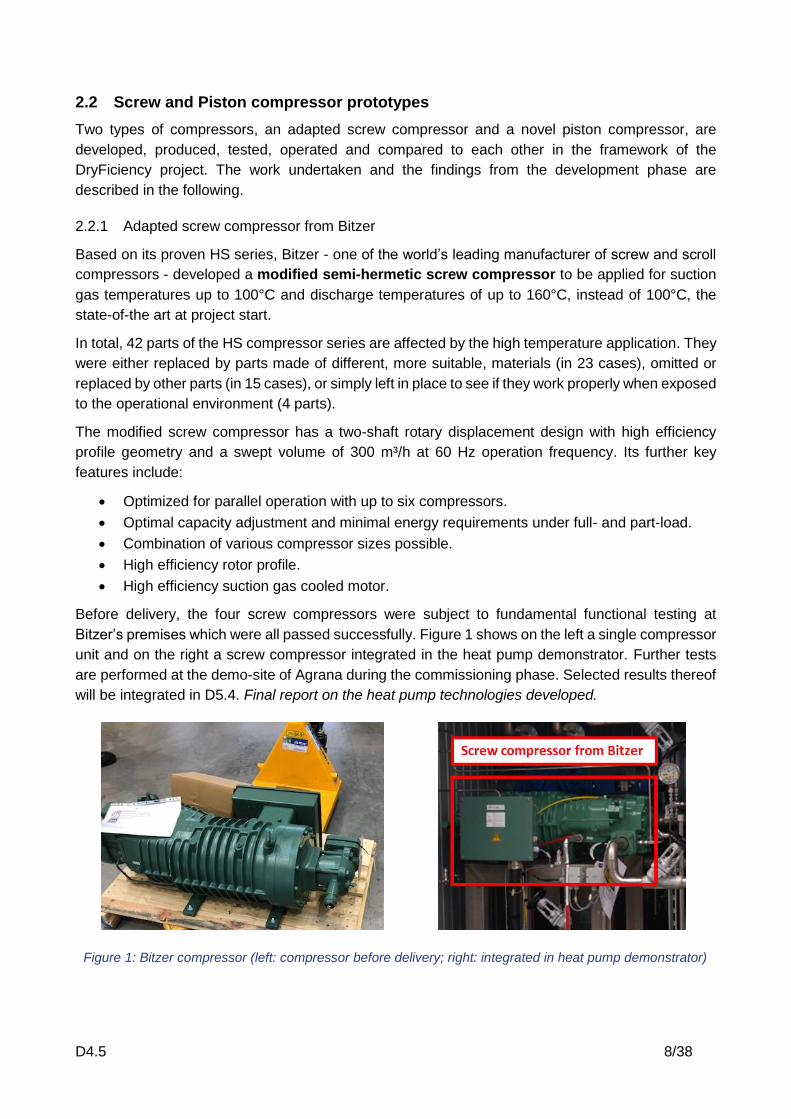
Before delivery, the four screw compressors were subject to fundamental functional testing at
Bitzer’s premises which were all passed successfully. Figure 1 shows on the left a single compressor
unit and on the right a screw compressor integrated in the heat pump demonstrator. Further tests
are performed at the demo-site of Agrana during the commissioning phase. Selected results thereof
will be integrated in D5.4. Final report on the heat pump technologies developed.
Figure 1: Bitzer compressor (left: compressor before delivery; right: integrated in heat pump demonstrator)

D4.5 9/38
2.2.2 Novel piston compressor from Viking Heat Engines
VHE developed – in cooperation with AVL - prior to the DryFiciency project, piston compressors
based on a proven, heavy-duty design, that are engineered to operate at very high internal
temperatures and pressures for discharge temperatures of up to 215 °C. One piston compressor
has a swept volume of 55 m³/h at 60 Hz. Further key features include:
Very low internal friction through exclusive use of low-friction bearings.
Internal oil circuit with oil filter and preheater.
Hermetically sealed, highly efficient permanent magnet synchronous motor for variable
speed control.
Water cooled motor for high temperature applications with integrated thermal monitoring.
Optimized for parallel operation, where several compressors can run in parallel.
Multi-compressor phase synchronization for low vibrations and pulsations, if needed.
This compressor technology depicted in Figure 2 as single unit (left), but also integrated in one
refrigeration circuit of the heat pump (right), is compatible with all common refrigerants of the 3rd and
4th generations including OpteonTM MZ from Chemours. Within the DryFiciency project, eight
compressors were manufactured and tested at the VHE lab in Germany using various FUCHS oils.
Further tests are performed at the demonstration site of Wienerberger during the commissioning
phase. Selected results thereof will be integrated in D5.4. Final report on the heat pump technologies
developed.
Figure 2: Viking Heat Engines compressor (left: single unit; right: integrated in heat pump demonstrator)
2.3 Lubricant
The lubricant1 is crucial for the operation of the two compressors, as it lubricates the machines and
seals the compression space. FUCHS is a very experienced lubricant manufacturer for both screw
and piston compressors, which proved highly beneficial in the development of a novel synthetic
lubricant as required by DryFiciency.
In general, synthetic esters (polyolester, POE and complex ester, CE) based lubricants as well as
PAG (polyalkylene glycols) based products can be used for compressors using a HFO (hydrofluoro-
olefin) as refrigerant. HFO based refrigerants are more reactive than classic HFC
(hydrofluorocarbon) without a double bond in the molecule. To suppress an undesired reaction
1 Lubrication/refrigeration oil are used as synonym.
Piston compressors from Viking Heat Engines
D4.5 10/38
between the refrigerant and the lubricant, lubricants used with HFO refrigerants require an optimized
additive system which prevents the degradation of both.
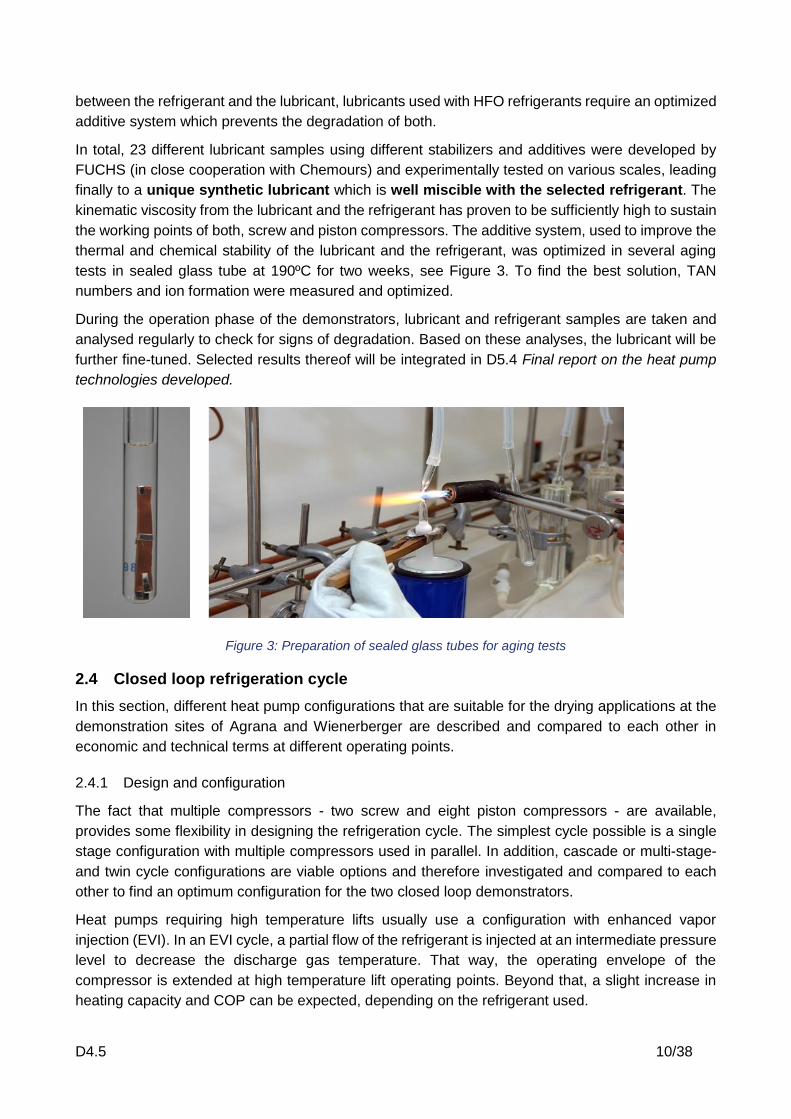
In total, 23 different lubricant samples using different stabilizers and additives were developed by
FUCHS (in close cooperation with Chemours) and experimentally tested on various scales, leading
finally to a unique synthetic lubricant which is well miscible with the selected refrigerant. The
kinematic viscosity from the lubricant and the refrigerant has proven to be sufficiently high to sustain
the working points of both, screw and piston compressors. The additive system, used to improve the
thermal and chemical stability of the lubricant and the refrigerant, was optimized in several aging
tests in sealed glass tube at 190ºC for two weeks, see Figure 3. To find the best solution, TAN
numbers and ion formation were measured and optimized.
During the operation phase of the demonstrators, lubricant and refrigerant samples are taken and
analysed regularly to check for signs of degradation. Based on these analyses, the lubricant will be
further fine-tuned. Selected results thereof will be integrated in D5.4 Final report on the heat pump
technologies developed.
Figure 3: Preparation of sealed glass tubes for aging tests
2.4 Closed loop refrigeration cycle
In this section, different heat pump configurations that are suitable for the drying applications at the
demonstration sites of Agrana and Wienerberger are described and compared to each other in
economic and technical terms at different operating points.
2.4.1 Design and configuration
The fact that multiple compressors - two screw and eight piston compressors - are available,
provides some flexibility in designing the refrigeration cycle. The simplest cycle possible is a single
stage configuration with multiple compressors used in parallel. In addition, cascade or multi-stage-
and twin cycle configurations are viable options and therefore investigated and compared to each
other to find an optimum configuration for the two closed loop demonstrators.
Heat pumps requiring high temperature lifts usually use a configuration with enhanced vapor
injection (EVI). In an EVI cycle, a partial flow of the refrigerant is injected at an intermediate pressure
level to decrease the discharge gas temperature. That way, the operating envelope of the
compressor is extended at high temperature lift operating points. Beyond that, a slight increase in
heating capacity and COP can be expected, depending on the refrigerant used.
D4.5 11/38
Due to the thermodynamic properties of the refrigerant used in Dryficiency - OpteonTM MZ
(R-1336mzz(Z)) - a configuration with EVI is not suitable, as an artificially induced reduction of the
discharge gas temperature is a critical counterproductive measure. The use of an HFO refrigerant
demands a certain level of discharge gas temperature, rather increased than decreased. For that
purpose, the closed loop heat pump cycles are equipped with an internal suction gas heat
exchanger (IHX). After the refrigerant is condensed on the high-pressure side, the liquid is cooled
down by the suction gas heat exchanger to heat up the suction gas before entering the compressor2.
The simplest way of doing that is a pipe in pipe heat exchanger, which is usually installed for small
capacities. For higher capacities, the heat exchanger can drastically increase in size because of the
poor heat transfer coefficient on the gas side. With increased heat exchanger size, the investment
costs of the heat pump package also increase. However, without an internal suction gas heat
exchanger, the evaporating temperature would drop drastically to ensure the necessary inlet
conditions for the compressor. As a rule of thumb, 1 K decreasing evaporating temperature leads to
a 3 % decrease in coefficient of performance (COP).
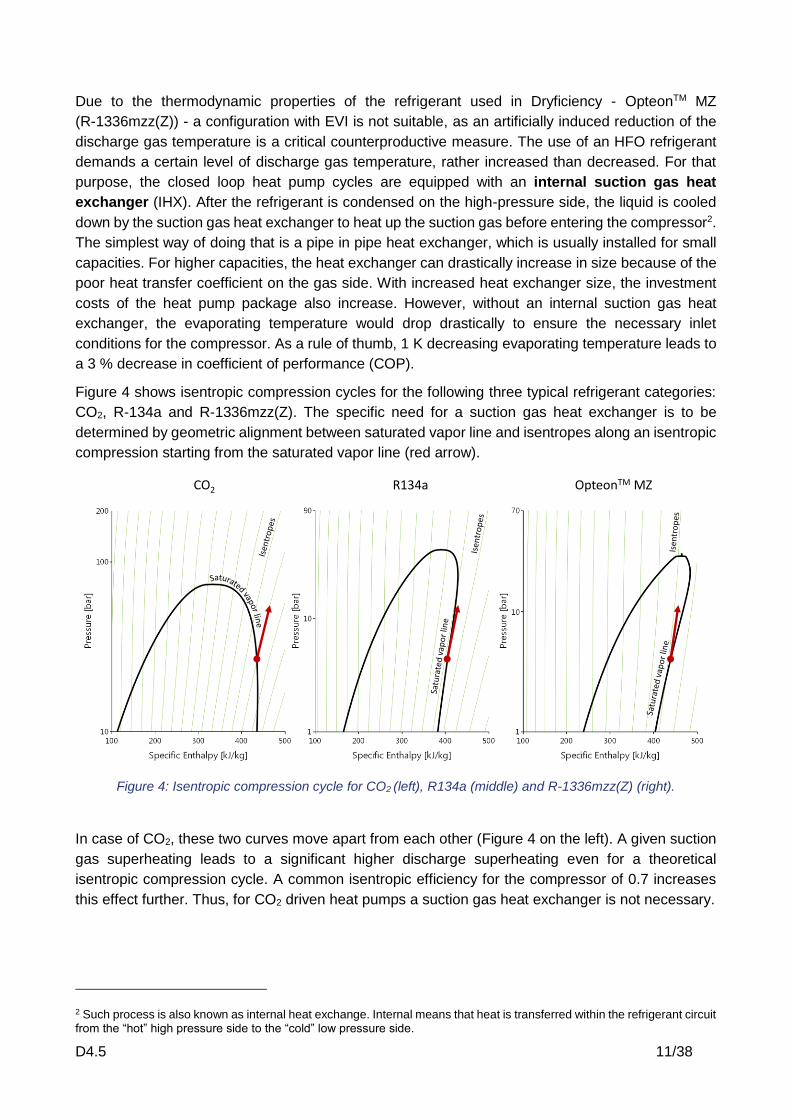
Figure 4 shows isentropic compression cycles for the following three typical refrigerant categories:
CO2, R-134a and R-1336mzz(Z). The specific need for a suction gas heat exchanger is to be
determined by geometric alignment between saturated vapor line and isentropes along an isentropic
compression starting from the saturated vapor line (red arrow).
Figure 4: Isentropic compression cycle for CO2 (left), R134a (middle) and R-1336mzz(Z) (right).
In case of CO2, these two curves move apart from each other (Figure 4 on the left). A given suction
gas superheating leads to a significant higher discharge superheating even for a theoretical
isentropic compression cycle. A common isentropic efficiency for the compressor of 0.7 increases
this effect further. Thus, for CO2 driven heat pumps a suction gas heat exchanger is not necessary.
2 Such process is also known as internal heat exchange. Internal means that heat is transferred within the refrigerant circuit from the “hot” high pressure side to the “cold” low pressure side.
CO2 R134a OpteonTM MZ
D4.5 12/38
For R-134a, the saturated vapor line and the isentropes are aligned almost parallel to each other
(Figure 4 in the middle). According to manufacturer recommendations, a COP increase of approx.
5 % is possible when using suction gas heat exchangers.
The refrigerant selected for the DryFiciency project, R-1336mzz(Z), is an extreme case, as the
saturated vapor line and the isentropes come closer during the compression cycle (Figure 4 on the
right). As a result, the suction gas superheating needs to be sufficiently high to ensure discharge
gas superheating as recommended by the compressor manufacturer. For variable pressure ratios,
dry compression at reasonable evaporating temperature can only be achieved with a suction gas
heat exchanger. Previous lab-scale measurements3 showed, that the cycle with a suction gas heat
exchanger achieved a significant COP increase of approx. 30% (compared to the basic cycle),
especially at high temperature lifts. Hence, the use of a suction gas heat exchanger is highly
recommended when using the refrigerant selected.
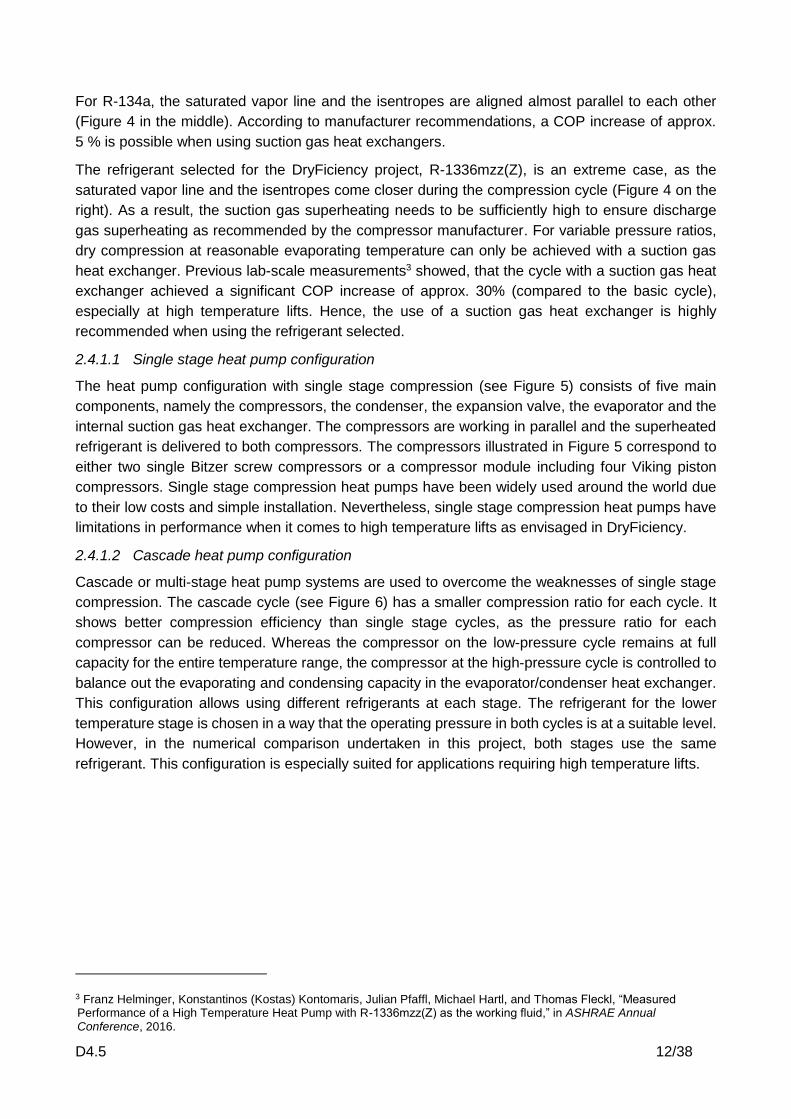
2.4.1.1 Single stage heat pump configuration
The heat pump configuration with single stage compression (see Figure 5) consists of five main
components, namely the compressors, the condenser, the expansion valve, the evaporator and the
internal suction gas heat exchanger. The compressors are working in parallel and the superheated
refrigerant is delivered to both compressors. The compressors illustrated in Figure 5 correspond to
either two single Bitzer screw compressors or a compressor module including four Viking piston
compressors. Single stage compression heat pumps have been widely used around the world due
to their low costs and simple installation. Nevertheless, single stage compression heat pumps have
limitations in performance when it comes to high temperature lifts as envisaged in DryFiciency.
2.4.1.2 Cascade heat pump configuration
Cascade or multi-stage heat pump systems are used to overcome the weaknesses of single stage
compression. The cascade cycle (see Figure 6) has a smaller compression ratio for each cycle. It
shows better compression efficiency than single stage cycles, as the pressure ratio for each
compressor can be reduced. Whereas the compressor on the low-pressure cycle remains at full
capacity for the entire temperature range, the compressor at the high-pressure cycle is controlled to
balance out the evaporating and condensing capacity in the evaporator/condenser heat exchanger.
This configuration allows using different refrigerants at each stage. The refrigerant for the lower
temperature stage is chosen in a way that the operating pressure in both cycles is at a suitable level.
However, in the numerical comparison undertaken in this project, both stages use the same
refrigerant. This configuration is especially suited for applications requiring high temperature lifts.
3 Franz Helminger, Konstantinos (Kostas) Kontomaris, Julian Pfaffl, Michael Hartl, and Thomas Fleckl, “Measured Performance of a High Temperature Heat Pump with R-1336mzz(Z) as the working fluid,” in ASHRAE Annual Conference, 2016.
D4.5 13/38
Figure 5: Scheme of heat pump configuration with single stage compression and internal suction gas
heat exchanger (abbreviation: single stage).
Figure 6: Scheme of cascade heat pump configuration (abbreviation: cascade).
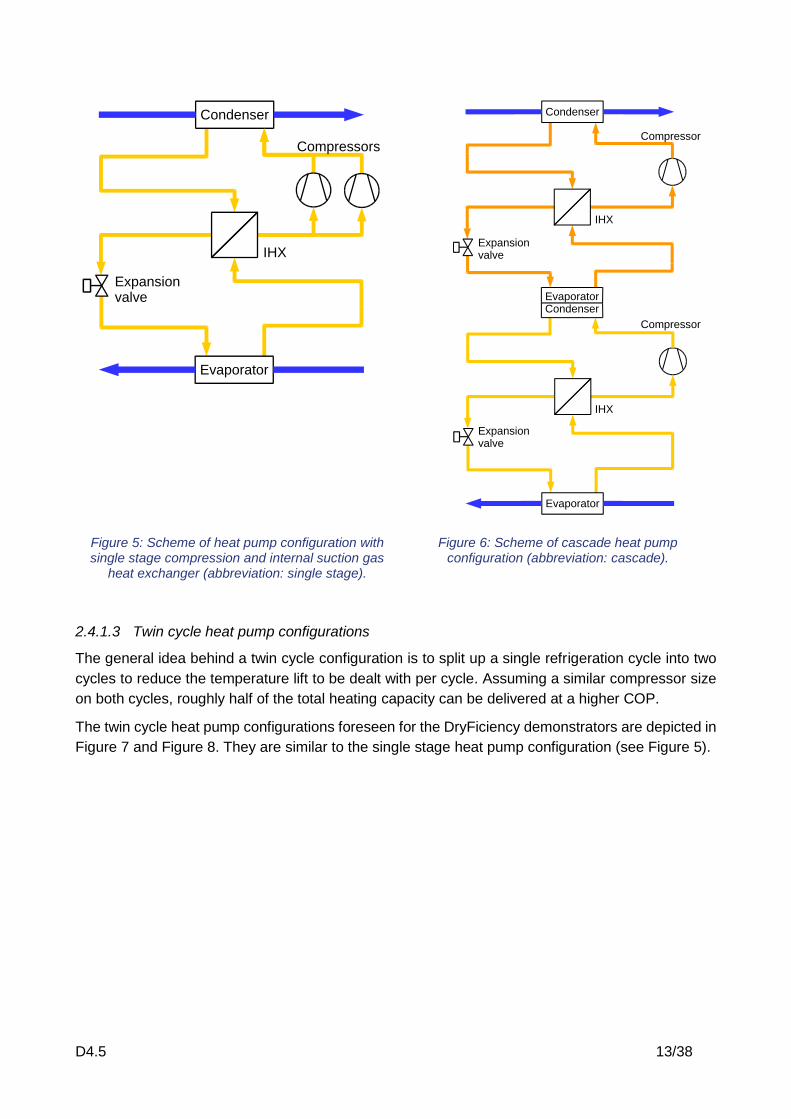
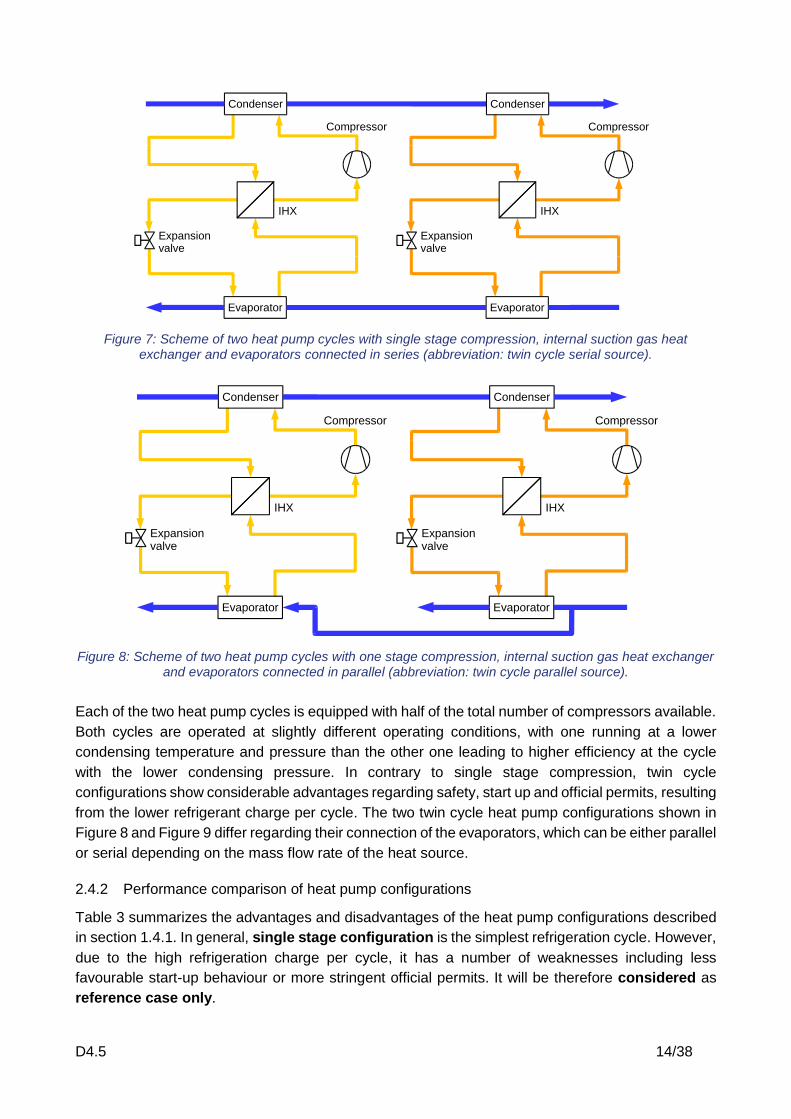
2.4.1.3 Twin cycle heat pump configurations
The general idea behind a twin cycle configuration is to split up a single refrigeration cycle into two
cycles to reduce the temperature lift to be dealt with per cycle. Assuming a similar compressor size
on both cycles, roughly half of the total heating capacity can be delivered at a higher COP.
The twin cycle heat pump configurations foreseen for the DryFiciency demonstrators are depicted in
Figure 7 and Figure 8. They are similar to the single stage heat pump configuration (see Figure 5).
Evaporator
Condenser
IHX
Compressors
Expansionvalve
Condenser
Evaporator
EvaporatorCondenser
Compressor
Compressor
IHX
IHX
Expansionvalve
Expansionvalve
D4.5 14/38
Figure 7: Scheme of two heat pump cycles with single stage compression, internal suction gas heat exchanger and evaporators connected in series (abbreviation: twin cycle serial source).
Figure 8: Scheme of two heat pump cycles with one stage compression, internal suction gas heat exchanger and evaporators connected in parallel (abbreviation: twin cycle parallel source).
Each of the two heat pump cycles is equipped with half of the total number of compressors available.
Both cycles are operated at slightly different operating conditions, with one running at a lower
condensing temperature and pressure than the other one leading to higher efficiency at the cycle
with the lower condensing pressure. In contrary to single stage compression, twin cycle
configurations show considerable advantages regarding safety, start up and official permits, resulting
from the lower refrigerant charge per cycle. The two twin cycle heat pump configurations shown in
Figure 8 and Figure 9 differ regarding their connection of the evaporators, which can be either parallel
or serial depending on the mass flow rate of the heat source.
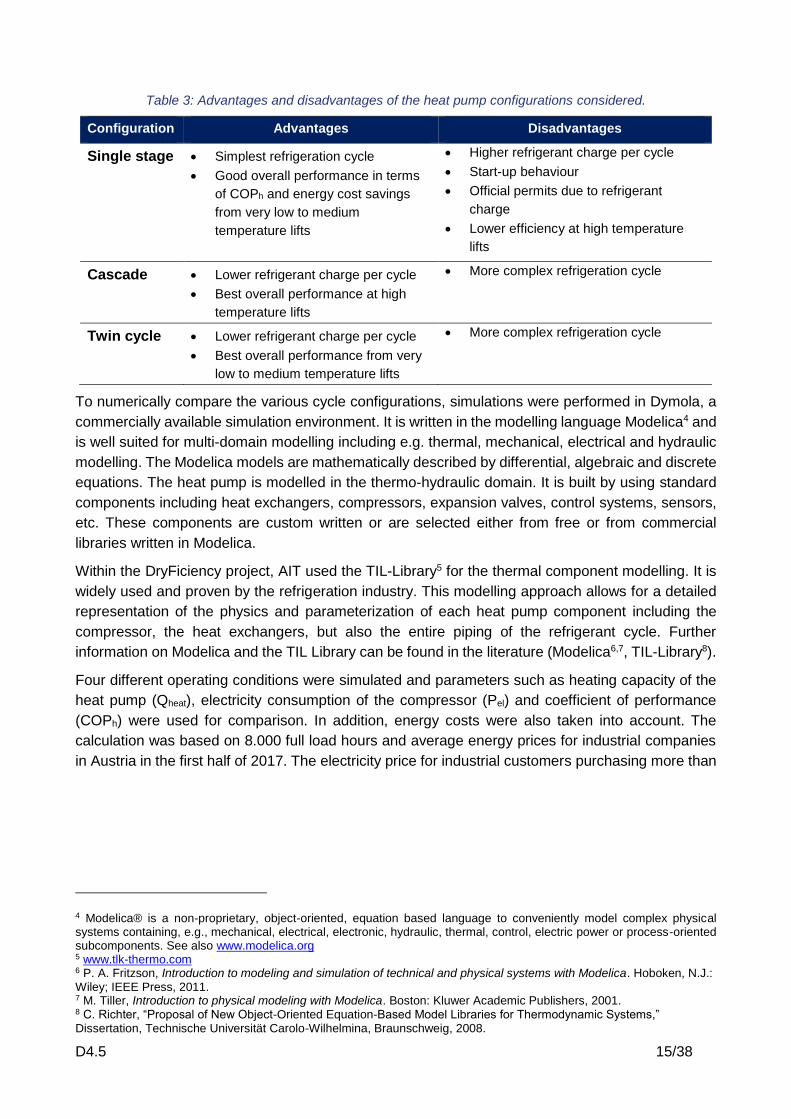
2.4.2 Performance comparison of heat pump configurations
Table 3 summarizes the advantages and disadvantages of the heat pump configurations described
in section 1.4.1. In general, single stage configuration is the simplest refrigeration cycle. However,
due to the high refrigeration charge per cycle, it has a number of weaknesses including less
favourable start-up behaviour or more stringent official permits. It will be therefore considered as
reference case only.
Evaporator
Condenser
Evaporator
Condenser
Compressor Compressor
IHX IHX
Expansionvalve
Expansionvalve
Evaporator
Condenser
Evaporator
Condenser
Compressor Compressor
IHX IHX
Expansionvalve
Expansionvalve
D4.5 15/38
Table 3: Advantages and disadvantages of the heat pump configurations considered.
Configuration Advantages Disadvantages
Single stage Simplest refrigeration cycle
Good overall performance in terms
of COPh and energy cost savings
from very low to medium
temperature lifts
Higher refrigerant charge per cycle
Start-up behaviour
Official permits due to refrigerant
charge
Lower efficiency at high temperature
lifts
Cascade Lower refrigerant charge per cycle
Best overall performance at high
temperature lifts
More complex refrigeration cycle
Twin cycle Lower refrigerant charge per cycle
Best overall performance from very
low to medium temperature lifts
More complex refrigeration cycle
To numerically compare the various cycle configurations, simulations were performed in Dymola, a
commercially available simulation environment. It is written in the modelling language Modelica4 and
is well suited for multi-domain modelling including e.g. thermal, mechanical, electrical and hydraulic
modelling. The Modelica models are mathematically described by differential, algebraic and discrete
equations. The heat pump is modelled in the thermo-hydraulic domain. It is built by using standard
components including heat exchangers, compressors, expansion valves, control systems, sensors,
etc. These components are custom written or are selected either from free or from commercial
libraries written in Modelica.
Within the DryFiciency project, AIT used the TIL-Library5 for the thermal component modelling. It is
widely used and proven by the refrigeration industry. This modelling approach allows for a detailed
representation of the physics and parameterization of each heat pump component including the
compressor, the heat exchangers, but also the entire piping of the refrigerant cycle. Further
information on Modelica and the TIL Library can be found in the literature (Modelica6,7, TIL-Library8).
Four different operating conditions were simulated and parameters such as heating capacity of the
heat pump (Qheat), electricity consumption of the compressor (Pel) and coefficient of performance
(COPh) were used for comparison. In addition, energy costs were also taken into account. The
calculation was based on 8.000 full load hours and average energy prices for industrial companies
in Austria in the first half of 2017. The electricity price for industrial customers purchasing more than
4 Modelica® is a non-proprietary, object-oriented, equation based language to conveniently model complex physical systems containing, e.g., mechanical, electrical, electronic, hydraulic, thermal, control, electric power or process-oriented subcomponents. See also www.modelica.org 5 www.tlk-thermo.com 6 P. A. Fritzson, Introduction to modeling and simulation of technical and physical systems with Modelica. Hoboken, N.J.: Wiley; IEEE Press, 2011. 7 M. Tiller, Introduction to physical modeling with Modelica. Boston: Kluwer Academic Publishers, 2001. 8 C. Richter, “Proposal of New Object-Oriented Equation-Based Model Libraries for Thermodynamic Systems,” Dissertation, Technische Universität Carolo-Wilhelmina, Braunschweig, 2008.
D4.5 16/38
150 GWh per year was at 5.4 ct./kWh9, the average price for natural gas (industry) at 3.4 ct./kWh10.
The energy costs for the operation of the heat pump were compared with those of a gas boiler, which
delivers the same heat output and has a thermal efficiency of 90%.
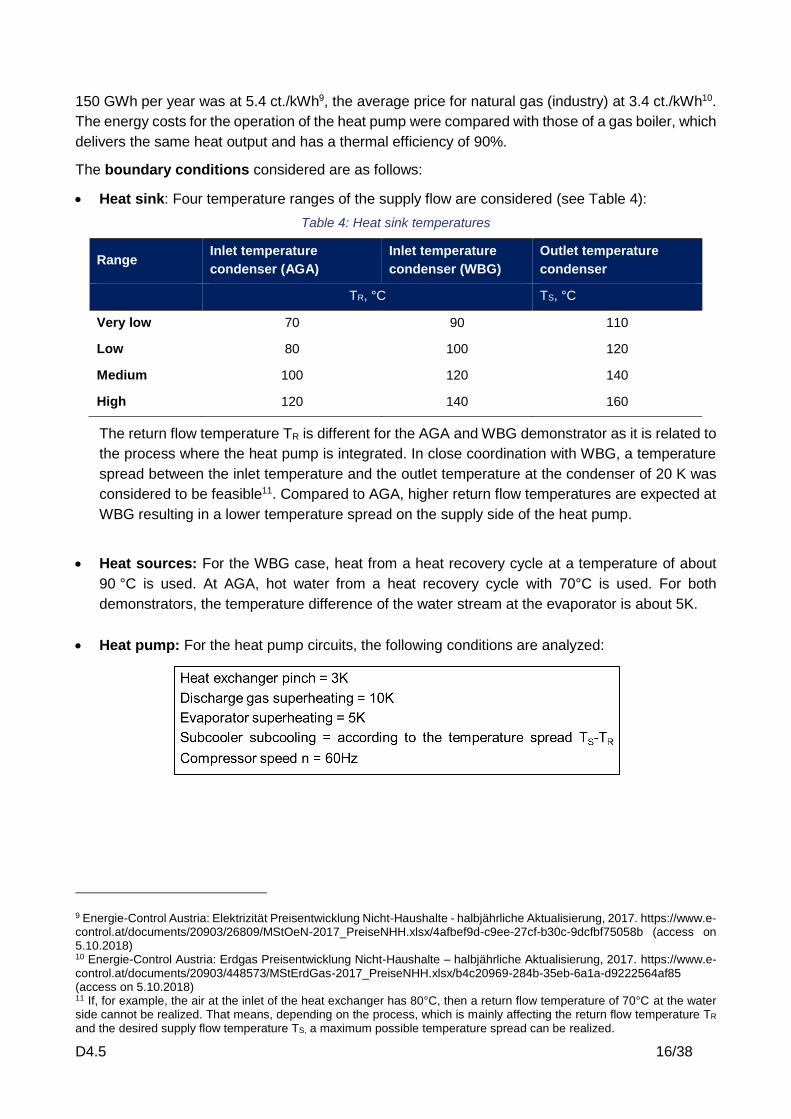
The boundary conditions considered are as follows:
Heat sink: Four temperature ranges of the supply flow are considered (see Table 4):
Table 4: Heat sink temperatures
Range Inlet temperature
condenser (AGA)
Inlet temperature
condenser (WBG)
Outlet temperature
condenser
TR, °C TS, °C
Very low 70 90 110
Low 80 100 120
Medium 100 120 140
High 120 140 160
The return flow temperature TR is different for the AGA and WBG demonstrator as it is related to
the process where the heat pump is integrated. In close coordination with WBG, a temperature
spread between the inlet temperature and the outlet temperature at the condenser of 20 K was
considered to be feasible11. Compared to AGA, higher return flow temperatures are expected at
WBG resulting in a lower temperature spread on the supply side of the heat pump.
Heat sources: For the WBG case, heat from a heat recovery cycle at a temperature of about
90 °C is used. At AGA, hot water from a heat recovery cycle with 70°C is used. For both
demonstrators, the temperature difference of the water stream at the evaporator is about 5K.
Heat pump: For the heat pump circuits, the following conditions are analyzed:
9 Energie-Control Austria: Elektrizität Preisentwicklung Nicht-Haushalte - halbjährliche Aktualisierung, 2017. https://www.e-control.at/documents/20903/26809/MStOeN-2017_PreiseNHH.xlsx/4afbef9d-c9ee-27cf-b30c-9dcfbf75058b (access on 5.10.2018) 10 Energie-Control Austria: Erdgas Preisentwicklung Nicht-Haushalte – halbjährliche Aktualisierung, 2017. https://www.e-control.at/documents/20903/448573/MStErdGas-2017_PreiseNHH.xlsx/b4c20969-284b-35eb-6a1a-d9222564af85 (access on 5.10.2018) 11 If, for example, the air at the inlet of the heat exchanger has 80°C, then a return flow temperature of 70°C at the water side cannot be realized. That means, depending on the process, which is mainly affecting the return flow temperature TR and the desired supply flow temperature TS, a maximum possible temperature spread can be realized.

D4.5 17/38
2.4.2.1 Agrana
The operation conditions are mainly described by the heat supply temperature, which is varied from
110 to 160°C. Figure 9 illustrates the heating capacity, electricity consumption and energy cost
savings for the single stage configuration for the Agrana demonstrator. With increase in temperature,
the heating capacity decreases, while the electricity consumption increases, resulting in a lower
efficiency (COPh). The savings in energy cost also decrease. This behaviour occurs for all
configurations, except for the cascade, where the heating capacity remains almost constant due to
the capacity reserve of the high-pressure compressor12.
Figure 9: Single stage configuration (AGA)
Figure 10 and Figure 11 compare the different cycle configurations with the single stage one. Overall,
twin cycle configurations show the best results. Due to reduced temperature lift to be overcome
in one cycle, less electricity is required by the compressors. With increase in heat supply
temperature, the heating capacity remains unchanged for the parallel configuration and is slightly
lower for the serial one13. Therefore, efficiency increases and more annual energy cost savings can
be achieved. Moreover, a twin cycle heat pump offers additional advantages regarding safety, start
up and official permits as already elaborated above.
The cascade configuration differs the most from the single stage. Here, the heating capacity is
considerably lower, as the first stage of the cascade is the heat source of the second stage of the
cascade. As only the condenser of the second stage provides heat to the consumer, the heating
capacity of the cascade configuration is limited to 50 - 77% of the capacity of the single stage,
12For the cascade layout, the heating capacity remains constant. This mainly results from the compressor control of the upper circuit, which adapts the evaporator capacity of the upper circuit according to the condenser capacity of the lower circuit. Since the condenser capacity of the lower circuit changes only insignificantly, the upper compressor can compensate for the decreasing enthalpy difference by an increasing compressor speed.
13 This results from the lower inlet density of the compressor at the second refrigeration circuit. The evaporator is not supplied by the original source, but by the already cooled first refrigerant circuit. Due to the lower inlet temperature on the water side, the evaporating pressure on the lower refrigeration circuit is also lower. The specified water-side spread of 5K is now divided between both evaporators. However, this does not have a positive effect on the first refrigerant circuit since the refrigerant-side superheat in the evaporator remains 5K.
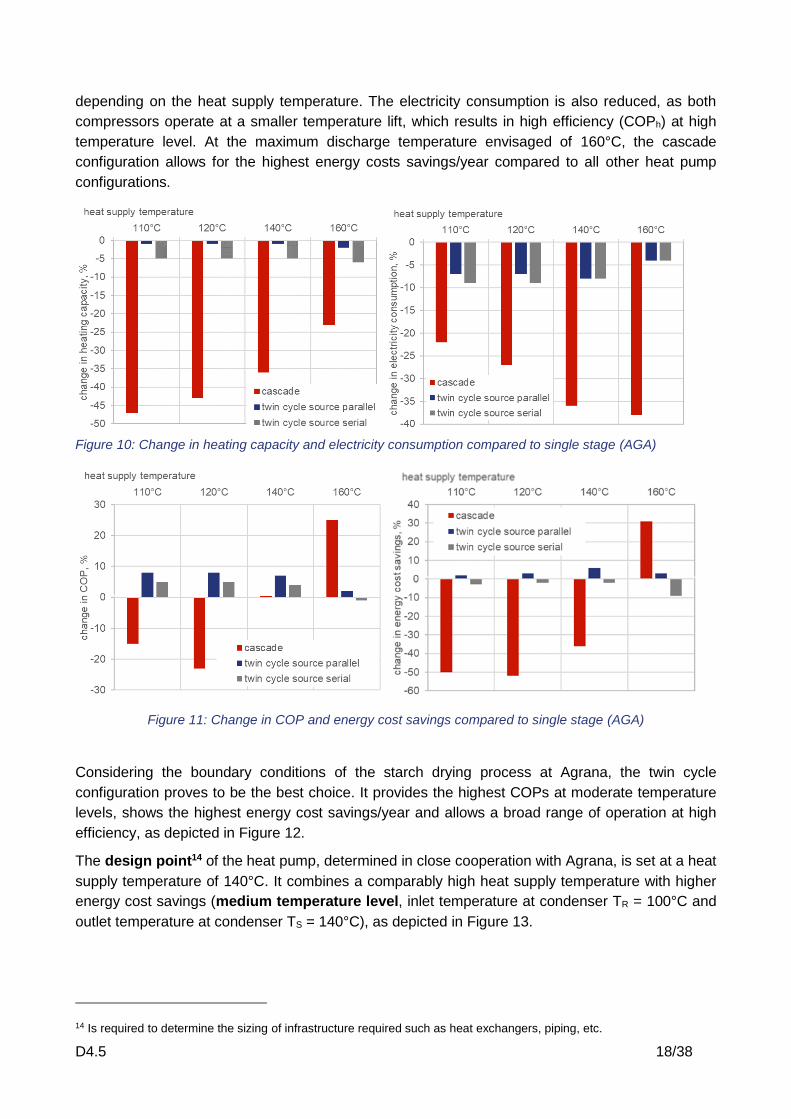
D4.5 18/38
depending on the heat supply temperature. The electricity consumption is also reduced, as both
compressors operate at a smaller temperature lift, which results in high efficiency (COPh) at high
temperature level. At the maximum discharge temperature envisaged of 160°C, the cascade
configuration allows for the highest energy costs savings/year compared to all other heat pump
configurations.
Figure 10: Change in heating capacity and electricity consumption compared to single stage (AGA)
Figure 11: Change in COP and energy cost savings compared to single stage (AGA)
Considering the boundary conditions of the starch drying process at Agrana, the twin cycle
configuration proves to be the best choice. It provides the highest COPs at moderate temperature
levels, shows the highest energy cost savings/year and allows a broad range of operation at high
efficiency, as depicted in Figure 12.
The design point14 of the heat pump, determined in close cooperation with Agrana, is set at a heat
supply temperature of 140°C. It combines a comparably high heat supply temperature with higher
energy cost savings (medium temperature level, inlet temperature at condenser TR = 100°C and
outlet temperature at condenser TS = 140°C), as depicted in Figure 13.
14 Is required to determine the sizing of infrastructure required such as heat exchangers, piping, etc.

D4.5 19/38
Figure 12: Nominal operating conditions - Agrana demonstrator with the Bitzer screw compressor
2.4.2.2 Wienerberger
Figure 13 illustrates the heating capacity, electricity consumption and yearly energy cost savings of
a single stage configuration of the Wienerberger (WBG) demonstrator. As evident, when comparing
with Figure 12, the heating capacities of the WBG case are approx. 20% higher than for the AGA
demonstrator. This is explained by the higher source temperature, and consequently lower
temperature lift, which also results in a higher efficiency (COPh).
Figure 13: Single stage configuration (WBG)

D4.5 20/38
Figure 14 and Figure 15 compare the different cycle configurations with the single stage one for the
WBG case. Like for Agrana, twin cycle configurations are the best choice providing high efficiency
for a broad range of operation conditions. As explained before, cascade configuration would enable
the highest energy cost savings/year compared to all other heat pump configurations at 160°C.
However, at all other temperature levels, the energy cost savings are drastically lower.
Figure 14: Change in heating capacity and electricity consumption compared to single stage (WBG)
Figure 15: Change in COP and energy cost savings compared to single stage (WBG)
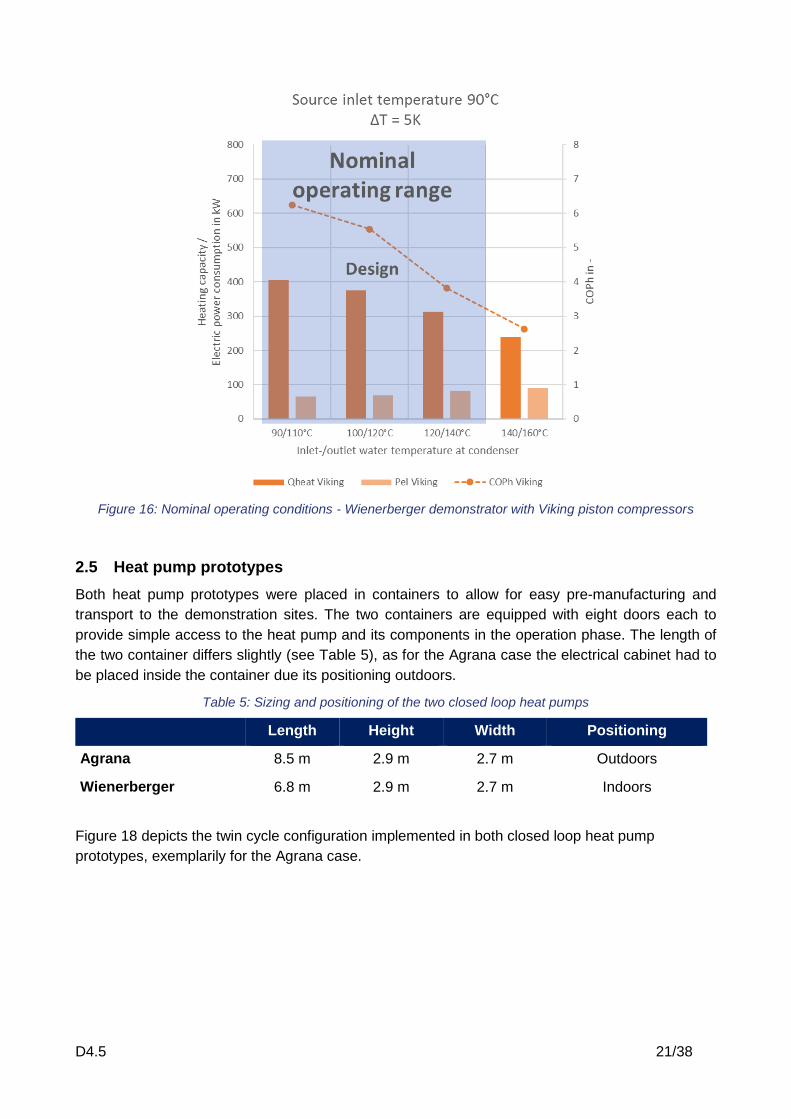
The design point of the heat pump, chosen in close cooperation with WBG, corresponds to a heat
supply temperature of 120°C (low temperature level, inlet temperature at condenser TR = 100°C
and outlet temperature at condenser TS = 120°C). This fits best the requirements of the brick drying
process and results in a considerable high COP that also allows for high savings on energy costs,
as depicted in Figure 16.
D4.5 21/38
Figure 16: Nominal operating conditions - Wienerberger demonstrator with Viking piston compressors
2.5 Heat pump prototypes
Both heat pump prototypes were placed in containers to allow for easy pre-manufacturing and
transport to the demonstration sites. The two containers are equipped with eight doors each to
provide simple access to the heat pump and its components in the operation phase. The length of
the two container differs slightly (see Table 5), as for the Agrana case the electrical cabinet had to
be placed inside the container due its positioning outdoors.
Table 5: Sizing and positioning of the two closed loop heat pumps
Length Height Width Positioning
Agrana 8.5 m 2.9 m 2.7 m Outdoors
Wienerberger 6.8 m 2.9 m 2.7 m Indoors
Figure 18 depicts the twin cycle configuration implemented in both closed loop heat pump
prototypes, exemplarily for the Agrana case.
D4.5 22/38
Figure 17: Twin cycle configuration of the closed loop HP installed at Agrana (prior to insulation)
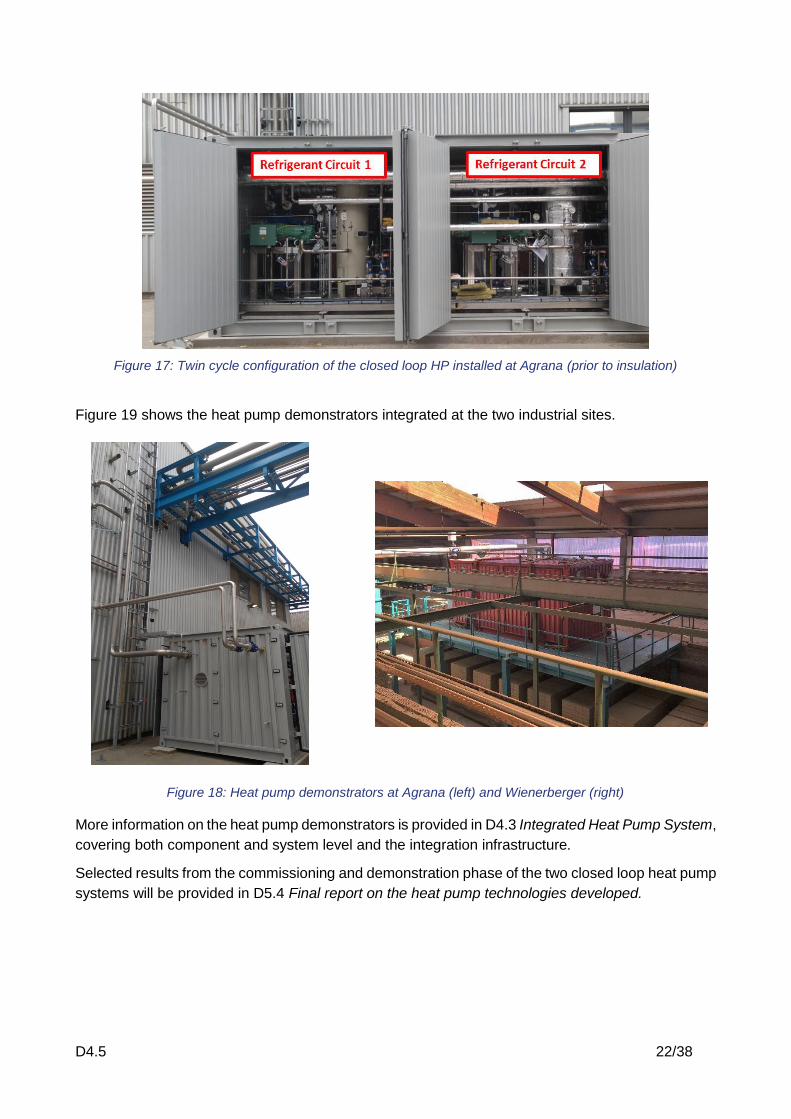
Figure 19 shows the heat pump demonstrators integrated at the two industrial sites.
Figure 18: Heat pump demonstrators at Agrana (left) and Wienerberger (right)
More information on the heat pump demonstrators is provided in D4.3 Integrated Heat Pump System,
covering both component and system level and the integration infrastructure.
Selected results from the commissioning and demonstration phase of the two closed loop heat pump
systems will be provided in D5.4 Final report on the heat pump technologies developed.

D4.5 23/38
3 OPEN LOOP HEAT PUMP SYSTEM
In this section, the boundary conditions of the open loop heat pump demonstrator to be applied for
sludge drying, its configuration, and sizing is presented briefly, before the development work
undertaken, the results achieved and the reasoning thereof is elaborated on component (turbo
compressor) and heat pump unit level.
Table 6: Boundary conditions for the prototype demonstrator at Scanship.
Product
Mass flow in:
�̇�inP
Moisture content in:
MCin
Mass flow out,
�̇�outP
Moisture content out
MCout
300 kg/h or 3 t per batch 70% 106 kg/h 15%
Drying agent (DA) – steam (moisture from drier)
Mass flow in:
�̇�inDA
Temperature in:
𝑇inDA
Mass flow out:
�̇�outDA
Temperature out:
𝑇outDA
≈330 kg/h ≈155°C 194 kg/h ≈100°C
Mechanical vapor recompression (MVR) heat pump
Mass flow:
�̇�MVR
Temperature in:
TMVR
Pressure in:
pMVR
≈300 kg/h + �̇�recDA ≈100°C ≈0.8 bar
Water (condensate)
Mass flow:
�̇�W
Temperature:
Twater
Pressure:
Pwater
≈330 kg/h ≈155°C 5 bar
Drying process (MC 70% →15% at ≈155°C)
f(�̇�in,MCin, �̇�DA,TDA) 0.65 kg water/kg product
SEC 1.0 kWh/kg
More information is provided in D1.2 Performance indicators and validation requirements.
D4.5 24/38
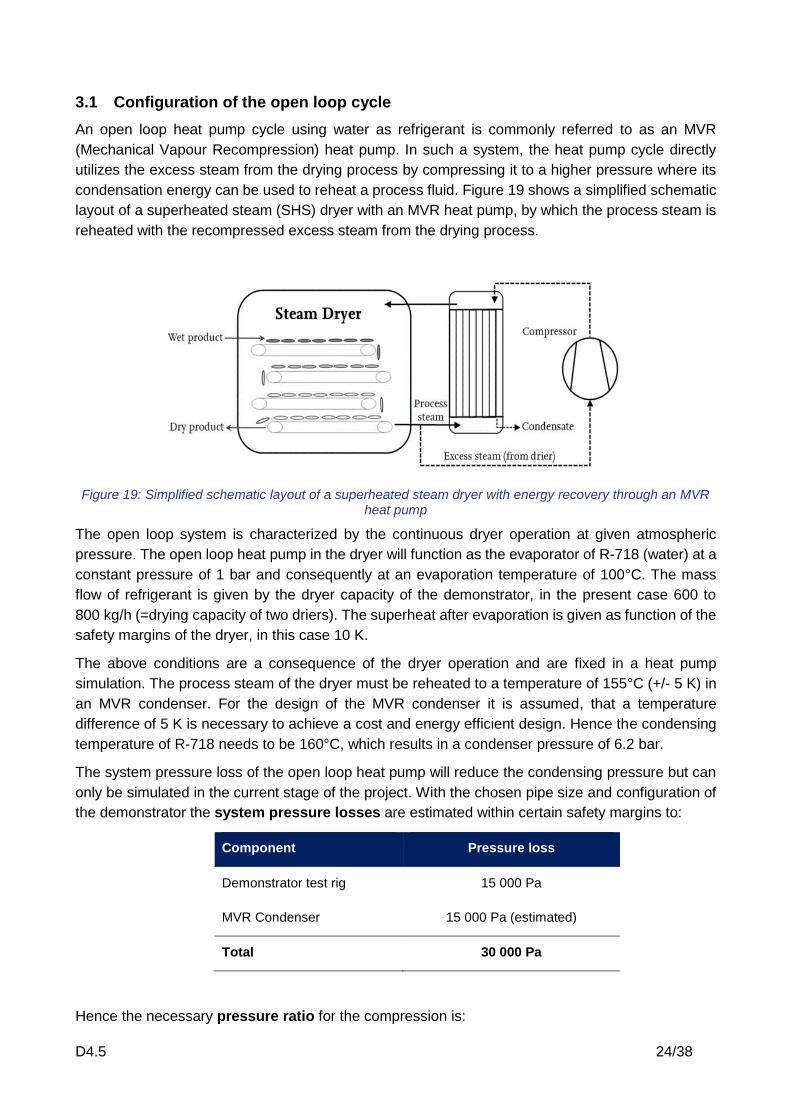
3.1 Configuration of the open loop cycle
An open loop heat pump cycle using water as refrigerant is commonly referred to as an MVR
(Mechanical Vapour Recompression) heat pump. In such a system, the heat pump cycle directly
utilizes the excess steam from the drying process by compressing it to a higher pressure where its
condensation energy can be used to reheat a process fluid. Figure 19 shows a simplified schematic
layout of a superheated steam (SHS) dryer with an MVR heat pump, by which the process steam is
reheated with the recompressed excess steam from the drying process.
Figure 19: Simplified schematic layout of a superheated steam dryer with energy recovery through an MVR heat pump
The open loop system is characterized by the continuous dryer operation at given atmospheric
pressure. The open loop heat pump in the dryer will function as the evaporator of R-718 (water) at a
constant pressure of 1 bar and consequently at an evaporation temperature of 100°C. The mass
flow of refrigerant is given by the dryer capacity of the demonstrator, in the present case 600 to
800 kg/h (=drying capacity of two driers). The superheat after evaporation is given as function of the
safety margins of the dryer, in this case 10 K.
The above conditions are a consequence of the dryer operation and are fixed in a heat pump
simulation. The process steam of the dryer must be reheated to a temperature of 155°C (+/- 5 K) in
an MVR condenser. For the design of the MVR condenser it is assumed, that a temperature
difference of 5 K is necessary to achieve a cost and energy efficient design. Hence the condensing
temperature of R-718 needs to be 160°C, which results in a condenser pressure of 6.2 bar.
The system pressure loss of the open loop heat pump will reduce the condensing pressure but can
only be simulated in the current stage of the project. With the chosen pipe size and configuration of
the demonstrator the system pressure losses are estimated within certain safety margins to:
Component Pressure loss
Demonstrator test rig 15 000 Pa
MVR Condenser 15 000 Pa (estimated)
Total 30 000 Pa
Hence the necessary pressure ratio for the compression is:

D4.5 25/38
pratio,required =p𝑐ondenser+ p𝑙𝑜𝑠𝑠𝑒𝑠
p𝑒𝑣𝑎𝑝𝑜𝑟𝑎𝑡𝑖𝑜𝑛=
6.2 𝑏𝑎𝑟 + 0.3 𝑏𝑎𝑟
1 𝑏𝑎𝑟= 6.5
This pressure ratio must be achieved by the turbo-compressor system. Based on the requirements
different solutions were discussed by the project partners under the aspects of technical feasibility
(mass flow, impeller size and design, rotational speed, etc.) and thermodynamic properties of R-718
(superheat, volumetric changes during compression, etc.).
The required compression ratio cannot be achieved in a single stage compression due to the
technical feasibility of turbo-compressors as well as the relatively large superheating of R-718 during
compression. Hence it is necessary to apply a two-stage compression system. The intermediate
pressure level will result in a different volume flow between inlet of compression stage 1 and
compression stage 2. With a fixed compressor size, the volume flows in stage 1 and stage 2 will be
equal, the intermediate pressure cannot be designed freely rather than it is a function of one impeller
design. Figure 20 shows two different options. With one impeller size, tt will be necessary to operate
with 2 compressors in the first stage (option 1). An individual impeller design for stage 1 and stage
2 allows the operation with one compressor in each stage and the design intermediate pressure can
be chosen freely (option 2).
Figure 20: Principal design of 2-stage compression with one impeller size or with individual compressor sizes.
With option 1 it was not possible to find a satisfactory 2-stage design for the required pressure ratio.
Therefore, it was necessary to design two different impellers for compression stage 1 and
compression stage 2.

D4.5 26/38
The following pressure ratios were agreed on and used to design the individual turbo-compressor:
Pressure ratio p inlet poutlet Pressure ratio
Stage 1 1 bar 3.2 bar 3.2
Stage 2 3.2 bar 6.5 bar 2.1
Total 1 bar 6.5 bar 6.5
3.2 Required De-superheating
The simulation of the compression of the 1st stage shows the following conditions:
Speed Flow Power
adiabatic
Pressure
inlet
Temperature
inlet
Pressure
outlet
Temperature
outlet
80 000 rpm 0.196 kg/s 70 kW 1 bar 110°C 3.2 bar 290°C
The outlet temperature of stage 1 and inlet temperature of stage 2 will be 290°C. This temperature
will cause significant thermal stress to the system and is outside of the specifications of the turbo-
compressor. Therefore, it is necessary to de-superheat the refrigerant between stage 1 and stage 2
down to 10 K superheat. Different possibilities were discussed and it was concluded that the most
appropriate way will be to apply water injection with preheated water of around 120°C. De-
superheating with a heat exchanger and an external heat sink was discussed as well but discarded,
since it would reduce the amount of useful heat in the MVR condenser.
Applying de-superheating will require a water injection of 0.026 kg/sec between stage 1 and stage 2.
Hence the refrigerant will be cooled to 145°C and the mass flow of refrigerant into stage 2 will be
increased.
The compression stage 2 will also add a significant amount of superheat to the refrigerant, which
should be removed before the steam enters the MVR condenser. Otherwise a significant part of the
heat exchanger area will be used for de-superheating, which will give an ineffective and large heat
exchanger design. Therefore, water injection will be applied after discharge of stage 2 as well. The
main technical parameters including, de-superheating, are listed in Table 7.
Table 7: Main technical parameters of the open loop configuration.
Stage 1 De-superheating 1 Stage 2 De-superheating 2
Speed 80 000 rpm - 80 000 rpm -
Flow 0.196 kg/s 0.026 kg/s 0.222 kg/s 0.016 kg/s
Power adiabatic 70 kW - 51 kW -
Pressure inlet 1 bar 3.2 bar 3.2 bar 6.5 bar
Temperature inlet 110°C 120°C 145°C 250°C
Pressure outlet 3.2 bar 3.2 bar 6.5 bar 6.5 bar
Temperature outlet 290°C 145°C 250°C 170°C

D4.5 27/38
The de-superheating by water injection is an additional requirement for the demonstration unit
identified during the development of the turbo-compressor technology and its testing at the SINTEF
lab.
The principal design layout for the open loop system is sketched in Figure 21, where also the
boundary between tests performed at SINTEF and the tests performed by Scanship is illustrated.
The test of the functionality of the de-superheating installation is in the test procedure of SINTEF.
Figure 21: Design layout for open loop two-stage turbo-compression system including de-superheating.
The design of the test rig for the demo-site, and the design and simulation of the open loop system
to be tested at the SINTEF lab, was done in close interaction with the partners, since both the
operational principle and the capacity of the de-superheater are based on suitable and available
technology from the suppliers. The system pressure losses needed to be included in the
performance analysis. Also, the boundary between the steam dryer and the test installation were
identified with respect to the test to be performed at SINTEF, since the steam dryer is the evaporator
of the heat pump. The design of the test installation for the open loop heat pump is shown in Figure
22. This installation is used for both, lab tests and tests on-site.

D4.5 28/38
Figure 22: Scheme of the open loop heat pump system.
3.3 Size of the open loop heat pump
The open loop heat pump (as displayed in Figure 22) was originally designed for drier size and space
availability at a pet food producing company. This resulted in a lean and elongated test design which
also enabled a long pipe-length for de-superheating. This size is also acceptable for the Scanship
demo site at Drammen. However, future open loop heat pump applications need to more compact
design. Consequently, the space requirements (=pipe length) for de-superheating must be reduced.
An illustration of the placement of the open loop heat pump at the Scanship demo site is shown in
Figure 23.
Figure 23: Placement of the open loop heat pump at the Scanship demo site.
In the test procedure for SINTEF, a different method for de-superheating is being evaluated, namely
packed beds with suitable metal packings. This could help to reduce the length of the heat pump
system significantly.
D4.5 29/38
3.4 Turbo compressor prototypes
The development of novel turbo-compressor systems is a central ingredient of the DryFiciency
project for the open loop heat pump system. In the experimental campaign, two different turbo
compressor prototypes have been utilized. These are adaptions of turbo compressor Model C38 and
further developments of turbo compressor EC38 named EA42.
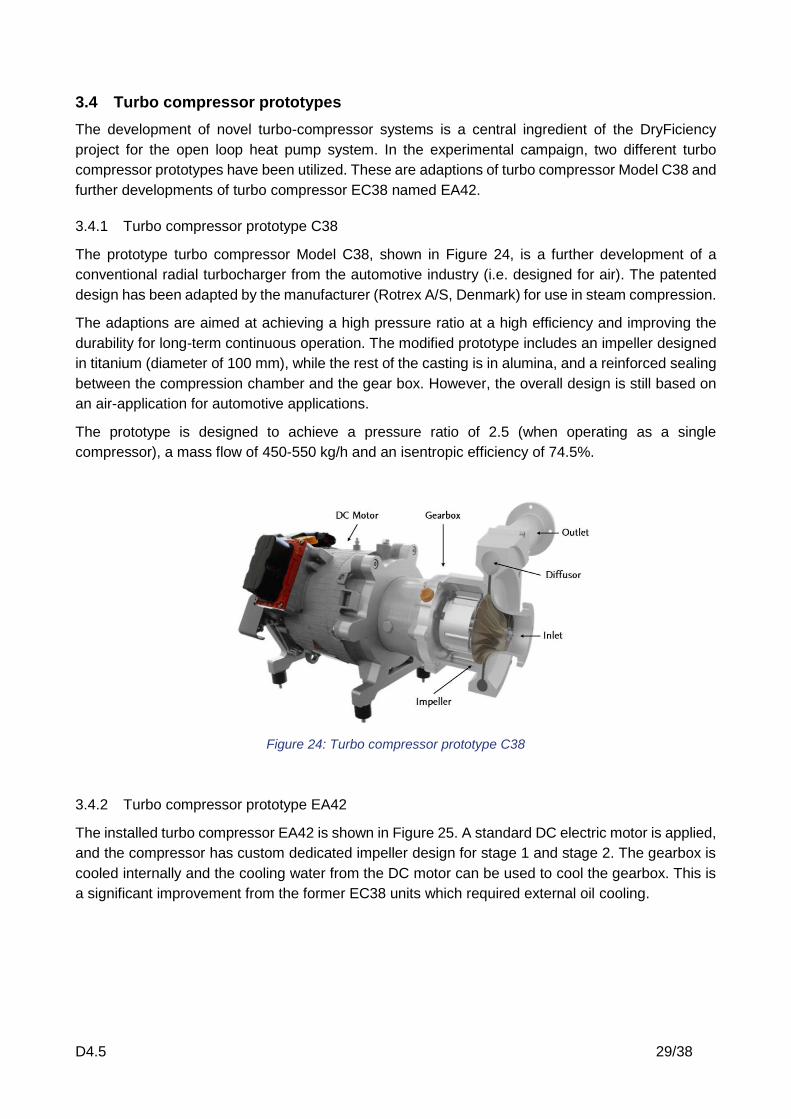
3.4.1 Turbo compressor prototype C38
The prototype turbo compressor Model C38, shown in Figure 24, is a further development of a
conventional radial turbocharger from the automotive industry (i.e. designed for air). The patented
design has been adapted by the manufacturer (Rotrex A/S, Denmark) for use in steam compression.
The adaptions are aimed at achieving a high pressure ratio at a high efficiency and improving the
durability for long-term continuous operation. The modified prototype includes an impeller designed
in titanium (diameter of 100 mm), while the rest of the casting is in alumina, and a reinforced sealing
between the compression chamber and the gear box. However, the overall design is still based on
an air-application for automotive applications.
The prototype is designed to achieve a pressure ratio of 2.5 (when operating as a single
compressor), a mass flow of 450-550 kg/h and an isentropic efficiency of 74.5%.
Figure 24: Turbo compressor prototype C38
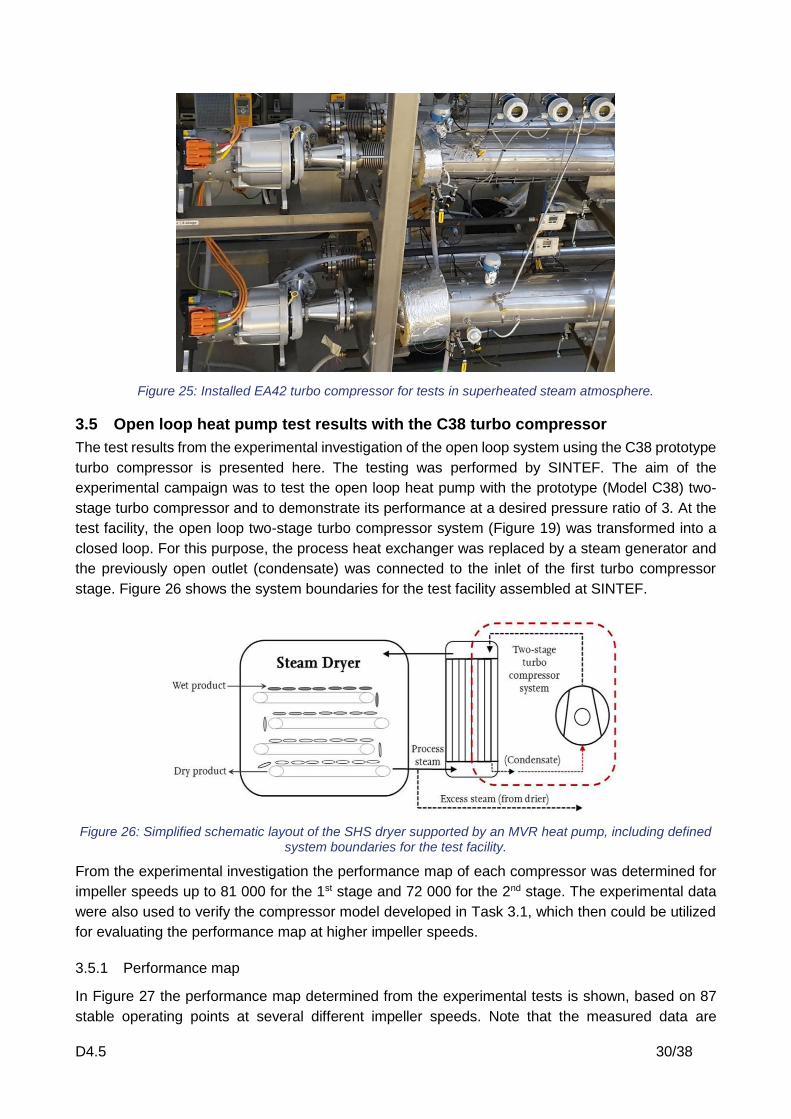
3.4.2 Turbo compressor prototype EA42
The installed turbo compressor EA42 is shown in Figure 25. A standard DC electric motor is applied,
and the compressor has custom dedicated impeller design for stage 1 and stage 2. The gearbox is
cooled internally and the cooling water from the DC motor can be used to cool the gearbox. This is
a significant improvement from the former EC38 units which required external oil cooling.
D4.5 30/38
Figure 25: Installed EA42 turbo compressor for tests in superheated steam atmosphere.
3.5 Open loop heat pump test results with the C38 turbo compressor
The test results from the experimental investigation of the open loop system using the C38 prototype
turbo compressor is presented here. The testing was performed by SINTEF. The aim of the
experimental campaign was to test the open loop heat pump with the prototype (Model C38) two-
stage turbo compressor and to demonstrate its performance at a desired pressure ratio of 3. At the
test facility, the open loop two-stage turbo compressor system (Figure 19) was transformed into a
closed loop. For this purpose, the process heat exchanger was replaced by a steam generator and
the previously open outlet (condensate) was connected to the inlet of the first turbo compressor
stage. Figure 26 shows the system boundaries for the test facility assembled at SINTEF.
Figure 26: Simplified schematic layout of the SHS dryer supported by an MVR heat pump, including defined system boundaries for the test facility.
From the experimental investigation the performance map of each compressor was determined for
impeller speeds up to 81 000 for the 1st stage and 72 000 for the 2nd stage. The experimental data
were also used to verify the compressor model developed in Task 3.1, which then could be utilized
for evaluating the performance map at higher impeller speeds.
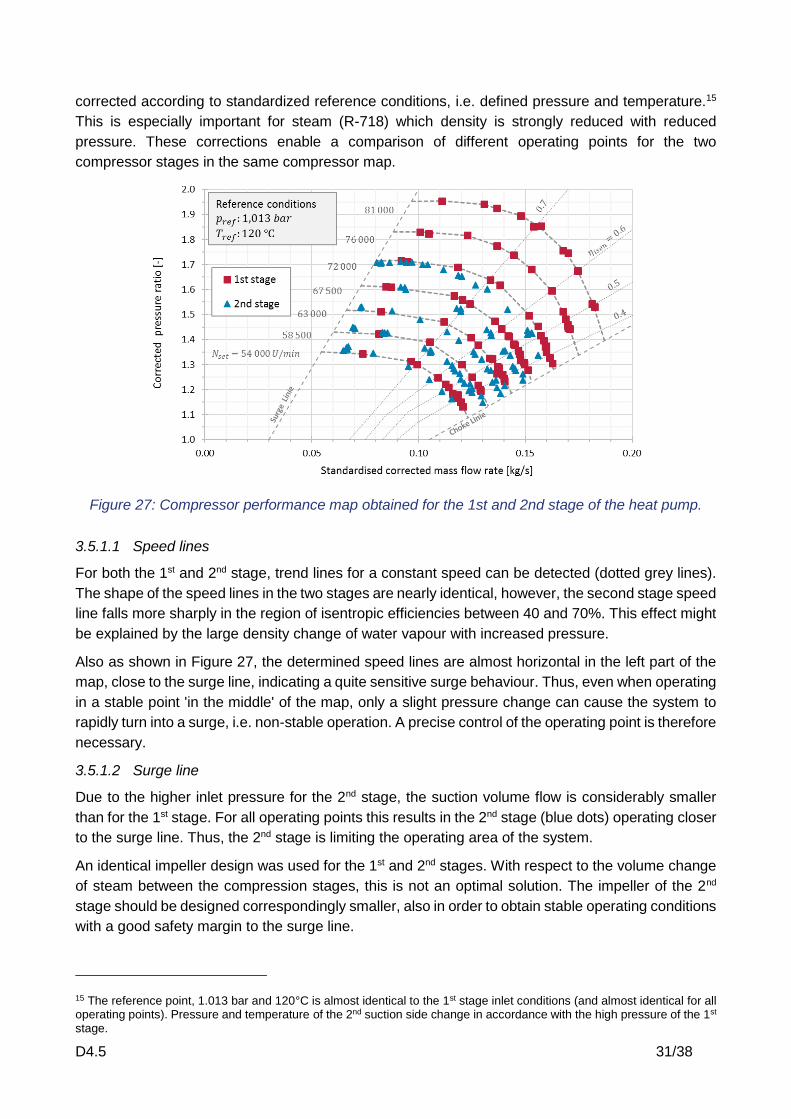
3.5.1 Performance map
In Figure 27 the performance map determined from the experimental tests is shown, based on 87
stable operating points at several different impeller speeds. Note that the measured data are
D4.5 31/38
corrected according to standardized reference conditions, i.e. defined pressure and temperature.15
This is especially important for steam (R-718) which density is strongly reduced with reduced
pressure. These corrections enable a comparison of different operating points for the two
compressor stages in the same compressor map.
Figure 27: Compressor performance map obtained for the 1st and 2nd stage of the heat pump.
3.5.1.1 Speed lines
For both the 1st and 2nd stage, trend lines for a constant speed can be detected (dotted grey lines).
The shape of the speed lines in the two stages are nearly identical, however, the second stage speed
line falls more sharply in the region of isentropic efficiencies between 40 and 70%. This effect might
be explained by the large density change of water vapour with increased pressure.
Also as shown in Figure 27, the determined speed lines are almost horizontal in the left part of the
map, close to the surge line, indicating a quite sensitive surge behaviour. Thus, even when operating
in a stable point 'in the middle' of the map, only a slight pressure change can cause the system to
rapidly turn into a surge, i.e. non-stable operation. A precise control of the operating point is therefore
necessary.
3.5.1.2 Surge line
Due to the higher inlet pressure for the 2nd stage, the suction volume flow is considerably smaller
than for the 1st stage. For all operating points this results in the 2nd stage (blue dots) operating closer
to the surge line. Thus, the 2nd stage is limiting the operating area of the system.
An identical impeller design was used for the 1st and 2nd stages. With respect to the volume change
of steam between the compression stages, this is not an optimal solution. The impeller of the 2nd
stage should be designed correspondingly smaller, also in order to obtain stable operating conditions
with a good safety margin to the surge line.
15 The reference point, 1.013 bar and 120°C is almost identical to the 1st stage inlet conditions (and almost identical for all operating points). Pressure and temperature of the 2nd suction side change in accordance with the high pressure of the 1st stage.
D4.5 32/38
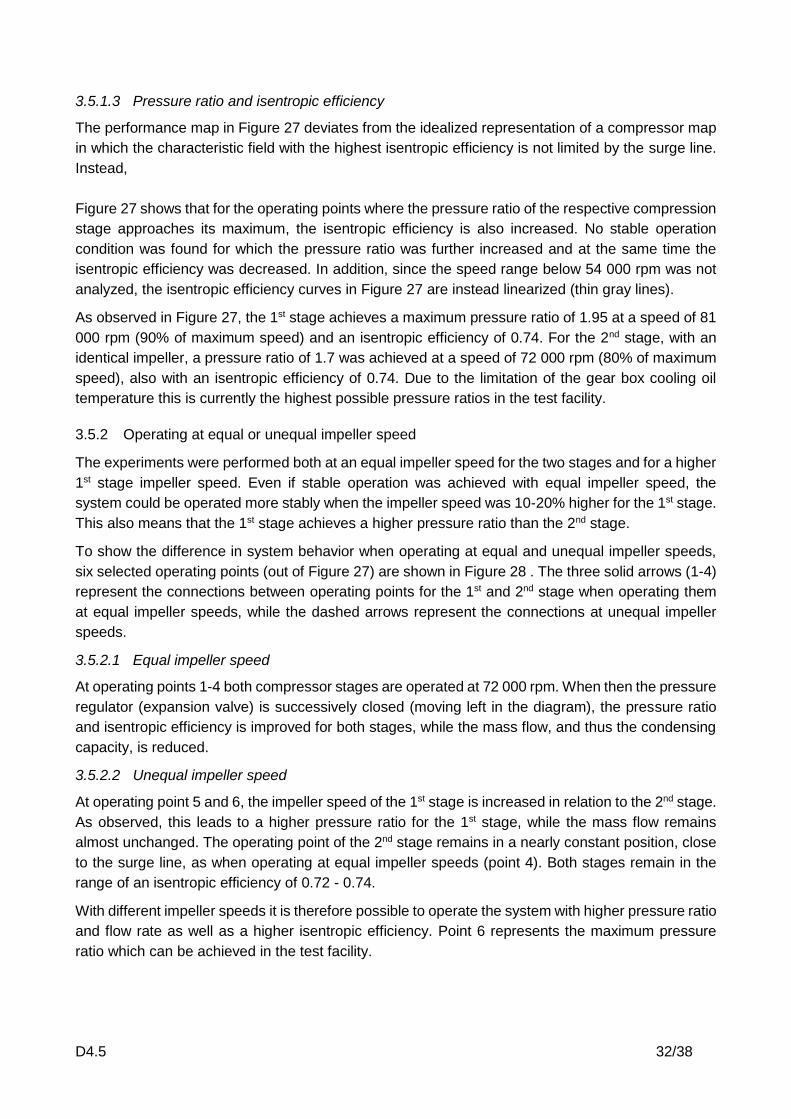
3.5.1.3 Pressure ratio and isentropic efficiency
The performance map in Figure 27 deviates from the idealized representation of a compressor map
in which the characteristic field with the highest isentropic efficiency is not limited by the surge line.
Instead,
Figure 27 shows that for the operating points where the pressure ratio of the respective compression
stage approaches its maximum, the isentropic efficiency is also increased. No stable operation
condition was found for which the pressure ratio was further increased and at the same time the
isentropic efficiency was decreased. In addition, since the speed range below 54 000 rpm was not
analyzed, the isentropic efficiency curves in Figure 27 are instead linearized (thin gray lines).
As observed in Figure 27, the 1st stage achieves a maximum pressure ratio of 1.95 at a speed of 81
000 rpm (90% of maximum speed) and an isentropic efficiency of 0.74. For the 2nd stage, with an
identical impeller, a pressure ratio of 1.7 was achieved at a speed of 72 000 rpm (80% of maximum
speed), also with an isentropic efficiency of 0.74. Due to the limitation of the gear box cooling oil
temperature this is currently the highest possible pressure ratios in the test facility.
3.5.2 Operating at equal or unequal impeller speed
The experiments were performed both at an equal impeller speed for the two stages and for a higher
1st stage impeller speed. Even if stable operation was achieved with equal impeller speed, the
system could be operated more stably when the impeller speed was 10-20% higher for the 1st stage.
This also means that the 1st stage achieves a higher pressure ratio than the 2nd stage.
To show the difference in system behavior when operating at equal and unequal impeller speeds,
six selected operating points (out of Figure 27) are shown in Figure 28 . The three solid arrows (1-4)
represent the connections between operating points for the 1st and 2nd stage when operating them
at equal impeller speeds, while the dashed arrows represent the connections at unequal impeller
speeds.
3.5.2.1 Equal impeller speed
At operating points 1-4 both compressor stages are operated at 72 000 rpm. When then the pressure
regulator (expansion valve) is successively closed (moving left in the diagram), the pressure ratio
and isentropic efficiency is improved for both stages, while the mass flow, and thus the condensing
capacity, is reduced.
3.5.2.2 Unequal impeller speed
At operating point 5 and 6, the impeller speed of the 1st stage is increased in relation to the 2nd stage.
As observed, this leads to a higher pressure ratio for the 1st stage, while the mass flow remains
almost unchanged. The operating point of the 2nd stage remains in a nearly constant position, close
to the surge line, as when operating at equal impeller speeds (point 4). Both stages remain in the
range of an isentropic efficiency of 0.72 - 0.74.
With different impeller speeds it is therefore possible to operate the system with higher pressure ratio
and flow rate as well as a higher isentropic efficiency. Point 6 represents the maximum pressure
ratio which can be achieved in the test facility.

D4.5 33/38
Figure 28: Selected operating conditions for the performance analysis with dependencies (shown as arrows) between the 1st and 2nd compressor stage.
3.5.3 System efficiency
3.5.3.1 Operating and performance parameters
Table 8 shows the results from the performance analysis of the stable operating points 1-6. The
relation between some of the performance parameters are visualized in Figure 29 and Figure 30.
The determined coefficient of performance COP of the turbo compressor system, defined as the ratio
between the condenser cooling capacity and the total electricity consumption of the system, takes
into account all losses in the system; such as pressure drop (piping, measuring instruments, water
nozzles, heat exchangers), losses of inverter, motor and gear unit, heat losses of the complete plant
and compression losses of both turbo compressors.
Table 8: Summary of performance analysis for operating points 1-6 according to Figure 28.
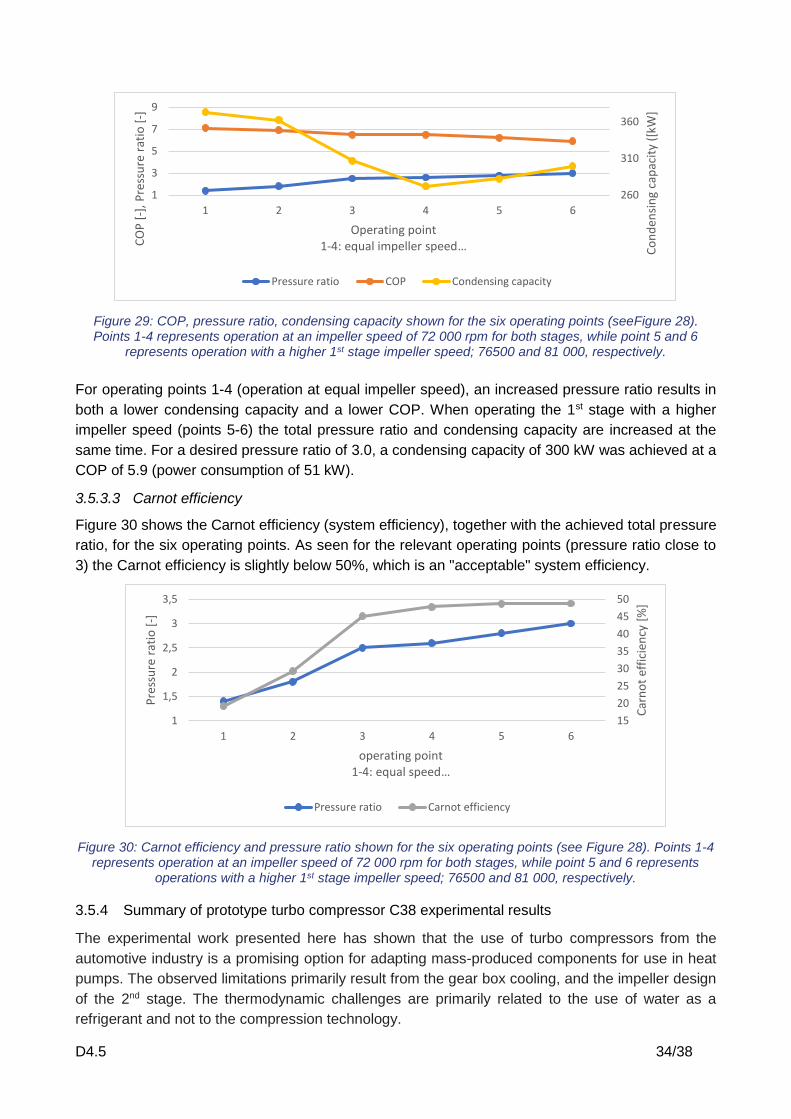
3.5.3.2 COP and condensing capacity
In Figure 29, the total pressure ratio achieved for the 6 operating points are shown, together with the
resulting condensing capacity and COP.
1,0
1,1
1,2
1,3
1,4
1,5
1,6
1,7
1,8
1,9
2,0
0,00 0,05 0,10 0,15 0,20
Corr
ecte
d p
ress
ure
rati
o [
-]
Standardised corrected mass flow rate [kg/s]
1st…2nd…
Referenceconditions:
76 500
67 500
𝑁𝑠𝑒𝑡
= 54 000 𝑈/𝑚𝑖𝑛
58 500
63 000
81 000
72 000
1
4
3
2
5
6
# 𝑁𝑠𝑒𝑡 1/min
�̇�𝑡 kg/s
Π𝑡 −
𝑇𝑠𝑎𝑡 °C
𝑇𝑙𝑖𝑓𝑡 K
�̇�𝐾𝑜𝑛𝑑 . kW
𝑃𝑒𝑙 kW
𝐶𝑂𝑃 −
𝐶𝑂𝑃𝑐𝑎𝑟𝑛𝑜𝑡 −
ηSystem
1. 72.000 – 72.000
0,167 1,4 110,4 10,4 373,1 52,9 7,1 36,8 19,2%
2. 72.000 – 72.000
0,164 1,8 116,6 16,6 362,5 52,4 6,9 23,5 29,3%
3. 72.000 – 72.000
0,141 2,5 127,7 27,7 306,8 47,4 6,5 14,4 45,1%
4. 72.000 – 72.000
0,125 2,6 129,5 29,5 272,3 42,1 6,5 13,6 47,8%
5. 76.500 – 72.000
0,130 2,8 131,8 31,8 282,4 45,8 6,2 12,7 48,7%
6. 81.000 – 72.000
0,138 3,0 133,5 33,5 299,5 50,7 5,9 12,1 48,8%
D4.5 34/38
Figure 29: COP, pressure ratio, condensing capacity shown for the six operating points (seeFigure 28). Points 1-4 represents operation at an impeller speed of 72 000 rpm for both stages, while point 5 and 6
represents operation with a higher 1st stage impeller speed; 76500 and 81 000, respectively.
For operating points 1-4 (operation at equal impeller speed), an increased pressure ratio results in
both a lower condensing capacity and a lower COP. When operating the 1st stage with a higher
impeller speed (points 5-6) the total pressure ratio and condensing capacity are increased at the
same time. For a desired pressure ratio of 3.0, a condensing capacity of 300 kW was achieved at a
COP of 5.9 (power consumption of 51 kW).
3.5.3.3 Carnot efficiency
Figure 30 shows the Carnot efficiency (system efficiency), together with the achieved total pressure
ratio, for the six operating points. As seen for the relevant operating points (pressure ratio close to
3) the Carnot efficiency is slightly below 50%, which is an "acceptable" system efficiency.
Figure 30: Carnot efficiency and pressure ratio shown for the six operating points (see Figure 28). Points 1-4 represents operation at an impeller speed of 72 000 rpm for both stages, while point 5 and 6 represents
operations with a higher 1st stage impeller speed; 76500 and 81 000, respectively.
3.5.4 Summary of prototype turbo compressor C38 experimental results
The experimental work presented here has shown that the use of turbo compressors from the
automotive industry is a promising option for adapting mass-produced components for use in heat
pumps. The observed limitations primarily result from the gear box cooling, and the impeller design
of the 2nd stage. The thermodynamic challenges are primarily related to the use of water as a
refrigerant and not to the compression technology.
260
310
360
1
3
5
7
9
1 2 3 4 5 6
Co
nd
ensi
ng
cap
acit
y ([
kW]
CO
P [
-],
Pre
ssu
re r
atio
[-]
Operating point1-4: equal impeller speed…
Pressure ratio COP Condensing capacity
15
20
25
30
35
40
45
50
1
1,5
2
2,5
3
3,5
1 2 3 4 5 6
Car
no
t ef
fici
ency
[%
]
Pre
ssu
re r
atio
[-]
operating point1-4: equal speed …
Pressure ratio Carnot efficiency

D4.5 35/38
With the two-stage C38 turbo compressor system, the following conclusions are made:
Stable operating conditions were documented for impeller speeds up to 81 000 rpm for the
1st compressor stage and 72 000 for 2nd stage. The maximum impeller speed of 90 000 rpm
could not be achieved due to the temperature limit of the gear box cooling oil.
The determined compressor performance map shows a maximum pressure ratio of 1.95 and
1.7 for the 1st and 2nd stage, respectively, with an isentropic efficiency above 70%.
The 2nd stage operates close to the surge line of the compressor map. To enable stable
operation of both stages near the optimum point, the design of the impeller should be
adjusted to the targeted pressure and volume flow conditions at each stage.
With the two-stage turbo compressor, the desired total pressure ratio of 3.0 was achieved,
resulting in a temperature lift of 33 K when steam is compressed from atmospheric pressure.
For the application of an atmospheric superheated steam dryer a steam flow of 500 kg/h
could be condensed at a temperature of 133.5°C, delivering 300 kW at an electricity
consumption of 51 kW (COP 5.9) and a Carnot efficiency of 48%.
From the validation of a previously developed compressor model and from simulations of the system
operating at higher impeller speeds, the following indicative conclusions were drawn:
The compressor model provides a good approximation of the experimental results in the
defined operating area.
According to the simulated performance map for impeller speeds up to 90 000 rpm, the
maximum achievable pressure ratio of the system is 3.66 at a mass flow rate of 750 kg/h,
corresponding to a condensing capacity of 458 kW at a temperature of 141°C.
3.6 Open loop heat pump test results with the EA42 turbo compressor
We here present preliminary test results from the investigation of the open loop system using the
EA42 prototype turbo compressor at SINTEF. The target of the experimental campaign is to develop
a two-stage turbo compressor with a combined pressure ratio of 6 or higher. With the integrated oil-
free steam turbo-compressor technology developed by Rotrex, rotational speeds up to 80 000 rpm
for an impeller size of 15 cm is feasible.
3.6.1 Preliminary test results
Performance analysis of the first tests for the two-stage EA42 turbo compressor is shown in Table
9. The determined COP considers the pressure drop of the system, the occurring losses of the
inverter, the motor and the gearbox, and the total heat losses and compressor losses of both
compressor units. The present evaluation is based on few operational points without optimization or
operation under optimal conditions.

D4.5 36/38
Table 9: Performance analysis of the first tests for a two-stage turbo compressor system (Tin=110°C ± 5K, pin=1.0bar ± 0.05bar).
3.6.2 Summary of prototype turbo compressor EA42 results
The test results of the turbo compressor EA42 are preliminary but have shown to be very promising.
The two-stage turbo compressor MVR system has been successfully tested with a temperature lift
of 44K and a pressure lift of 4.21, resulting in condensation temperature of 144°C and a COP of 4.2.
Higher pressure ratios are to be expected in further investigations at 100 turbo speed, i.e. at 80 000
rpm. The achievable condensation temperature is expected to be above 155°C with further system
related improvements.
Selected results from the commissioning and demonstration phase of the open loop heat pump
system will be provided in D5.4 Final report on the heat pump technologies developed.
D4.5 37/38
4 CONCLUSIONS
The core of the DryFiciency project is the development of three prototype heat pump installations
for industrial waste heat recovery from drying processes and their demonstration on-site.
4.1 CLOSED LOOP
The two closed loop water-to-water compression heat pump prototypes to be demonstrated in air
drying processes of Agrana and Wienerberger are based on the following development work:
An adapted screw compressor technology comprising of numerous individual parts allowing
suction gas temperatures of up to 100°C and discharge temperatures of 160°C.
A sufficiently viscous lubricant acting chemically and thermally stable when exposed to the
refrigerant selected at elevated temperature levels. The refrigerant selected is OpteonTM MZ
that is non-toxic, non-flammable and has a low GWP of 2. It is well suited for high temperature
applications.
The best heat pump configuration in both technical and economic terms considering the given
boundary conditions in particular for the drying processes at the two demo-sites, the required
operating points of the heat pump systems, as well as the components available (two screw
compressors, eight piston compressors).
Numerical simulations were carried out to optimize the design of the refrigerant cycle for the two
demonstration sites. It was found that twin cycle configurations provide the highest COP of all
configurations possible at moderate temperature levels, and the highest energy cost savings per
year. They also offer advantages in terms of efficiency, safety, start up, and stringency of official
permits. Serial and parallel source stream connections differ slightly regarding heating capacity and
efficiency. However, the planned hydraulic integration allows for both serial and parallel source
stream connections. Numerical performance comparisons with the two compressor types available
led to the following decisions on the cycle configuration and compressor technology to be used:
Agrana: Twin cycle configuration with Bitzer screw compressor
Wienerberger: Twin cycle configuration with Viking piston compressor
With this compressor arrangement, similar heating capacities at both closed loop demonstrators can
be achieved in order to allow for a good comparability of the results.
The two closed loop heat pump demonstrators shall decrease the end energy consumption by 2,200
MWh/a at Agrana and shall lead to a reduction in CO2 emissions of 500 t/a. At Wienerberger, the
anticipated energy savings add up to 84% of the current final energy demand and shall lead to a
reduction in CO2 emissions of about 80%.
Closed loop heat pumps can recover waste heat from liquid and gaseous streams. With high heat
supply temperature up to 160°C, they can be multiplied to a large number of industries, such as
chemicals, food, textiles, etc. Due to valorization of waste heat, they enable substantial increase in
energy efficiency and reduction of CO2 emissions and energy costs. They also contribute to
electrification and decarbonization of industrial processes.

D4.5 38/38
4.2 OPEN LOOP
The implementation of the MVR in the SHS-dryer to be tested at Scanship by means of the novel
turbo compressor technology developed requires the following:
A two-stage compression system with two different impellor geometries, one for each of the
two stages, will be used.
De-superheating of the refrigerant is required twice: between stage 1 and 2 and after
discharge of stage 2. Both will be realized by means of water injection.
An additional steam supply is foreseen for the demonstrator, to allow certain flexibility for
system efficiency evaluation, different operation modes as well as for redundancy reasons.
From the experimental investigation of a two-stage turbo compressor system, consisting of two
identical impeller designs and developed for industrial superheated steam drying applications, the
following indicative conclusion were drawn:
The investigated system shows the potential of being a cost-effective alternative to
conventional vapour compression systems, with the possibility of using series-produced
components from vehicle industry.
The lubricant-free compression space has a high potential both for open and closed loop
high temperature heat pump applications.
Compressors are a cost-effective alternative to conventional blowers and fans up to 2 MWth
MVR systems.
Water (R-718) is suitable for heat source temperature around 100°C, with high industrial
acceptance and environmental compatibility at the same time.