Grafton Group plc/media/Files/G/Grafton/result-centre/2015/... · Buildbase increased revenue and...
30
1 Grafton Group plc Final Results for the Year Ended 31 December 2014
Transcript of Grafton Group plc/media/Files/G/Grafton/result-centre/2015/... · Buildbase increased revenue and...

1
Grafton Group plc
Final Results for the Year Ended 31 December 2014
2
GRAFTON GROUP PLC
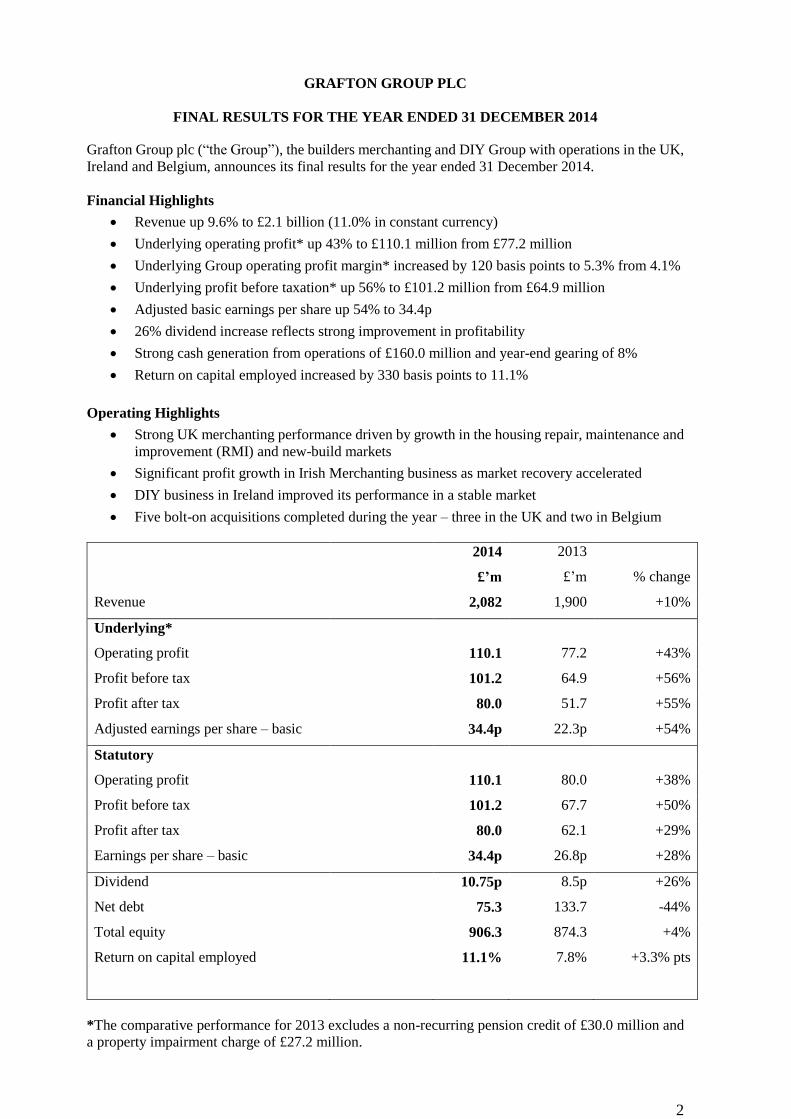
FINAL RESULTS FOR THE YEAR ENDED 31 DECEMBER 2014
Grafton Group plc (“the Group”), the builders merchanting and DIY Group with operations in the UK,
Ireland and Belgium, announces its final results for the year ended 31 December 2014.
Financial Highlights
Revenue up 9.6% to £2.1 billion (11.0% in constant currency)
Underlying operating profit* up 43% to £110.1 million from £77.2 million
Underlying Group operating profit margin* increased by 120 basis points to 5.3% from 4.1%
Underlying profit before taxation* up 56% to £101.2 million from £64.9 million
Adjusted basic earnings per share up 54% to 34.4p
26% dividend increase reflects strong improvement in profitability
Strong cash generation from operations of £160.0 million and year-end gearing of 8%
Return on capital employed increased by 330 basis points to 11.1%
Operating Highlights
Strong UK merchanting performance driven by growth in the housing repair, maintenance and
improvement (RMI) and new-build markets
Significant profit growth in Irish Merchanting business as market recovery accelerated
DIY business in Ireland improved its performance in a stable market
Five bolt-on acquisitions completed during the year – three in the UK and two in Belgium
2014 2013
£’m £’m % change
Revenue 2,082 1,900 +10%
Underlying*
Operating profit 110.1 77.2 +43%
Profit before tax 101.2 64.9 +56%
Profit after tax 80.0 51.7 +55%
Adjusted earnings per share – basic 34.4p 22.3p +54%
Statutory
Operating profit 110.1 80.0 +38%
Profit before tax 101.2 67.7 +50%
Profit after tax 80.0 62.1 +29%
Earnings per share – basic 34.4p 26.8p +28%
Dividend 10.75p 8.5p +26%
Net debt 75.3 133.7 -44%
Total equity
Return on capital employed
906.3
11.1%
874.3
7.8%
+4%
+3.3% pts
*The comparative performance for 2013 excludes a non-recurring pension credit of £30.0 million and
a property impairment charge of £27.2 million.

3
Gavin Slark, Chief Executive Officer commented:
“2014 was a year of significant progress for Grafton which recorded its fifth successive year
of strong profit growth and met the Board’s ‘first base’ financial targets of an operating profit
margin exceeding 5% and a double digit return on capital employed. Given that 2014 was
also the first full year of recovery in its major businesses, the overall outlook for the Group is
positive.”
Webcast Details
A results presentation hosted by Gavin Slark and David Arnold for analysts and investors will
be held today 10 March 2015 at 9.30am (Irish Time).
The web address to access the live webcast is as follows; www.graftonplc.com/webcast
Replay
The webcast will be available to watch later in the day.
The results presentation can be viewed/downloaded at http://www.graftonplc.com
For further information please contact:
Grafton Group plc + 353 1 216 0600
Gavin Slark, Chief Executive Officer
David Arnold, Chief Financial Officer
Murray + 353 1 498 0300
Pat Walsh
MHP Communications + 44 20 3128 8100
James White
Cautionary Statement
Certain statements made in this announcement are forward-looking statements. Such statements are
based on current expectations and are subject to a number of risks and uncertainties that could cause
actual events or results to differ materially from those expressed or implied by these forward looking
statements. They appear in a number of places throughout this announcement and include statements
regarding the intentions, beliefs or current expectations of Directors and senior management
concerning, amongst other things, the results of operations, financial condition, liquidity, prospects,
growth, strategies and the businesses operated by the Group. The Directors do not undertake any
obligation to update or revise any forward-looking statements, whether as a result of new information,
future developments or otherwise.

4
Final Results
For the Year Ended 31 December 2014
Group Results These results demonstrate the significant progress made by the Group in what was the first full year of
recovery in its major markets. Overall trading conditions were favourable as the recovery in the UK
and Irish economies was sustained and contributed to strong growth in revenue and operating profit.
The merchanting business in the UK, which generated 73 per cent of Group revenue, benefited from
improved economic and market conditions and produced record revenue and operating profit. The
overall business performed strongly on the back of increased spending on housing repair, maintenance
and improvement (RMI) projects and significant growth in housebuilding.
The merchanting business in Ireland delivered a strong performance as the revival in the housing
market gathered pace and spending on housing RMI projects increased strongly from a low base.
During the year the recovery broadened into the new housing market which experienced a pick-up in
activity from historically low levels.
Revenue was flat in the Irish Retailing business despite improvements in the wider economy and
sentiment as consumers continued to prioritise debt reduction.
The mortar manufacturing business continued to benefit from an increase in housebuilding and
performed strongly.
The Group’s businesses were strongly cash generative leading to a reduction in net debt by £58.4
million to £75.3 million and a fall in gearing to eight per cent, its lowest level for almost two decades.
This outcome was achieved after funding a significant programme of development expenditure to
support the medium term development of the Group and increased spending on essential capital
expenditure and dividends.
Dividend
A second interim dividend of 7.0p (2013: 5.5p) was approved to give a total dividend for the year of
10.75p. This represents an increase of 26.5 per cent on total dividends of 8.5p paid for 2013. The
increase is in line with the Board’s policy of increasing dividends as earnings recover and reflects both
the strong cashflow from operations and low level of year-end net debt.
Outlook
The pace of UK growth moderately eased in the fourth quarter but the economy remained firmly on
the path of what is expected to be a sustained recovery. Record levels of employment, falling oil prices
and low inflation should translate into growth in consumer spending. Growth in housing RMI is
expected to be supported by good underlying demand following a long period of under investment and
the improvement in the wider economy and secondary housing market. The rate of growth in activity
in the new housing market slowed since the middle of last year but the market is forecast to remain
strong as it approaches a sustainable level of output. Continued weakness in the Eurozone and political
uncertainty around the outcome of the general election are among the risks that could weigh on the
strength of the recovery.
In Ireland, the overall outlook is for the recovery to continue with solid economic growth forecast for
2015. An increase in housing transactions and house prices should support continued investment in

5
residential RMI projects. It is anticipated that the recovery in house building from very low levels
should continue but that it will take some time for supply to match potential demand of 25,000 units
per annum based on demographic factors. Consumer spending is forecast to grow in 2015 as real
disposable income rises due to an increase in employment and pick-up in earnings. Despite this
favourable backdrop, growth in retail spending including DIY is likely to be modest as households
continue to gradually reduce high levels of debt.
Average daily like-for-like revenue grew by 4.7 per cent in January and February in a competitive UK
Merchanting market and by 18.1 per cent in the Irish Merchanting market. Like-for-like revenue
growth was 3.0 per cent in the Retailing business in Ireland.
While as always risks remain, the overall outlook is favourable and the Group continues to be well
positioned to benefit from growth in its markets and from the development initiatives undertaken over
recent years.
Operating Review
Merchanting Segment (90% of Group Revenue)
Merchanting revenue increased by 10.6 per cent to £1.87 billion (2013: £1.69 billion). Operating profit
was up by 34.6 per cent to £110.0 million (2013: £81.8 million) and the operating profit margin
increased by 1.1 percentage points to 5.9 per cent.
UK Merchanting revenue increased by 9.5 per cent to £1.53 billion (2013: £1.39 billion) and operating
profit grew by 22.2 per cent to £92.8 million (2013: £75.9 million).
The UK Merchanting business benefited from more positive market conditions and reported solid
growth in volumes which together with a continued focus on margins and costs resulted in a substantial
improvement in operating profit. The business continued to expand its market position through bolt-
on acquisitions, new branches and branch implants.
Like-for-like revenue growth of 6.5 per cent was driven by the recovery in the residential RMI and new
build markets. Volumes grew by 4.0 per cent and materials price inflation is estimated at 2.5 per cent.
New branches, implants and acquisitions accounted for 3.0 per cent of the increase in revenue for the
year of 9.5 per cent.
The gross margin increased by 0.5 percentage points due to supply chain gains and favourable changes
in mix.
The operating profit margin increased by 0.6 percentage points to 6.1 per cent comprising growth of
1.1 percentage points in the first half to 6.1 per cent and 0.2 percentage points in the second half to 6.1
per cent.
Selco Builders Warehouse, the Group’s trade and business only builders merchants that operates a
retail style self-select format, had an excellent year achieving a significant increase in revenue,
operating profit and margins. The business experienced a strong increase in like-for-like revenue
through the year due to increased activity in the residential RMI market that was underpinned by the
recovery in the wider economy. Growth in revenue was particularly strong in the London region but
also extended across all regions. The four London branches that were opened in 2012 and 2013
performed ahead of expectations and made a significant contribution to operating profit. Selco
continued to implement its strategy of consolidating its market positon and driving growth through
branch openings and enhanced customer propositions. Market coverage was extended with the opening
of a branch in Isleworth, West London and Hire implants were opened in the London branches. Selco
recently opened its 36th branch in Redhill, Surrey and a new branch in Coventry is scheduled to open
in July.

6
Buildbase increased revenue and operating profit supported by the continued strength of the residential
RMI and new build markets together with acquisition and development activity. Growth of 15 per cent
in housing transactions, rising house prices and good availability of credit at historically low rates of
interest combined to provide a positive trading backdrop in the builders merchanting market.
Development activity picked up in 2014 with the completion of three acquisitions trading from ten
branches in the Greater London Area and Kent with combined annual revenue of £28 million. The
Hirebase division had another good year with record revenue and operating profit. It expanded its
position in the tool, plant and equipment hire market with the opening of 22 implants increasing to 115
the number of Buildbase branches with a hire offering. Revenue growth in the branch network was
also driven by the opening of 39 Electricbase implants taking the total number to 59 by the year-end.
Kate Tinsley was appointed Managing Director of Buildbase with effect from 1 January 2015. Prior
to her appointment she was Finance Director of Grafton Merchanting GB. She succeeded Stephen
Thompstone who the Board thanks for his significant contribution to the development of Buildbase
over a period of 16 years.
Buildbase Civils & Lintels branches realised a strong improvement in revenue and operating profit
due to increased volumes driven by the continuing recovery in the new housing market.
Plumbase experienced difficult trading conditions leading to a small decline in revenue for the year as
unseasonably mild weather conditions in September and October delayed the start of the heating season
and weaker volumes in the domestic installation market following on from the Government’s ECO
funded boiler scheme. Tighter operational control and a focus on costs in a weaker market contributed
to a marginal improvement in operating profit from a low base. The specialist bathroom products
distribution business had another year of good progress with a significant improvement in revenue and
operating profit due to improved market conditions and the benefit of profit improvement measures
implemented in recent years.
Plumbase Industrial, a distributor of pipeline and mechanical engineering products for use in
commercial buildings, residential apartment schemes and industrial processes opened nine branches in
the South East following a successful trial of the concept with the opening of a branch in 2013. The
business was significantly enlarged by the recently announced acquisition of TG Lynes, a long
established player in the sector with a leading market position in London and the South East. This is a
significant step forward in the development of the business and complements existing market coverage.
Macnaughton Blair, the Northern Ireland merchanting business, reported good progress for the year
increasing revenue and operating profit. The local economy improved in what was the first year since
2007 that business activity, employment and exports all expanded. There was evidence of a recovery
in the secondary housing market, a key driver of demand in the RMI sector, as prices increased by 7
per cent and transactions were up by a quarter but remained at less than half the level at the peak of the
market in 2007. Housing registrations, a lead indicator of housing starts, were up by 17 per cent from
a very low base in a weak house building market. Increased revenue across the branch network,
including outperformance in a number of local markets, and realignment of cost in the specialist
ironmongery division contributed to the improved results.
Irish Merchanting revenue increased by 6.0 per cent to £257.5 million (2013: £243.0 million). The
increase in constant currency was 11.7 per cent. Operating profit increased by 217 per cent to £16.4
million (2013: £5.2 million) and by 234 per cent from €6.1 million to €20.4 million in constant
currency. The operating profit margin increased by 4.3 percentage points to 6.4 per cent.
All brands performed strongly in a recovering market that saw a significant increase in profit due to
the benefit of a sharp increase in volumes, supply chain gains and tight control of costs. The business
improved its market position during 2014 and, with significant spare capacity in its branch network,
was well placed to benefit from the restructuring measures implemented during the downturn.
The market recovery that started in the second half of 2013 in the Greater Dublin area and provincial
cities continued into the first quarter of 2014. The pace of growth accelerated sharply in the second
quarter as the recovery extended across the branch network and the economy moved onto a firmer

7
growth path. Overall like-for-like revenue growth for the year of 13.9 per cent reflected strong growth
in the residential RMI segment of the market and the early stages of a recovery in house building from
depressed levels and competitive gains.
Activity in the Irish housing market improved over the course of the year. The number of housing
transactions is estimated to have increased from 30,000 to 40,000 but at two per cent of the housing
stock remained at a low level. The total stock of properties for sale fell to its lowest level since 2007
as properties sold more quickly. There was also evidence that a recovery in non-residential
construction was starting to take hold.
House price growth of 16 per cent was concentrated in Dublin, the provincial cities and larger towns.
The increase in prices and a shortfall in supply over recent years stimulated growth in house building
from historically low levels for the first time since 2006.
The primary focus of management was on growing revenue organically in a recovering market. Growth
was fairly evenly spread across all regions and the business also implemented a number of development
initiatives including the opening of a further branch in Cork City and expanding its presence in the
groundworks and infrastructure market with the opening of Civils implants in ten branches.
Belgium Merchanting
Revenue increased by 55.6 per cent to £91.6 million (2013: £58.8 million) and by 63.8 per cent in
constant currency. Operating profit of £0.8 million was 31.8 per cent ahead of the prior year (2013:
£0.6 million) and up by 38.8 per cent in constant currency to €1.1 million (2013: €0.8 million).
Trading conditions were impacted by weak economic growth and a decline in consumer confidence
due to concerns over the impact on disposable incomes of the Government’s austerity programme.
Revenue in the like-for-like business increased strongly in the first quarter as trading recovered from a
weather related decline in the prior year. Revenue declined in the second and third quarters due to the
combination of a softening in the general merchanting market and a competitive readymix concrete
market. The rate of decline in like-for-like revenue eased considerably in the fourth quarter and was
down by 2.1 per cent for the year.
The Group established a strong initial presence in the Brussels market through the acquisition in
February of Mpro which also trades from four branches in the Walloon region. The two Mpro branches
in Brussels were consolidated onto a single site and in October the acquisition of Ginion, which trades
from a strategically located and complementary site in the city, was completed.
Catherine de Miribel was appointed CEO of Grafton Belgium and a number of other senior external
appointments were made to the management team whose focus is on implementing performance
improvement measures and delivering on the synergy opportunities which these acquisitions and the
11 YouBuild branches that are mainly located in the Flanders region offer.
Retail Segment (8 per cent of Group Revenue)
Revenue fell by 5.7 per cent to £158.2 million (2013: £167.9 million) and was down by 0.6 per cent in
constant currency. Revenue in the like-for-like business was up by 0.2 per cent.
Operating profit increased to £2.4 million from £1.2 million in 2013 and to €3.0 million from €1.4
million in constant currency. The prior year result included a property credit of £0.9 million (€1.1
million).
There was a resumption of growth in consumer spending in Ireland for the first time since 2010
supported by increased employment. The return to growth lagged the recovery in the wider economy
due to the decline in disposable incomes and increase in savings as consumers reduced high levels of
personal debt. Despite consumer sentiment improving to its highest level in eight years, trading
conditions in the DIY market were subdued.

8
Like-for-like revenue growth in the Woodie’s DIY business, which trades nationally from 37 stores,
was marginally stronger for the year. Growth in the first half was largely offset by a decline in the
second half due to the discontinuance of non-core lines in the prior year as the business refocused on
its core strengths of DIY, Home and Garden. There had also been strong demand for seasonal products
in the second half of 2013.
2014 was a year of transition for the Woodie’s business under a new Chief Executive who broadened
the management team with key internal and external appointments to the supply chain, operations,
merchandising, marketing and human resource teams. Improving the shopping experience for the
150,000 customers who shop in Woodie’s each week was a priority in 2014. The look of the stores
was enhanced through a new store layout and new ways were introduced to display and merchandise
products. The streamlining of brands to reduce product overlap freed up space to launch kitchens and
bathrooms in a number of stores while also generating significant cash flow for the second successive
year.
The procurement team was focused on utilising the scale of Woodie’s to source quality product ranges
that enabled the business to offer competitive prices and to also increase its gross profit margin for the
year. Woodie’s increased profitability and was cash generative in 2014 and the operational changes
made during the year are expected to put the business in a stronger competitive position to grow revenue
as consumer spending increases.
The seven store In-House kitchens business benefited from an improvement in consumer spending on
durable household goods and increased volumes of kitchens sold through the Selco and Woodie’s
branches.
Manufacturing Segment (2 per cent of Group Revenue)
Revenue increased by 31.7 per cent to £48.7 million (2013: £37.0 million) and operating profit more
than doubled to £7.9 million (2013: £3.9 million). The segment operating profit margin increased by
5.5 percentage points to 16.2 per cent.
CPI EuroMix, the market leader in the supply of silo based mortar from eight manufacturing plants in
England and one in Scotland, increased revenue by 33.5 per cent to £45.2 million (2013: £33.9 million).
The business benefited from the recovery in the new housing market which extended to all regions.
Strong demand for new housing was supported by the economic recovery, the increased availability of
mortgages at the lowest level of interest rates seen for some time and the Help-to-Buy scheme which
gave first-time buyers greater access to the market.
Growth in revenue moderated as anticipated from 40.3 per cent in the first half to 27.9 per cent in the
second half which was measured against growth of 35.0 per cent in the second half of 2013. Housing
registrations, a lead indicator of housing starts, increased by 9 per cent in 2014 to over 145,000 units
including growth of 17 per cent in the last quarter.
Strong volume growth in a positive pricing environment and good control over input costs and
overheads accounted for the increase in operating profit and strong margin progression.
MFP, the PVC drainage and roofline products business based in Dublin, increased revenue and
reported a strong recovery in profitability. The business benefited from increased spending on
residential RMI and good demand in the utilities market.
Financial Review
The Group delivered very good revenue and operating profit growth and outperformed operating
margin expectations in recovering markets.

9
Average daily like-for-like revenue growth of 7.1 per cent increased Group revenue by £133.1 million.
Operating profit in the like-for-like business increased by £31.1 million including an incremental
property profit of £1.9 million, a drop through rate of 22 per cent that incorporated an improvement of
0.5 per cent in the gross margin and an increase in like-for-like overheads of 3.8 per cent.
The Group continued to be strongly cash generative in 2014 and used its cash flow from operations of
£160.0 million (2013: £95.3 million) to fund expenditure on both organic growth and development
opportunities and to increase dividends and reduce net debt.
Return on capital employed increased to 11.1 per cent from 7.8 per cent and capital turn increased to
2.1 times from 1.9 times.
Pension
Employee retirement benefits are principally provided under defined contribution style funding
arrangements. Defined benefit pension schemes comprise 1,700 deferred members and pensioners and
800 active members, equivalent to eight per cent of the Group’s employees.
Pension liabilities in the Group’s defined benefit pension schemes exceeded scheme assets at the year-
end by £33.0 million compared with last year’s deficit of £7.1 million. This was mainly as a result of
the decline in bond yields to historically low levels in response to concerns over the outlook for global
growth and the risk of deflation in Europe. The rate used to discount liabilities in the UK scheme fell
to 3.60 per cent from 4.65 per cent and the Irish rate declined to 2.10 per cent from 3.65 per cent.
Scheme assets of £189.2 million (31 December 2013: £180.7 million) showed an investment return of
8.2 per cent for the year.
Property
The Group owns a significant property portfolio, the majority of which is used for trading purposes. It
has historically had an active programme of releasing cash and realising value from its property
interests and it continues to manage its portfolio with a view to maximising value in the most
appropriate way for the overall business. The sale of property realised a profit on disposal of £2.2
million and generated cash flow of £4.4 million in 2014. At the year end, the carrying value of
properties held for resale and being actively marketed and properties held pending a recovery in the
property market or with a view to enhancing their development potential was £30.1 million.
Net Finance Income and Expense
The net finance charge for the year of £8.9 million (2013: £12.3 million) reflected a reduction of £2.5
million in net bank and loan note interest to £7.3 million due principally to the benefit of the debt
refinancing completed in May 2014, declining money market interest rates and lower net debt.
The net finance charge element that related to the defined benefit pension scheme obligations fell to
£0.3 million (2013: £1.4 million) and the charge due to movements on hedges and foreign exchange
increased to £1.3 million (2013: £1.1 million).
Taxation
The tax charge for the year of £21.2 million represents an effective rate of 21.0 per cent (2013: 20.4
per cent on underlying profit). This reflects the mix of profits that attract different rates of tax in the
UK, Ireland and Belgium, the benefit of a reduction in the UK corporation tax rate to 21.5 per cent
from 23.25 per cent in 2013 and the disallowance of a tax deduction for certain overheads charged in
arriving at profit before tax including depreciation on buildings. A further reduction in the UK rate to
20 per cent is due to take effect on 1 April 2015. The effective rate of 20.4 per cent in 2013 included
the benefit of a decline in deferred tax liabilities due to the reduction announced in the rate of UK
corporation tax to 20 per cent over the period to 2015.
10
Capital and Development Expenditure
Net capital and development expenditure for the year was £41.7 million (2013: £22.5 million). The
Group continued to invest in the profitable growth of its business with development expenditure of
£26.8 million incurred on new Selco stores in Isleworth and Redhill, development of Plumbase
Industrial, Electricbase and Hirebase implants and branch upgrades. This also included expenditure of
£5.9 million on upgrading the IT systems and infrastructure that supports a number of the UK
businesses principally Buildbase and Plumbase as part of a multi-year programme of investment.
Investment of £20.1 million in replacement of assets included distribution vehicles to support ongoing
trading in the established branches.
Acquisitions
Acquisition expenditure of £33.1 million (net of cash acquired) was incurred on two acquisitions in
Belgium and three in the UK.
Financing
In May 2014, the Group entered into five year revolving credit facilities with its five principal
relationship banks for £460 million. These bilateral multi-currency facilities, which mature in May
2019, replaced existing facilities of £360 million that were mainly due to mature in 2016. The
refinancing was brought forward to take advantage of more favourable pricing terms on drawn and
undrawn facilities and will lead to annual interest savings of circa £3.0 million based on current
drawings.
The new facilities, which were oversubscribed, extended the maturity of the Group’s debt and provided
certainty of finance over a longer period. The refinancing also gave the Group increased funding
headroom and flexibility with the level of undrawn facilities at the year-end increasing to £207.5
million (31 December 2013: £111.6 million).
Net Debt
Net debt declined by £58.4 million to £75.3 million (31 December 2013: £133.7 million), its lowest
level since 1999 and the gearing ratio fell to 8 per cent (31 December 2013: 15 per cent), its lowest
level for almost two decades. Cash on deposit and held in current accounts was £182.4 million at the
year-end (31 December 2013: £151.1 million).
The Group continues to target an efficient and prudent capital structure based on debt ratios that are
consistent with investment grade credit metrics while also retaining the flexibility to take advantage of
development opportunities in its markets.
Underlying EBITDA interest cover was 19.4 times (2013: 11.0 times) and year-end debt was 0.53 times
EBITDA (2013: 1.23 times).
Shareholders’ Equity
Shareholders’ equity increased to £902.3 million at 31 December 2014 (31 December 2013: £870.3
million). Profit after tax increased equity by £80.0 million. Shareholders’ equity was reduced by the
increase in the defined benefit pension scheme deficit after tax of £23.3 million and by dividend
payments of £21.5 million. There was a currency loss of £8.3 million on conversion of Euro assets,
net of related euro debt, into sterling at the year-end Euro/Sterling rate of exchange of 77.89p (31
December 2013: 83.37p).

11
Grafton Group plc Group Condensed Income Statement For the year ended 31 December 2014
Continuing activities Notes
2014 £’000
2013 £’000
Revenue 2 2,081,686 1,899,768 Operating costs 3 (1,971,581) (1,849,717) Operating income 3 - 29,964
Operating profit 110,105 80,015 Finance expense 4 (9,857) (13,660) Finance income 4 997 1,366
Profit before tax 101,245 67,721 Income tax 17 (21,223) (5,622)
Profit after tax for the financial year 80,022 62,099
Profit attributable to: Owners of the Company 80,046 62,179 Non-controlling interests 8 (24) (80)
Profit after tax for the financial year 80,022 62,099
Earnings per ordinary share - basic 5 34.42 26.79p
Earnings per ordinary share - diluted 5 33.99 26.67p

12
Grafton Group plc Group Condensed Statement of Comprehensive Income For the year ended 31 December 2014
2014 2013
Notes £’000 £’000
Profit after tax for the financial year 80,022 62,099
Other comprehensive income Items that may be reclassified subsequently to the income statement
Currency translation effects - on foreign currency net investments
(6,707) 1,176
- on foreign currency borrowings designated as net investment hedges
(1,634) 908
Fair value movement on cash flow hedges:
- Effective portion of changes in fair value of cash flow hedges (241) (66)
- Net change in fair value of cash flow hedges transferred from equity
109 577
Deferred tax on cash flow hedges (2) (63)
(8,475) 2,532
Items that will not be reclassified to the income statement
Remeasurement (loss)/gain on Group defined benefit pension schemes
13 (28,054) 7,442
Deferred tax on Group defined benefit pension schemes 13 4,728 (1,032)
(23,326) 6,410
Total other comprehensive income (31,801) 8,942
Total comprehensive income for the financial year
48,221 71,041
Total comprehensive income attributable to: Owners of the Company 48,245 71,121 Non-controlling interests 8 (24) (80)
Total comprehensive income for the financial year 48,221 71,041

13
Grafton Group plc
Group Condensed Balance Sheet as at 31 December 2014
31 Dec 2014
(Audited) £’000
31 Dec 2013
(Audited) £’000
Notes ASSETS Non-current assets Goodwill 15 480,157 481,020 Intangible assets 16 5,757 - Property, plant and equipment 9 423,411 413,401 Investment properties 9 20,473 19,861 Deferred tax assets 23,452 17,666 Retirement benefit assets 13 125 718 Derivative financial instruments 11 - 835 Other financial assets 123 124 Total non-current assets 953,498 933,625
Current assets Properties held for sale 9 9,581 11,352 Inventories 10 249,906 246,220 Trade and other receivables 10 302,871 307,822 Derivative financial instruments 11 1,095 835 Cash and cash equivalents 11 182,360 151,099 Total current assets 745,813 717,328
Total assets 1,699,311 1,650,953
EQUITY Equity share capital 8,309 8,302 Share premium account 206,597 206,554 Capital redemption reserve 621 621 Revaluation reserve 13,822 13,978 Shares to be issued reserve 7,834 2,875 Cash flow hedge reserve (36) 98 Foreign currency translation reserve 58,005 66,346 Retained earnings 610,998 575,419 Treasury shares held (3,897) (3,897) Equity attributable to owners of the Company 902,253 870,296 Non-controlling interests 8 4,027 4,051 Total equity 906,280 874,347
LIABILITIES Non-current liabilities Interest-bearing loans and borrowings 11 244,305 272,610 Provisions 20,855 22,663 Retirement benefit obligations 13 33,085 7,840 Derivative financial instruments 11 44 - Deferred tax liabilities 17 30,758 30,746 Total non-current liabilities 329,047 333,859
Current liabilities Interest-bearing loans and borrowings 11 14,422 13,863 Trade and other payables 10 425,696 410,011 Current income tax liabilities 17 17,334 8,201 Derivative financial instruments 11 - 33 Provisions 6,532 10,639 Total current liabilities 463,984 442,747 Total liabilities 793,031 776,606 Total equity and liabilities 1,699,311 1,650,953
14
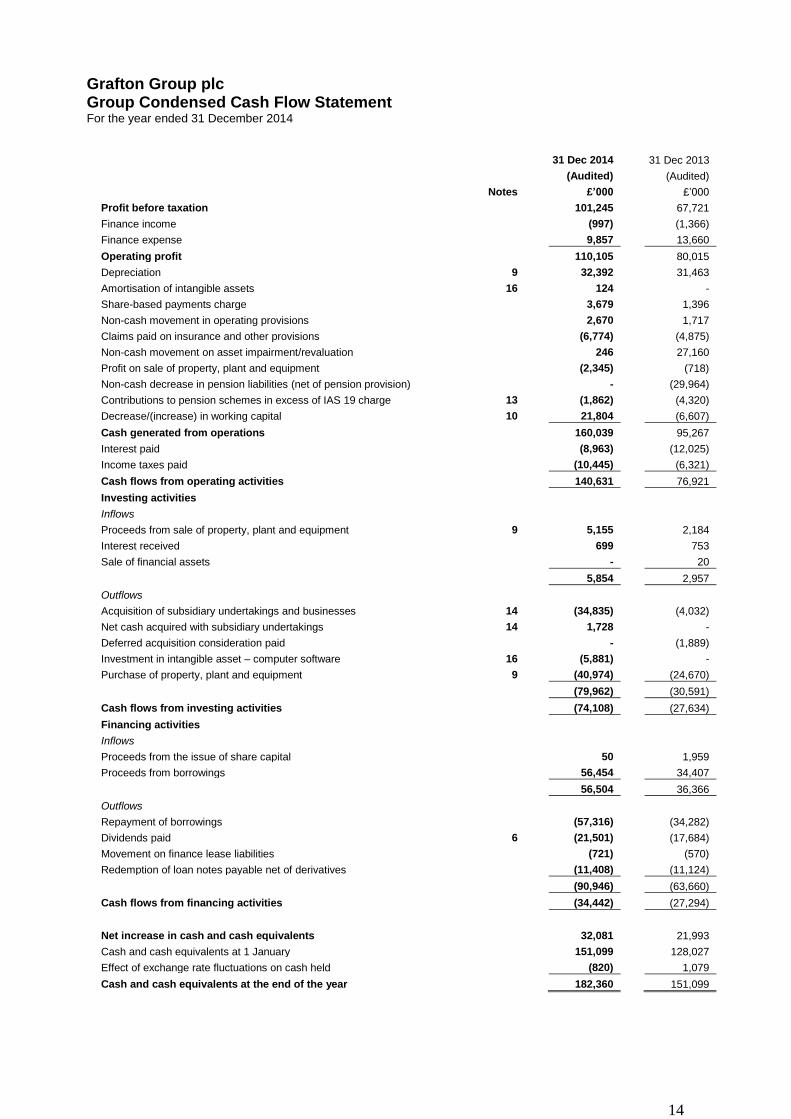
Grafton Group plc Group Condensed Cash Flow Statement For the year ended 31 December 2014
31 Dec 2014
(Audited)
31 Dec 2013
(Audited)
Notes £’000 £’000
Profit before taxation 101,245 67,721
Finance income (997) (1,366)
Finance expense 9,857 13,660
Operating profit 110,105 80,015
Depreciation 9 32,392 31,463
Amortisation of intangible assets 16 124 -
Share-based payments charge 3,679 1,396
Non-cash movement in operating provisions 2,670 1,717
Claims paid on insurance and other provisions (6,774) (4,875)
Non-cash movement on asset impairment/revaluation 246 27,160
Profit on sale of property, plant and equipment (2,345) (718)
Non-cash decrease in pension liabilities (net of pension provision) - (29,964)
Contributions to pension schemes in excess of IAS 19 charge 13 (1,862) (4,320)
Decrease/(increase) in working capital 10 21,804 (6,607)
Cash generated from operations 160,039 95,267
Interest paid (8,963) (12,025)
Income taxes paid (10,445) (6,321)
Cash flows from operating activities 140,631 76,921
Investing activities
Inflows
Proceeds from sale of property, plant and equipment 9 5,155 2,184
Interest received 699 753
Sale of financial assets - 20
5,854 2,957
Outflows
Acquisition of subsidiary undertakings and businesses 14 (34,835) (4,032)
Net cash acquired with subsidiary undertakings 14 1,728 -
Deferred acquisition consideration paid - (1,889)
Investment in intangible asset – computer software 16 (5,881) -
Purchase of property, plant and equipment 9 (40,974) (24,670)
(79,962) (30,591)
Cash flows from investing activities (74,108) (27,634)
Financing activities
Inflows
Proceeds from the issue of share capital 50 1,959
Proceeds from borrowings 56,454 34,407
56,504 36,366
Outflows
Repayment of borrowings (57,316) (34,282)
Dividends paid 6 (21,501) (17,684)
Movement on finance lease liabilities (721) (570)
Redemption of loan notes payable net of derivatives (11,408) (11,124)
(90,946) (63,660)
Cash flows from financing activities (34,442) (27,294)
Net increase in cash and cash equivalents 32,081 21,993
Cash and cash equivalents at 1 January 151,099 128,027
Effect of exchange rate fluctuations on cash held (820) 1,079
Cash and cash equivalents at the end of the year 182,360 151,099

15
Grafton Group plc Group Condensed Statement of Changes in Equity Equity
share capital
Share premium account
Capital redemption
reserve Revaluation
reserve
Shares to be issued
reserve
Cash Flow hedge
reserve Foreign currency
translation reserve Retained earnings
Treasury shares Total
Non-Controlling
Interests Total
equity £’000 £’000 £’000 £’000 £’000 £’000 £’000 £’000 £’000 £’000 £’000 £’000 Year to 31 December 2014 (Audited) At 1 January 2014 8,302 206,554 621 13,978 2,875 98
66,346 575,419 (3,897) 870,296 4,051 874,347
Profit after tax for the financial year - - - - - - - 80,046 - 80,046 (24) 80,022
Total other comprehensive income Remeasurement loss on pensions (net of tax) - - - - - - - (23,326) - (23,326) - (23,326) Movement in cash flow hedge reserve (net of tax) - - - - - (134) - - - (134) - (134) Currency translation effect on foreign currency net investments - - - - - - (6,707) - - (6,707) - (6,707) Currency translation effect on foreign currency borrowings and derivatives designated as net investment hedges
-
-
-
-
-
-
(1,634)
-
-
(1,634)
-
(1,634)
Total other comprehensive income - - - - - (134) (8,341) (23,326) - (31,801) - (31,801)
Total comprehensive income - - - - - (134) (8,341) 56,720 - 48,245 (24) 48,221
Transactions with owners of the Company recognised directly in equity Dividends paid
-
-
-
-
-
-
-
(21,501)
-
(21,501)
-
(21,501)
Issue of Grafton Units (net of issue expenses) 7 43 - - - - - - - 50 - 50 Share based payments charge - - - - 3,679 - - - - 3,679 - 3,679 Deferred tax asset on share based payments - - - - 1,484 - - - - 1,484 - 1,484 Transfer from shares to be issued reserve - - - - (204) - - 204 - - - - Transfer from revaluation reserve - - - (156) - - - 156 - - - -
7 43 - (156) 4,959 - - (21,141) - (16,288) - (16,288)
At 31 December 2014 8,309 206,597 621 13,822 7,834 (36) 58,005 610,998 (3,897) 902,253 4,027 906,280
Year to 31 December 2013 (Audited) At 1 January 2013 8,283 204,614 621 20,660 2,072 (350) 64,262 517,239 (3,897) 813,504 4,131 817,635
Profit after tax for the financial year - - - - - - - 62,179 - 62,179 (80) 62,099
Total other comprehensive income Remeasurement gain on pensions (net of tax) - - - - - - - 6,410 - 6,410 - 6,410 Movement in cash flow hedge reserve (net of tax) - - - - - 448 - - - 448 - 448 Currency translation effect on foreign currency net investments - - - - - - 1,176 - - 1,176 - 1,176 Currency translation effect on foreign currency borrowings and derivatives designated as net investment hedges
-
-
-
-
-
-
908
-
-
908
-
908
Total other comprehensive income - - - - - 448 2,084 6,410 - 8,942 - 8,942
Total comprehensive income - - - - - 448 2,084 68,589 - 71,121 (80) 71,041
Transactions with owners of the Company recognised directly in equity
Dividends paid - - - - - - - (17,684) - (17,684) - (17,684) Issue of Grafton Units (net of issue expenses) 19 1,940 - - - - - - - 1,959 - 1,959 Share based payments charge - - - - 1,396 - - - - 1,396 - 1,396 Transfer from shares to be issued reserve - - - - (593) - - 593 - - - - Transfer from revaluation reserve - - - (6,682) - - - 6,682 - - - -
19 1,940 - (6,682) 803 - - (10,409) - (14,329) - (14,329)
At 31 December 2013 8,302 206,554 621 13,978 2,875 98 66,346 575,419 (3,897) 870,296 4,051 874,347

16
Grafton Group plc Notes to Final Results for the year ended 31 December 2014
1. General Information The financial information presented in this report has been prepared using accounting policies consistent with
International Financial Reporting Standards (IFRS) as adopted by the European Union and as set out in the
Group’s annual financial statements in respect of the year ended 31 December 2013 except as noted below. The
financial information does not include all the information and disclosures required in the annual financial
statements. The Annual Report will be distributed to shareholders and made available on the Company’s
website www.graftonplc.com in due course. It will also be filed with the Company’s Annual Return in the
Companies Registration Office. The auditors have reported on the financial statements for the year ended 31
December 2014 and their report was unqualified and did not contain any matters to which attention was drawn
by way of emphasis. The comparative financial information for the year ended 31 December 2013 represents
an abbreviated version of the Group’s statutory financial statements on which an unqualified audit report was
issued and which have been filed with the Companies Registration Office.
Basis of Preparation, Accounting Policies and Estimates
(a) Basis of Preparation and Accounting Policies
The accounting policies applied by the Group in these condensed financial statements are the same as those
applied by the Group in its consolidated financial statements as at and for the year ended 31 December 2013
except for the policy noted below which applies in the current year:
Intangible Assets (Computer Software)
Computer software, including computer software which is not an integrated part of an item of computer
hardware, is stated at cost less any accumulated amortisation and any accumulated impairment losses. Cost
comprises purchase price and any other directly attributable costs. Costs relating to the development of computer
software for internal use are capitalised once the recognition criteria outlined in the standard are met.
The adoption of other new standards and interpretations (as set out in the 2013 Annual Report) that became
effective for the Group's financial statements for the year ended 31 December 2014 did not have any significant
impact on the results or financial position of the Group.
The following standards and interpretations are effective for the Group from 1 January 2014 but do not have a
material effect on the results or financial position of the Group.
IFRS 10 – Consolidated Financial Statements. (Effective date: financial year beginning 1 January 2014)
IFRS 10 replaces all of the guidance on control and consolidation in IAS 27 and SIC 12. IFRS 10 changes the
definition of control so that the same criteria are applied to all entities to determine control. The core principle
that a consolidated entity presents a parent and its subsidiaries as a single entity remains the same, as does the
mechanics for consolidation. The definition of control is defined as when the Group is exposed to, or has rights
to, variable returns from its involvement with the entity and has the ability to affect these returns through its
power over the entity. This standard has not had any significant impact on the Group’s financial statements.
IFRS 11 - Joint Arrangements. (Effective date: financial year beginning 1 January 2014)
IFRS 11 removes the existing accounting policy choice of proportionate consolidation for jointly controlled
entities. IFRS 11 makes equity accounting mandatory for participants in joint ventures. The Group previously
had adopted an accounting policy of proportionate consolidation for jointly controlled entities but on adoption
of IFRS 11 the Group is now required to equity account for its interest in jointly controlled entities. The change
in accounting policy has not had any significant impact on the Group’s financial statements.
17
Basis of Preparation, Accounting Policies and Estimates (Continued)
(a) Basis of Preparation and Accounting Policies (continued)
IFRS 12 - Disclosure of Interest in Other Entities. (Effective date: financial year beginning 1 January 2014)
IFRS 12 requires entities to disclose information about the nature, risks and financial effects associated with the
entity’s interest in subsidiaries, associates, joint arrangements and unconsolidated structured entities. This
standard has not had a significant impact on the Group’s financial statements.
Amendment to IAS 32 - Offsetting financial assets and financial liabilities (Effective date: financial year
beginning 1 January 2014)
This amendment clarifies some of the requirements for offsetting financial assets and financial liabilities on the
balance sheet. This amendment has not had a significant impact on the Group’s financial statements.
The adoption of other new standards, interpretations and amendments that become effective for the year ended
31 December 2014 also did not have any significant impact on the results or financial position of the Group.
(b) Estimates
The preparation of the Financial Statements requires management to make judgements, estimates and
assumptions that affect the application of accounting policies and the reported amounts of assets and liabilities,
income and expense. Actual results may differ from these estimates.
In preparing the Financial Statements, the significant judgements made by management in applying the Group’s
accounting policies and the key sources of estimation uncertainty were the same as those that applied to the
consolidated financial statements as at and for the year ended 31 December 2013.
18
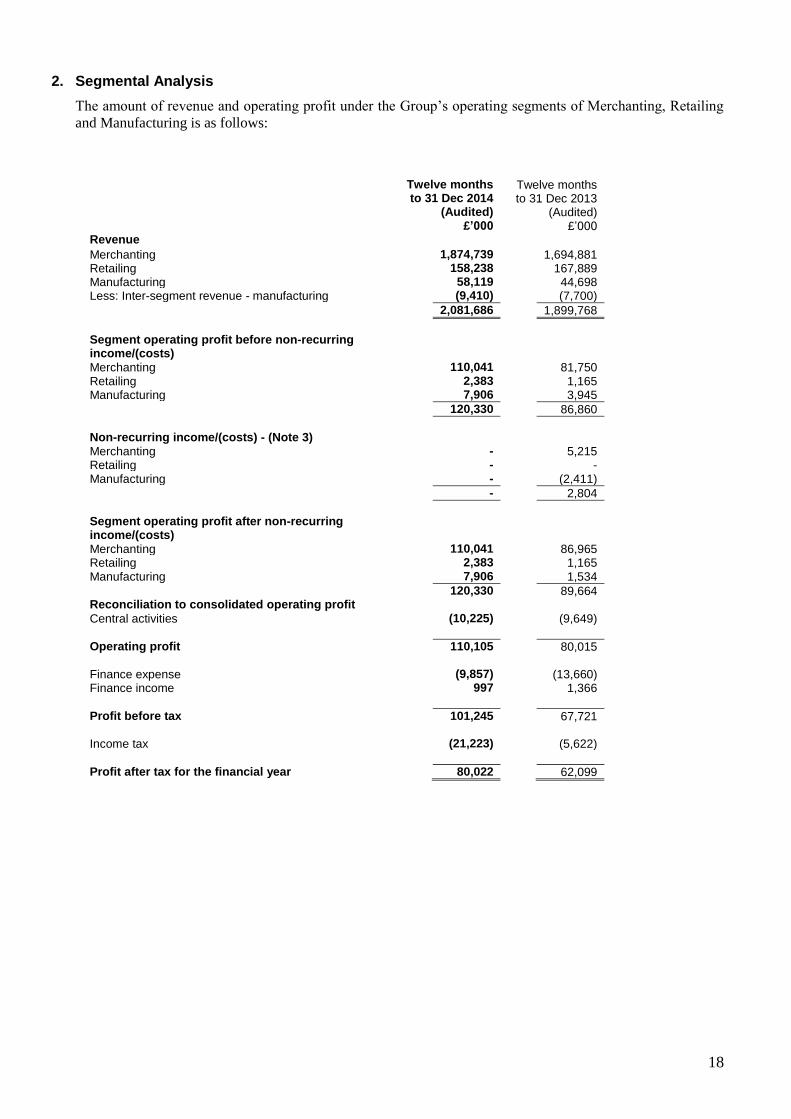
2. Segmental Analysis
The amount of revenue and operating profit under the Group’s operating segments of Merchanting, Retailing
and Manufacturing is as follows:
Twelve months
to 31 Dec 2014 (Audited)
£’000
Twelve months to 31 Dec 2013
(Audited) £’000
Revenue
Merchanting 1,874,739 1,694,881 Retailing 158,238 167,889 Manufacturing 58,119 44,698 Less: Inter-segment revenue - manufacturing (9,410) (7,700)
2,081,686 1,899,768
Segment operating profit before non-recurring income/(costs)
Merchanting 110,041 81,750 Retailing 2,383 1,165 Manufacturing 7,906 3,945
120,330 86,860
Non-recurring income/(costs) - (Note 3)
Merchanting - 5,215 Retailing - - Manufacturing - (2,411)
- 2,804
Segment operating profit after non-recurring income/(costs)
Merchanting 110,041 86,965 Retailing 2,383 1,165 Manufacturing 7,906 1,534
120,330 89,664 Reconciliation to consolidated operating profit Central activities (10,225) (9,649)
Operating profit 110,105 80,015 Finance expense (9,857) (13,660) Finance income 997 1,366
Profit before tax 101,245 67,721 Income tax (21,223) (5,622)
Profit after tax for the financial year 80,022 62,099

19
2. Segmental Analysis (continued)
Operating segment assets are analysed below:
31 Dec 2014 (Audited)
£’000
31 Dec 2013
(Audited) £’000
Segment assets Merchanting 1,399,331 1,375,099 Retailing 52,882 64,545 Manufacturing 39,943 40,032
1,492,156 1,479,676 Unallocated assets Deferred tax assets 23,452 17,666 Retirement benefit assets 125 718 Other financial assets 123 124 Derivative financial instruments 1,095 1,670 Cash and cash equivalents 182,360 151,099
Total assets 1,699,311 1,650,953
The amount of revenue by geographic area is as follows:
Twelve months to 31 Dec 2014
(Audited) £’000
Twelve months to 31 Dec 2013
(Audited) £’000
Revenue United Kingdom 1,570,875 1,426,888 Ireland 419,247 414,031 Belgium 91,564 58,849
2,081,686 1,899,768

20
3. Non-Recurring Operating Costs and Operating Income Included within operating income and operating costs in 2013 was a non-recurring pension credit of £30.0
million and property impairments of £27.2 million as analysed below:
Year to
31 Dec 2014 (Audited)
£’000
Year to 31 Dec 2013
(Audited) £’000
Pension scheme Past service credit - 18,534
Settlement gain - 16,932 Settlement contribution liability - (5,014)
Net settlement gain - 11,918
Professional fees - (488)
Pension scheme credit - 29,964
Property impairment – UK and Ireland Impairment - Irish properties - (23,180) Impairment - UK properties - (3,980)
- (27,160)
- 2,804
Pension scheme credit
The 2013 past service credit of £18.5 million arose due to the implementation of a permanent pensionable salary
freeze in the United Kingdom and a pensionable salary freeze in Ireland for five years, together with an
alignment of the normal retirement age and the State pension age in Ireland. The net settlement gain of £11.9
million arose due to the settlement of transfer values with the deferred members.
Property impairment
In 2013 a strategic review of freehold properties gave rise to a non-cash impairment charge of £27.2 million to
the Income Statement. The impairment charge related mainly to properties located in the Republic of Ireland.

21
4. Finance Expense and Finance Income
Twelve months to
31 Dec 2014 (Audited)
£’000
Twelve months to 31 Dec 2013
(Audited) £’000
Finance expense
Interest on bank loans and overdrafts (7,809) * (10,256) *
Interest on loan notes (239) * (413) *
Net change in fair value of cash flow hedges transferred from equity
(109)
(577)
Interest on finance leases (246) (278)
Net finance cost on pension scheme obligations (244) (1,403)
Fair value movement on derivatives (Cross Currency Interest Rate Swaps (CCIRS) not in hedging relationships)
-
(1)
Ineffectiveness on cash flow hedges - (10)
Foreign exchange loss (1,210) (722)
(9,857) (13,660)
Finance income
Foreign exchange gain - 537
Fair value movement on derivatives (Cross Currency Interest Rate Swaps (CCIRS) not in hedging relationships)
298
-
Interest income on bank deposits 699 * 829 *
997 1,366
Net finance expense (8,860) (12,294)
* Net bank/loan note interest of £7.3 million (2013: £9.8 million).
22
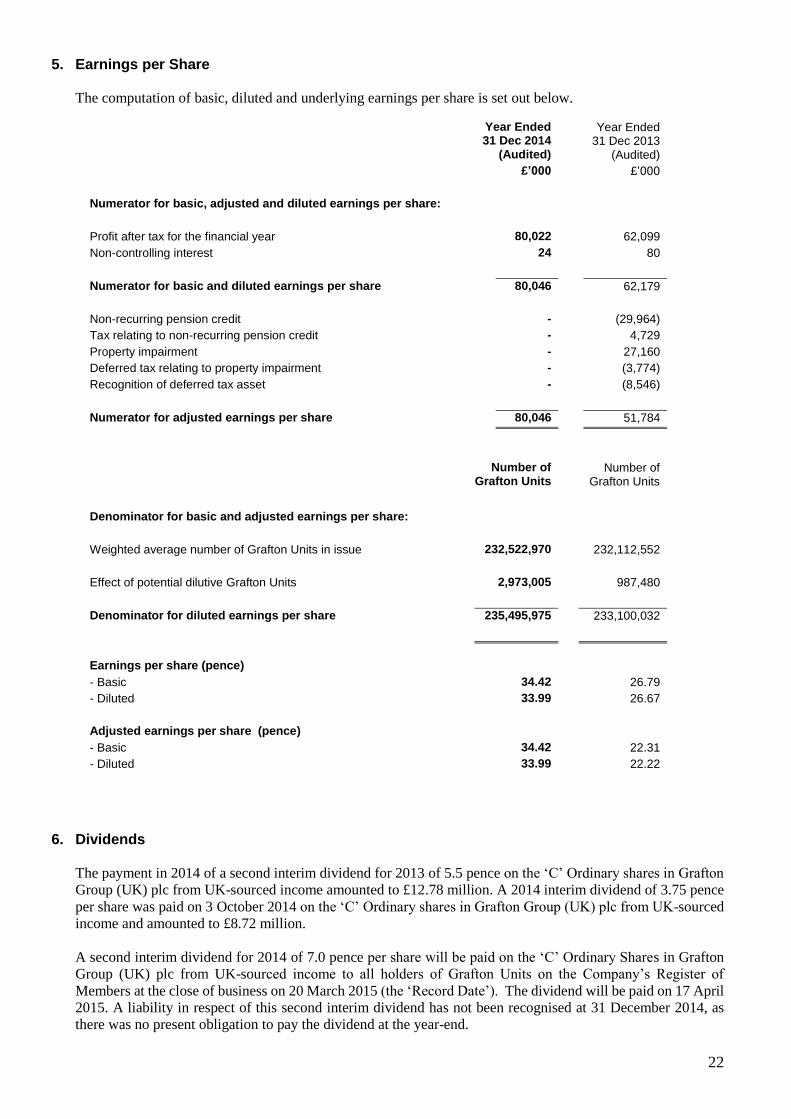
5. Earnings per Share The computation of basic, diluted and underlying earnings per share is set out below.
Year Ended 31 Dec 2014
Year Ended
31 Dec 2013 (Audited) (Audited)
£’000 £’000
Numerator for basic, adjusted and diluted earnings per share:
Profit after tax for the financial year 80,022 62,099
Non-controlling interest 24 80
Numerator for basic and diluted earnings per share 80,046 62,179
Non-recurring pension credit - (29,964)
Tax relating to non-recurring pension credit - 4,729
Property impairment - 27,160
Deferred tax relating to property impairment - (3,774)
Recognition of deferred tax asset - (8,546)
Numerator for adjusted earnings per share 80,046 51,784
Number of Grafton Units
Number of Grafton Units
Denominator for basic and adjusted earnings per share:
Weighted average number of Grafton Units in issue 232,522,970 232,112,552
Effect of potential dilutive Grafton Units 2,973,005 987,480
Denominator for diluted earnings per share 235,495,975 233,100,032
Earnings per share (pence)
- Basic 34.42 26.79
- Diluted 33.99 26.67
Adjusted earnings per share (pence)
- Basic 34.42 22.31
- Diluted 33.99 22.22
6. Dividends
The payment in 2014 of a second interim dividend for 2013 of 5.5 pence on the ‘C’ Ordinary shares in Grafton
Group (UK) plc from UK-sourced income amounted to £12.78 million. A 2014 interim dividend of 3.75 pence
per share was paid on 3 October 2014 on the ‘C’ Ordinary shares in Grafton Group (UK) plc from UK-sourced
income and amounted to £8.72 million.
A second interim dividend for 2014 of 7.0 pence per share will be paid on the ‘C’ Ordinary Shares in Grafton
Group (UK) plc from UK-sourced income to all holders of Grafton Units on the Company’s Register of
Members at the close of business on 20 March 2015 (the ‘Record Date’). The dividend will be paid on 17 April
2015. A liability in respect of this second interim dividend has not been recognised at 31 December 2014, as
there was no present obligation to pay the dividend at the year-end.

23
7. Exchange Rates The results and cash flows of subsidiaries with euro functional currencies have been translated into sterling
using the average exchange rate for the year. The balance sheets of subsidiaries with euro functional currencies
have been translated into sterling at the rate of exchange ruling at the balance sheet date.
The average sterling/euro rate of exchange for the year ended 31 December 2014 was Stg80.61p (year to 31
December 2013: Stg84.93p). The sterling/euro exchange rate at 31 December 2014 was Stg77.89p (31
December 2013: Stg83.37p).
8. Non-Controlling Interests The Group holds a controlling interest in YouBuild NV (formerly BMC Groep NV) that is accounted for as a
subsidiary undertaking with a non-controlling interest.
9. Property, Plant and Equipment
Property, plant and equipment
Properties
held for sale
Investment properties
£’000 £’000 £’000 Net Book Value As at 1 January 2014 413,401 11,352 19,861
Additions 40,974 - -
Acquisitions 12,382 - -
Depreciation (32,392) - -
Disposals (1,190) (888) (732)
Transfer to properties held for sale (752) 752 -
Transfer to investment properties (2,969) (425) 3,394
Transfer to property, plant & equipment 1,830 (349) (1,481)
Impairment/revaluation of properties - (666) 420
Foreign exchange (7,873) (195) (989)
As at 31 December 2014 423,411 9,581 20,473
There was no material change in the fair value of investment properties or properties held for sale following an
internal review undertaken by the Group Property Director. The determination of fair value and the valuation
techniques used, including significant unobservable inputs, at 31 December 2014, are similar to those disclosed
in the 2013 Annual Report.
During the year an additional four UK properties and an additional two Irish properties were transferred into
investment properties. There were two disposals of Irish investment properties during the year. One property
in the UK was also transferred out of investment properties during 2014. The total number of investment
properties at 31 December 2014 is 22 (2013:19) of which 6 (2013: 3) are located in the United Kingdom and 16
in Ireland (2013: 16).
There were five disposals of UK properties held for sale, two UK transfers out to investment properties and one
UK transfers out to property, plant and equipment during 2014. There were 4 transfers in of properties from
property, plant and equipment during the year leaving 23 (2013: 27) properties of which 22 (2013: 26) are
located in the United Kingdom and 1 (2013: 1) in Ireland.

24
10. Movement in Working Capital
Inventory
Trade and other
receivables
Trade and other
payables
Total £’000 £’000 £’000 £’000 At 1 January 2014 246,220 307,822 (410,011) 144,031
Translation adjustment (5,129) (4,322) 8,859 (592) Interest accrual and other movements - (328) (489) (817) Acquisitions through business combinations 7,958 9,285 (10,980) 6,263 Movement in 2014 857 (9,586) (13,075) (21,804)
At 31 December 2014 249,906 302,871 (425,696) 127,081
11. Interest-Bearing Loans, Borrowings and Net debt
31 Dec
2014
£’000
31 Dec
2013
£’000
Non-current liabilities
Bank loans 241,208 256,335
Loan notes - 12,546
Finance leases 3,097 3,729
Total non-current interest-bearing loans and borrowings 244,305 272,610
Current liabilities
Bank loans 1,190 812
Loan notes 12,861 12,615
Finance leases 371 436
Total current interest-bearing loans and borrowings 14,422 13,863
Derivatives-non current
Included in non-current assets - (835)
Included in non-current liabilities 44 -
Derivatives-current
Included in current assets (1,095) (835)
Included in current liabilities - 33
Total derivatives (1,051) (1,637)
Cash and cash equivalents (182,360) (151,099)
Net debt 75,316 133,737

25
11. Interest-Bearing Loans, Borrowings and Net debt (continued)
The fair value of financial assets and liabilities including their level in the fair value hierarchy is shown in the table below:
31 December 2014
31 December 2013
Total Level 2
Total Level 2
£’000 £’000
Assets measured at fair value
At fair value through profit or loss
Cross currency interest rate swaps (1,095) (1,670)
Liabilities measured at fair value
Designated as hedging instruments
Interest rate swaps 44 33
Liabilities not measured at fair value
Liabilities at amortised cost
Bank loans 242,398 257,147
Finance leases 3,468 4,165
2005 unsecured senior US dollar loan notes 12,714 24,761
258,580 286,073
Financial assets and liabilities recognised at amortised cost
Except as detailed above, it is considered that the carrying amounts of financial assets and liabilities including trade
payables, trade receivables, net debt and deferred consideration which are recognised at amortised cost in the financial
statements approximate to their fair values.
Financial assets and liabilities carried at fair value
Fair value measurements are categorised into different levels in the fair value hierarchy based on the inputs to valuation
techniques used. The different levels are defined in Note 20 to the Group’s 2013 Annual Report together with the method
for determining the fair value of financial assets and liabilities. All of the Group’s financial assets and liabilities which are
carried at fair value are classified as Level 2 in the fair value hierarchy. There have been no transfers between levels in the
current year.
Investment properties and properties held for sale
Investment properties of £20.5 million which are separately classified in non-current assets are carried at fair value in the financial statements. An internal review undertaken by the Group Property Director was used to determine fair values. The valuation techniques used were the market value of comparable transactions recently completed or on the market. In cases where there are no recent precedent transactions, valuations were based on estimated rental yields and consultations with external agents who have knowledge of local property markets. The carrying value of properties held for sale of £9.6 million are shown in the balance sheet at the lower of their carrying
amount and fair value less any disposal costs. Eight properties are included at a fair value of £3.2 million and have been
valued on the basis set out in the foregoing paragraph.

26
12. Reconciliation of Net Cash Flow to Movement in Net Debt
31 Dec
2014
£’000
31 Dec
2013
£’000
Net increase in cash and cash equivalents 32,081 21,993
Net movement in derivative financial instruments 309 1,091
Cash-flow from movement in debt and lease financing 12,991 11,569
Change in net debt resulting from cash flows 45,381 34,653
Finance leases acquired with subsidiary undertakings - -
Bank loans and loan notes acquired with subsidiary
undertakings
-
-
Translation adjustment 13,040 (3,506)
Movement in net debt in the year 58,421 31,147
Net debt at 1 January (133,737) (164,884)
Net debt at end of the year (75,316) (133,737)
Gearing 8% 15%
13. Retirement Benefits
The principal financial assumptions employed in the valuation of the Group’s defined benefit scheme
liabilities for the current and prior year were as follows:
Irish Schemes UK Schemes
At 31 Dec 2014
At 31 Dec 2013
At 31 Dec 2014
At 31 Dec 2013
% % % %
Rate of increase in salaries 2.50%* 3.00%* 0.0% 0.0%
Rate of increase of pensions
in payment
-
-
3.30%
3.70%
Discount rate 2.10% 3.65% 3.60% 4.65%
Inflation 1.30% 2.00% 3.30%** 3.70%**
*2.5% applies from 2 January 2019 (31 December 2013: 3.0% from 2 January 2019)
** The inflation assumption shown for the UK is based on the Retail Price Index (RPI)

27
13. Retirement Benefits (continued) The following table provides a reconciliation of the scheme assets (at bid value) and the actuarial value of
scheme liabilities: Assets Liabilities Net asset/(deficit)
Year to
31 Dec
Year to
31 Dec
Year to
31 Dec
Year to
31 Dec
Year to
31 Dec
Year to 31
Dec
2014 2013 2014 2013 2014 2013
£’000 £’000 £’000 £’000 £’000 £’000
At 1 January 180,663 176,729 (187,785) (228,120) (7,122) (51,391)
Acquired in year 223 - (490) - (267) -
Interest income on plan assets 7,503 7,128 - - 7,503 7,128
Contributions by employer 3,023 6,029 - - 3,023 6,029
Contributions by members 1,199 1,329 (1,199) (1,329) - -
Benefit payments (5,549) (27,852) 5,549 27,852 - -
Current service cost - - (1,703) (2,253) (1,703) (2,253)
Past service credit - non-recurring - - - 18,534 - 18,534
Past service credit - - 542 552 542 552
Settlement gain - non-recurring - - - 16,932 - 16,932
Settlement gain - other - - - 84 - 84
Curtailment loss - - - (92) - (92)
Interest cost on scheme liabilities - - (7,747) (8,531) (7,747) (8,531)
Remeasurements
Actuarial gains/(loss) from:
-experience variations - - (86) (55) (86) (55)
-financial assumptions - - (38,859) (8,821) (38,859) (8,821)
-demographic assumptions - - 3,271 1,054 3,271 1,054
Return on plan assets excluding
interest income
7,620
15,264
-
-
7,620
15,264
Translation adjustment (5,479) 2,036 6,344 (3,592) 865 (1,556)
At 31 Dec 189,203 180,663 (222,163) (187,785) (32,960) (7,122)
Related deferred tax asset (net) 5,345 836
Net pension liability (27,615) (6,286)
The net pension scheme deficit of £32,960,000 is shown in the Group balance sheet as retirement benefit
obligations (non-current liabilities) of £33,085,000 of which £18,113,000 relates to the Euro schemes and
£14,972,000 relates to one UK scheme and retirement benefit assets (non-current assets) of £125,000 relating
to a second UK scheme.
28
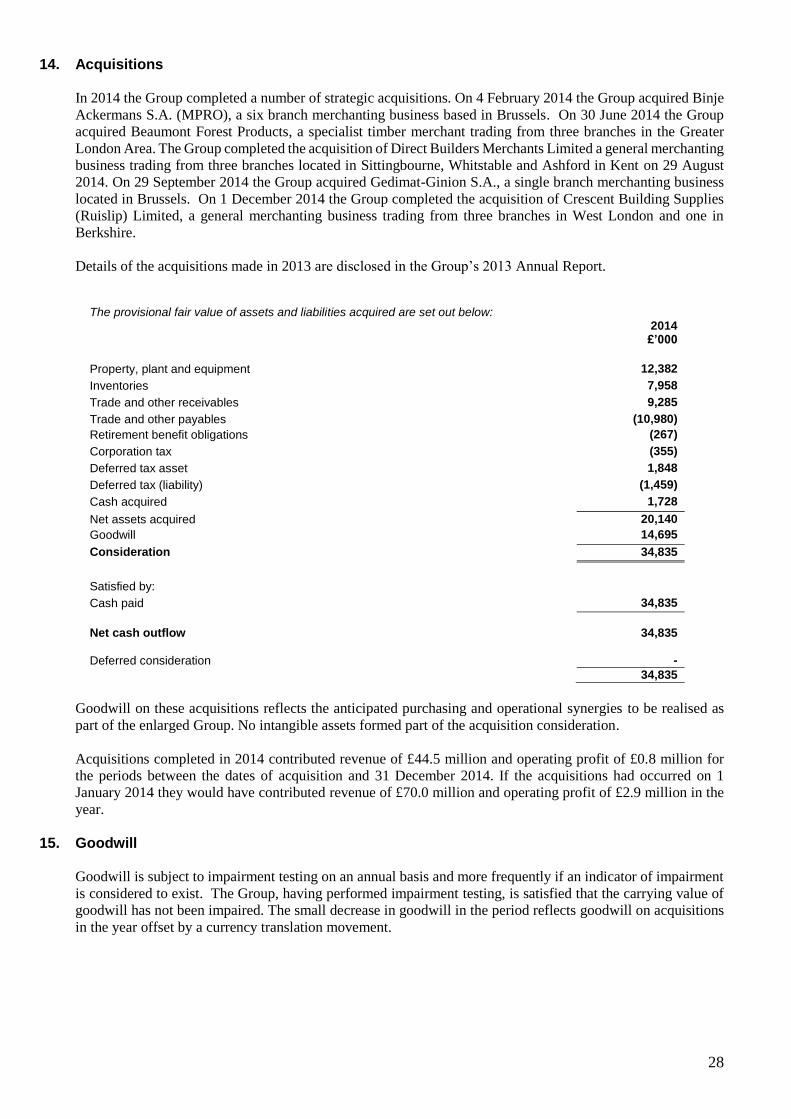
14. Acquisitions In 2014 the Group completed a number of strategic acquisitions. On 4 February 2014 the Group acquired Binje
Ackermans S.A. (MPRO), a six branch merchanting business based in Brussels. On 30 June 2014 the Group
acquired Beaumont Forest Products, a specialist timber merchant trading from three branches in the Greater
London Area. The Group completed the acquisition of Direct Builders Merchants Limited a general merchanting
business trading from three branches located in Sittingbourne, Whitstable and Ashford in Kent on 29 August
2014. On 29 September 2014 the Group acquired Gedimat-Ginion S.A., a single branch merchanting business
located in Brussels. On 1 December 2014 the Group completed the acquisition of Crescent Building Supplies
(Ruislip) Limited, a general merchanting business trading from three branches in West London and one in
Berkshire.
Details of the acquisitions made in 2013 are disclosed in the Group’s 2013 Annual Report.
The provisional fair value of assets and liabilities acquired are set out below:
2014 £’000
Property, plant and equipment 12,382
Inventories 7,958
Trade and other receivables 9,285
Trade and other payables (10,980)
Retirement benefit obligations (267)
Corporation tax (355)
Deferred tax asset 1,848
Deferred tax (liability) (1,459)
Cash acquired 1,728
Net assets acquired 20,140
Goodwill 14,695
Consideration 34,835
Satisfied by:
Cash paid 34,835
Net cash outflow
34,835
Deferred consideration
-
34,835
Goodwill on these acquisitions reflects the anticipated purchasing and operational synergies to be realised as
part of the enlarged Group. No intangible assets formed part of the acquisition consideration.
Acquisitions completed in 2014 contributed revenue of £44.5 million and operating profit of £0.8 million for
the periods between the dates of acquisition and 31 December 2014. If the acquisitions had occurred on 1
January 2014 they would have contributed revenue of £70.0 million and operating profit of £2.9 million in the
year.
15. Goodwill
Goodwill is subject to impairment testing on an annual basis and more frequently if an indicator of impairment
is considered to exist. The Group, having performed impairment testing, is satisfied that the carrying value of
goodwill has not been impaired. The small decrease in goodwill in the period reflects goodwill on acquisitions
in the year offset by a currency translation movement.
29
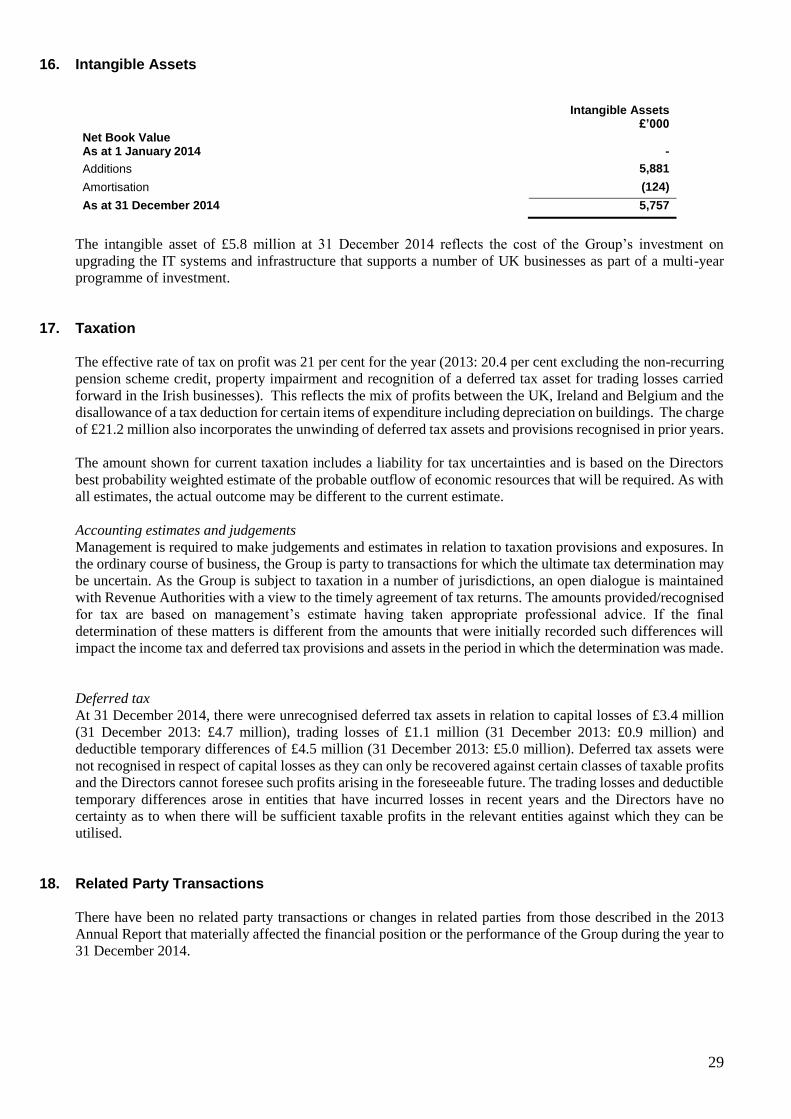
16. Intangible Assets
Intangible Assets
£’000 Net Book Value As at 1 January 2014 -
Additions 5,881
Amortisation (124)
As at 31 December 2014 5,757
The intangible asset of £5.8 million at 31 December 2014 reflects the cost of the Group’s investment on
upgrading the IT systems and infrastructure that supports a number of UK businesses as part of a multi-year
programme of investment.
17. Taxation The effective rate of tax on profit was 21 per cent for the year (2013: 20.4 per cent excluding the non-recurring
pension scheme credit, property impairment and recognition of a deferred tax asset for trading losses carried
forward in the Irish businesses). This reflects the mix of profits between the UK, Ireland and Belgium and the
disallowance of a tax deduction for certain items of expenditure including depreciation on buildings. The charge
of £21.2 million also incorporates the unwinding of deferred tax assets and provisions recognised in prior years.
The amount shown for current taxation includes a liability for tax uncertainties and is based on the Directors
best probability weighted estimate of the probable outflow of economic resources that will be required. As with
all estimates, the actual outcome may be different to the current estimate.
Accounting estimates and judgements
Management is required to make judgements and estimates in relation to taxation provisions and exposures. In
the ordinary course of business, the Group is party to transactions for which the ultimate tax determination may
be uncertain. As the Group is subject to taxation in a number of jurisdictions, an open dialogue is maintained
with Revenue Authorities with a view to the timely agreement of tax returns. The amounts provided/recognised
for tax are based on management’s estimate having taken appropriate professional advice. If the final
determination of these matters is different from the amounts that were initially recorded such differences will
impact the income tax and deferred tax provisions and assets in the period in which the determination was made.
Deferred tax
At 31 December 2014, there were unrecognised deferred tax assets in relation to capital losses of £3.4 million
(31 December 2013: £4.7 million), trading losses of £1.1 million (31 December 2013: £0.9 million) and
deductible temporary differences of £4.5 million (31 December 2013: £5.0 million). Deferred tax assets were
not recognised in respect of capital losses as they can only be recovered against certain classes of taxable profits
and the Directors cannot foresee such profits arising in the foreseeable future. The trading losses and deductible
temporary differences arose in entities that have incurred losses in recent years and the Directors have no
certainty as to when there will be sufficient taxable profits in the relevant entities against which they can be
utilised.
18. Related Party Transactions There have been no related party transactions or changes in related parties from those described in the 2013
Annual Report that materially affected the financial position or the performance of the Group during the year to
31 December 2014.

30
19. Grafton Group plc Long Term Incentive Plan (LTIP) Share awards over 869,027 Grafton Units were made under the LTIP on 16 April 2014. The total fair value of
the awards is £4.8 million and this will be charged to the income statement over the vesting period of three
years. The 2013 Annual Report discloses details of the LTIP scheme.
20. Issue of Shares and SAYE Scheme During the year 137,818 Grafton Units were issued under the Grafton Group plc 2011 Long Term Incentive
Plan (LTIP) and a further 19,213 Grafton Units were issued under the Group’s Savings Related Share Option
Scheme (SAYE) to eligible UK employees.
Options over 811,565 Grafton units were issued on the 16 October 2014 pursuant to a new 2014 three year
saving contract under the Grafton Group (UK) plc Savings Related Share Option Scheme at a price of £5.97.
The total fair value of the options was £1.0 million and this will be charged to the Income Statement over the
three year vesting period.
21. Events after the Balance Sheet Date
The Group acquired TG Lynes Ltd on 27 February 2015. The purchase consideration of £23.0 million was
satisfied in cash on completion. TG Lynes reported revenue of £18.3 million and operating profit of £2.1 million
for the year ended 30 June 2014.
22. Board Approval This announcement was approved by the Board of Grafton Group plc on 9 March 2015.