Graduate Enrollment and Degrees - Council of …cgsnet.org/ckfinder/userfiles/files/Graduate...
78
Graduate Enrollment and Degrees: 2005 to 2015
Transcript of Graduate Enrollment and Degrees - Council of …cgsnet.org/ckfinder/userfiles/files/Graduate...

Graduate Enrollmentand Degrees:2005 to 2015

Graduate Enrollment and Degrees: 2005 to 2015
Hironao OkahanaKeonna Feaster
Jeff Allum
September 2016
The CGS/GRE Survey of Graduate Enrollment and Degrees is jointly sponsored by:

2 Council of Graduate Schools
The CGS/GRE Survey of Graduate Enrollment and Degrees is jointly sponsored by the Council of Graduate Schools (CGS) and the Graduate Record Examinations (GRE) Board. For more information about the survey or the survey reports, please contact:
Suggested citation:Okahana, H., Feaster, K., & Allum, J. (2016). Graduate enrollment and degrees: 2005 to 2015. Washington, DC: Council of Graduate Schools.
Copyright © 2016 Council of Graduate Schools, Washington, DC
ALL RIGHTS RESERVED. No part of this work covered by the copyright herein may be reproduced or used in any form by any means—graphic, electronic, or mechanical including photocopying, recording, taping, Web distribution, or information storage and retrieval systems—without the written permission of the Council of Graduate Schools, One Dupont Circle NW, Suite 230, Washington, DC 20036-1146.
Printed in the United States
Council of Graduate SchoolsOne Dupont Circle NW, Suite 230Washington, DC 20036-1146 www.cgsnet.org
Hironao Okahana(202) [email protected]
Graduate Record Examinations Program Educational Testing Service Rosedale Road Princeton, NJ 08541-6000 www.ets.org/gre
Carol A. Hawkes(609) [email protected]
Graduate Enrollment and Degrees: 2005 to 2015 3
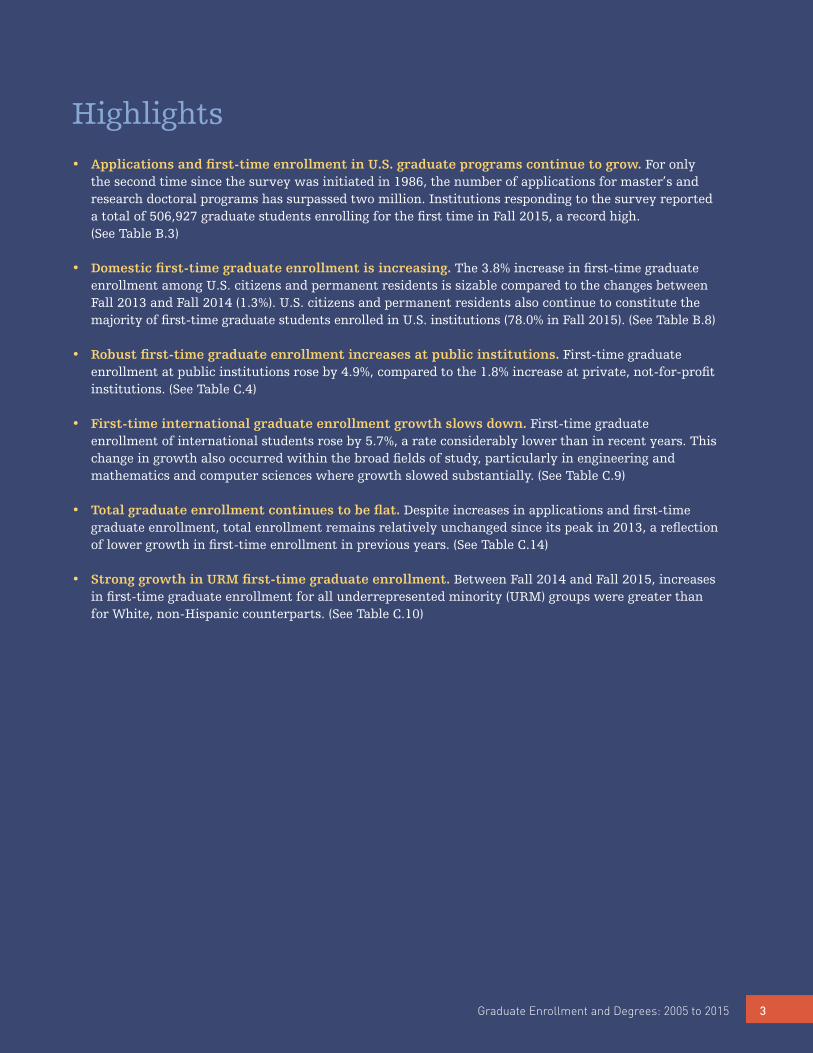
Highlights• Applications and first-time enrollment in U.S. graduate programs continue to grow. For only
the second time since the survey was initiated in 1986, the number of applications for master’s and research doctoral programs has surpassed two million. Institutions responding to the survey reported a total of 506,927 graduate students enrolling for the first time in Fall 2015, a record high. (See Table B.3)
• Domestic first-time graduate enrollment is increasing. The 3.8% increase in first-time graduate enrollment among U.S. citizens and permanent residents is sizable compared to the changes between Fall 2013 and Fall 2014 (1.3%). U.S. citizens and permanent residents also continue to constitute the majority of first-time graduate students enrolled in U.S. institutions (78.0% in Fall 2015). (See Table B.8)
• Robust first-time graduate enrollment increases at public institutions. First-time graduate enrollment at public institutions rose by 4.9%, compared to the 1.8% increase at private, not-for-profit institutions. (See Table C.4)
• First-time international graduate enrollment growth slows down. First-time graduate enrollment of international students rose by 5.7%, a rate considerably lower than in recent years. This change in growth also occurred within the broad fields of study, particularly in engineering and mathematics and computer sciences where growth slowed substantially. (See Table C.9)
• Total graduate enrollment continues to be flat. Despite increases in applications and first-time graduate enrollment, total enrollment remains relatively unchanged since its peak in 2013, a reflection of lower growth in first-time enrollment in previous years. (See Table C.14)
• Strong growth in URM first-time graduate enrollment. Between Fall 2014 and Fall 2015, increases in first-time graduate enrollment for all underrepresented minority (URM) groups were greater than for White, non-Hispanic counterparts. (See Table C.10)
4 Council of Graduate Schools
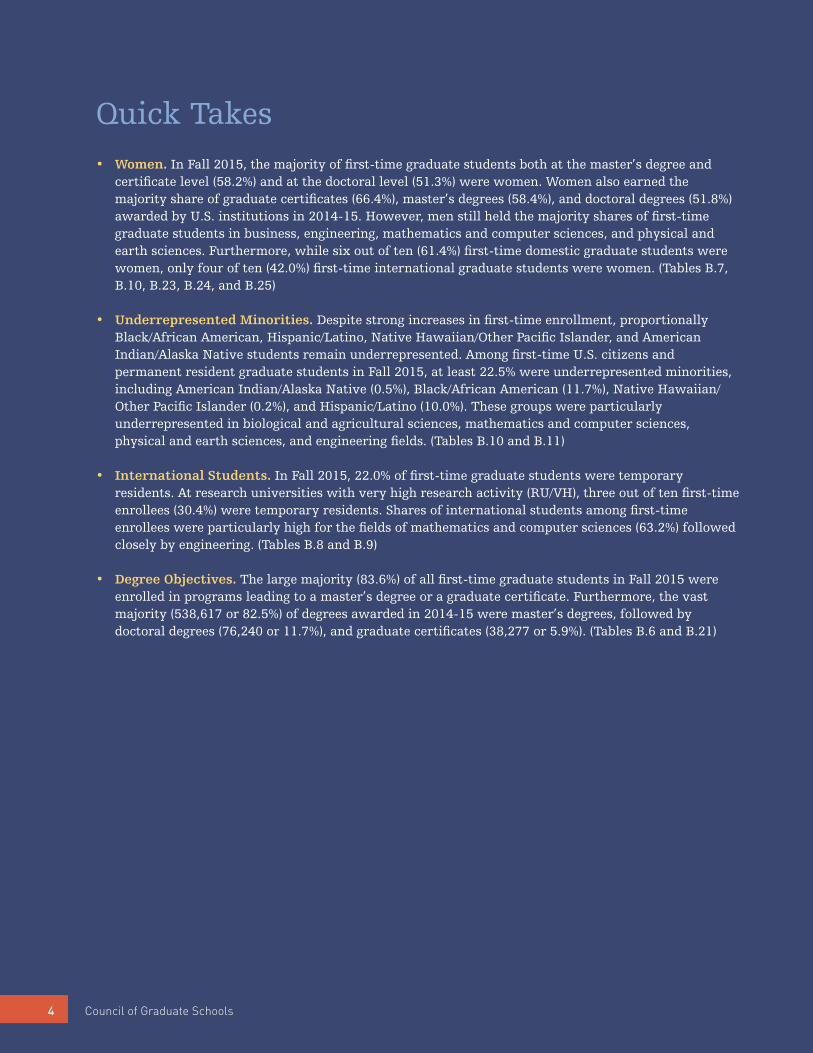
Quick Takes• Women. In Fall 2015, the majority of first-time graduate students both at the master’s degree and
certificate level (58.2%) and at the doctoral level (51.3%) were women. Women also earned the majority share of graduate certificates (66.4%), master’s degrees (58.4%), and doctoral degrees (51.8%) awarded by U.S. institutions in 2014-15. However, men still held the majority shares of first-time graduate students in business, engineering, mathematics and computer sciences, and physical and earth sciences. Furthermore, while six out of ten (61.4%) first-time domestic graduate students were women, only four of ten (42.0%) first-time international graduate students were women. (Tables B.7, B.10, B.23, B.24, and B.25)
• Underrepresented Minorities. Despite strong increases in first-time enrollment, proportionally Black/African American, Hispanic/Latino, Native Hawaiian/Other Pacific Islander, and American Indian/Alaska Native students remain underrepresented. Among first-time U.S. citizens and permanent resident graduate students in Fall 2015, at least 22.5% were underrepresented minorities, including American Indian/Alaska Native (0.5%), Black/African American (11.7%), Native Hawaiian/Other Pacific Islander (0.2%), and Hispanic/Latino (10.0%). These groups were particularly underrepresented in biological and agricultural sciences, mathematics and computer sciences, physical and earth sciences, and engineering fields. (Tables B.10 and B.11)
• International Students. In Fall 2015, 22.0% of first-time graduate students were temporary residents. At research universities with very high research activity (RU/VH), three out of ten first-time enrollees (30.4%) were temporary residents. Shares of international students among first-time enrollees were particularly high for the fields of mathematics and computer sciences (63.2%) followed closely by engineering. (Tables B.8 and B.9)
• Degree Objectives. The large majority (83.6%) of all first-time graduate students in Fall 2015 were enrolled in programs leading to a master’s degree or a graduate certificate. Furthermore, the vast majority (538,617 or 82.5%) of degrees awarded in 2014-15 were master’s degrees, followed by doctoral degrees (76,240 or 11.7%), and graduate certificates (38,277 or 5.9%). (Tables B.6 and B.21)

Graduate Enrollment and Degrees: 2005 to 2015 5
6
7
8
ContentsList of Figures
Introduction
Acknowledgments
Graduate Applications, Enrollment, and Degrees: Fall 2015 9
Graduate Applications 9
First-Time Graduate Enrollment 10
Total Graduate Enrollment 12
Graduate Certificates and Degrees Conferred 13
Trends in Graduate Applications, Enrollment, and Degrees: 2005 to 2015 15
Trends in Graduate Applications 15
Trends in First-Time Graduate Enrollment 16
Trends in Total Graduate Enrollment 18
Trends in Graduate Certificates and Degrees Conferred 18
Appendices
A. Definitions 21
B. Data Tables for Graduate Applications, First-Time Enrollment, 25
and Total Enrollment, Fall 2015; and Degrees Conferred, 2014-15
C. Data Tables for Trends in Graduate Applications, First-Time Enrollment, 45
Total Enrollment, and Degrees Conferred, 2005 to 2015
D. Taxonomy of Fields of Study 69
E. Survey Instrument 74
6 Council of Graduate Schools
List of FiguresFigure 1. Graduate Application Acceptance Rates by Carnegie Classification 9
and Degree Level, Fall 2015
Figure 2. First-Time Graduate Enrollment of Underrepresented Minority 10 Women by Broad Field of Study, Fall 2015
Figure 3. First-Time Graduate Enrollment by Broad Field and Gender, Fall 2015 11
Figure 4. First-Time Graduate Enrollment by Broad Field and Citizenship, Fall 2015 11
Figure 5. U.S. Citizen and Permanent Resident First-Time Graduate Enrollment by 12 Race/Ethnicity, Fall 2015
Figure 6. First-Time Graduate Enrollment of Underrepresented Minorities by 13 Carnegie Classification, Fall 2015
Figure 7. Trends in Graduate Applications by Carnegie Classification, 15 Fall 2005 to Fall 2015
Figure 8. Trends in First Time Graduate Enrollment, Fall 2005 to Fall 2015 17
Figure 9. Trends in First-Time Graduate Enrollment for Temporary Residents 17 in Engineering and Mathematics and Computer Sciences, Fall 2010 to Fall 2015
Figure 10. Trends in Total Graduate Enrollment, Fall 2005 to Fall 2015 18
Figure 11. Trends in Graduate Degrees Awarded by Level 19

Graduate Enrollment and Degrees: 2005 to 2015 7
Introduction
The CGS/GRE Survey of Graduate Enrollment and Degrees is jointly sponsored by the Council of Graduate Schools (CGS) and the Graduate Record Examinations (GRE) Board. Conducted annually since 1986, the survey is designed to provide information about applications for admission to graduate school, graduate student enrollment, and graduate degrees and certificates conferred. Both CGS and GRE believe that graduate education is a vital part of U.S. higher education and that providing an annual examination of trends in graduate applications, enrollment, and degrees by broad field of study, degree level, and demographics, is essential for understanding the graduate education enterprise.
The CGS/GRE Survey of Graduate Enrollment and Degrees is the only national survey that collects data on first-time and total graduate enrollment across all fields of master’s and research doctorate programs in the United States. It is also the only source of data on graduate enrollment by degree level (master’s versus research doctorate) and the only national survey that collects data on applications to graduate school by broad field of study.
The 2015 CGS/GRE Survey of Graduate Enrollment and Degrees was launched in November 2015 to the U.S.-based institutions that were members of theCouncil of Graduate Schools or one of the fourregional graduate school associations—theConference of Southern Graduate Schools (CSGS),the Midwestern Association of Graduate Schools(MAGS), the Northeastern Association of GraduateSchools (NAGS), and the Western Association ofGraduate Schools (WAGS). This year’s survey wassent to a total of 776 colleges and universities, anduseable responses were received from 617institutions, for an overall response rate of 80%.
This report begins by highlighting the findings with respect to the numbers of applications received from prospective graduate students for Fall 2015, first-time and total enrollment for Fall 2015, and the number of master’s and doctoral degrees and other post-baccalaureate certificates conferred during the 2014-15 academic year. Then, this report describes some of the one-year comparisons and five- and ten-year average annual changes along with some trend lines. Full data tables appear at the end of the report in Appendix B (Data Tables for Graduate Applications, First-Time Enrollment, and Total Enrollment, Fall 2015; and Degrees Conferred, 2014-15) and Appendix C (Data Tables for Trends in Graduate Applications, First-Time Enrollment, Total Enrollment, and Degrees Conferred, 2005-15). Other appendices include Appendix A (Definitions), Appendix D (Taxonomy of Fields of Study), and Appendix E (Survey Instrument).

8 Council of Graduate Schools
Acknowledgments
This report would not have been possible without the valuable contributions of many organizations and individuals. We would like to express our appreciation to ETS and the GRE program for ensuring the quality of the survey and the continuity of data. We particularly want to thank David Payne for his unwavering support of this effort, Dawn Piacentino for her overall direction of the project at ETS, and Carol Hawkes and Judy Lauter for their coordination of the data collection effort.
Thank you to Dr. Suzanne Ortega for her insights and guidance. We also want to recognize Laura Muncy of LetterSpace Creative, LLC for designing the layout and managing the publication process. Thanks to Anita Thomas for her assistance in preparing the tables and figures in this report, and K. Stone for copyediting help. Finally, thanks to themembers of the CGS Committee on Research andInformation Services for their ongoing interest in,and support of, the survey.
Last, and most importantly, a very special thanks goes to the graduate deans, institutional researchers, and other staff at the colleges and universities who completed the CGS/GRE Survey of Graduate Enrollment and Degrees this and every year. We are extremely grateful for the time and effort these and other persons gave to the survey project and report.

Graduate Enrollment and Degrees: 2005 to 2015 9
Graduate Applications, Enrollment, and Degrees: Fall 2015
More than 1.78 million graduate students were enrolled in graduate certificate, education specialist, master’s, or research doctoral programs at U.S. graduate schools in Fall 2015, according to institutions responding to the 2015 CGS/GRE Survey of Graduate Enrollment and Degrees. Although total graduate enrollment has only grown by 1.1% between Fall 2014 and Fall 2015, first-time graduate enrollment has increased by 3.9%. The number of applications received by responding institutions also rose by 1.2% between Fall 2014 and Fall 2015. Moreover, the 506,927 incoming graduate students for Fall 2015 set a new record for first-time enrollment. This section will highlight the state of graduate education with respect to applications for admission for Fall 2015, first-time and total enrollment in Fall 2015, and graduate degrees and certificates conferred in the 2014-15 academic year.
GRADUATE APPLICATIONSInstitutions responding to the 2015 CGS/GRE Survey of Graduate Enrollment and Degrees received a record 2.18 million applications for admission to graduate programs for study beginning in Fall 2015. Public institutions received more than 1.3 million applications for Fall 2015, while private, not-for-profit institutions received nearly 834,000 graduate applications for Fall 2015.
Acceptance rates for doctoral programs have traditionally been lower than acceptance rates for master’s/other programs, and results from the 2015 survey were generally consistent with this trend in graduate education. Overall, 21.9% of doctoral applicants and 48.2% of master’s/other applicants were accepted for admission. Private, not-for-profit institutions were generally more selective in terms of acceptance rates than public institutions. Doctoral programs at private, not-for-profit research universities with very high research activity (RU/VH) were most competitive with acceptance rates
of 14.0%. Master’s/other programs at these universities were also the most selective for master’s applicants with the acceptance rate of 38.8% (Table B.1 and Figure 1).
By broad field of study, the largest number of total applications for Fall 2015 were in engineering (321,521), business (267,433), and health sciences (266,228). Engineering, business, and health sciences accounted for 39.3% of all graduate applications for which the broad field of study was known. Among doctoral applicants only, social and behavioral sciences was the largest broad field, accounting for 122,702, or 18.7%, of all doctoral applications. The broad field of social and behavioral sciences (14.7%) was also the second most competitive field in terms of acceptance rates, trailing only business (13.4%). Business received the largest number of applications at the master’s/other level (245,262), closely followed by engineering (222,886). In terms of master’s acceptance rates, mathematics and computer sciences (37.3%) was most competitive, followed by arts and humanities (39.6%), health sciences (39.8%), engineering (40.0%), and physical and earth sciences (40.6%) (Table B.2).
Figure 1. Graduate Application Acceptance Rates by Carnegie Classification and Degree Level, Fall 2015
Source: 2015 CGS/GRE Survey of Graduate Enrollment and Degrees, Table B.1

10 Council of Graduate Schools
FIRST-TIME GRADUATE ENROLLMENT A total of 506,927 graduate students enrolled for the first time in graduate certificate, education specialist, master’s, or research doctoral programs in Fall 2015 at the institutions responding to the CGS/GRE Survey of Graduate Enrollment and Degrees. About six out of ten (63.0%) first-time graduate students were enrolled at public institutions in Fall 2015, and about one-third (33.5%) were enrolled at private, not-for-profit institutions (Table B.3). The remaining graduate students wereenrolled for the first-time at private, for-profitinstitutions.
At the institutions responding to the survey, over one-half of first-time graduate students (57.2%) were women and over two-thirds (68.4%) of all first-time graduate students, both men and women,
were enrolled full-time in Fall 2015. First-time, full-time graduate enrollment was the highest at private, not-for-profit research universities with very high research activity (RU/VH) (84.1%). The first-time, part-time graduate enrollment was the highest at public master’s focused universities (49.7%) (Table B.3).
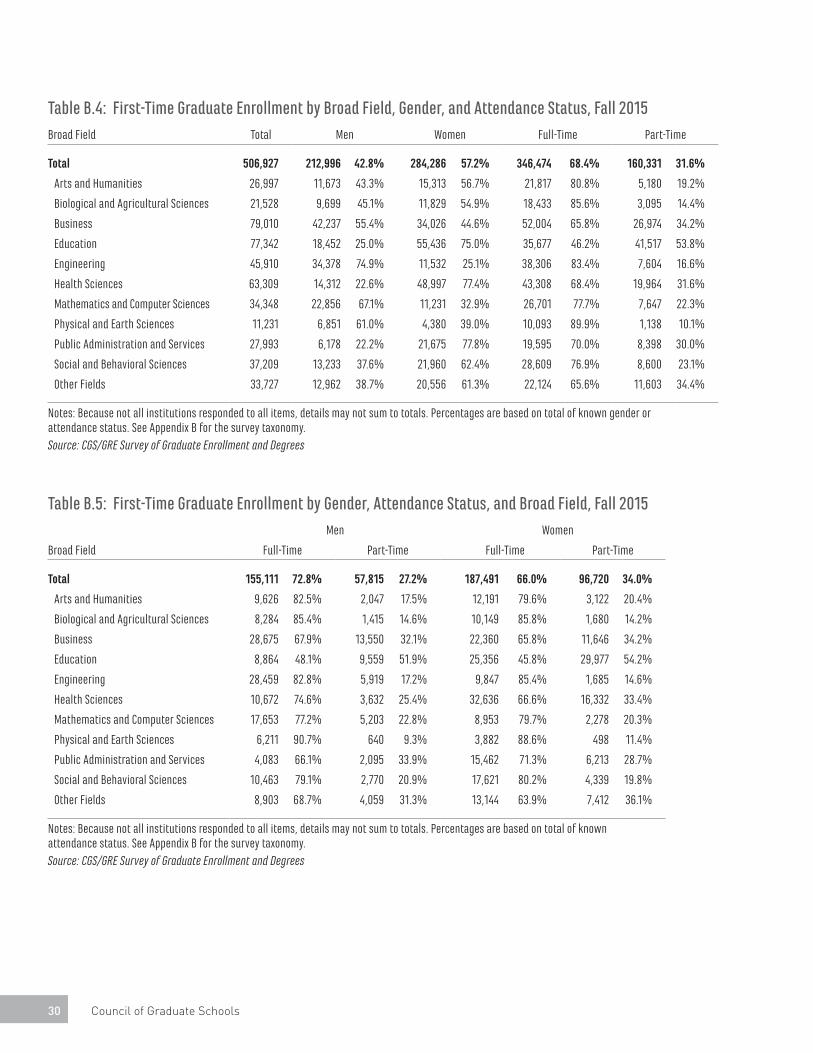
Consistent with previous surveys, business (79,010), education (77,342), and health sciences (63,309) were the three largest broad fields of study in Fall 2015, in terms of first-time graduate enrollment. These three broad fields collectively represented 43.3% of first-time graduate enrollments. Institutions responding to the survey also reported that while women constitute roughly three-quarters of first-time graduate enrollment in the fields of public administration and services (77.8%), health sciences (77.4%), and education (75.0%) in Fall 2015, they comprised much smaller portions of first-time enrollment in the fields of engineering (25.1%), mathematics and computer sciences (32.9%), and physical and earth sciences (39.0%) (Table B.4 and Figure 3).
The broad fields of business, education, and health sciences were also more likely than other fields to enroll part-time students. One-half (53.8%) of first-time graduate students in education, 34.2% of first-time graduate students in business, and 31.6% of first-time graduate students in health sciences enrolled part time (Table B.4). Overall, among first-
Figure 2. First-Time Graduate Enrollment of Underrepresented Minority Women by Broad Field of Study, Fall 2015
Source: 2015 CGS/GRE Survey of Graduate Enrollment and Degrees, Tables B.9 and B.10
NOTABLE: URM Women Report Robust Presence in U.S. Graduate EducationOver one-half (57.2%) of all U.S. citizens and permanent residents enrolled for the first time as graduate students were women, and their presence was particularly robust among Black/African Americans (69.1%), American Indian/Alaska Native (63.6%), Hispanic/Latino (63.1%), and Native Hawaiian/Other Pacific Islanders (59.9%). The combined share of women among first-time underrepresented minority (URM) graduate students (66.2%) was greater than that among White, non-Hispanic (60.6%), Asian (55.5%), and international (42.0%) students. (Figure 2)
In some fields, URM women were particularly well represented compared to non-URM women. For example, in the field of business underrepresented minority women accounted for more than half (52.7%) of all first-time enrollees compared to 39.7% of White, non-Hispanics and 44.7% of Asian students. The same trend holds true for other broad fields of study including public and administrative services and social and behavioral sciences.
Shares of women enrolled for the first time in most science, engineering, technology, and mathematics (STEM) fields remain relatively low. However, URM women are better represented vis-à-vis their male peers in biological & agricultural sciences (58.7%), physical & earth sciences (41.7%), mathematics & computer sciences (34.6%), and engineering (27.0%) than they are among White, non-Hispanic students.
These results indicate encouraging trends for participation of URM women in STEM fields. However the overall representation of women and the continued overall underrepresentation of Black/African American, Hispanic/Latino, American Indian/Alaska Na-tive students in STEM, especially URM males, is highly problematic.

Graduate Enrollment and Degrees: 2005 to 2015 11
time enrollees in Fall 2015, men were more likely to be enrolled full time than women (72.8% and 66.0% respectively). However, a higher percentage of women than men were enrolled full time in biological and agricultural sciences, engineering, mathematics and computer sciences, public administration and services, and social and behavioral sciences (Table B.5).
The large majority (83.6%) of all first-time graduate students in Fall 2015 were enrolled in programs leading to a master’s degree or a graduate certificate. First-time graduate certificate and master’s degree enrollment was particularly high in the broad fields of public administration and services (96.7%) and business (94.7%). In contrast, the majority (60.2%) of first-time graduate enrollment in physical and earth sciences was in doctoral programs (Table B.6).
Roughly one-third (33.4%) of all first-time students, for whom both field and level are known, were enrolled in master’s degree or graduate certificate programs in business (75,084) and education (66,817). At the doctoral level, the broad fields of health sciences (12,539), education (10,517), social and behavioral sciences (9,935), and engineering (9,474) were the largest, accounting for 51.1% of all first-time doctoral students (Table B.6).
In Fall 2015, women comprised a larger share of first-time enrollees at the master’s degree and graduate certificate level (58.2%) than at the doctoral level (51.3%); however, in business, engineering, mathematics and computer sciences, and physical and earth sciences, men comprised a larger share of first-time enrollees both at the master’s degree and graduate certificate level and doctoral level (Table B.7).
Consistent with past surveys, U.S. citizens and permanent residents constituted the majority of first-time graduate enrollments. Specifically among first-time graduate enrollees for whom citizenship was known, in Fall 2015 , 78.0% were U.S. citizens and permanent residents and 22.0% were temporary residents. The share of temporary residents among first-time graduate students was higher at private, not-for-profit universities (24.5%) than at public universities (21.4%). The share of temporary residents among full-time graduate students was the highest at research universities with very high
research activity (RU/VH) with 30.4% (Table B.8). Temporary residents comprised the largest share of first-time graduate students in mathematics and computer sciences (63.2%) followed closely by engineering (58.5%). The share of temporary residents was smallest in public administration and services (4.3%), education (4.3%), and health sciences (5.5%) (Table B.9 and Figure 4). While 61.4% of first-time graduate enrollees who were U.S. citizens and permanent residents were women, 42.0% of first-time graduate enrollees who were temporary residents were women (Table B.10).
Figure 3. First-Time Graduate Enrollment by Broad Field and Gender, Fall 2015
Source: 2015 CGS/GRE Survey of Graduate Enrollment and Degrees, Table B.4
Figure 4. First-Time Graduate Enrollment by Broad Field and Citizenship, Fall 2015
Source: 2015 CGS/GRE Survey of Graduate Enrollment and Degrees, Table B.9

12 Council of Graduate Schools
Despite strong increases in first-time graduate enrollment, the share of underrepresented minorities (URM) among U.S. citizens and permanent residents was similar to previous years. In Fall 2015, at least 22.5% of all first-time U.S. citizens and permanent resident enrollees were URM students, including American Indian/Alaska Native (0.5%), Black/African American (11.8%), Native Hawaiian/Other Pacific Islander (0.2%), and Hispanic/Latino (10.0%) (Table B.10 and Figure 5).
American Indian/Alaska Native, Black/African American, and Hispanic/Latino first-time graduate students were particularly underrepresented in biological and agricultural sciences, mathematics and computer sciences, physical and earth sciences, and engineering fields while being overrepresented in public administration and services. For example, 3.2% of those enrolled for the first time in physical and earth sciences were Black/African American students, compared to 17.9% of those enrolled in public administration and services. While Asian first-time enrollees were underrepresented in education fields, they were well represented in mathematics and computer sciences (Table B.11). Tables B.3 to B.11 provide additional details regarding first-time graduate enrollment for Fall 2015.
TOTAL GRADUATE ENROLLMENTInstitutions responding to the CGS/GRE survey enrolled a total of more than 1.78 million students in graduate certificate, education specialist, master’s, or doctoral programs in Fall 2015. About one-quarter (27.8%) of these were enrolled at public universities with very high research activity (RU/
VH). Six out of ten (61.9%) graduate students were enrolled at public institutions in Fall 2015. Three out of ten (32.0%) were enrolled at private, not-for-profit institutions in Fall 2015, and 6.1% were enrolled at private, for-profit institutions (Table B.12).
More than one-half (57.4%) of total graduate enrollment in Fall 2015 were women (Table B.12). Nearly three-quarters (73.5%) of total graduate enrollment was in master’s programs, while 26.5% was in doctoral programs (Table B.15). Business, education, and health sciences constitute 42.4% of total enrollment in Fall 2015. Temporary residents constitute 18.9% of total enrollment, compared with U.S. citizens and permanent residents, who constitute 81.1% (Table B.18). Complete details of total enrollment findings by institution type, gender, attendance status, broad field, degree level, citizenship, and race/ethnicity appear in Tables B.12 to B.20.
GRADUATE CERTIFICATES AND DEGREES CONFERREDInstitutions responding to the CGS/GRE Survey of Graduate Enrollment and Degrees awarded a total of 653,134 graduate certificates and degrees in the academic year 2014-15 (July 1, 2014 through June 30, 2015). The largest component of the graduate education enterprise was master’s education. The vast majority (538,617 or 82.5%) of degrees awarded in 2014-15 were master’s degrees, followed by doctoral degrees (76,240 or 11.7%), and graduate certificates (38,277 or 5.9%) (Table B.21).
At the doctoral level, public institutions awarded nearly two-thirds (65.1%) of all degrees awarded in 2014-15; private, not-for-profit institutions awarded 31.3% of all degrees; and private, for-profit institutions awarded 3.5% of all doctoral degrees. At the master’s level, 60.1% of all degrees were awarded by public institutions; 34.5% by private, not-for-profit institutions; and 5.4% by private, for-profit institutions. At the graduate certificate level, 57.0% were awarded by public institutions; 37.8% by private, not-for-profit institutions; and 5.2% by private, for-profit institutions. Also, approximately four out of ten graduate certificates (41.8%) were awarded by either master’s colleges and universities or other universities (Table B.21).
Figure 5. U.S. Citizen and Permanent Resident First-Time Graduate Enrollment by Race/Ethnicity, Fall 2015
Source: 2015 CGS/GRE Survey of Graduate Enrollment and Degrees, Table B.11

Graduate Enrollment and Degrees: 2005 to 2015 13
By field of study, health sciences accounted for the largest number of doctoral degrees awarded in 2014-15, with 18.4% of the total, followed by engineering (14.0%), education (13.1%), social and behavioral sciences (12.9%), and biological and agricultural sciences (12.2%). At the master’s degree level, business and education were the largest broad fields of degrees awarded, accounting for 21.3% and 20.1% respectively. While over one-third of degree recipients in biological and agricultural sciences (33.2%) and physical and earth sciences (41.6%) were awarded doctoral degrees, more than nine out of ten degree recipients in business (94.5%) and public administration and services (95.8%) were awarded master’s degrees. Of the broad fields in this report, ‘other’ fields (9.6%) and education fields (8.9%) had the highest ratios of certificates awarded among all degrees conferred in 2014-15 (Table B.22).
The academic year 2014-15 marked the seventh consecutive year in which women earned the majority of the degrees awarded at the doctoral level. Women earned 66.4% of the graduate certificates awarded in 2014-15, 58.4% of the master’s degrees, and 51.8% of the doctorates. The majority of graduate degrees and certificates awarded to women were in arts and humanities, biological and agricultural sciences, education, health sciences, public administration and services, social and behavioral sciences, and ‘other’ fields, as
well as certificates in business (Tables B.23, B.24, and B.25).
Particularly notable at the doctoral level was the underrepresentation of women in science and engineering fields. Of those students who earned doctoral degrees in 2014-15, women only accounted for 23.8% in engineering, 29.4% in mathematics and computer sciences, and 35.2% in physical and earth sciences.
Figure 6. First-Time Graduate Enrollment of Underrepresented Minorities by Carnegie Classification, Fall 2015
Source: 2015 CGS/GRE Survey of Graduate Enrollment and Degrees, Tables B.8 and B.11
NOTABLE: URM Graduate Students still Underrepresented at Research Universities with Very High Research Activity In the 2015 CGS/GRE Survey of Graduate Enrollment and Degrees, the plurality of all first-time graduate students (40.3%) was enrolled at Research Universities with Very High Research Activities (RU/VH). While a large share of Asian (51.9%) and interna-tional students (57.0%) enrolled for the first time at these institutions, only 28.4% of underrepresented minority (URM) first-time graduate students, including American Indian/Alaska Native, Black/African American, and Hispanic/Latino students did so. Racial/ethnic underrepresentation of graduate students at RU/VH institutions was particularly pronounced for Black/African American graduate students. Only one in four (24.4%) Black/African American students were enrolled for the first-time at RU/VH institutions compared with 38.6% of American Indian/Alaska Native, 33.4% of Native Hawaiian/Other Pacific Islander, and 32.3% of Hispanic/Latino students. This difference is significant because RU/VH institutions have the largest research infrastructure and often the greatest level of graduate student support.
In contrast, the largest proportion of URM first-time graduate students (29.0%) was enrolled at Doctoral/Research Universities. An additional 22% of URM first-time graduate students were enrolled at Master’s Colleges and Universities. (See Figure 6) Rela-tively higher representation of URM students in these two types of institutions may be because URM students are more likely to enroll in master’s programs and in fields that do not depend as heavily on extramural research funding.
Clearly fields such as education, public administration, nursing, and social work are important in the workforce and the nation. However, the underrepresentation of URM students at RU/VH universities still poses a concern for the graduate education commu-nity. First, these universities do not fully reap the educational benefits of a diverse student body and it suggests increasing URM STEM participation remains a significant challenge.

14 Council of Graduate Schools
Graduate Enrollment and Degrees: 2005 to 2015 15
For the fourth consecutive year, institutions responding to the CGS/GRE Survey of Graduate Enrollment and Degrees reported an increase in first-time enrollment. At 3.9%, the one-year increase in first-time graduate enrollment between Fall 2014 and Fall 2015 is the second largest since 2009. First-time enrollment is particularly robust among U.S. citizens and permanent residents. This section presents one-year comparisons; five- and ten-year average annual changes; and selected trends in graduate applications, first-time and total enrollment, and degrees conferred from universities that reported every time period to control for year-to-year changes in participation. The findings are presented by broad field, degree level, institution type, 2010 Carnegie classification, attendance status, gender, race/ethnicity, and citizenship status.
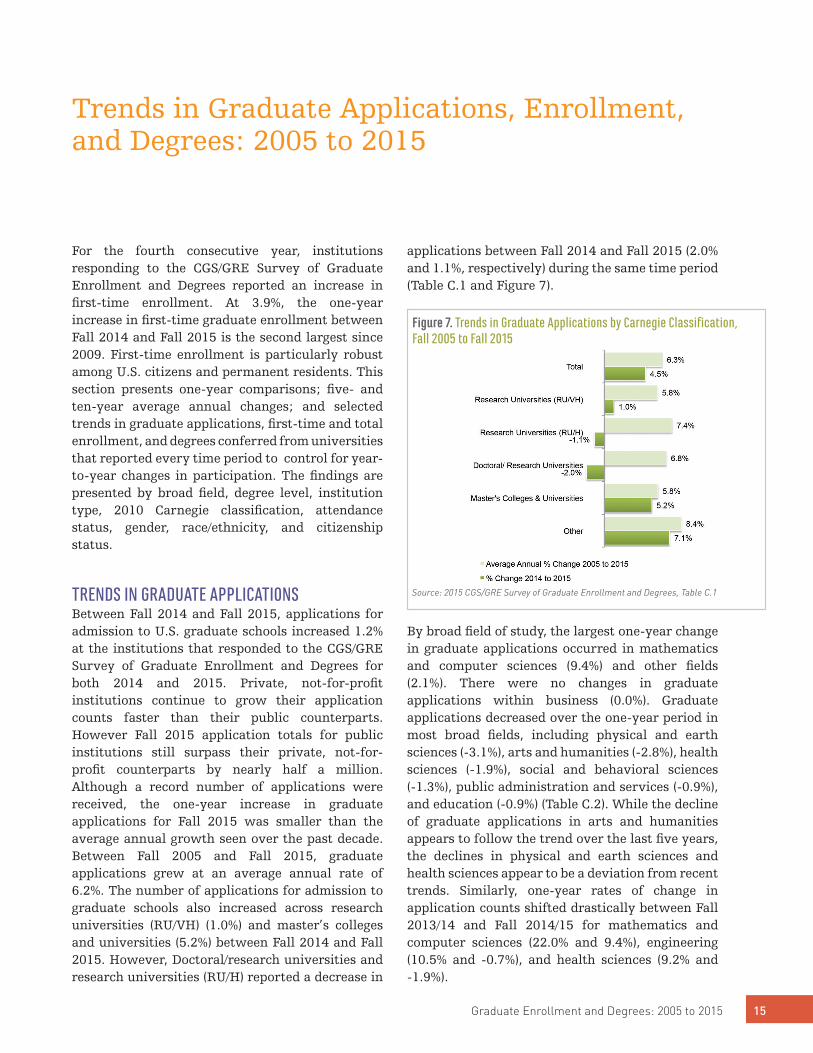
TRENDS IN GRADUATE APPLICATIONSBetween Fall 2014 and Fall 2015, applications for admission to U.S. graduate schools increased 1.2% at the institutions that responded to the CGS/GRE Survey of Graduate Enrollment and Degrees for both 2014 and 2015. Private, not-for-profit institutions continue to grow their application counts faster than their public counterparts. However Fall 2015 application totals for public institutions still surpass their private, not-for-profit counterparts by nearly half a million. Although a record number of applications were received, the one-year increase in graduate applications for Fall 2015 was smaller than the average annual growth seen over the past decade. Between Fall 2005 and Fall 2015, graduate applications grew at an average annual rate of 6.2%. The number of applications for admission to graduate schools also increased across research universities (RU/VH) (1.0%) and master’s colleges and universities (5.2%) between Fall 2014 and Fall 2015. However, Doctoral/research universities and research universities (RU/H) reported a decrease in
applications between Fall 2014 and Fall 2015 (2.0% and 1.1%, respectively) during the same time period (Table C.1 and Figure 7).
By broad field of study, the largest one-year change in graduate applications occurred in mathematics and computer sciences (9.4%) and other fields (2.1%). There were no changes in graduate applications within business (0.0%). Graduate applications decreased over the one-year period in most broad fields, including physical and earth sciences (-3.1%), arts and humanities (-2.8%), health sciences (-1.9%), social and behavioral sciences (-1.3%), public administration and services (-0.9%), and education (-0.9%) (Table C.2). While the decline of graduate applications in arts and humanities appears to follow the trend over the last five years, the declines in physical and earth sciences and health sciences appear to be a deviation from recent trends. Similarly, one-year rates of change in application counts shifted drastically between Fall 2013/14 and Fall 2014/15 for mathematics and computer sciences (22.0% and 9.4%), engineering (10.5% and -0.7%), and health sciences (9.2% and -1.9%).
Trends in Graduate Applications, Enrollment, and Degrees: 2005 to 2015
Figure 7. Trends in Graduate Applications by Carnegie Classification, Fall 2005 to Fall 2015
Source: 2015 CGS/GRE Survey of Graduate Enrollment and Degrees, Table C.1

16 Council of Graduate Schools
Applications for admission decreased for doctoral programs (-4.3%) and increased for master’s/other programs (3.8%) between Fall 2014 and Fall 2015. The decline in doctoral applications appears to be sizeable; however, the five-year average annual rate of change in doctoral applications between Fall 2010 and Fall 2015 remained 0.2%. Thus, whether this year’s drop in doctoral applications will become a trend or not remains to be seen. At the doctoral level, education (4.0%) had the largest one-year increase of all broad fields of study. This was a considerable improvement compared to its five-year average annual rate of change (1.6%). At the master’s/other level, mathematics and computer sciences (11.2%) reported the highest one-year percentage. For more detailed information about trends in graduate applications, see Tables C.1 to C.3.
TRENDS IN FIRST-TIME GRADUATE ENROLLMENTFirst-time graduate enrollment increased 3.9% between Fall 2014 and Fall 2015 at the institutions that responded to both the 2014 and 2015 CGS/GRE Surveys of Graduate Enrollment and Degrees. This marks the fourth consecutive year of increases in first-time graduate enrollment after declines in 2010 and 2011 and the highest rate of increase since 2009. The increase in first-time enrollment between Fall 2014 and Fall 2015 was greater at public institutions (4.9%) than it was for private, not-for-profit institutions (1.8%). By basic Carnegie classification, first-time graduate enrollment rose 4.4% at research universities with very high research activity (RU/VH), 5.8% at research universities with high research activity (RU/H), and 4.6% at doctoral/research universities. Master’s colleges and universities also increased their first-time graduate enrollment by 1.9% (Table C.4).
First-time graduate enrollment of temporary residents increased 5.7% between Fall 2014 and Fall 2015, a significantly slower rate of growth compared to the previous year, though five-year average annual increase (10.7%) and ten-year average annual increase (9.4%) rates remain high. By contrast, first-time graduate enrollment reported a 3.8% increase among U.S. citizens and permanent residents between Fall 2014 and Fall 2015, significantly higher than the prior year increase. This shift in the first-time enrollment of
domestic students is promising even as the five-year average (0.5%) and ten-year average (2.1%) annual increase rates remain low.
While the overall growth has been slower for temporary residents compared to the prior year, all underrepresented minority groups experienced larger increases in first-time graduate enrollment than the prior year. Between Fall 2014 and Fall 2015, first-time enrollment increased 7.6% among Hispanics/Latinos, 6.6% among Black/African Americans, 4.6% among Asians/Pacific Islanders, and 3.4% among American Indian/Alaska Natives. Most notably, the annual growth rates of first-time graduate enrollment between Fall 2014 and Fall 2015 improved sizably for American Indian/Alaska Native students and Black/African American students when compared against the data from the prior year. One-year rate of change in first-time graduate enrollment for each URM group was greater than their respective five-year and ten-year average percentage changes (Table C.5).
The increase in first-time graduate enrollment was greater for women (4.5%) than for men (3.1%) between Fall 2014 and Fall 2015. Among U.S. citizens and permanent residents, there was a 2.7% increase in first-time enrollment among men between Fall 2014 and Fall 2015, compared with a 4.5% increase among women. In contrast, among temporary residents, first-time graduate enrollment increased 5.2% for men and 6.4% for women between Fall 2014 and Fall 2015. For both men and women, one-year percent changes in first-time graduate enrollment exceeded their respective five-year average percentage changes. The only exception was for temporary residents. They reported one-year percent changes in first-time graduate enrollment, which are much lower than the five-year and ten-year average percentage changes (Table C.6).
Of the broad fields of study, ‘other’ fields (8.2%), which includes programs such as religion and theology and communications and journalism, reported the largest one-year gain in first-time graduate enrollment between Fall 2014 and Fall 2015. Compared to the one-year change between Fall 2013 and Fall 2014, this was a sizeable gain in the growth rate. Mathematics and computer sciences fields (7.3%) reported the second largest

Graduate Enrollment and Degrees: 2005 to 2015 17
gain in first-time graduate enrollment between Fall 2014 and Fall 2015; however, the rate of growth was substantially lower than what was reported in the prior year. Similarly, engineering fields reported slower growth in first-time graduate enrollment than the prior year. The one-year change in first-time graduate enrollment in engineering was 0.1%, compared to 10.7% between Fall 2013 and Fall 2014 (Table C.7). In the decade spanning 2005 to 2015, increases in first-time enrollments have been particularly strong in the fields of mathematics and computer sciences, health sciences, and engineering (Figure 8).
Among U.S. citizens and permanent residents, increases between Fall 2014 and Fall 2015 in first-time graduate enrollment were greater for Hispanics/Latinos (7.6%) than all other groups including Blacks/African Americans (6.6%), Asian/Pacific Islanders (4.6%), American Indian/Alaska Natives (3.4%), and Whites (2.8%) (Table C.10). In spite of strong one-year gains (3.4%), American Indian/Alaska Natives was the only race/ethnic population that experienced decreases in first-time enrollment over both a five-year (-1.0%) and a ten-year (-0.9%) time period. For more detailed information about changes and trends in first-time graduate enrollment, see Tables C.4 through C.13.
Figure 9. Trends in First-Time Graduate Enrollment for Temporary Residents in Engineering and Mathematics and Computer Sciences, Fall 2010 to Fall 2015
Source: CGS/GRE Survey of Graduate Enrollment and Degrees
Figure 8. Trends in First-Time Graduate Enrollment by Broad Field of Study, Fall 2005 to Fall 2015
Note: Trends were developed based upon institutions that provided data for all years 2005 to 2015; therefore, the numbers of first-time enrollments do not match data in the tables.
Source: CGS/GRE Survey of Graduate Enrollment and Degrees
NOTABLE: First-time International Graduate Enrollment Growth Slows Down.The 5.7% increase in first-time international graduate enrollment between Fall 2014 and Fall 2015 was considerably lower than recent years. For example, first-time international graduate student enrollment increased 11.2% between Fall 2013 and Fall 2014 (Allum & Okahana, 2015) and 11.5% between Fall 2012 and Fall 2013 (Allum, 2014). This slower rate of growth mirrors find-ings from the CGS 2015 International Graduate Admissions Survey: Preliminary Applications, which recorded a 5% increase in first-time international graduate student enrollment between Fall 2014 and Fall 2015 (Okahana & Allum, 2015). Though the rate of growth has slowed, more than one out of five first-time graduate students (22%) are international students. However, declines in the enrollment growth rates of international graduate students in engineering and mathematics & computer sciences were particularly notable. As shown in Figure 9, the one-year change in first-time graduate enrollment among international graduate students in these two fields dropped substantially after robust growth was reported over the last five years. It remains to be seen if this is an anomaly or the beginning of a new normal in the first-time graduate enrollment of international students. Thus, these two fields will be closely monitored in future surveys.
References:
Allum, J. (2014). Graduate enrollment and degrees: 2003 to 2013. Washington, DC: Council of Graduate Schools. Allum, J.R., Bell, N.E., & Sowell, R.S. (2012). Graduate enrollment and degrees: 2001 to 2011. Washington, DC: Council of Graduate Schools. Allum, J., & Okahana, H. (2015). Graduate enrollment and degrees: 2004 to 2014. Washington, DC: Council of Graduate Schools. Gonzales, L.M., Allum, J.R., & Sowell, R.S. (2013). Graduate enrollment and degrees: 2002 to 2012. Washington, DC: Council of Graduate Schools. Okahana, H., & Allum, J. (2015). International graduate admissions: Fall 2015. Washington, DC: Council of Graduate Schools.

18 Council of Graduate Schools
TRENDS IN TOTAL GRADUATE ENROLLMENTTotal graduate enrollment increased 1.1% between Fall 2014 and Fall 2015 at the institutions responding to the CGS/GRE Survey of Graduate Enrollment and Degrees for both 2014 and 2015 (Table C.14), the second increase in total enrollment since 2010. Over the one-year period, total graduate enrollment increased 2.4% at public institutions; 0.9% at private, not-for-profit institutions; and declined 10.9% at private, for-profit institutions. Between Fall 2010 and Fall 2015, total graduate enrollment decreased 0.4% annually on average. During the ten-year period between Fall 2005 and Fall 2015, total enrollment increased 1.1%. As depicted in Figure 10, total enrollment has steadily grown since 2011.
Between Fall 2014 and Fall 2015, the total graduate enrollment increased by 1.4% for U.S. citizens and permanent residents and by 6.1% for temporary residents (Table C.15). Total enrollment increased by 1.6% among men and 0.7% among women between Fall 2014 and Fall 2015 (Table C.16). Between Fall 2014 and Fall 2015, total enrollment increased 4.7% among Hispanic/Latinos, 3.0% among Asian/Pacific Islanders, and 7.2% among Black/African Americans. During the same time
period, total enrollment declined 2.5% for American Indian/Alaskan Natives (Table C.20).
The largest one-year change in total graduate enrollment by broad field of study between Fall 2014 and Fall 2015 was mathematics and computer sciences (9.0%). There was also strong growth in ‘other’ fields (4.0%), health sciences (3.4%), and engineering (2.2%). While health sciences (7.7%), mathematics and computer sciences (6.7%), and engineering (4.4%) reported the largest ten-year average annual changes in total enrollment between Fall 2005 and Fall 2015, ‘other’ fields (-1.3%) reported declines in the total enrollment. More detailed information about changes and trends in total graduate enrollment can be found in Tables C.14 through C.23.
TRENDS IN GRADUATE CERTIFICATES AND DEGREES CONFERREDThe number of doctoral degrees awarded increased 3.5% between 2013-14 and 2014-15 at institutions responding to the 2015 CGS/GRE Survey of Graduate Enrollment and Degrees. There was also a 0.5% increase in the number of master’s degrees awarded and a 3.5% increase in the number of graduate certificates awarded. In the decade spanning 2005 to 2015, the average annual change in doctoral degree production (5.3%) was higher than that of master’s degree production (2.4%) (Table C.24). Due to the fact that more master’s degrees are awarded than doctoral degrees, the production of master’s degrees continues to outpace the production of doctoral degrees (Figure 11).
Doctoral degree production was the strongest between Fall 2010 and Fall 2015 and over the ten- year period between Fall 2005 and Fall 2015 compared to master’s degree and graduate certificates. Over the one-year period between 2013-14 and 2014-15, doctoral degree production increased 4.6% at public institutions and by 2.5% at private, not-for-profit institutions. In the decade spanning 2004-05 to 2014-15, doctoral degree production increased 5.3% at public institutions and 4.7% at private, not-for-profit institutions (Table C.24).
At the doctoral level, degree production increased in ten of 11 broad fields of study between 2013-14
Figure 10. Trends in Total Graduate Enrollment, Fall 2005 to Fall 2015
Note: Trends were developed based upon institutions that provided data for all years 2005 to 2015; therefore, the numbers of total enrollments do not match the data in the tables.
Source: CGS/GRE Survey of Graduate Enrollment and Degrees

Graduate Enrollment and Degrees: 2005 to 2015 19
Figure 11. Trends in Graduate Degrees Awarded by Level
Note: Trends were developed based upon institutions that provided data for all years 2005 to 2015; therefore, the numbers of total degrees awarded do not match data in the tables.
Source: CGS/GRE Survey of Graduate Enrollment and Degrees
and 2014-15, with one-year changes ranging from a high of 13.7% (other fields) to a low of 0.1% (education). In the field of public administration and services, there was no change between 2014 and 2015. There was a decrease in doctoral production in mathematics and computer sciences (-3.5%). Growth in doctoral degree production was modest in business (6.2%), health sciences (5.6%), and engineering (3.3%) (Table C.30).
There was a 0.5% increase in master’s degree production between 2013-14 and 2014-15, a 1.1% average annual increase between 2009-10 and 2014-15, and a 2.4% average annual increase between 2004-05 and 2014-15. The average annual percent change for master’s degree production at public and private, not-for-profit institutions increased between the five- and ten-year intervals (Table C.24). There was more master’s degree production at private, not-for-profit institutions than at public institutions; the reverse was true for doctoral degree production.
The 0.5% increase in degree production at the master’s level between 2013-14 and 2014-15 was composed of increases in five broad fields of study and decreases in six others. The largest one-year increases in master’s degree production were in mathematics and computer sciences (40.5%), engineering (8.4%), and health sciences (3.7%), while education reported the largest decline in master’s degree production (-6.2%) (Table C.29). Additional information regarding changes and trends in graduate certificates and degrees awarded can be found in Tables C.24 through C.30.

20 Council of Graduate Schools

Graduate Enrollment and Degrees: 2005 to 2015 21
The CGS/GRE Survey of Graduate Enrollment and Degrees collects data on four aspects of graduate education:
Applications—Includes the number of completed applications for admission to U.S. graduate schools for the fall term, the number of those applications accepted for admission, and the number of applications not accepted. Data are collected by fine field and degree level (master’s and ‘other’ vs. doctoral). The applications data exclude individuals who applied as transfers or for readmission at the same institution.
First-Time Enrollment—Includes the number of students enrolled for the first time in graduate certificate, education specialist, master’s, or doctoral programs for the fall term. Data are collected by fine field, degree level (master’s and ‘other’ vs. doctoral), gender, race/ethnicity, citizenship, and enrollment status (full-time/part-time).
Total Enrollment—Includes the total number of students enrolled (first-time and continuing students) in graduate certificate, education specialist, master’s, or doctoral programs for the fall term. Data are collected by fine field, degree level (master’s and ‘other’ vs. doctoral), gender, race/ethnicity, citizenship, and enrollment status (full-time/part-time).
Degrees—Includes the number of master’s and doctoral degrees and post-baccalaureate and post-master’s certificates awarded in the U.S. in a given academic year (July 1 through June 30). Degree data are collected by fine field, degree level (graduate certificate, master’s, and doctoral), and gender. The survey does not collect degree data by race/ethnicity or citizenship.
For both first-time and total enrollment, master’s and ‘other’ enrollment is defined as the number of students enrolled in programs specifically leading
to the master’s degree and other non-doctoral programs, such as graduate certificate programs and education specialist programs. Graduate certificates are awards that require the completion of an organized program of study generally equivalent to 15 to 18 credit hours beyond the bachelor’s degree. Education specialist programs are generally equivalent to 30 to 45 credit hours beyond the master’s degree. Doctoral enrollment is defined as the number of students enrolled in programs leading directly to the doctoral degree as well as the total number of students enrolled in doctoral programs where a master’s degree is earned en route to the doctoral degree.
Full-time enrollment includes students enrolled for credit in graduate degree programs who are engaged full time in training activities in their field; these activities may embrace any appropriate combination of study, teaching, and research, depending on the responding institution’s own policy. Part-time enrollment includes students enrolled in graduate degree programs who are not pursuing graduate work full time as defined above.
The survey collects total data for each institution for the categories and variables listed above, as well as data for up to 51 individual fields of study. This report groups the data from the 51 fine fields of study into 11 broad fields. A special online report, Graduate Enrollment and Degrees by Fine Field, presents the fine field data for first-time enrollment, total enrollment, and degrees awarded and is available exclusively to CGS member institutions at www.cgsnet.org.
The survey excludes students applying to, enrolled in, or graduating from the following comprehensive list of first-professional programs: Chiropractic (D.C. or D.C.M.), Dentistry (D.D.S. or D.M.D.), Law (LL.B., J.D.), Medicine (M.D.), Optometry (O.D.), Osteopathic Medicine (D.O.), Pharmacy (Pharm.D.), Podiatry (D.P.M., D.P., or Pod.D.), Theology (M.Div.,
APPENDIX ADefinitions
22 Council of Graduate Schools
M.H.L., B.D., or Ordination), and Veterinary Medicine (D.V.M.). Data for all other graduate-level programs are collected, including programs in other professional fields such as health sciences and business.
The racial/ethnic data included in this report are collected from institutional records that are based on graduate students’ self-reports. Accordingly, the number of students in any given racial/ethnic category is subject to individual interpretation on the part of students as they complete registration forms. The citizenship and race/ethnicity categories are defined as follows:
Non-Resident Alien (Temporary Resident)—A person who is not a citizen, national, or permanent resident of the U.S. and who is in the country on a visa or temporary basis and does not have the right to remain indefinitely.
Hispanic/Latino—A U.S. citizen or permanent resident of Cuban, Mexican, Puerto Rican, South or Central American, or other Spanish culture or origin, regardless of race.
American Indian/Alaska Native—A U.S. citizen or permanent resident having origins in any of the original peoples of North and South America (including Central America) who maintains cultural identification through tribal affiliation or community recognition.
Asian—A U.S. citizen or permanent resident having origins in any of the original peoples of the Far East, Southeast Asia, or the Indian subcontinent, including, for example, Cambodia, China, India, Japan, Malaysia, Pakistan, the Philippines, South Korea, Thailand, and Vietnam.
Black/African American—A U.S. citizen or permanent resident having origins in any of the black racial groups of Africa (except those of Hispanic origin).
Native Hawaiian/Other Pacific Islander—A U.S. citizen, permanent resident, or national having origins in any of the original peoples of Hawaii, Guam, Samoa, or other Pacific islands.
White—A U.S. citizen or permanent resident having origins in any of the original peoples of Europe, North Africa, or the Middle East (except those of Hispanic origin).
Two or More Races—A U.S. citizen or permanent resident having origins in any two or more of the following race categories: American Indian/Alaska Native, Asian, Black/African American, Native Hawaiian/Other Pacific Islander, or White.
Race/Ethnicity Unknown—Includes U.S. citizens and permanent residents whose race/ethnicity is not known.
Citizenship Unknown—Includes individuals whose citizenship is not known.
Two significant changes to the race/ethnicity categories occurred starting with the 2010 data collection cycle. The first change divided the previous Asian/Pacific Islander category into two separate categories: Asian and Native Hawaiian/Other Pacific Islander. The second change split the previous Other/Unknown category into three separate categories: Two or More Races, Race/Ethnicity Unknown, and Citizenship Unknown. The findings regarding the current academic year are based on the new race/ethnicity categories. Readers of this report should not directly compare the figures in this report to those that appeared in editions of this report issued prior to 2010. Findings regarding changes and trends are aggregated to correspond with the earlier definitions of Asian/Pacific Islander and Other/Unknown to permit a comparable examination.
In some sections of this report, data are presented by Carnegie classification based on the 2010 Carnegie Classification of Institutions of Higher Education, using the “basic” classification. The 33 “basic” classification categories are aggregated to five categories in this report as follows:
Research Universities (very high research activity) (RU/VH)—Universities with very high research activity that award at least 20 doctorates per year.

Graduate Enrollment and Degrees: 2005 to 2015 23
Research Universities (high research activity) (RU/H)—Universities with high research activity that award at least 20 doctorates per year.
Doctoral/Research Universities—Other universities that award at least 20 doctorates per year.
Master’s Colleges and Universities—Institutions that award at least 50 master’s degrees and fewer than 20 doctorates per year.
Other—Includes baccalaureate institutions award-ing fewer than 50 master’s degrees or 20 doctorates per year, as well as institutions awarding graduate degrees where a high concentration of degrees is in a single field or set of related fields (e.g., theological seminaries, medical schools, health profession schools, schools of engineering, etc.).
Since the institutions responding to the survey differ slightly from year to year, the trend data are limited to only those institutions that responded to the CGS/GRE Survey of Graduate Enrollment and Degrees in those years being compared.
One-year Comparisons—One-year comparisons, which are reported as percentages, are based on data collected from only those institutions that responded to both the 2014 and 2015 surveys.
Five-year Average Annual Changes—Five-year average annual changes, which are reported as percentages, are based on data collected from only those institutions that responded to both the 2010 and 2015 surveys.
Ten-year Average Annual Changes—Ten-year average annual changes, which are reported as percentages, are based on data collected from only those institutions that responded to both the 2005 and 2015 surveys.
Trend Lines—Trend lines were constructed using data collected from only those institutions that responded to all surveys 2005 through 2015.
OTHER NOTESIn some cases, survey respondents were unable to provide data for one or more categories or variables. Thus, not all tables and figures in this report include data from all 617 institutions that responded to the 2015 CGS/GRE Survey of Graduate Enrollment and Degrees. Data were not imputed for missing fields or for non-responding institutions.
Due to the small numbers of for-profit institutions providing data on graduate applications and first-time graduate enrollment, their data are suppressed from this report. The total graduate enrollment and graduate certificates and degrees awarded for for-profit institutions are reported in this report; however, given the small number of institutions participating in this survey, the data may not be representative of the entire universe of for-profit institutions in the U.S.
ABOUT THE AUTHORSHironao Okahana, Assistant Vice President, Research & Policy Analysis
Keonna Feaster, Program Manager, Best Practices
Jeff Allum, Former Assistant Vice President, Research & Policy Analysis

24 Council of Graduate Schools

Graduate Enrollment and Degrees: 2005 to 2015 25
Table B.1 Applications for Admission to Graduate School by Institution Type, 27 Carnegie Classification, and Degree Level, Fall 2015
Table B.2 Applications for Admission to Graduate School by Broad Field and Degree Level, 28 Fall 2015
Table B.3 First-Time Graduate Enrollment by Institution Type, Carnegie Classification, Gender, 29 and Attendance Status, Fall 2015
Table B.4 First-Time Graduate Enrollment by Broad Field, Gender, and Attendance Status, 30 Fall 2015
Table B.5 First-Time Graduate Enrollment by Gender, Attendance Status, and Broad Field, 30 Fall 2015
Table B.6 First-Time Graduate Enrollment by Broad Field and Degree Level, Fall 2015 31
Table B.7 First-Time Graduate Enrollment by Degree Level, Gender, and Broad Field, Fall 2015 31
Table B.8 First-Time Graduate Enrollment by Institution Type, Carnegie Classification, 32 and Citizenship, Fall 2015
Table B.9 First-Time Graduate Enrollment by Broad Field and Citizenship, Fall 2015 32
Table B.10 First-Time Graduate Enrollment by Citizenship, Race/Ethnicity, and Gender, 33 Fall 2015
Table B.11 First-Time Graduate Enrollment by Broad Field and Race/Ethnicity, Fall 2015 34 (U.S. Citizens and Permanent Residents Only)
Table B.12 Total Graduate Enrollment by Institution Type, Carnegie Classification, Gender, 35 and Attendance Status, Fall 2015
Table B.13 Total Graduate Enrollment by Broad Field, Gender, and Attendance Status, Fall 2015 36
Table B.14 Total Graduate Enrollment by Gender, Attendance Status, and Broad Field, Fall 2015 36
Table B.15 Total Graduate Enrollment by Broad Field and Degree Level, Fall 2015 37
Table B.16 Total Graduate Enrollment by Degree Level, Gender, and Broad Field, Fall 2015 37
Table B.17 Total Graduate Enrollment by Institution Type, Carnegie Classification, and 38 Citizenship, Fall 2015
APPENDIX BData Tables for Graduate Applications, First-Time Enrollment, Total Enrollment, Fall 2015; and Degrees Conferred, 2014-15

26 Council of Graduate Schools
Table B.18 Total Graduate Enrollment by Broad Field and Citizenship, Fall 2015 38
Table B.19 Total Graduate Enrollment by Citizenship, Race/Ethnicity, and Gender, Fall 2015 39
Table B.20 Total Graduate Enrollment by Broad Field and Race/Ethnicity, Fall 2015 40 (U.S. Citizens and Permanent Residents Only)
Table B.21 Graduate Degrees and Certificates Awarded by Degree Level, 41 Carnegie Classification, and Institution Type, 2014-15
Table B.22 Graduate Degrees and Certificates Awarded by Degree Level and Broad Field, 42 2014-15
Table B.23 Graduate Certificates Awarded by Broad Field and Gender, 2014-15 42
Table B.24 Master’s Degrees Awarded by Broad Field and Gender, 2014-15 43
Table B.25 Doctoral Degrees Awarded by Broad Field and Gender, 2014-15 43

Graduate Enrollment and Degrees: 2005 to 2015 27
Table B.1: Applications for Admission to Graduate School by Institution Type, Carnegie Classification, and Degree Level, Fall 2015
Doctoral Master’s/Other * Total
Carnegie Classification and Institution Type **
Total Accepted Applications
Total Accepted Applications
Total Accepted Applications
Total 656,928 143,898 21.9% 1,518,973 731,589 48.2% 2,178,505 877,003 40.3%
Public 398,692 96,369 24.2% 943,389 455,209 48.3% 1,342,435 551,803 41.1%
Private, not-for-profit 257,033 46,501 18.1% 574,256 275,120 47.9% 833,539 322,912 38.7%
Private, for-profit S S S S S S
Research Universities (RU/VH) 494,435 94,484 19.1% 768,998 304,325 39.6% 1,263,433 398,809 31.6%
Public 315,619 69,518 22.0% 504,235 201,679 40.0% 819,854 271,197 33.1%
Private, not-for-profit 178,816 24,966 14.0% 264,763 102,646 38.8% 443,579 127,612 28.8%
Private, for-profit N/A N/A N/A N/A N/A N/A
Research Universities (RU/H) 92,770 25,393 27.4% 302,262 160,746 53.2% 395,032 186,139 47.1%
Public 53,885 17,104 31.7% 198,893 107,950 54.3% 252,778 125,054 49.5%
Private, not-for-profit 38,885 8,289 21.3% 103,369 52,796 51.1% 142,254 61,085 42.9%
Private, for-profit N/A N/A N/A N/A N/A N/A
Doctoral/Research Universities 19,402 8,503 43.8% 104,312 64,457 61.8% 123,714 72,960 59.0%
Public 6,039 2,779 46.0% 40,739 25,545 62.7% 46,778 28,324 60.5%
Private, not-for-profit 12,160 4,696 38.6% 62,245 37,652 60.5% 74,405 42,348 56.9%
Private, for-profit S S S S S S
Master’s Colleges and Universities 27,930 9,884 35.4% 308,044 186,143 60.4% 337,812 196,867 58.3%
Public 10,875 4,466 41.1% 187,640 114,722 61.1% 198,869 119,413 60.0%
Private, not-for-profit 17,055 5,418 31.8% 120,404 71,421 59.3% 138,943 77,454 55.7%
Private, for-profit N/A N/A N/A N/A N/A N/A
Other 22,391 5,634 25.2% 35,357 15,918 45.0% 58,514 22,228 38.0%
Public 12,274 2,502 20.4% 11,882 5,313 44.7% 24,156 7,815 32.4%
Private, not-for-profit 10,117 3,132 31.0% 23,475 10,605 45.2% 34,358 14,413 41.9%
Private, for-profit N/A N/A N/A N/A N/A N/A
* Includes applications to graduate-level certificate and education specialist programs. ** See page 3 for information about the Carnegie Classification system. RU/VH = very high research activity. RU/H = high research activity.Notes: Because not all institutions responded to all items, details may not sum to totals. N/A = Not applicable. S = Suppressed due to small number of institu-tional respondents in this category.Source: CGS/GRE Survey of Graduate Enrollment and Degrees

28 Council of Graduate Schools
Table B.2: Applications for Admission to Graduate School by Broad Field and Degree Level, Fall 2015Doctoral Master’s/Other * Total
Broad Field Total Accepted Applications
Total Accepted Applications
Total Accepted Applications
Total 656,928 143,898 21.9% 1,518,973 731,589 48.2% 2,178,505 877,003 40.3%
Arts and Humanities 61,093 11,581 19.0% 96,698 38,312 39.6% 158,435 50,460 31.8%
Biological and Agricultural Sciences 74,506 14,681 19.7% 50,205 23,341 46.5% 124,824 38,078 30.5%
Business 22,171 2,975 13.4% 245,262 118,776 48.4% 267,433 121,751 45.5%
Education 28,110 11,630 41.4% 127,524 91,053 71.4% 155,634 102,683 66.0%
Engineering 98,635 23,470 23.8% 222,886 89,076 40.0% 321,521 112,546 35.0%
Health Sciences 73,063 17,015 23.3% 186,462 74,237 39.8% 266,228 92,477 34.7%
Mathematics and Computer Sciences 51,215 13,033 25.4% 177,321 66,053 37.3% 228,536 79,086 34.6%
Physical and Earth Sciences 62,839 16,002 25.5% 17,517 7,113 40.6% 80,356 23,115 28.8%
Public Administration and Services 3,432 929 27.1% 67,487 42,662 63.2% 70,919 43,591 61.5%
Social and Behavioral Sciences 122,702 18,088 14.7% 89,800 51,860 57.8% 212,502 69,948 32.9%
Other Fields 18,201 4,717 25.9% 93,911 54,240 57.8% 112,112 58,957 52.6%
* Includes applications to graduate-level certificate and education specialist programs. Notes: Because not all institutions responded to all items, details may not sum to totals. See Appendix B for the survey taxonomy.Source: CGS/GRE Survey of Graduate Enrollment and Degrees

Graduate Enrollment and Degrees: 2005 to 2015 29
Table B.3: First-Time Graduate Enrollment by Institution Type, Carnegie Classification, Gender, and Attendance Status, Fall 2015Carnegie Classification and Institution Type *
Total Men Women Full-Time Part-Time
Total 506,927 212,996 42.8% 284,286 57.2% 346,474 68.4% 160,331 31.6%
Public 319,230 139,923 43.8% 179,307 56.2% 216,123 67.7% 103,107 32.3%
Private, not-for-profit 169,906 70,666 41.8% 98,406 58.2% 121,668 71.7% 48,116 28.3%
Private, for-profit S S S S S
Research Universities (RU/VH) 204,490 100,027 48.9% 104,463 51.1% 165,878 81.1% 38,612 18.9%
Public 142,000 69,400 48.9% 72,600 51.1% 113,305 79.8% 28,695 20.2%
Private, not-for-profit 62,490 30,627 49.0% 31,863 51.0% 52,573 84.1% 9,917 15.9%
Private, for-profit N/A N/A N/A N/A N/A
Research Universities (RU/H) 97,671 43,147 44.2% 54,524 55.8% 65,517 67.1% 32,154 32.9%
Public 74,713 32,620 43.7% 42,093 56.3% 48,763 65.3% 25,950 34.7%
Private, not-for-profit 22,958 10,527 45.9% 12,431 54.1% 16,754 73.0% 6,204 27.0%
Private, for-profit N/A N/A N/A N/A N/A
Doctoral/Research Universities 61,466 19,052 36.2% 33,603 63.8% 35,987 58.5% 25,479 41.5%
Public 17,608 6,866 39.0% 10,742 61.0% 9,784 55.6% 7,824 44.4%
Private, not-for-profit 26,067 9,779 37.5% 16,288 62.5% 17,520 67.2% 8,547 32.8%
Private, for-profit S S S S S
Master’s Colleges and Universities 127,252 44,960 35.6% 81,458 64.4% 67,249 52.9% 59,881 47.1%
Public 78,790 28,666 36.4% 50,124 63.6% 39,636 50.3% 39,154 49.7%
Private, not-for-profit 48,462 16,294 34.2% 31,334 65.8% 27,613 57.1% 20,727 42.9%
Private, for-profit N/A N/A N/A N/A N/A
Other 16,048 5,810 36.2% 10,238 63.8% 11,843 73.8% 4,205 26.2%
Public 6,119 2,371 38.7% 3,748 61.3% 4,635 75.7% 1,484 24.3%
Private, not-for-profit 9,929 3,439 34.6% 6,490 65.4% 7,208 72.6% 2,721 27.4%
Private, for-profit N/A N/A N/A N/A N/A
* See page 3 for information about the Carnegie Classification system. RU/VH = very high research activity. RU/H = high research activity.Notes: Because not all institutions responded to all items, details may not sum to totals. Percentages are based on total of known gender or attendance status. N/A = Not applicable. S = Suppressed due to small number of institutional respondents in this category.Source: CGS/GRE Survey of Graduate Enrollment and Degrees
30 Council of Graduate Schools
Table B.4: First-Time Graduate Enrollment by Broad Field, Gender, and Attendance Status, Fall 2015Broad Field Total Men Women Full-Time Part-Time
Total 506,927 212,996 42.8% 284,286 57.2% 346,474 68.4% 160,331 31.6%
Arts and Humanities 26,997 11,673 43.3% 15,313 56.7% 21,817 80.8% 5,180 19.2%
Biological and Agricultural Sciences 21,528 9,699 45.1% 11,829 54.9% 18,433 85.6% 3,095 14.4%
Business 79,010 42,237 55.4% 34,026 44.6% 52,004 65.8% 26,974 34.2%
Education 77,342 18,452 25.0% 55,436 75.0% 35,677 46.2% 41,517 53.8%
Engineering 45,910 34,378 74.9% 11,532 25.1% 38,306 83.4% 7,604 16.6%
Health Sciences 63,309 14,312 22.6% 48,997 77.4% 43,308 68.4% 19,964 31.6%
Mathematics and Computer Sciences 34,348 22,856 67.1% 11,231 32.9% 26,701 77.7% 7,647 22.3%
Physical and Earth Sciences 11,231 6,851 61.0% 4,380 39.0% 10,093 89.9% 1,138 10.1%
Public Administration and Services 27,993 6,178 22.2% 21,675 77.8% 19,595 70.0% 8,398 30.0%
Social and Behavioral Sciences 37,209 13,233 37.6% 21,960 62.4% 28,609 76.9% 8,600 23.1%
Other Fields 33,727 12,962 38.7% 20,556 61.3% 22,124 65.6% 11,603 34.4%
Notes: Because not all institutions responded to all items, details may not sum to totals. Percentages are based on total of known gender or attendance status. See Appendix B for the survey taxonomy.Source: CGS/GRE Survey of Graduate Enrollment and Degrees
Table B.5: First-Time Graduate Enrollment by Gender, Attendance Status, and Broad Field, Fall 2015Men Women
Broad Field Full-Time Part-Time Full-Time Part-Time
Total 155,111 72.8% 57,815 27.2% 187,491 66.0% 96,720 34.0%
Arts and Humanities 9,626 82.5% 2,047 17.5% 12,191 79.6% 3,122 20.4%
Biological and Agricultural Sciences 8,284 85.4% 1,415 14.6% 10,149 85.8% 1,680 14.2%
Business 28,675 67.9% 13,550 32.1% 22,360 65.8% 11,646 34.2%
Education 8,864 48.1% 9,559 51.9% 25,356 45.8% 29,977 54.2%
Engineering 28,459 82.8% 5,919 17.2% 9,847 85.4% 1,685 14.6%
Health Sciences 10,672 74.6% 3,632 25.4% 32,636 66.6% 16,332 33.4%
Mathematics and Computer Sciences 17,653 77.2% 5,203 22.8% 8,953 79.7% 2,278 20.3%
Physical and Earth Sciences 6,211 90.7% 640 9.3% 3,882 88.6% 498 11.4%
Public Administration and Services 4,083 66.1% 2,095 33.9% 15,462 71.3% 6,213 28.7%
Social and Behavioral Sciences 10,463 79.1% 2,770 20.9% 17,621 80.2% 4,339 19.8%
Other Fields 8,903 68.7% 4,059 31.3% 13,144 63.9% 7,412 36.1%
Notes: Because not all institutions responded to all items, details may not sum to totals. Percentages are based on total of known attendance status. See Appendix B for the survey taxonomy.Source: CGS/GRE Survey of Graduate Enrollment and Degrees

Graduate Enrollment and Degrees: 2005 to 2015 31
Table B.6: First-Time Graduate Enrollment by Broad Field and Degree Level, Fall 2015Broad Field Total Doctoral Master’s/Other *
Total 506,927 83,099 16.4% 424,811 83.6%
Arts and Humanities 26,997 5,732 21.1% 21,402 78.9%
Biological and Agricultural Sciences 21,528 7,839 36.4% 13,689 63.6%
Business 79,010 4,187 5.3% 75,084 94.7%
Education 77,342 10,517 13.6% 66,817 86.4%
Engineering 45,910 9,474 20.6% 36,436 79.4%
Health Sciences 63,309 12,539 19.8% 50,770 80.2%
Mathematics and Computer Sciences 34,348 4,555 13.3% 29,793 86.7%
Physical and Earth Sciences 11,231 6,763 60.2% 4,474 39.8%
Public Administration and Services 27,993 912 3.3% 27,081 96.7%
Social and Behavioral Sciences 37,209 9,935 26.7% 27,258 73.3%
Other Fields 33,727 2,651 7.9% 31,081 92.1%
* Includes first-time enrollment in graduate-level certificate and education specialist programs.Notes: Because not all institutions responded to all items, details may not sum to totals. Percentages are based on total of known degree levels. See Appendix B for the survey taxonomy.Source: CGS/GRE Survey of Graduate Enrollment and Degrees
Table B.7: First-Time Graduate Enrollment by Degree Level, Gender, and Broad Field, Fall 2015Doctoral Master’s/Other *
Broad Field Men Women Men Women
Total 37,488 48.7% 39,460 51.3% 176,091 41.8% 245,226 58.2%
Arts and Humanities 2,850 49.7% 2,882 50.3% 8,860 41.4% 12,524 58.6%
Biological and Agricultural Sciences 3,673 46.9% 4,166 53.1% 6,026 44.0% 7,663 56.0%
Business 1,277 55.5% 1,025 44.5% 41,098 55.4% 33,124 44.6%
Education 2,651 33.3% 5,311 66.7% 15,789 24.0% 50,117 76.0%
Engineering 7,013 74.0% 2,461 26.0% 27,365 75.1% 9,071 24.9%
Health Sciences 3,743 29.9% 8,796 70.1% 10,569 20.8% 40,201 79.2%
Mathematics and Computer Sciences 3,206 73.4% 1,161 26.6% 19,650 66.1% 10,070 33.9%
Physical and Earth Sciences 4,329 64.0% 2,434 36.0% 2,524 56.4% 1,950 43.6%
Public Administration and Services 290 35.5% 527 64.5% 5,888 21.8% 21,148 78.2%
Social and Behavioral Sciences 3,670 40.7% 5,351 59.3% 9,552 36.5% 16,604 63.5%
Other Fields 1,197 48.1% 1,292 51.9% 11,768 37.9% 19,266 62.1%
* Includes first-time enrollment in graduate-level certificate and education specialist programs.Notes: Because not all institutions responded to all items, details may not sum to totals. Percentages are based on total of known gender.See Appendix B for the survey taxonomy.Source: CGS/GRE Survey of Graduate Enrollment and Degrees

32 Council of Graduate Schools
Table B.8: First-Time Graduate Enrollment by Institution Type, Carnegie Classification, and Citizenship, Fall 2015Institution Type and Carnegie Classification *
Total U.S. Citizens and Permanent Residents
Temporary Residents
Total 506,927 389,844 78.0% 109,832 22.0%
Institution Type
Public 319,230 250,044 78.6% 68,174 21.4%
Private, not-for-profit 169,906 128,244 75.5% 41,518 24.5%
Private, for-profit S S S
Carnegie Classification *
Research Universities (RU/VH) 204,490 142,865 69.6% 62,270 30.4%
Research Universities (RU/H) 97,671 74,512 75.6% 24,029 24.4%
Doctoral/Research Universities 61,466 48,291 87.2% 7,061 12.8%
Master’s Colleges and Universities 127,252 109,843 88.1% 14,860 11.9%
Other 16,048 14,333 89.9% 1,612 10.1%
* See page 3 for information about the Carnegie Classification system. RU/VH = very high research activity. RU/H = high research activity.Notes: Because not all institutions responded to all items, details may not sum to totals. Percentages are based on total of known citizenship. S = Suppressed due to a small number of institutional respondents in this category.Source: CGS/GRE Survey of Graduate Enrollment and Degrees
Table B.9: First-Time Graduate Enrollment by Broad Field and Citizenship, Fall 2015Broad Field Total U.S. Citizens and
Permanent ResidentsTemporary Residents
Total 506,927 389,844 78.0% 109,832 22.0%
Arts and Humanities 26,997 22,282 82.2% 4,822 17.8%
Biological and Agricultural Sciences 21,528 17,110 79.8% 4,332 20.2%
Business 79,010 58,834 76.6% 17,942 23.4%
Education 77,342 71,316 95.7% 3,199 4.3%
Engineering 45,910 18,986 41.5% 26,814 58.5%
Health Sciences 63,309 59,446 94.5% 3,455 5.5%
Mathematics and Computer Sciences 34,348 12,499 36.8% 21,454 63.2%
Physical and Earth Sciences 11,231 7,710 68.7% 3,518 31.3%
Public Administration and Services 27,993 26,572 95.7% 1,201 4.3%
Social and Behavioral Sciences 37,209 30,097 83.6% 5,896 16.4%
Other Fields 33,727 27,319 81.4% 6,240 18.6%
Notes: Because not all institutions responded to all items, details may not sum to totals. Percentages are based on total of known citizenship. See Appendix B for the survey taxonomy.Source: CGS/GRE Survey of Graduate Enrollment and Degrees

Graduate Enrollment and Degrees: 2005 to 2015 33
Table B.10: First-Time Graduate Enrollment by Citizenship, Race/Ethnicity, and Gender, Fall 2015Citizenship and Race/Ethnicity Total Men Women
Total 506,927 212,996 42.8% 284,286 57.2%
U.S. Citizens and Permanent Residents 389,844 148,911 38.6% 237,337 61.4%
Hispanic/Latino 39,152 14,383 36.9% 24,596 63.1%
Non-Hispanic:
American Indian/Alaska Native 1,937 694 36.4% 1,211 63.6%
Asian 26,612 11,816 44.5% 14,737 55.5%
Black/African American 45,818 13,749 30.9% 30,799 69.1%
Native Hawaiian/Other Pacific Islander 826 324 40.1% 483 59.9%
White 243,011 95,312 39.4% 146,437 60.6%
Two or More Races 10,937 4,043 37.5% 6,743 62.5%
Race/Ethnicity Unknown 22,966 8,972 40.2% 13,364 59.8%
Temporary Residents 109,832 63,689 58.0% 46,110 42.0%
Citizenship Unknown 6,532 801 59.3% 549 40.7%
Notes: Because not all institutions responded to all items, details may not sum to totals. Percentages are based on total of known gender withineach citizenship and race/ethnicity category. See page 2 for a description of each citizenship and race/ ethnicity category. Source: CGS/GRE Survey of Graduate Enrollment and Degrees

34 Council of Graduate Schools
Table B.11: First-Time Graduate Enrollment by Broad Field and Race/Ethnicity, Fall 2015 (U.S. Citizens and Permanent Residents Only)Broad Field Hispanic/Latino American Indian/
Alaska NativeAsian Black/
African American
Total 39,152 10.0% 1,937 0.5% 26,612 6.8% 45,818 11.7%
Arts and Humanities 2,228 10.0% 113 0.5% 948 4.3% 1,317 5.9%
Biological and Agricultural Sciences 1,601 9.4% 81 0.5% 1,739 10.2% 1,090 6.4%
Business 5,347 9.1% 249 0.4% 5,236 8.9% 7,362 12.5%
Education 8,001 11.1% 350 0.5% 2,448 3.4% 8,951 12.4%
Engineering 1,784 9.4% 67 0.4% 2,649 14.0% 1,089 5.7%
Health Sciences 4,497 7.6% 272 0.5% 4,656 7.8% 6,484 10.9%
Mathematics and Computer Sciences 1,055 8.4% 41 0.3% 1,884 15.1% 1,384 11.1%
Physical and Earth Sciences 666 8.6% 27 0.4% 506 6.6% 243 3.2%
Public Administration and Services 3,895 14.6% 216 0.8% 991 3.7% 4,761 17.9%
Social and Behavioral Sciences 3,673 12.2% 215 0.7% 1,537 5.1% 3,891 12.9%
Other Fields 2,936 10.7% 179 0.7% 1,400 5.1% 3,062 11.2%
Broad Field Native Hawaiian/ Other Pacific Islander
White Two or More Races Race/ Ethnicity Unknown
Total 826 0.2% 243,011 62.1% 10,937 2.8% 22,966 5.9%
Arts and Humanities 44 0.2% 15,527 69.7% 774 3.5% 1,331 6.0%
Biological and Agricultural Sciences 19 0.1% 11,215 65.5% 570 3.3% 798 4.7%
Business 128 0.2% 35,352 60.0% 1,342 2.3% 3,943 6.7%
Education 179 0.2% 45,822 63.7% 1,693 2.4% 4,495 6.2%
Engineering 31 0.2% 11,763 62.0% 603 3.2% 1,000 5.3%
Health Sciences 130 0.2% 38,361 64.4% 1,579 2.7% 3,554 6.0%
Mathematics and Computer Sciences 35 0.3% 6,871 55.0% 400 3.2% 829 6.6%
Physical and Earth Sciences 12 0.2% 5,608 72.7% 259 3.4% 389 5.0%
Public Administration and Services 75 0.3% 14,820 55.7% 768 2.9% 1,091 4.1%
Social and Behavioral Sciences 59 0.2% 17,843 59.1% 1,090 3.6% 1,858 6.2%
Other Fields 80 0.3% 17,023 62.3% 867 3.2% 1,772 6.5%
Notes: This table only includes U.S. citizens and permanent residents. See Table 2.9 for first-time enrollment by broad field for temporary resi-dents. Because not all institutions responded to all items, details may not sum to totals. Percentages are based on total of known race/ethnicity. See page 2 for a description of each race/ethnicity category. See Appendix B for the survey taxonomy.Source: CGS/GRE Survey of Graduate Enrollment and Degrees

Graduate Enrollment and Degrees: 2005 to 2015 35
Table B.12: Total Graduate Enrollment by Institution Type, Carnegie Classification, Gender, and Attendance Status, Fall 2015Carnegie Classification and Institution Type *
Total Men Women Full-Time Part-Time
Total 1,782,364 751,960 42.6% 1,014,987 57.4% 1,055,838 59.3% 725,123 40.7%
Public 1,103,416 486,453 44.1% 616,479 55.9% 637,003 57.8% 465,929 42.2%
Private, not-for-profit 570,021 236,857 41.9% 328,943 58.1% 345,850 60.8% 223,252 39.2%
Private, for-profit 108,927 28,650 29.2% 69,565 70.8% 72,985 67.0% 35,942 33.0%
Research Universities (RU/VH) 684,386 343,197 50.1% 341,189 49.9% 502,307 73.4% 182,079 26.6%
Public 495,997 246,615 49.7% 249,382 50.3% 355,876 71.7% 140,121 28.3%
Private, not-for-profit 188,389 96,582 51.3% 91,807 48.7% 146,431 77.7% 41,958 22.3%
Private, for-profit N/A N/A N/A N/A N/A
Research Universities (RU/H) 334,491 146,162 43.7% 188,329 56.3% 185,217 55.4% 149,274 44.6%
Public 248,750 109,148 43.9% 139,602 56.1% 133,946 53.8% 114,804 46.2%
Private, not-for-profit 85,741 37,014 43.2% 48,727 56.8% 51,271 59.8% 34,470 40.2%
Private, for-profit N/A N/A N/A N/A N/A
Doctoral/Research Universities 254,224 82,327 33.8% 161,185 66.2% 149,721 58.9% 104,503 41.1%
Public 66,235 24,960 37.7% 41,275 62.3% 28,848 43.6% 37,387 56.4%
Private, not-for-profit 90,844 34,039 37.5% 56,805 62.5% 50,165 55.2% 40,679 44.8%
Private, for-profit 97,145 23,328 27.0% 63,105 73.0% 70,708 72.8% 26,437 27.2%
Master’s Colleges and Universities 460,747 162,618 35.7% 293,424 64.3% 185,813 40.5% 273,531 59.5%
Public 272,224 97,707 36.0% 174,033 64.0% 103,448 38.1% 168,292 61.9%
Private, not-for-profit 176,741 59,589 34.5% 112,931 65.5% 80,088 45.6% 95,734 54.4%
Private, for-profit S S S S S
Other 48,516 17,656 36.4% 30,860 63.6% 32,780 67.6% 15,736 32.4%
Public 20,210 8,023 39.7% 12,187 60.3% 14,885 73.7% 5,325 26.3%
Private, not-for-profit 28,306 9,633 34.0% 18,673 66.0% 17,895 63.2% 10,411 36.8%
Private, for-profit N/A N/A N/A N/A N/A
* See page 3 for information about the Carnegie Classification system. RU/VH = very high research activity. RU/H = high research activity.Notes: Because not all institutions responded to all items, details may not sum to totals. Percentages are based on total of known gender or attendance status. N/A = Not applicable. S = Suppressed due to small number of institutional respondents in this category.Source: CGS/GRE Survey of Graduate Enrollment and Degrees

36 Council of Graduate Schools
Table B.13: Total Graduate Enrollment by Broad Field, Gender, and Attendance Status, Fall 2015Broad Field Total Men Women Full-Time Part-Time
Total 1,782,364 751,960 42.6% 1,014,987 57.4% 1,055,838 59.3% 725,123 40.7%
Arts and Humanities 100,816 43,681 43.3% 57,124 56.7% 71,545 71.0% 29,271 29.0%
Biological and Agricultural Sciences 87,426 40,505 46.3% 46,908 53.7% 69,154 79.1% 18,272 20.9%
Business 241,537 129,581 55.0% 105,866 45.0% 122,778 51.4% 116,010 48.6%
Education 289,184 72,158 25.4% 211,986 74.6% 109,767 38.1% 178,183 61.9%
Engineering 157,457 119,431 75.8% 38,026 24.2% 114,708 72.9% 42,749 27.1%
Health Sciences 224,118 50,708 22.6% 173,410 77.4% 132,951 59.4% 91,043 40.6%
Mathematics and Computer Sciences 105,033 71,875 69.1% 32,169 30.9% 69,286 66.4% 35,068 33.6%
Physical and Earth Sciences 51,732 32,761 63.3% 18,971 36.7% 43,878 84.8% 7,854 15.2%
Public Administration and Services 79,786 18,763 23.6% 60,856 76.4% 50,505 63.3% 29,281 36.7%
Social and Behavioral Sciences 137,871 50,513 37.5% 84,309 62.5% 93,791 68.4% 43,401 31.6%
Other Fields 100,205 39,432 39.5% 60,509 60.5% 55,219 55.1% 44,986 44.9%
Notes: Because not all institutions responded to all items, details may not sum to totals. Percentages are based on total of known gender or attendance status. See Appendix B for the survey taxonomy.Source: CGS/GRE Survey of Graduate Enrollment and Degrees
Table B.14: Total Graduate Enrollment by Gender, Attendance Status, and Broad Field, Fall 2015Men Women
Broad Field Full-Time Part-Time Full-Time Part-Time
Total 472,867 62.9% 279,093 37.1% 575,992 56.7% 438,995 43.3%
Arts and Humanities 31,780 72.8% 11,901 27.2% 39,765 69.6% 17,359 30.4%
Biological and Agricultural Sciences 32,324 79.8% 8,181 20.2% 36,830 78.5% 10,078 21.5%
Business 67,820 52.3% 61,752 47.7% 53,472 50.5% 52,384 49.5%
Education 27,480 38.1% 44,586 61.9% 80,148 37.9% 131,482 62.1%
Engineering 85,956 72.0% 33,475 28.0% 28,752 75.6% 9,274 24.4%
Health Sciences 33,968 67.0% 16,721 33.0% 98,983 57.1% 74,322 42.9%
Mathematics and Computer Sciences 47,245 65.7% 24,630 34.3% 21,901 68.1% 10,268 31.9%
Physical and Earth Sciences 28,121 85.8% 4,640 14.2% 15,757 83.1% 3,214 16.9%
Public Administration and Services 10,600 56.5% 8,163 43.5% 39,835 65.5% 21,021 34.5%
Social and Behavioral Sciences 35,179 69.6% 15,334 30.4% 57,854 68.6% 26,455 31.4%
Other Fields 22,985 58.3% 16,447 41.7% 32,106 53.1% 28,403 46.9%
Notes: Because not all institutions responded to all items, details may not sum to totals. Percentages are based on total of known attendance status. See Appendix B for the survey taxonomy.Source: CGS/GRE Survey of Graduate Enrollment and Degrees
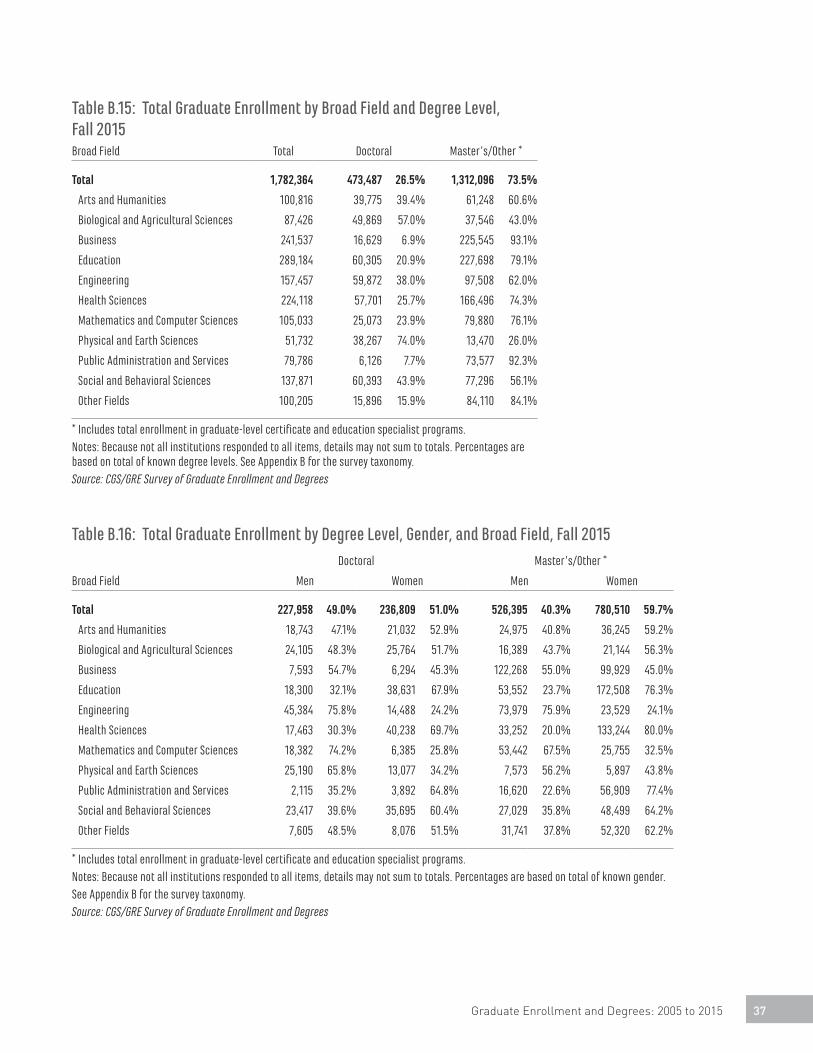
Graduate Enrollment and Degrees: 2005 to 2015 37
Table B.15: Total Graduate Enrollment by Broad Field and Degree Level, Fall 2015Broad Field Total Doctoral Master’s/Other *
Total 1,782,364 473,487 26.5% 1,312,096 73.5%
Arts and Humanities 100,816 39,775 39.4% 61,248 60.6%
Biological and Agricultural Sciences 87,426 49,869 57.0% 37,546 43.0%
Business 241,537 16,629 6.9% 225,545 93.1%
Education 289,184 60,305 20.9% 227,698 79.1%
Engineering 157,457 59,872 38.0% 97,508 62.0%
Health Sciences 224,118 57,701 25.7% 166,496 74.3%
Mathematics and Computer Sciences 105,033 25,073 23.9% 79,880 76.1%
Physical and Earth Sciences 51,732 38,267 74.0% 13,470 26.0%
Public Administration and Services 79,786 6,126 7.7% 73,577 92.3%
Social and Behavioral Sciences 137,871 60,393 43.9% 77,296 56.1%
Other Fields 100,205 15,896 15.9% 84,110 84.1%
* Includes total enrollment in graduate-level certificate and education specialist programs.Notes: Because not all institutions responded to all items, details may not sum to totals. Percentages are based on total of known degree levels. See Appendix B for the survey taxonomy.Source: CGS/GRE Survey of Graduate Enrollment and Degrees
Table B.16: Total Graduate Enrollment by Degree Level, Gender, and Broad Field, Fall 2015Doctoral Master’s/Other *
Broad Field Men Women Men Women
Total 227,958 49.0% 236,809 51.0% 526,395 40.3% 780,510 59.7%
Arts and Humanities 18,743 47.1% 21,032 52.9% 24,975 40.8% 36,245 59.2%
Biological and Agricultural Sciences 24,105 48.3% 25,764 51.7% 16,389 43.7% 21,144 56.3%
Business 7,593 54.7% 6,294 45.3% 122,268 55.0% 99,929 45.0%
Education 18,300 32.1% 38,631 67.9% 53,552 23.7% 172,508 76.3%
Engineering 45,384 75.8% 14,488 24.2% 73,979 75.9% 23,529 24.1%
Health Sciences 17,463 30.3% 40,238 69.7% 33,252 20.0% 133,244 80.0%
Mathematics and Computer Sciences 18,382 74.2% 6,385 25.8% 53,442 67.5% 25,755 32.5%
Physical and Earth Sciences 25,190 65.8% 13,077 34.2% 7,573 56.2% 5,897 43.8%
Public Administration and Services 2,115 35.2% 3,892 64.8% 16,620 22.6% 56,909 77.4%
Social and Behavioral Sciences 23,417 39.6% 35,695 60.4% 27,029 35.8% 48,499 64.2%
Other Fields 7,605 48.5% 8,076 51.5% 31,741 37.8% 52,320 62.2%
* Includes total enrollment in graduate-level certificate and education specialist programs.Notes: Because not all institutions responded to all items, details may not sum to totals. Percentages are based on total of known gender.See Appendix B for the survey taxonomy.Source: CGS/GRE Survey of Graduate Enrollment and Degrees
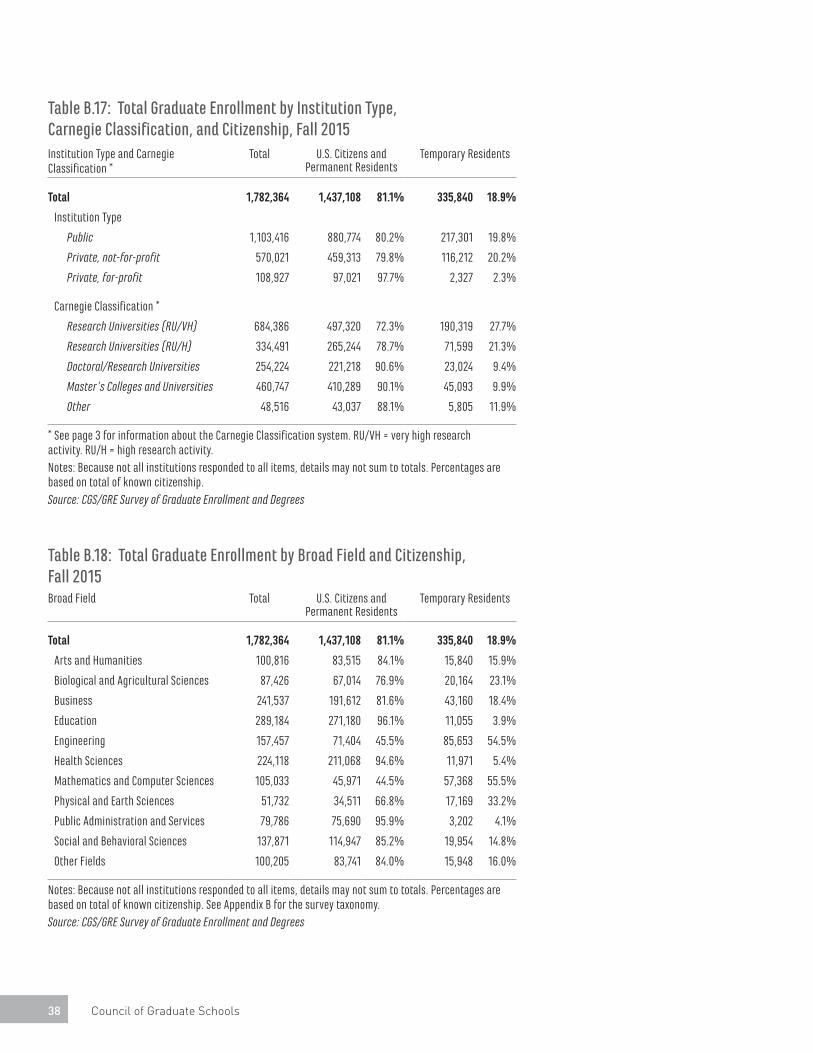
38 Council of Graduate Schools
Table B.17: Total Graduate Enrollment by Institution Type, Carnegie Classification, and Citizenship, Fall 2015Institution Type and Carnegie Classification *
Total U.S. Citizens and Permanent Residents
Temporary Residents
Total 1,782,364 1,437,108 81.1% 335,840 18.9%
Institution Type
Public 1,103,416 880,774 80.2% 217,301 19.8%
Private, not-for-profit 570,021 459,313 79.8% 116,212 20.2%
Private, for-profit 108,927 97,021 97.7% 2,327 2.3%
Carnegie Classification *
Research Universities (RU/VH) 684,386 497,320 72.3% 190,319 27.7%
Research Universities (RU/H) 334,491 265,244 78.7% 71,599 21.3%
Doctoral/Research Universities 254,224 221,218 90.6% 23,024 9.4%
Master’s Colleges and Universities 460,747 410,289 90.1% 45,093 9.9%
Other 48,516 43,037 88.1% 5,805 11.9%
* See page 3 for information about the Carnegie Classification system. RU/VH = very high research activity. RU/H = high research activity.Notes: Because not all institutions responded to all items, details may not sum to totals. Percentages are based on total of known citizenship. Source: CGS/GRE Survey of Graduate Enrollment and Degrees
Table B.18: Total Graduate Enrollment by Broad Field and Citizenship, Fall 2015Broad Field Total U.S. Citizens and
Permanent ResidentsTemporary Residents
Total 1,782,364 1,437,108 81.1% 335,840 18.9%
Arts and Humanities 100,816 83,515 84.1% 15,840 15.9%
Biological and Agricultural Sciences 87,426 67,014 76.9% 20,164 23.1%
Business 241,537 191,612 81.6% 43,160 18.4%
Education 289,184 271,180 96.1% 11,055 3.9%
Engineering 157,457 71,404 45.5% 85,653 54.5%
Health Sciences 224,118 211,068 94.6% 11,971 5.4%
Mathematics and Computer Sciences 105,033 45,971 44.5% 57,368 55.5%
Physical and Earth Sciences 51,732 34,511 66.8% 17,169 33.2%
Public Administration and Services 79,786 75,690 95.9% 3,202 4.1%
Social and Behavioral Sciences 137,871 114,947 85.2% 19,954 14.8%
Other Fields 100,205 83,741 84.0% 15,948 16.0%
Notes: Because not all institutions responded to all items, details may not sum to totals. Percentages are based on total of known citizenship. See Appendix B for the survey taxonomy.Source: CGS/GRE Survey of Graduate Enrollment and Degrees

Graduate Enrollment and Degrees: 2005 to 2015 39
Table B.19: Total Graduate Enrollment by Citizenship, Race/Ethnicity, and Gender, Fall 2015Citizenship and Race/Ethnicity Total Men Women
Total 1,782,364 751,960 42.6% 1,014,987 57.4%
U.S. Citizens and Permanent Residents 1,437,108 553,949 38.7% 877,325 61.3%
Hispanic/Latino 137,887 51,201 37.2% 86,492 62.8%
Non-Hispanic:
American Indian/Alaska Native 7,492 2,615 35.1% 4,836 64.9%
Asian 90,874 40,496 44.7% 50,156 55.3%
Black/African American 179,900 53,134 29.8% 125,345 70.2%
Native Hawaiian/Other Pacific Islander 3,151 1,251 40.0% 1,879 60.0%
White 888,391 353,817 40.0% 531,782 60.0%
Two or More Races 36,054 13,463 37.5% 22,396 62.5%
Race/Ethnicity Unknown 97,423 39,148 40.6% 57,327 59.4%
Temporary Residents 335,840 198,639 59.2% 137,161 40.8%
Citizenship Unknown 11,227 2,181 50.1% 2,172 49.9%
Notes: Because not all institutions responded to all items, details may not sum to totals. Percentages are based on total of known gender within each citizenship and race/ethnicity category. See page 2 for a description of each citizenship and race/ethnicity category. See Appendix B for the survey taxonomy.Source: CGS/GRE Survey of Graduate Enrollment and Degrees

40 Council of Graduate Schools
Table B.20: Total Graduate Enrollment by Broad Field and Race/Ethnicity, Fall 2015 (U.S. Citizens and Permanent Residents Only)Broad Field Hispanic/Latino American Indian/
Alaska NativeAsian Black/
African American
Total 137,887 9.6% 7,492 0.5% 90,874 6.3% 179,900 12.5%
Arts and Humanities 8,172 9.8% 462 0.6% 3,521 4.2% 4,273 5.1%
Biological and Agricultural Sciences 5,567 8.3% 309 0.5% 6,098 9.1% 3,712 5.5%
Business 17,692 9.2% 851 0.4% 16,059 8.4% 27,861 14.5%
Education 29,255 10.7% 1,609 0.6% 8,622 3.2% 36,496 13.4%
Engineering 6,336 8.9% 232 0.3% 9,067 12.7% 4,113 5.8%
Health Sciences 15,073 7.1% 1,006 0.5% 15,948 7.5% 24,644 11.7%
Mathematics and Computer Sciences 3,612 7.9% 123 0.3% 6,251 13.6% 4,731 10.3%
Physical and Earth Sciences 2,534 7.3% 155 0.4% 2,321 6.7% 1,050 3.0%
Public Administration and Services 10,119 13.3% 624 0.8% 2,605 3.4% 15,120 19.9%
Social and Behavioral Sciences 13,291 11.5% 796 0.7% 6,139 5.3% 14,094 12.2%
Other Fields 8,011 9.6% 494 0.6% 3,925 4.7% 9,172 11.0%
Broad Field Native Hawaiian/ Other Pacific Islander
White Two or More Races Race/ Ethnicity Unknown
Total 3,151 0.2% 888,391 61.6% 36,054 2.5% 97,423 6.8%
Arts and Humanities 150 0.2% 58,742 70.3% 2,632 3.2% 5,563 6.7%
Biological and Agricultural Sciences 99 0.1% 45,719 68.2% 2,050 3.1% 3,463 5.2%
Business 587 0.3% 110,982 57.8% 3,864 2.0% 14,013 7.3%
Education 624 0.2% 176,277 64.6% 5,686 2.1% 14,320 5.2%
Engineering 148 0.2% 45,425 63.6% 2,050 2.9% 4,033 5.6%
Health Sciences 470 0.2% 136,909 64.8% 4,925 2.3% 12,293 5.8%
Mathematics and Computer Sciences 100 0.2% 26,612 57.9% 1,286 2.8% 3,256 7.1%
Physical and Earth Sciences 47 0.1% 25,505 73.9% 971 2.8% 1,928 5.6%
Public Administration and Services 202 0.3% 41,403 54.6% 2,105 2.8% 3,625 4.8%
Social and Behavioral Sciences 242 0.2% 69,673 60.5% 3,622 3.1% 7,255 6.3%
Other Fields 186 0.2% 54,144 64.7% 2,209 2.6% 5,600 6.7%
Notes: This table only includes U.S. citizens and permanent residents. See Table 2.18 for total enrollment by broad field for temporary residents. Because not all institutions responded to all items, details may not sum to totals. Percentages are based on total of known race/ethnicity. See page 2 for a description of each race/ethnicity category. See Appendix B for the survey taxonomy.Source: CGS/GRE Survey of Graduate Enrollment and Degrees
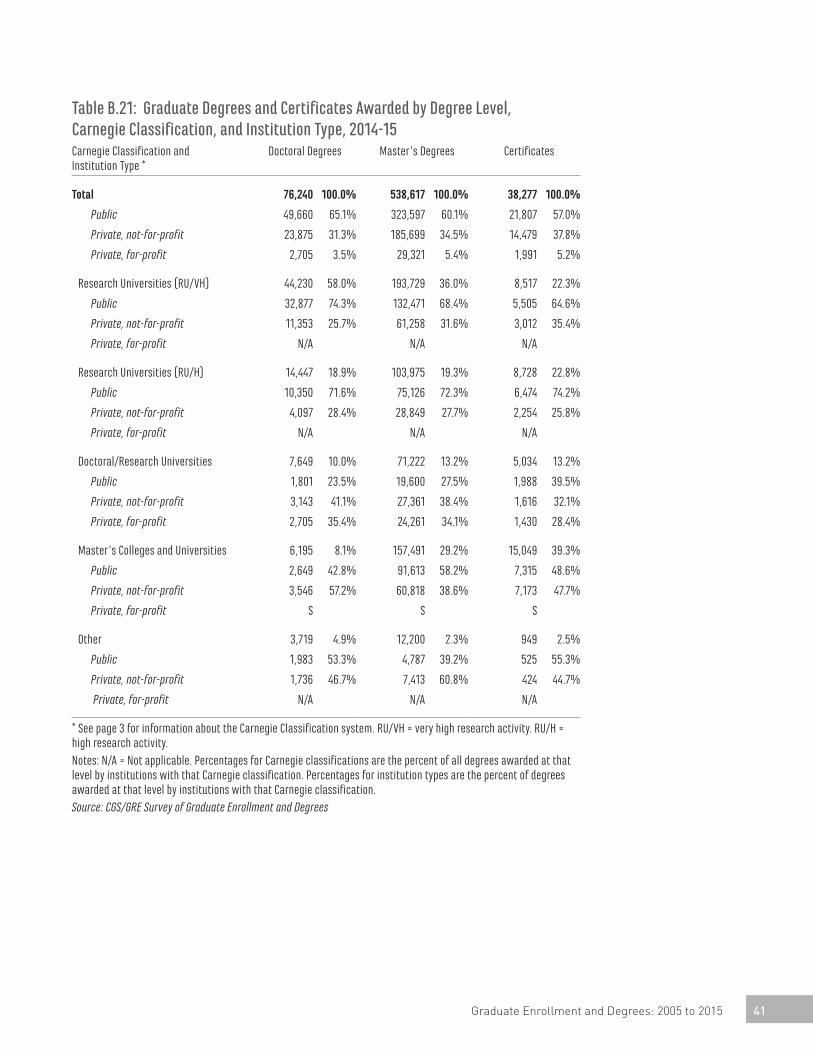
Graduate Enrollment and Degrees: 2005 to 2015 41
Table B.21: Graduate Degrees and Certificates Awarded by Degree Level, Carnegie Classification, and Institution Type, 2014-15Carnegie Classification and Institution Type *
Doctoral Degrees Master’s Degrees Certificates
Total 76,240 100.0% 538,617 100.0% 38,277 100.0%
Public 49,660 65.1% 323,597 60.1% 21,807 57.0%
Private, not-for-profit 23,875 31.3% 185,699 34.5% 14,479 37.8%
Private, for-profit 2,705 3.5% 29,321 5.4% 1,991 5.2%
Research Universities (RU/VH) 44,230 58.0% 193,729 36.0% 8,517 22.3%
Public 32,877 74.3% 132,471 68.4% 5,505 64.6%
Private, not-for-profit 11,353 25.7% 61,258 31.6% 3,012 35.4%
Private, for-profit N/A N/A N/A
Research Universities (RU/H) 14,447 18.9% 103,975 19.3% 8,728 22.8%
Public 10,350 71.6% 75,126 72.3% 6,474 74.2%
Private, not-for-profit 4,097 28.4% 28,849 27.7% 2,254 25.8%
Private, for-profit N/A N/A N/A
Doctoral/Research Universities 7,649 10.0% 71,222 13.2% 5,034 13.2%
Public 1,801 23.5% 19,600 27.5% 1,988 39.5%
Private, not-for-profit 3,143 41.1% 27,361 38.4% 1,616 32.1%
Private, for-profit 2,705 35.4% 24,261 34.1% 1,430 28.4%
Master’s Colleges and Universities 6,195 8.1% 157,491 29.2% 15,049 39.3%
Public 2,649 42.8% 91,613 58.2% 7,315 48.6%
Private, not-for-profit 3,546 57.2% 60,818 38.6% 7,173 47.7%
Private, for-profit S S S
Other 3,719 4.9% 12,200 2.3% 949 2.5%
Public 1,983 53.3% 4,787 39.2% 525 55.3%
Private, not-for-profit 1,736 46.7% 7,413 60.8% 424 44.7%
Private, for-profit N/A N/A N/A
* See page 3 for information about the Carnegie Classification system. RU/VH = very high research activity. RU/H = high research activity.Notes: N/A = Not applicable. Percentages for Carnegie classifications are the percent of all degrees awarded at that level by institutions with that Carnegie classification. Percentages for institution types are the percent of degrees awarded at that level by institutions with that Carnegie classification.Source: CGS/GRE Survey of Graduate Enrollment and Degrees
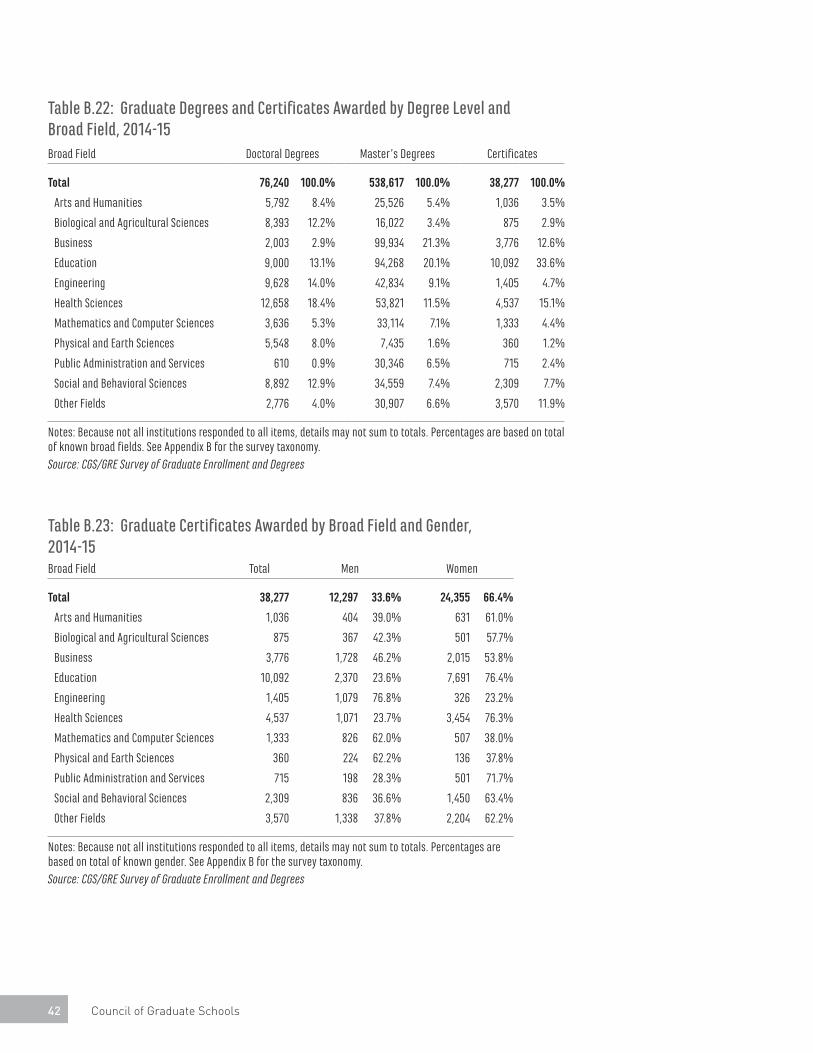
42 Council of Graduate Schools
Table B.22: Graduate Degrees and Certificates Awarded by Degree Level and Broad Field, 2014-15Broad Field Doctoral Degrees Master’s Degrees Certificates
Total 76,240 100.0% 538,617 100.0% 38,277 100.0%
Arts and Humanities 5,792 8.4% 25,526 5.4% 1,036 3.5%
Biological and Agricultural Sciences 8,393 12.2% 16,022 3.4% 875 2.9%
Business 2,003 2.9% 99,934 21.3% 3,776 12.6%
Education 9,000 13.1% 94,268 20.1% 10,092 33.6%
Engineering 9,628 14.0% 42,834 9.1% 1,405 4.7%
Health Sciences 12,658 18.4% 53,821 11.5% 4,537 15.1%
Mathematics and Computer Sciences 3,636 5.3% 33,114 7.1% 1,333 4.4%
Physical and Earth Sciences 5,548 8.0% 7,435 1.6% 360 1.2%
Public Administration and Services 610 0.9% 30,346 6.5% 715 2.4%
Social and Behavioral Sciences 8,892 12.9% 34,559 7.4% 2,309 7.7%
Other Fields 2,776 4.0% 30,907 6.6% 3,570 11.9%
Notes: Because not all institutions responded to all items, details may not sum to totals. Percentages are based on total of known broad fields. See Appendix B for the survey taxonomy.Source: CGS/GRE Survey of Graduate Enrollment and Degrees
Table B.23: Graduate Certificates Awarded by Broad Field and Gender, 2014-15Broad Field Total Men Women
Total 38,277 12,297 33.6% 24,355 66.4%
Arts and Humanities 1,036 404 39.0% 631 61.0%
Biological and Agricultural Sciences 875 367 42.3% 501 57.7%
Business 3,776 1,728 46.2% 2,015 53.8%
Education 10,092 2,370 23.6% 7,691 76.4%
Engineering 1,405 1,079 76.8% 326 23.2%
Health Sciences 4,537 1,071 23.7% 3,454 76.3%
Mathematics and Computer Sciences 1,333 826 62.0% 507 38.0%
Physical and Earth Sciences 360 224 62.2% 136 37.8%
Public Administration and Services 715 198 28.3% 501 71.7%
Social and Behavioral Sciences 2,309 836 36.6% 1,450 63.4%
Other Fields 3,570 1,338 37.8% 2,204 62.2%
Notes: Because not all institutions responded to all items, details may not sum to totals. Percentages are based on total of known gender. See Appendix B for the survey taxonomy.Source: CGS/GRE Survey of Graduate Enrollment and Degrees
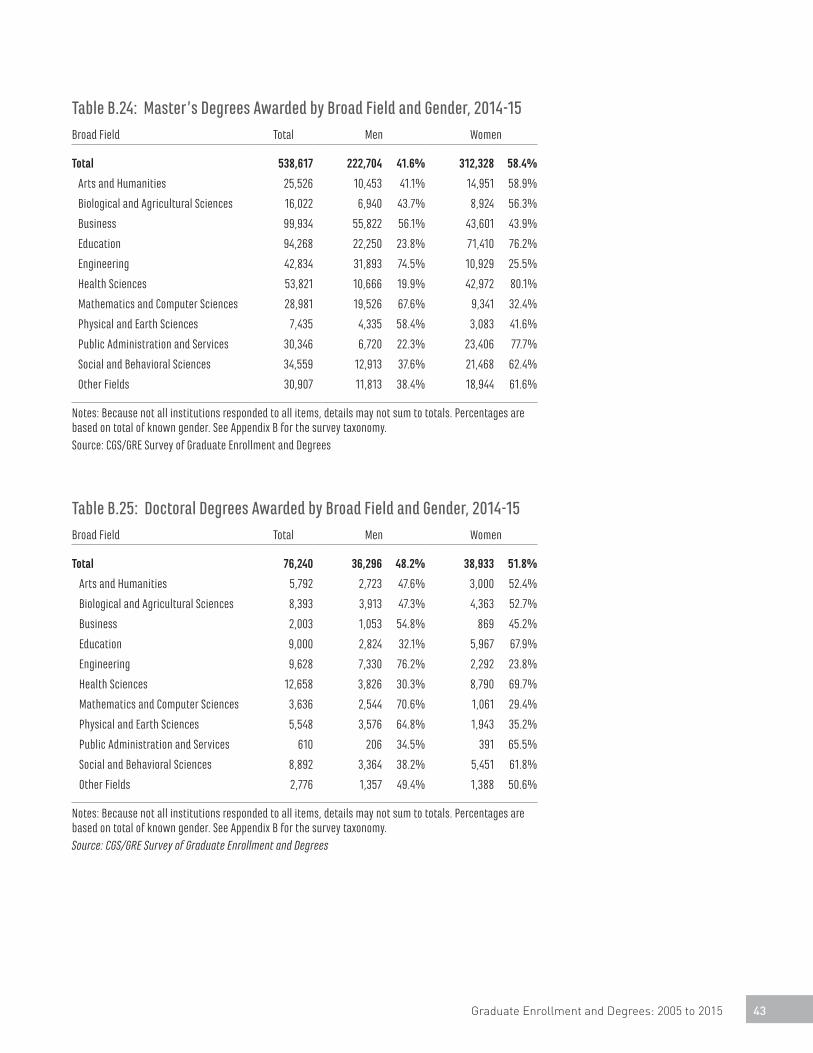
Graduate Enrollment and Degrees: 2005 to 2015 43
Table B.24: Master’s Degrees Awarded by Broad Field and Gender, 2014-15Broad Field Total Men Women
Total 538,617 222,704 41.6% 312,328 58.4%
Arts and Humanities 25,526 10,453 41.1% 14,951 58.9%
Biological and Agricultural Sciences 16,022 6,940 43.7% 8,924 56.3%
Business 99,934 55,822 56.1% 43,601 43.9%
Education 94,268 22,250 23.8% 71,410 76.2%
Engineering 42,834 31,893 74.5% 10,929 25.5%
Health Sciences 53,821 10,666 19.9% 42,972 80.1%
Mathematics and Computer Sciences 28,981 19,526 67.6% 9,341 32.4%
Physical and Earth Sciences 7,435 4,335 58.4% 3,083 41.6%
Public Administration and Services 30,346 6,720 22.3% 23,406 77.7%
Social and Behavioral Sciences 34,559 12,913 37.6% 21,468 62.4%
Other Fields 30,907 11,813 38.4% 18,944 61.6%
Notes: Because not all institutions responded to all items, details may not sum to totals. Percentages are based on total of known gender. See Appendix B for the survey taxonomy.Source: CGS/GRE Survey of Graduate Enrollment and Degrees
Table B.25: Doctoral Degrees Awarded by Broad Field and Gender, 2014-15Broad Field Total Men Women
Total 76,240 36,296 48.2% 38,933 51.8%
Arts and Humanities 5,792 2,723 47.6% 3,000 52.4%
Biological and Agricultural Sciences 8,393 3,913 47.3% 4,363 52.7%
Business 2,003 1,053 54.8% 869 45.2%
Education 9,000 2,824 32.1% 5,967 67.9%
Engineering 9,628 7,330 76.2% 2,292 23.8%
Health Sciences 12,658 3,826 30.3% 8,790 69.7%
Mathematics and Computer Sciences 3,636 2,544 70.6% 1,061 29.4%
Physical and Earth Sciences 5,548 3,576 64.8% 1,943 35.2%
Public Administration and Services 610 206 34.5% 391 65.5%
Social and Behavioral Sciences 8,892 3,364 38.2% 5,451 61.8%
Other Fields 2,776 1,357 49.4% 1,388 50.6%
Notes: Because not all institutions responded to all items, details may not sum to totals. Percentages are based on total of known gender. See Appendix B for the survey taxonomy.Source: CGS/GRE Survey of Graduate Enrollment and Degrees

44 Council of Graduate Schools

Graduate Enrollment and Degrees: 2005 to 2015 45
Table C.1 Applications for Admission to Graduate School by Institution Type, 47 Carnegie Classification, and Degree Level, 2005 to 2015
Table C.2 Applications for Admission to Graduate School by Broad Field, 2005 to 2015 48
Table C.3 Applications for Admission to Graduate School by Broad Field and Degree Level, 48 2010 to 2015
Table C.4 First-Time Graduate Enrollment by Institution Type and Carnegie Classification, 49 2005 to 2015
Table C.5 First-Time Graduate Enrollment by Citizenship and Race/Ethnicity, 2005 to 2015 50
Table C.6 First-Time Graduate Enrollment by Citizenship, Race/Ethnicity, and Gender, 50 2005 to 2015
Table C.7 First-Time Graduate Enrollment by Broad Field, 2005 to 2015 51
Table C.8 First-Time Graduate Enrollment by Broad Field and Attendance Status, 2005 to 2015 51
Table C.9 First-Time Graduate Enrollment by Broad Field and Citizenship, 2005 to 2015 52
Table C.10 First-Time Graduate Enrollment by Broad Field and Race/Ethnicity, 2005 to 2015 53 (U.S. Citizens and Permanent Residents Only)
Table C.11 First-Time Graduate Enrollment by Broad Field and Gender, 2005 to 2015 54
Table C.12 Doctorate-Level First-Time Enrollment by Broad Field and Gender, 2010 to 2015 54
Table C.13 Master’s-Level First-Time Enrollment by Broad Field and Gender, 2010 to 2015 55
Table C.14 Total Graduate Enrollment by Institution Type and Carnegie Classification, 56 2005 to 2015
Table C.15 Total Graduate Enrollment by Citizenship and Race/Ethnicity, 2005 to 2015 57
Table C.16 Total Graduate Enrollment by Citizenship, Race/Ethnicity, and Gender, 2005 to 2015 57
Table C.17 Total Graduate Enrollment by Broad Field, 2005 to 2015 58
Table C.18 Total Graduate Enrollment by Broad Field and Attendance Status, 2005 to 2015 58
APPENDIX C Data Tables for Trends in Graduate Applications, First-Time Enrollment, Total Enrollment, and Degrees Conferred, 2005-15
46 Council of Graduate Schools
Table C.19 Total Graduate Enrollment by Broad Field and Citizenship, 2005 to 2015 59
Table C.20 Total Graduate Enrollment by Broad Field and Race/Ethnicity, 2005 to 2015 60 (U.S. Citizens and Permanent Residents Only)
Table C.21 Total Graduate Enrollment by Broad Field and Gender, 2005 to 2015 61
Table C.22 Doctorate-Level Total Enrollment by Broad Field and Gender, 2010 to 2015 61
Table C.23 Master’s-Level Total Enrollment by Broad Field and Gender, 2010 to 2015 62
Table C.24 Graduate Degrees and Certificates Awarded by Degree Level and Institution Type, 62 2004-2005 to 2014-15
Table C.25 Graduate Degrees and Certificates Awarded by Degree Level and 63 Carnegie Classification, 2004-2005 to 2014-15
Table C.26 Graduate Degrees and Certificates Awarded by Degree Level, Institution Type, 64 and Gender, 2004-2005 to 2014-15
Table C.27 Graduate Degrees and Certificates Awarded by Degree Level, 65 Carnegie Classification, and Gender, 2004-2005 to 2014-15
Table C.28 Graduate-Level Certificates Awarded by Broad Field and Gender, 66 2009-10 to 2014-15
Table C.29 Master’s Degrees Awarded by Broad Field and Gender, 2004-2005 to 2014-15 66
Table C.30 Doctoral Degrees Awarded by Broad Field and Gender, 2004-2005 to 2014-15 67

Graduate Enrollment and Degrees: 2005 to 2015 47
Table C.1: Applications for Admission to Graduate School by Institution Type, Carnegie Classification, and Degree Level, 2005 to 2015Institution Type, Carnegie Classification, and Degree Level
% Change, 2014 to 2015
Average Annual % Change,
2010 to 2015
Average Annual % Change,
2005 to 2015
Total 1.2% 3.2% 6.2%
Institution Type
Public 1.0% 2.7% 5.6%
Private, not-for-profit 1.5% 4.3% 7.2%
Private, for-profit S N/A N/A
Carnegie Classification *
Research Universities (RU/VH) 1.0% 2.8% 5.8%
Research Universities (RU/H) -1.1% 4.0% 7.4%
Doctoral/Research Universities -2.0% 3.0% 6.8%
Master’s Colleges and Universities 5.2% 3.9% 5.8%
Other 7.1% 3.1% 8.4%
Degree Level
Doctoral -4.3% 0.2% N/A
Master’s/Other ** 3.8% 4.8% N/A
* See page 3 for information about the Carnegie Classification system. RU/VH = very high research activity. RU/H = high research activity.** Includes applications to graduate-level certificate and education specialist programs. Notes: Five- and ten-year trend data are unavailable for applications by level. N/A = Not available. S = Suppressed due to small number of institutional respondents in this category. Not all respondents provided applications data by level.Source: CGS/GRE Survey of Graduate Enrollment and Degrees

48 Council of Graduate Schools
Table C.2: Applications for Admission to Graduate School by Broad Field, 2005 to 2015Broad Field % Change,
2014 to 2015Average Annual
% Change, 2010 to 2015
Average Annual % Change,
2005 to 2015
Total 1.2% 3.2% 6.2%
Arts and Humanities -2.8% -2.8% 1.2%
Biological and Agricultural Sciences -0.3% 1.5% 5.1%
Business 0.0% 1.6% 6.4%
Education -0.9% -1.3% 0.4%
Engineering -0.7% 7.4% 10.3%
Health Sciences -1.9% 8.4% 16.6%
Mathematics and Computer Sciences 9.4% 18.1% 17.0%
Physical and Earth Sciences -3.1% 1.2% 3.6%
Public Administration and Services -0.9% 1.7% 4.4%
Social and Behavioral Sciences -1.3% -0.8% 2.0%
Other Fields 2.1% -1.9% 1.4%
Note: See Appendix B for the survey taxonomy.Source: CGS/GRE Survey of Graduate Enrollment and Degrees
Table C.3: Applications for Admission to Graduate School by Broad Field and Degree Level, 2010 to 2015
Doctoral Master’s/Other *
Broad Field % Change, 2014 to 2015
Average Annual % Change,
2010 to 2015
% Change, 2014 to 2015
Average Annual % Change,
2010 to 2015
Total -4.3% 0.2% 3.8% 4.8%
Arts and Humanities -2.7% -3.0% -2.9% -2.7%
Biological and Agricultural Sciences -1.1% 0.5% 0.7% 3.4%
Business -6.1% -3.4% 0.6% 2.2%
Education 4.0% 1.6% -2.0% -2.0%
Engineering -1.6% 0.2% -0.3% 12.8%
Health Sciences -12.3% 7.5% 2.9% 8.8%
Mathematics and Computer Sciences 3.8% 2.0% 11.2% 29.4%
Physical and Earth Sciences -1.7% 1.6% -8.0% -0.2%
Public Administration and Services -7.0% -2.0% -0.6% 2.0%
Social and Behavioral Sciences -2.0% -0.7% -0.3% -1.1%
Other Fields -0.2% -1.0% 2.6% -2.1%
* Includes applications to graduate-level certificate and education specialist programs. Notes: See Appendix B for the survey taxonomy. Ten-year trend data are unavailable for applications by level. Source: CGS/GRE Survey of Graduate Enrollment and Degrees

Graduate Enrollment and Degrees: 2005 to 2015 49
Table C.4: First-Time Graduate Enrollment by Institution Type and Carnegie Classification, 2005 to 2015Carnegie Classification and Institution Type * % Change,
2014 to 2015Average Annual
% Change, 2010 to 2015
Average Annual % Change,
2005 to 2015
Total 3.9% 1.7% 2.9%
Public 4.9% 2.1% 3.1%
Private, not-for-profit 1.8% 0.9% 2.5%
Private, for-profit S N/A N/A
Research Universities (RU/VH) 4.4% 2.4% 3.2%
Public 5.1% 2.0% 2.9%
Private, not-for-profit 2.8% 3.4% 4.0%
Private, for-profit N/A N/A N/A
Research Universities (RU/H) 5.8% 2.3% 3.8%
Public 7.2% 2.6% 3.8%
Private, not-for-profit 1.1% 1.1% 3.8%
Private, for-profit N/A N/A N/A
Doctoral/Research Universities 4.6% -0.2% 2.0%
Public 5.0% 2.1% 3.7%
Private, not-for-profit 4.0% -1.3% 0.9%
Private, for-profit S N/A N/A
Master’s Colleges and Universities 1.9% 1.0% 1.8%
Public 2.4% 1.7% 2.7%
Private, not-for-profit 0.9% -0.1% 0.4%
Private, for-profit N/A N/A N/A
Other -1.7% 0.3% 5.8%
Public 4.7% 5.5% 5.6%
Private, not-for-profit -6.1% -2.4% 6.1%
Private, for-profit N/A N/A N/A
* See page 3 for information about the Carnegie Classification system. RU/VH = very high research activity. RU/H = high research activity. Notes: N/A = Not available. S = Suppressed due to small number of institutional respondents in this category.Source: CGS/GRE Survey of Graduate Enrollment and Degrees

50 Council of Graduate Schools
Table C.5: First-Time Graduate Enrollment by Citizenship and Race/Ethnicity, 2005 to 2015Citizenship and Race/Ethnicity % Change,
2014 to 2015Average Annual
% Change, 2010 to 2015
Average Annual % Change,
2005 to 2015
Total 3.9% 1.7% 2.9%
U.S. Citizens and Permanent Residents 3.8% 0.5% 2.1%
American Indian/Alaska Native 3.4% -1.0% -0.9%
Asian/Pacific Islander * 4.6% 1.9% 4.1%
Black/African American 6.6% 3.7% 5.0%
Hispanic/Latino 7.6% 4.6% 7.5%
White 2.8% -0.6% 1.1%
Temporary Residents 5.7% 10.7% 9.4%
Other/Unknown ** -1.7% -4.5% -0.1%
* Includes Asians and Native Hawaiians/Other Pacific Islanders** Includes U.S. citizens and permanent residents of two or more races, U.S. citizens and permanent residents whose race/ethnicity is not known, and individuals whose citizenship is not known.Note: See page 2 for a description of each citizenship and race/ethnicity category. Source: CGS/GRE Survey of Graduate Enrollment and Degrees
Table C.6: First-Time Graduate Enrollment by Citizenship, Race/Ethnicity, and Gender, 2005 to 2015Men Women
Citizenship and Race/Ethnicity % Change, 2014 to 2015
Average Annual % Change,
2010 to 2015
Average Annual % Change,
2005 to 2015
% Change, 2014 to 2015
Average Annual % Change,
2010 to 2015
Average Annual % Change,
2005 to 2015
Total 3.1% 2.0% 3.2% 4.5% 1.4% 2.9%
U.S. Citizens and Permanent Residents 2.7% 0.1% 2.1% 4.5% 0.7% 2.3%
American Indian/Alaska Native 0.0% -1.0% -1.7% 5.4% -0.9% -0.7%
Asian/Pacific Islander * 2.3% 1.1% 3.4% 6.5% 2.6% 4.7%
Black/African American 5.8% 4.0% 5.6% 6.8% 3.5% 4.7%
Hispanic/Latino 6.5% 4.7% 7.9% 8.2% 4.4% 7.2%
White 1.9% -1.0% 1.1% 3.4% -0.4% 1.2%
Temporary Residents 5.2% 11.1% 9.2% 6.4% 10.0% 9.9%
Other/Unknown ** -2.9% -4.7% -0.8% -0.8% -4.3% 0.4%
* Includes Asians and Native Hawaiians/Other Pacific Islanders** Includes U.S. citizens and permanent residents of two or more races, U.S. citizens and permanent residents whose race/ethnicity is not known, and indi-viduals whose citizenship is not known.Note: See page 2 for a description of each citizenship and race/ethnicity category. Source: CGS/GRE Survey of Graduate Enrollment and Degrees
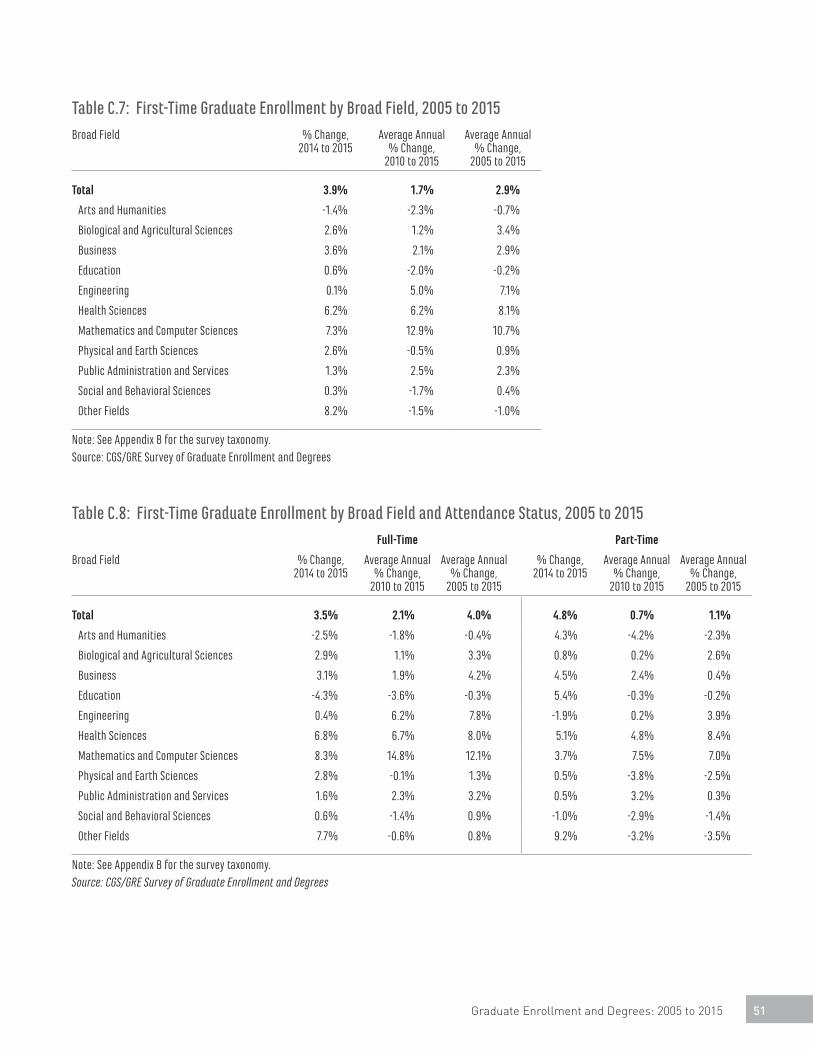
Graduate Enrollment and Degrees: 2005 to 2015 51
Table C.7: First-Time Graduate Enrollment by Broad Field, 2005 to 2015Broad Field % Change,
2014 to 2015Average Annual
% Change, 2010 to 2015
Average Annual % Change,
2005 to 2015
Total 3.9% 1.7% 2.9%
Arts and Humanities -1.4% -2.3% -0.7%
Biological and Agricultural Sciences 2.6% 1.2% 3.4%
Business 3.6% 2.1% 2.9%
Education 0.6% -2.0% -0.2%
Engineering 0.1% 5.0% 7.1%
Health Sciences 6.2% 6.2% 8.1%
Mathematics and Computer Sciences 7.3% 12.9% 10.7%
Physical and Earth Sciences 2.6% -0.5% 0.9%
Public Administration and Services 1.3% 2.5% 2.3%
Social and Behavioral Sciences 0.3% -1.7% 0.4%
Other Fields 8.2% -1.5% -1.0%
Note: See Appendix B for the survey taxonomy.Source: CGS/GRE Survey of Graduate Enrollment and Degrees
Table C.8: First-Time Graduate Enrollment by Broad Field and Attendance Status, 2005 to 2015Full-Time Part-Time
Broad Field % Change, 2014 to 2015
Average Annual % Change,
2010 to 2015
Average Annual % Change,
2005 to 2015
% Change, 2014 to 2015
Average Annual % Change,
2010 to 2015
Average Annual % Change,
2005 to 2015
Total 3.5% 2.1% 4.0% 4.8% 0.7% 1.1%
Arts and Humanities -2.5% -1.8% -0.4% 4.3% -4.2% -2.3%
Biological and Agricultural Sciences 2.9% 1.1% 3.3% 0.8% 0.2% 2.6%
Business 3.1% 1.9% 4.2% 4.5% 2.4% 0.4%
Education -4.3% -3.6% -0.3% 5.4% -0.3% -0.2%
Engineering 0.4% 6.2% 7.8% -1.9% 0.2% 3.9%
Health Sciences 6.8% 6.7% 8.0% 5.1% 4.8% 8.4%
Mathematics and Computer Sciences 8.3% 14.8% 12.1% 3.7% 7.5% 7.0%
Physical and Earth Sciences 2.8% -0.1% 1.3% 0.5% -3.8% -2.5%
Public Administration and Services 1.6% 2.3% 3.2% 0.5% 3.2% 0.3%
Social and Behavioral Sciences 0.6% -1.4% 0.9% -1.0% -2.9% -1.4%
Other Fields 7.7% -0.6% 0.8% 9.2% -3.2% -3.5%
Note: See Appendix B for the survey taxonomy.Source: CGS/GRE Survey of Graduate Enrollment and Degrees

52 Council of Graduate Schools
Table C.9: First-Time Graduate Enrollment by Broad Field and Citizenship, 2005 to 2015U.S. Citizens and Permanent Residents Temporary Residents
Broad Field % Change, 2014 to 2015
Average Annual % Change,
2010 to 2015
Average Annual % Change,
2005 to 2015
% Change, 2014 to 2015
Average Annual % Change,
2010 to 2015
Average Annual % Change,
2005 to 2015
Total 3.8% 0.5% 2.1% 5.7% 10.7% 9.4%
Arts and Humanities -2.2% -2.8% -0.9% 4.6% 5.7% 3.5%
Biological and Agricultural Sciences 3.4% 1.8% 3.8% 2.1% 1.0% 2.7%
Business 5.8% 1.7% 2.6% 0.2% 4.7% 7.1%
Education 0.8% -1.9% -0.4% 0.3% 3.7% 1.7%
Engineering -1.0% -1.0% 2.9% 1.0% 13.2% 12.4%
Health Sciences 5.9% 6.2% 9.6% 9.2% 5.2% 4.8%
Mathematics and Computer Sciences 1.2% 2.5% 3.6% 11.6% 26.4% 21.1%
Physical and Earth Sciences 3.3% -0.4% 0.8% 1.7% 0.9% 1.7%
Public Administration and Services 1.8% 2.8% 3.8% 5.1% 3.6% 3.4%
Social and Behavioral Sciences 0.3% -2.0% 0.4% 0.8% 3.4% 4.0%
Other Fields 6.9% -2.9% -1.7% 14.2% 10.5% 8.1%
Note: See Appendix B for the survey taxonomy.Source: CGS/GRE Survey of Graduate Enrollment and Degrees
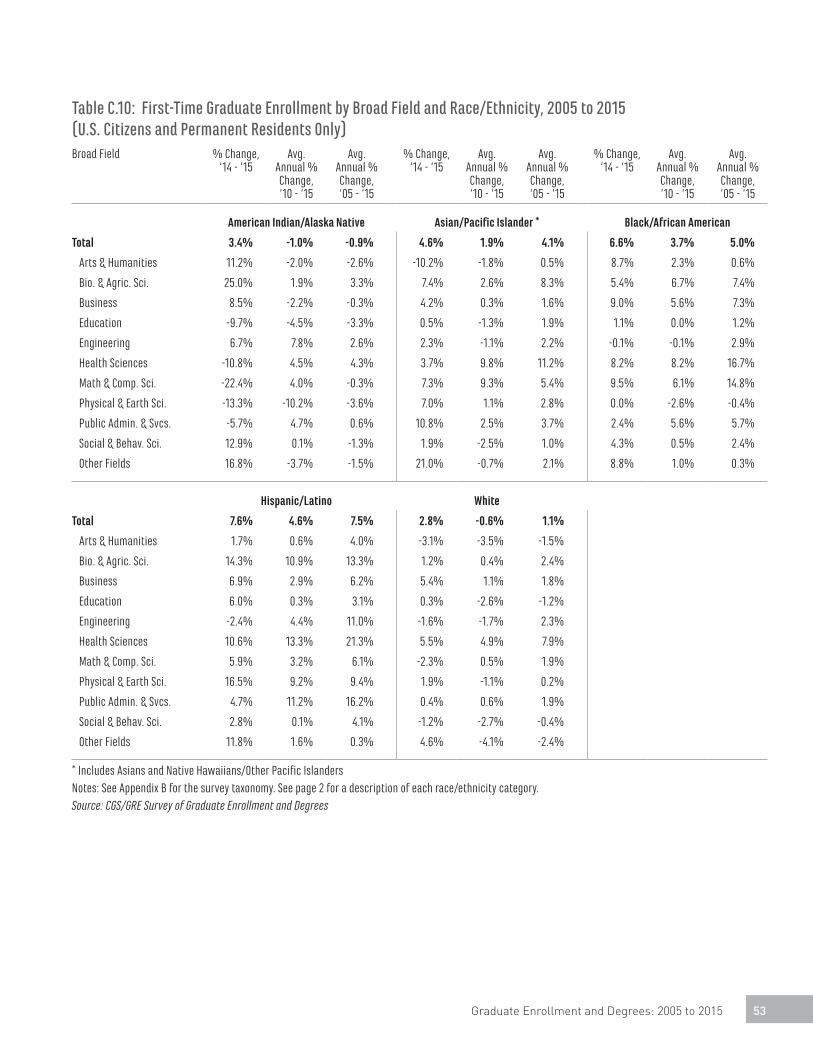
Graduate Enrollment and Degrees: 2005 to 2015 53
Table C.10: First-Time Graduate Enrollment by Broad Field and Race/Ethnicity, 2005 to 2015 (U.S. Citizens and Permanent Residents Only)Broad Field % Change,
‘14 - ‘15Avg.
Annual % Change, ‘10 - ‘15
Avg. Annual % Change, ‘05 - ‘15
% Change, ‘14 - ‘15
Avg. Annual % Change, ‘10 - ‘15
Avg. Annual % Change, ‘05 - ‘15
% Change, ‘14 - ‘15
Avg. Annual % Change, ‘10 - ‘15
Avg. Annual % Change, ‘05 - ‘15
American Indian/Alaska Native Asian/Pacific Islander * Black/African American
Total 3.4% -1.0% -0.9% 4.6% 1.9% 4.1% 6.6% 3.7% 5.0%
Arts & Humanities 11.2% -2.0% -2.6% -10.2% -1.8% 0.5% 8.7% 2.3% 0.6%
Bio. & Agric. Sci. 25.0% 1.9% 3.3% 7.4% 2.6% 8.3% 5.4% 6.7% 7.4%
Business 8.5% -2.2% -0.3% 4.2% 0.3% 1.6% 9.0% 5.6% 7.3%
Education -9.7% -4.5% -3.3% 0.5% -1.3% 1.9% 1.1% 0.0% 1.2%
Engineering 6.7% 7.8% 2.6% 2.3% -1.1% 2.2% -0.1% -0.1% 2.9%
Health Sciences -10.8% 4.5% 4.3% 3.7% 9.8% 11.2% 8.2% 8.2% 16.7%
Math & Comp. Sci. -22.4% 4.0% -0.3% 7.3% 9.3% 5.4% 9.5% 6.1% 14.8%
Physical & Earth Sci. -13.3% -10.2% -3.6% 7.0% 1.1% 2.8% 0.0% -2.6% -0.4%
Public Admin. & Svcs. -5.7% 4.7% 0.6% 10.8% 2.5% 3.7% 2.4% 5.6% 5.7%
Social & Behav. Sci. 12.9% 0.1% -1.3% 1.9% -2.5% 1.0% 4.3% 0.5% 2.4%
Other Fields 16.8% -3.7% -1.5% 21.0% -0.7% 2.1% 8.8% 1.0% 0.3%
Hispanic/Latino White
Total 7.6% 4.6% 7.5% 2.8% -0.6% 1.1%
Arts & Humanities 1.7% 0.6% 4.0% -3.1% -3.5% -1.5%
Bio. & Agric. Sci. 14.3% 10.9% 13.3% 1.2% 0.4% 2.4%
Business 6.9% 2.9% 6.2% 5.4% 1.1% 1.8%
Education 6.0% 0.3% 3.1% 0.3% -2.6% -1.2%
Engineering -2.4% 4.4% 11.0% -1.6% -1.7% 2.3%
Health Sciences 10.6% 13.3% 21.3% 5.5% 4.9% 7.9%
Math & Comp. Sci. 5.9% 3.2% 6.1% -2.3% 0.5% 1.9%
Physical & Earth Sci. 16.5% 9.2% 9.4% 1.9% -1.1% 0.2%
Public Admin. & Svcs. 4.7% 11.2% 16.2% 0.4% 0.6% 1.9%
Social & Behav. Sci. 2.8% 0.1% 4.1% -1.2% -2.7% -0.4%
Other Fields 11.8% 1.6% 0.3% 4.6% -4.1% -2.4%
* Includes Asians and Native Hawaiians/Other Pacific IslandersNotes: See Appendix B for the survey taxonomy. See page 2 for a description of each race/ethnicity category.Source: CGS/GRE Survey of Graduate Enrollment and Degrees

54 Council of Graduate Schools
Table C.11: First-Time Graduate Enrollment by Broad Field and Gender, 2005 to 2015Men Women
Broad Field % Change, 2014 to 2015
Average Annual % Change,
2010 to 2015
Average Annual % Change,
2005 to 2015
% Change, 2014 to 2015
Average Annual % Change,
2010 to 2015
Average Annual % Change,
2005 to 2015
Total 3.1% 2.0% 3.2% 4.5% 1.4% 2.9%
Arts and Humanities -1.9% -1.9% -0.5% -0.8% -2.6% -0.7%
Biological and Agricultural Sciences 2.5% 0.8% 3.4% 2.7% 1.5% 3.3%
Business 2.4% 1.5% 2.3% 5.1% 2.9% 3.7%
Education -0.8% -2.1% -0.3% 1.1% -2.0% -0.2%
Engineering -0.1% 4.6% 6.8% 0.3% 6.5% 8.7%
Health Sciences 4.4% 8.3% 8.0% 6.8% 5.6% 8.1%
Mathematics and Computer Sciences 6.6% 11.7% 9.6% 8.7% 15.6% 13.4%
Physical and Earth Sciences 1.9% -0.4% 1.0% 3.8% -0.7% 0.8%
Public Administration and Services 0.1% 2.4% 1.9% 1.7% 2.6% 2.4%
Social and Behavioral Sciences -1.2% -2.2% 0.2% 1.2% -1.4% 0.5%
Other Fields 9.2% -0.8% -0.3% 7.5% -1.9% -1.2%
Note: See Appendix B for the survey taxonomy.Source: CGS/GRE Survey of Graduate Enrollment and Degrees
Table C.12: Doctorate-Level First-Time Enrollment by Broad Field and Gender, 2010 to 2015% Change, 2014 to 2015 Average Annual % Change, 2010 to 2015
Broad Field Total Men Women Total Men Women
Total 2.4% 1.9% 2.9% 1.4% 1.0% 1.7%
Arts and Humanities 0.1% 2.5% -2.2% -0.8% 0.0% -1.6%
Biological and Agricultural Sciences 3.0% -0.7% 6.6% -0.4% -0.8% -0.1%
Business -0.1% 0.7% -1.0% 0.9% 0.9% 0.9%
Education 2.9% 6.3% 1.3% 0.5% 2.6% -0.5%
Engineering -2.3% -3.1% 0.2% 1.7% 1.5% 2.3%
Health Sciences 2.8% 1.5% 3.4% 8.4% 10.3% 7.7%
Mathematics and Computer Sciences -0.7% 0.4% -3.5% 1.7% 1.1% 3.3%
Physical and Earth Sciences 2.9% 1.7% 5.0% 0.4% 0.0% 1.0%
Public Administration and Services -2.7% 2.7% -5.4% 1.4% 1.9% 1.2%
Social and Behavioral Sciences -1.3% -3.6% 0.5% -1.2% -1.6% -0.8%
Other Fields 5.0% 3.9% 5.9% 1.8% 1.7% 1.8%
Notes: See Appendix B for the survey taxonomy. Ten-year trend data are unavailable for first-time graduate enrollment by level.Source: CGS/GRE Survey of Graduate Enrollment and Degrees

Graduate Enrollment and Degrees: 2005 to 2015 55
Table C.13 Master’s-Level First-Time Enrollment by Broad Field and Gender, 2010 to 2015 *% Change, 2014 to 2015 Average Annual % Change, 2010 to 2015
Broad Field Total Men Women Total Men Women
Total 4.0% 3.2% 4.6% 1.8% 2.3% 1.4%
Arts and Humanities -1.6% -3.3% -0.7% -2.7% -2.6% -2.8%
Biological and Agricultural Sciences 2.2% 4.2% 0.6% 2.3% 2.0% 2.6%
Business 4.1% 2.8% 5.8% 2.2% 1.5% 3.0%
Education 0.1% -2.1% 0.8% -2.3% -2.7% -2.1%
Engineering 0.6% 0.7% 0.4% 6.1% 5.5% 8.0%
Health Sciences 7.0% 5.2% 7.5% 5.7% 7.6% 5.2%
Mathematics and Computer Sciences 8.6% 7.7% 10.5% 15.8% 14.7% 18.1%
Physical and Earth Sciences 2.0% 1.8% 2.7% -1.7% -1.1% -2.5%
Public Administration and Services 1.4% -0.1% 1.8% 2.6% 2.4% 2.6%
Social and Behavioral Sciences 0.9% -0.1% 1.4% -1.9% -2.4% -1.6%
Other Fields 8.3% 9.5% 7.6% -1.7% -1.0% -2.1%
* Includes first-time enrollment in graduate-level certificate and education specialist programs.Notes: See Appendix B for the survey taxonomy. Ten-year trend data are unavailable for first-time graduate enrollment by level.Source: CGS/GRE Survey of Graduate Enrollment and Degrees
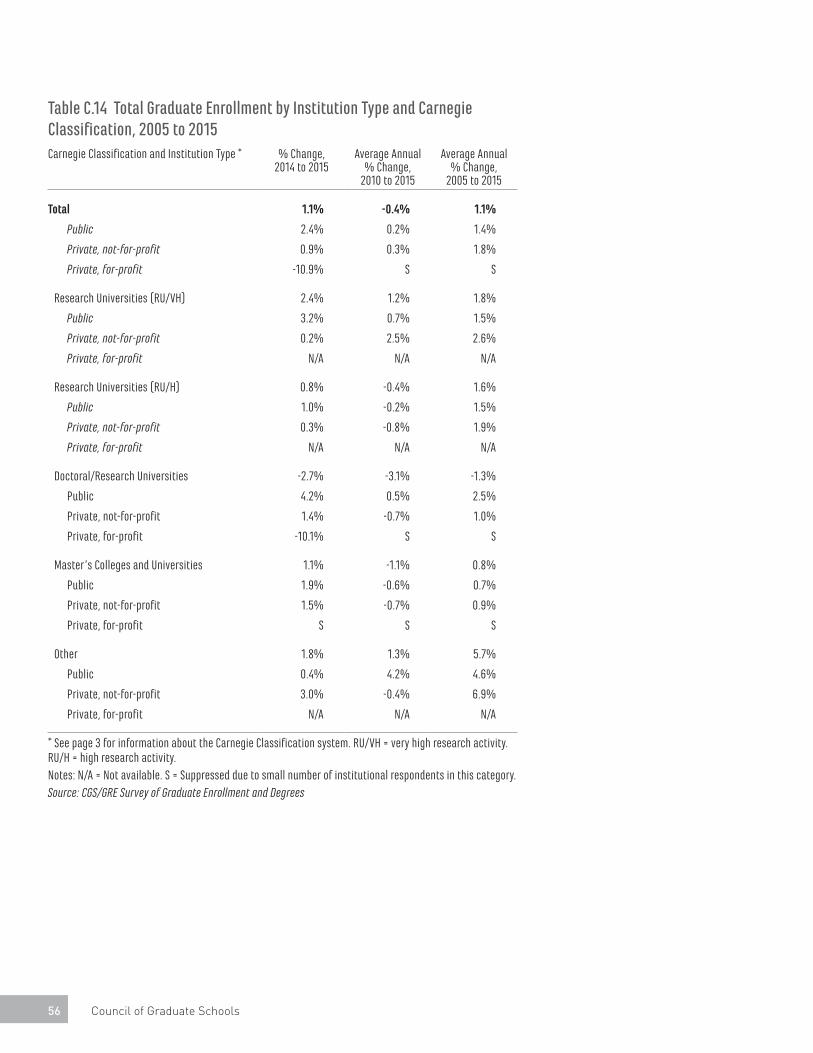
56 Council of Graduate Schools
Table C.14 Total Graduate Enrollment by Institution Type and Carnegie Classification, 2005 to 2015Carnegie Classification and Institution Type * % Change,
2014 to 2015Average Annual
% Change, 2010 to 2015
Average Annual % Change,
2005 to 2015
Total 1.1% -0.4% 1.1%
Public 2.4% 0.2% 1.4%
Private, not-for-profit 0.9% 0.3% 1.8%
Private, for-profit -10.9% S S
Research Universities (RU/VH) 2.4% 1.2% 1.8%
Public 3.2% 0.7% 1.5%
Private, not-for-profit 0.2% 2.5% 2.6%
Private, for-profit N/A N/A N/A
Research Universities (RU/H) 0.8% -0.4% 1.6%
Public 1.0% -0.2% 1.5%
Private, not-for-profit 0.3% -0.8% 1.9%
Private, for-profit N/A N/A N/A
Doctoral/Research Universities -2.7% -3.1% -1.3%
Public 4.2% 0.5% 2.5%
Private, not-for-profit 1.4% -0.7% 1.0%
Private, for-profit -10.1% S S
Master’s Colleges and Universities 1.1% -1.1% 0.8%
Public 1.9% -0.6% 0.7%
Private, not-for-profit 1.5% -0.7% 0.9%
Private, for-profit S S S
Other 1.8% 1.3% 5.7%
Public 0.4% 4.2% 4.6%
Private, not-for-profit 3.0% -0.4% 6.9%
Private, for-profit N/A N/A N/A
* See page 3 for information about the Carnegie Classification system. RU/VH = very high research activity. RU/H = high research activity. Notes: N/A = Not available. S = Suppressed due to small number of institutional respondents in this category.Source: CGS/GRE Survey of Graduate Enrollment and Degrees
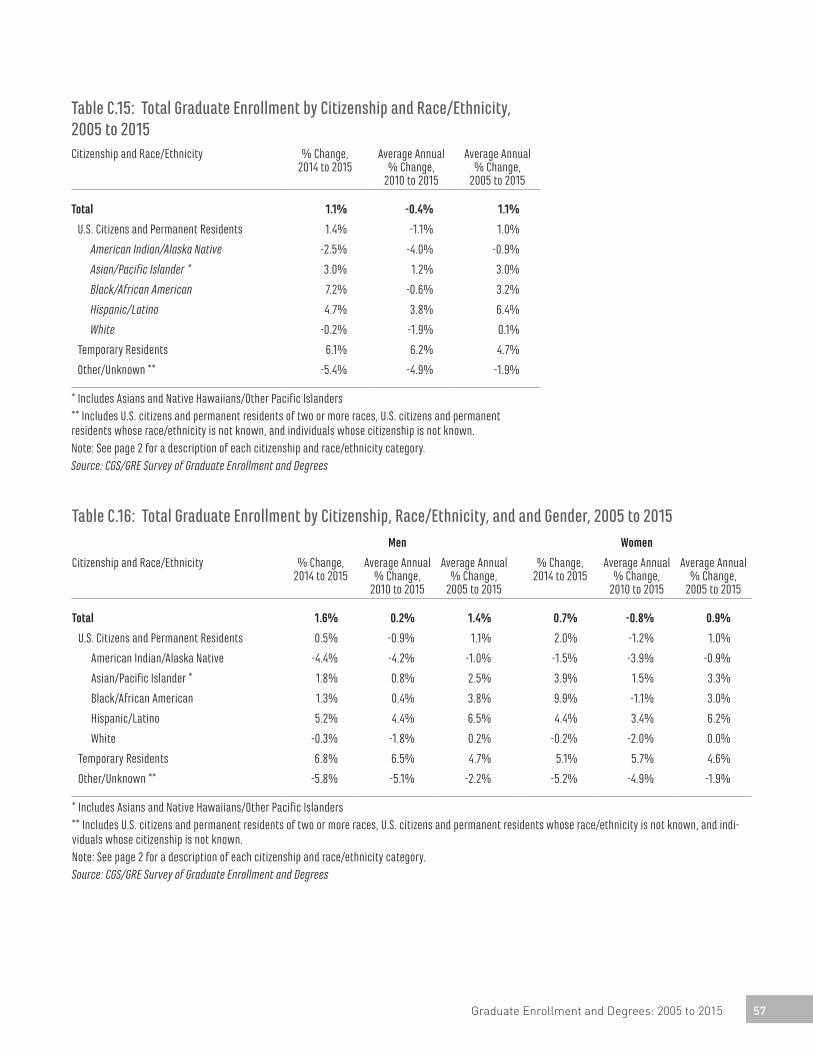
Graduate Enrollment and Degrees: 2005 to 2015 57
Table C.15: Total Graduate Enrollment by Citizenship and Race/Ethnicity, 2005 to 2015Citizenship and Race/Ethnicity % Change,
2014 to 2015Average Annual
% Change, 2010 to 2015
Average Annual % Change,
2005 to 2015
Total 1.1% -0.4% 1.1%
U.S. Citizens and Permanent Residents 1.4% -1.1% 1.0%
American Indian/Alaska Native -2.5% -4.0% -0.9%
Asian/Pacific Islander * 3.0% 1.2% 3.0%
Black/African American 7.2% -0.6% 3.2%
Hispanic/Latino 4.7% 3.8% 6.4%
White -0.2% -1.9% 0.1%
Temporary Residents 6.1% 6.2% 4.7%
Other/Unknown ** -5.4% -4.9% -1.9%
* Includes Asians and Native Hawaiians/Other Pacific Islanders** Includes U.S. citizens and permanent residents of two or more races, U.S. citizens and permanent residents whose race/ethnicity is not known, and individuals whose citizenship is not known.Note: See page 2 for a description of each citizenship and race/ethnicity category.Source: CGS/GRE Survey of Graduate Enrollment and Degrees
Table C.16: Total Graduate Enrollment by Citizenship, Race/Ethnicity, and and Gender, 2005 to 2015Men Women
Citizenship and Race/Ethnicity % Change, 2014 to 2015
Average Annual % Change,
2010 to 2015
Average Annual % Change,
2005 to 2015
% Change, 2014 to 2015
Average Annual % Change,
2010 to 2015
Average Annual % Change,
2005 to 2015
Total 1.6% 0.2% 1.4% 0.7% -0.8% 0.9%
U.S. Citizens and Permanent Residents 0.5% -0.9% 1.1% 2.0% -1.2% 1.0%
American Indian/Alaska Native -4.4% -4.2% -1.0% -1.5% -3.9% -0.9%
Asian/Pacific Islander * 1.8% 0.8% 2.5% 3.9% 1.5% 3.3%
Black/African American 1.3% 0.4% 3.8% 9.9% -1.1% 3.0%
Hispanic/Latino 5.2% 4.4% 6.5% 4.4% 3.4% 6.2%
White -0.3% -1.8% 0.2% -0.2% -2.0% 0.0%
Temporary Residents 6.8% 6.5% 4.7% 5.1% 5.7% 4.6%
Other/Unknown ** -5.8% -5.1% -2.2% -5.2% -4.9% -1.9%
* Includes Asians and Native Hawaiians/Other Pacific Islanders** Includes U.S. citizens and permanent residents of two or more races, U.S. citizens and permanent residents whose race/ethnicity is not known, and indi-viduals whose citizenship is not known.Note: See page 2 for a description of each citizenship and race/ethnicity category.Source: CGS/GRE Survey of Graduate Enrollment and Degrees

58 Council of Graduate Schools
Table C.17: Total Graduate Enrollment by Broad Field, 2005 to 2015Broad Field % Change,
2014 to 2015Average Annual
% Change, 2010 to 2015
Average Annual % Change,
2005 to 2015
Total 1.1% -0.4% 1.1%
Arts and Humanities -3.1% -2.4% -0.9%
Biological and Agricultural Sciences 1.5% 0.8% 2.2%
Business 0.4% -0.8% 2.1%
Education -1.0% -3.5% -1.4%
Engineering 2.2% 3.3% 4.4%
Health Sciences 3.4% 6.1% 7.7%
Mathematics and Computer Sciences 9.0% 9.5% 6.7%
Physical and Earth Sciences -0.5% 0.4% 0.9%
Public Administration and Services 1.5% 2.4% 1.9%
Social and Behavioral Sciences -1.6% -1.3% 0.3%
Other Fields 4.0% -2.4% -1.3%
Note: See Appendix B for the survey taxonomy.Source: CGS/GRE Survey of Graduate Enrollment and Degrees
Table C.18: Total Graduate Enrollment by Broad Field and Attendance Status, 2005 to 2015Full-Time Part-Time
Broad Field % Change, 2014 to 2015
Average Annual % Change,
2010 to 2015
Average Annual % Change,
2005 to 2015
% Change, 2014 to 2015
Average Annual % Change,
2010 to 2015
Average Annual % Change,
2005 to 2015
Total 0.7% 0.2% 2.0% 1.6% -1.3% 0.0%
Arts and Humanities -2.5% -1.7% -0.1% -4.6% -4.1% -2.5%
Biological and Agricultural Sciences 1.7% 0.8% 2.4% 1.0% 0.1% 0.8%
Business 0.3% 0.4% 3.1% 0.5% -2.0% 0.8%
Education -3.8% -4.1% -0.8% 0.9% -3.2% -1.7%
Engineering 2.6% 4.6% 5.1% 0.9% 0.2% 2.1%
Health Sciences 4.5% 6.1% 7.4% 1.7% 5.9% 7.9%
Mathematics and Computer Sciences 8.0% 10.9% 7.9% 11.0% 7.2% 4.7%
Physical and Earth Sciences 0.2% 1.0% 1.5% -4.3% -2.8% -1.9%
Public Administration and Services 0.7% 3.0% 3.4% 2.9% 1.5% -0.2%
Social and Behavioral Sciences -0.9% -0.8% 0.9% -3.1% -2.3% -1.1%
Other Fields 4.4% -1.4% 0.4% 3.5% -3.6% -3.0%
Note: See Appendix B for the survey taxonomy.Source: CGS/GRE Survey of Graduate Enrollment and Degrees

Graduate Enrollment and Degrees: 2005 to 2015 59
Table C.19: Total Graduate Enrollment by Broad Field and Citizenship, 2005 to 2015U.S. Citizens and Permanent Residents Temporary Residents
Broad Field % Change, 2014 to 2015
Average Annual % Change,
2010 to 2015
Average Annual % Change,
2005 to 2015
% Change, 2014 to 2015
Average Annual % Change,
2010 to 2015
Average Annual % Change,
2005 to 2015
Total 1.4% -1.1% 1.0% 6.1% 6.2% 4.7%
Arts and Humanities -3.9% -2.8% -1.2% 3.5% 2.5% 1.6%
Biological and Agricultural Sciences 1.8% 1.3% 2.6% 1.8% 0.2% 1.4%
Business 1.4% -0.8% 2.1% -0.2% 3.0% 4.9%
Education -0.6% -3.5% -1.4% -1.5% 1.0% 0.6%
Engineering -1.2% -0.2% 2.1% 5.1% 8.3% 7.0%
Health Sciences 3.5% 6.2% 10.1% 5.6% 3.0% 3.0%
Mathematics and Computer Sciences 3.3% 3.7% 2.8% 14.2% 17.5% 12.3%
Physical and Earth Sciences -0.4% 0.7% 1.3% 0.4% 1.1% 0.5%
Public Administration and Services 2.3% 2.7% 3.6% 3.5% 2.9% 2.6%
Social and Behavioral Sciences -1.8% -1.3% 0.5% -0.1% 1.7% 1.8%
Other Fields 3.1% -3.2% -2.0% 10.8% 7.1% 5.2%
Note: See Appendix B for the survey taxonomy.Source: CGS/GRE Survey of Graduate Enrollment and Degrees

60 Council of Graduate Schools
Table C.20: Total Graduate Enrollment by Broad Field and Race/Ethnicity, 2005 to 2015 (U.S. Citizens and Permanent Residents Only)Broad Field % Change,
‘14 - ‘15Avg.
Annual % Change, ‘10 - ‘15
Avg. Annual % Change, ‘05 - ‘15
% Change, ‘14 - ‘15
Avg. Annual % Change, ‘10 - ‘15
Avg. Annual % Change, ‘05 - ‘15
% Change, ‘14 - ‘15
Avg. Annual % Change, ‘10 - ‘15
Avg. Annual % Change, ‘05 - ‘15
American Indian/Alaska Native Asian/Pacific Islander * Black/African American
Total -2.5% -4.0% -0.9% 3.0% 1.2% 3.0% 7.2% -0.6% 3.2%
Arts & Humanities -1.6% -5.6% -2.6% -11.2% -1.0% 0.1% 0.6% -1.3% -0.6%
Bio. & Agric. Sci. -3.1% -2.1% 0.1% 5.1% 2.6% 5.6% 1.0% 2.2% 5.5%
Business 3.4% -4.2% -0.2% -0.5% -1.8% 1.3% 0.1% -1.0% 6.9%
Education -8.5% -4.3% -2.9% 2.0% -0.8% 1.5% -1.0% -2.1% 0.3%
Engineering 0.5% -2.7% -0.5% -1.3% -0.4% 1.0% -0.7% 0.1% 2.1%
Health Sciences 0.7% 1.1% 5.0% 4.5% 9.3% 12.8% 5.6% 9.4% 18.6%
Math & Comp. Sci. -40.4% -3.1% -0.8% 10.3% 7.3% 2.2% 9.6% 7.9% 11.0%
Physical & Earth Sci. -0.0% -3.8% -0.4% 2.0% 2.7% 3.6% -5.8% -2.8% -0.3%
Public Admin. & Svcs. -1.2% 0.2% 0.2% 4.6% 2.2% 4.0% 4.9% 4.8% 6.8%
Social & Behav. Sci. -1.2% -3.4% -1.6% 2.6% -0.7% 1.5% 0.1% -0.3% 1.5%
Other Fields 4.5% -4.9% -2.1% 6.7% -1.6% 0.2% 6.3% 0.4% -0.3%
Hispanic/Latino White
Total 4.7% 3.8% 6.4% -0.2% -1.9% 0.1%
Arts & Humanities 1.2% 2.2% 3.3% -4.4% -3.5% -1.7%
Bio. & Agric. Sci. 8.1% 8.9% 10.1% 0.8% 0.5% 1.6%
Business 4.9% 3.5% 8.4% 1.5% -1.2% 0.9%
Education 4.0% 1.3% 3.0% -1.2% -4.4% -2.2%
Engineering 1.9% 6.6% 9.0% -1.6% -0.9% 1.7%
Health Sciences 8.9% 13.1% 18.9% 2.5% 4.9% 8.3%
Math & Comp. Sci. 6.2% 8.9% 9.4% 0.7% 1.9% 1.7%
Physical & Earth Sci. 8.3% 9.1% 8.3% -1.2% 0.1% 0.7%
Public Admin. & Svcs. 5.3% 10.7% 12.4% 0.3% 0.8% 1.8%
Social & Behav. Sci. 1.9% 3.2% 5.6% -3.2% -2.1% -0.3%
Other Fields 8.2% 1.6% -0.2% 1.5% -4.2% -2.6%
* Includes Asians and Native Hawaiians/Other Pacific IslandersNotes: See Appendix B for the survey taxonomy. See page 2 for a description of each race/ethnicity category.Source: CGS/GRE Survey of Graduate Enrollment and Degrees
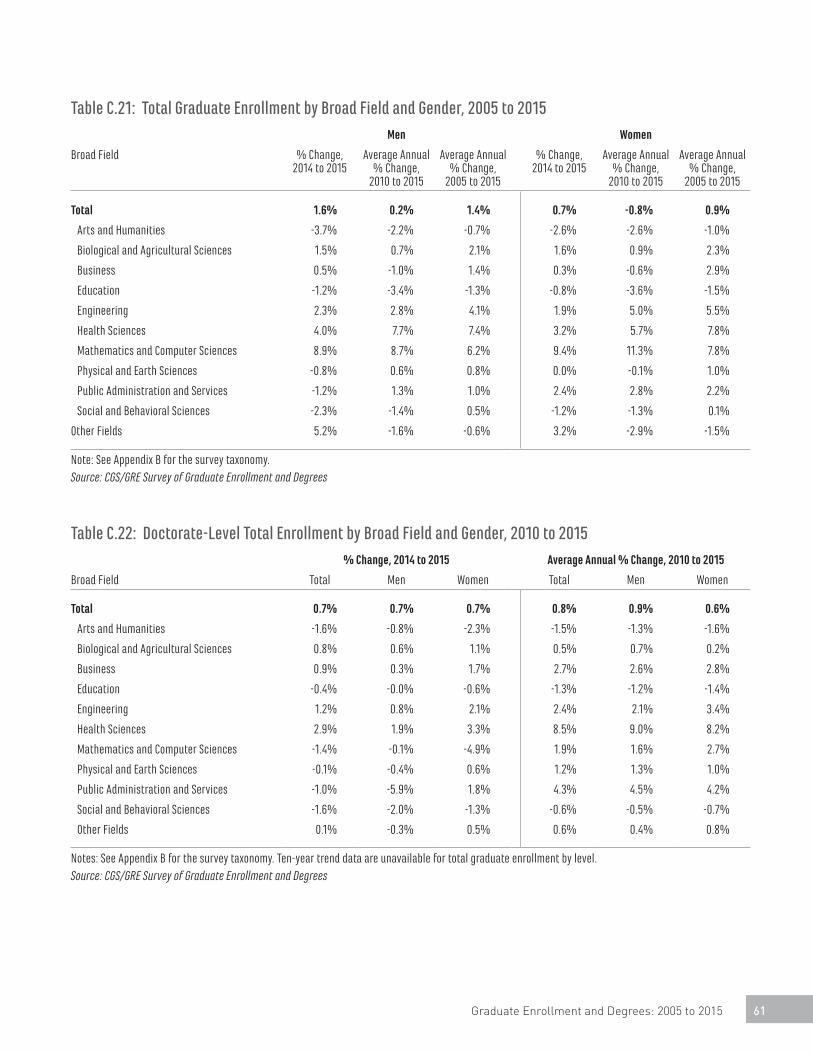
Graduate Enrollment and Degrees: 2005 to 2015 61
Table C.21: Total Graduate Enrollment by Broad Field and Gender, 2005 to 2015Men Women
Broad Field % Change, 2014 to 2015
Average Annual % Change,
2010 to 2015
Average Annual % Change,
2005 to 2015
% Change, 2014 to 2015
Average Annual % Change,
2010 to 2015
Average Annual % Change,
2005 to 2015
Total 1.6% 0.2% 1.4% 0.7% -0.8% 0.9%
Arts and Humanities -3.7% -2.2% -0.7% -2.6% -2.6% -1.0%
Biological and Agricultural Sciences 1.5% 0.7% 2.1% 1.6% 0.9% 2.3%
Business 0.5% -1.0% 1.4% 0.3% -0.6% 2.9%
Education -1.2% -3.4% -1.3% -0.8% -3.6% -1.5%
Engineering 2.3% 2.8% 4.1% 1.9% 5.0% 5.5%
Health Sciences 4.0% 7.7% 7.4% 3.2% 5.7% 7.8%
Mathematics and Computer Sciences 8.9% 8.7% 6.2% 9.4% 11.3% 7.8%
Physical and Earth Sciences -0.8% 0.6% 0.8% 0.0% -0.1% 1.0%
Public Administration and Services -1.2% 1.3% 1.0% 2.4% 2.8% 2.2%
Social and Behavioral Sciences -2.3% -1.4% 0.5% -1.2% -1.3% 0.1%
Other Fields 5.2% -1.6% -0.6% 3.2% -2.9% -1.5%
Note: See Appendix B for the survey taxonomy.Source: CGS/GRE Survey of Graduate Enrollment and Degrees
Table C.22: Doctorate-Level Total Enrollment by Broad Field and Gender, 2010 to 2015% Change, 2014 to 2015 Average Annual % Change, 2010 to 2015
Broad Field Total Men Women Total Men Women
Total 0.7% 0.7% 0.7% 0.8% 0.9% 0.6%
Arts and Humanities -1.6% -0.8% -2.3% -1.5% -1.3% -1.6%
Biological and Agricultural Sciences 0.8% 0.6% 1.1% 0.5% 0.7% 0.2%
Business 0.9% 0.3% 1.7% 2.7% 2.6% 2.8%
Education -0.4% -0.0% -0.6% -1.3% -1.2% -1.4%
Engineering 1.2% 0.8% 2.1% 2.4% 2.1% 3.4%
Health Sciences 2.9% 1.9% 3.3% 8.5% 9.0% 8.2%
Mathematics and Computer Sciences -1.4% -0.1% -4.9% 1.9% 1.6% 2.7%
Physical and Earth Sciences -0.1% -0.4% 0.6% 1.2% 1.3% 1.0%
Public Administration and Services -1.0% -5.9% 1.8% 4.3% 4.5% 4.2%
Social and Behavioral Sciences -1.6% -2.0% -1.3% -0.6% -0.5% -0.7%
Other Fields 0.1% -0.3% 0.5% 0.6% 0.4% 0.8%
Notes: See Appendix B for the survey taxonomy. Ten-year trend data are unavailable for total graduate enrollment by level.Source: CGS/GRE Survey of Graduate Enrollment and Degrees

62 Council of Graduate Schools
Table C.23: Master’s-Level Total Enrollment by Broad Field and Gender, 2010 to 2015 *% Change, 2014 to 2015 Average Annual % Change, 2010 to 2015
Broad Field Total Men Women Total Men Women
Total 1.2% 2.0% 0.7% -0.8% -0.1% -1.2%
Arts and Humanities -4.1% -6.0% -2.9% -3.0% -2.9% -3.2%
Biological and Agricultural Sciences 2.5% 2.8% 2.3% 1.3% 0.8% 1.8%
Business 0.7% 0.8% 0.6% -1.0% -1.1% -0.8%
Education -1.1% -1.6% -0.9% -4.1% -4.1% -4.1%
Engineering 2.9% 3.2% 1.7% 3.8% 3.2% 6.2%
Health Sciences 3.4% 5.1% 3.0% 5.4% 7.0% 5.0%
Mathematics and Computer Sciences 12.8% 12.4% 13.7% 13.5% 12.7% 14.8%
Physical and Earth Sciences -1.9% -2.6% -1.1% -1.9% -1.5% -2.5%
Public Administration and Services 1.7% -0.6% 2.4% 2.3% 0.9% 2.7%
Social and Behavioral Sciences -1.6% -2.5% -1.1% -1.8% -2.1% -1.7%
Other Fields 4.8% 6.5% 3.7% -2.9% -2.0% -3.4%
* Includes first-time enrollment in graduate-level certificate and education specialist programs.Notes: See Appendix B for the survey taxonomy. Ten-year trend data are unavailable for total graduate enrollment by level.Source: CGS/GRE Survey of Graduate Enrollment and Degrees
Table C.24: Graduate Degrees and Certificates Awarded by Degree Level and Institution Type, 2004-05 to 2014-15Degree Level and Institution Type % Change,
‘13-14 to ‘14-15Average Annual
% Change, ‘09-10 to ‘14-15
Average Annual % Change,
‘04-05 to ‘14-15
Doctoral Degrees 3.5% 4.4% 5.3%
Public 4.6% 4.8% 5.3%
Private, not-for-profit 2.5% 3.3% 4.7%
Private, for-profit S S S
Master’s Degrees 0.5% 1.1% 2.4%
Public 1.6% 1.8% 2.3%
Private, not-for-profit 0.5% 2.0% 2.9%
Private, for-profit -10.5% S S
Graduate-Level Certificates 3.5% 4.4% N/A
Public 0.3% 10.4% N/A
Private, not-for-profit 10.5% -1.4% N/A
Private, for-profit S S N/A
Notes: N/A = Not available. S = Suppressed due to small number of institutional respondents in this category. Ten-year trend data are unavailable for graduate-level certificates.Source: CGS/GRE Survey of Graduate Enrollment and Degrees

Graduate Enrollment and Degrees: 2005 to 2015 63
Table C.25: Graduate Degrees and Certificates Awarded by Degree Level and Carnegie Classification, 2004-05 to 2014-15Degree Level and Carnegie Classification * % Change,
‘13-14 to ‘14-15Average Annual
% Change, ‘09-10 to ‘14-15
Average Annual % Change,
‘04-05 to ‘14-15
Doctoral Degrees 3.5% 4.4% 5.3%
Research Universities (RU/VH) 1.4% 2.3% 3.5%
Research Universities (RU/H) 6.2% 6.1% 7.5%
Doctoral/Research Universities 3.9% 6.0% 9.7%
Master’s Colleges and Universities 5.8% 18.4% 19.0%
Other 18.0% 13.4% 13.5%
Master’s Degrees 0.5% 1.1% 2.4%
Research Universities (RU/VH) 2.2% 3.1% 2.9%
Research Universities (RU/H) 2.4% 2.4% 2.8%
Doctoral/Research Universities -2.9% -3.4% 1.3%
Master’s Colleges and Universities -1.7% 0.5% 1.6%
Other 2.8% 3.2% 7.4%
Graduate-Level Certificates 3.5% 4.4% N/A
Research Universities (RU/VH) -15.2% 8.3% N/A
Research Universities (RU/H) 15.7% 1.4% N/A
Doctoral/Research Universities 18.1% -1.9% N/A
Master’s Colleges and Universities 9.8% 9.1% N/A
Other -27.9% -3.6% N/A
* See page 3 for information about the Carnegie Classification system. RU/VH = very high research activity. RU/H = high research activity.Notes: N/A = Not available. Ten-year trend data are unavailable for graduate-level certificates.Source: CGS/GRE Survey of Graduate Enrollment and Degrees

64 Council of Graduate Schools
Table C.26: Graduate Degrees and Certificates Awarded by Degree Level, Institution Type, and Gender, 2004-05 to 2014-15
Men Women
Degree Level and Institution Type % Change, ‘13-14 to
‘14-15
Average Annual % Change, ‘09-10 to
‘14-15
Average Annual % Change, ‘04-05 to
‘14-15
% Change, ‘13-14 to
‘14-15
Average Annual % Change, ‘09-10 to
‘14-15
Average Annual % Change, ‘04-05 to
‘14-15
Doctoral Degrees 4.5% 4.7% 0.3% 1.3% 4.3% 6.4%
Public 5.9% 5.2% 0.3% 2.8% 4.7% 6.4%
Private, not-for-profit 2.5% 3.4% 0.3% -2.0% 3.2% 5.3%
Private, for-profit S S S S S S
Master’s Degrees 1.8% 1.9% 2.6% -0.5% 0.5% 2.4%
Public 3.2% 3.0% 2.9% 0.4% 1.0% 2.0%
Private, not-for-profit 1.4% 1.9% 2.7% -0.1% 2.1% 3.5%
Private, for-profit -12.8% -6.8% S -9.5% -6.5% S
Graduate-Level Certificates 5.3% 3.9% N/A 11.3% 4.1% N/A
Public 11.6% 9.8% N/A 7.6% 9.7% N/A
Private, not-for-profit -5.6% -1.8% N/A 21.3% -1.2% N/A
Private, for-profit S S N/A S S N/A
Notes: N/A = Not available. S = Suppressed due to small number of institutional respondents in this category. Ten-year trend data are unavailable for graduate-level certificates.Source: CGS/GRE Survey of Graduate Enrollment and Degrees

Graduate Enrollment and Degrees: 2005 to 2015 65
Table C.27: Graduate Degrees and Certificates Awarded by Degree Level, Carnegie Classification, and Gender, 2004-05 to 2014-15
Men Women
Degree Level and Carnegie Classification * % Change, ‘13-14 to
‘14-15
Average Annual % Change, ‘09-10 to
‘14-15
Average Annual % Change, ‘04-05 to
‘14-15
% Change, ‘13-14 to
‘14-15
Average Annual % Change, ‘09-10 to
‘14-15
Average Annual % Change, ‘04-05 to
‘14-15
Doctoral Degrees 4.5% 4.7% 4.2% 2.6% 4.3% 6.4%
Research Universities (RU/VH) 1.7% 2.8% 2.9% 1.1% 1.9% 4.2%
Research Universities (RU/H) 10.1% 7.3% 7.6% 2.9% 5.2% 7.6%
Doctoral/Research Universities 2.8% 6.1% 6.8% 4.5% 6.0% 12.5%
Master’s Colleges and Universities 9.2% 22.4% 14.7% 4.6% 17.1% 17.6%
Other 30.6% 14.2% 9.4% 10.7% 12.9% 17.2%
Master’s Degrees 1.8% 1.9% 2.6% -0.5% 0.5% 2.4%
Research Universities (RU/VH) 1.3% 3.3% 2.9% 3.0% 2.9% 3.0%
Research Universities (RU/H) 4.6% 3.5% 3.3% 0.9% 1.7% 2.4%
Doctoral/Research Universities -1.9% -3.2% 0.2% -3.4% -3.5% 2.0%
Master’s Colleges and Universities 1.7% 1.5% 2.4% -3.5% -0.1% 1.6%
Other 7.1% 2.5% 7.0% 0.6% 3.6% 7.7%
Graduate-Level Certificates 5.3% 3.9% N/A 11.3% 4.1% N/A
Research Universities (RU/VH) 3.9% 7.5% N/A 10.3% 8.0% N/A
Research Universities (RU/H) 21.7% 5.4% N/A 12.5% -0.2% N/A
Doctoral/Research Universities 19.9% -6.9% N/A 2.5% -1.4% N/A
Master’s Colleges and Universities 2.6% 10.8% N/A 14.9% 8.5% N/A
Other -55.7% -8.8% N/A 1.2% 1.2% N/A
* See page 3 for information about the Carnegie Classification system. RU/VH = very high research activity. RU/H = high research activity.Notes: N/A = Not available. Ten-year trend data are unavailable for graduate-level certificates.Source: CGS/GRE Survey of Graduate Enrollment and Degrees

66 Council of Graduate Schools
Table C.28: Graduate-Level Certificates Awarded by Broad Field and Gender, 2009-10 to 2014-15Total Men Women
Broad Field % Change, 2013-14 to
2014-15
% Change, 2009-10 to
2014-15
% Change, 2013-14 to
2014-15
% Change, 2009-10 to
2014-15
% Change, 2013-14 to
2014-15
% Change, 2009-10 to
2014-15
Total 3.5% 4.4% 5.3% 3.9% 11.3% 4.1%
Arts and Humanities -22.1% 2.1% -8.6% 8.1% -10.8% -0.8%
Biological and Agricultural Sciences -18.2% 25.6% -11.9% 22.2% -12.5% 27.4%
Business -4.8% 2.3% 16.3% -0.4% 15.6% 5.1%
Education 1.0% -1.7% 8.9% -1.5% 5.7% -1.8%
Engineering 5.3% 9.3% 26.5% 11.5% 10.9% 3.3%
Health Sciences 5.2% 13.8% 11.0% 12.5% 11.0% 14.1%
Mathematics and Computer Sciences 6.5% 17.1% 2.2% 16.8% 27.7% 17.6%
Physical and Earth Sciences 31.9% 19.4% 52.5% 20.2% 98.4% 18.3%
Public Administration and Services -20.2% 4.4% -9.6% 2.1% -19.8% 4.6%
Social and Behavioral Sciences -4.4% -5.4% -5.7% -2.3% 2.9% -6.8%
Other Fields 8.3% 5.9% 20.4% 13.2% 6.1% 2.4%
Notes: See Appendix B for the survey taxonomy. Ten-year trend data are unavailable for graduate-level certificates.Source: CGS/GRE Survey of Graduate Enrollment and Degrees
Table C.29: Master’s Degrees Awarded by Broad Field and Gender, 2004-05 to 2014-15Total Men Women
Broad Field % Change, ‘13/14 - ‘14/15
Avg. Annual % Change, ‘09/10 - ‘14/15
Avg. Annual % Change, ‘04/05 - ‘14/15
% Change, ‘13/14 - ‘14/15
Avg. Annual % Change, ‘09/10 - ‘14/15
Avg. Annual % Change, ‘04/05 - ‘14/15
% Change, ‘13/14 - ‘14/15
Avg. Annual % Change, ‘09/10 - ‘14/15
Avg. Annual % Change, ‘04/05 - ‘14/15
Total 0.5% 1.1% 2.4% 1.8% 1.9% 2.6% -0.5% 0.5% 2.4%
Arts & Humanities -1.4% -0.5% 0.8% -2.9% 0.1% 1.3% -0.4% -0.9% 0.6%
Bio. & Agric. Sci. 1.8% 5.5% 5.6% 1.2% 5.1% 5.5% 2.8% 6.0% 5.8%
Business -3.1% 1.3% 2.7% -3.3% 0.7% 2.0% -3.3% 2.1% 3.9%
Education -6.2% -3.7% -1.4% -6.4% -3.2% -1.4% -5.9% -3.8% -1.4%
Engineering 8.4% 5.8% 4.1% 7.5% 4.9% 3.6% 11.5% 8.8% 4.9%
Health Sciences -2.3% 7.4% 9.4% -1.8% 9.4% 7.5% -2.4% 6.9% 9.9%
Math & Comp. Sci. 22.2% 11.2% 5.6% 21.8% 10.6% 5.4% 23.1% 13.1% 6.0%
Physical & Earth Sci. 1.0% 3.3% 2.1% 0.6% 4.0% 2.3% 1.0% 2.3% 1.9%
Public Admin. & Svcs. 3.7% 4.7% 3.9% -3.6% 4.4% 3.1% 5.9% 4.9% 4.2%
Social & Behav. Sci. -2.4% 1.5% 2.5% -5.8% 2.0% 2.7% -0.4% 1.1% 2.4%
Other Fields -0.4% 0.7% 1.4% 1.7% 1.9% 1.8% -1.7% 0.0% 1.3%
Note: See Appendix B for the survey taxonomy. Source: CGS/GRE Survey of Graduate Enrollment and Degrees

Graduate Enrollment and Degrees: 2005 to 2015 67
Table C.30: Doctoral Degrees Awarded by Broad Field and Gender, 2004-05 to 2014-15Total Men Women
Broad Field % Change, ‘13/14 - ‘14/15
Avg. Annual % Change, ‘09/10 - ‘14/15
Avg. Annual % Change, ‘04/05 - ‘14/15
% Change, ‘13/14 - ‘14/15
Avg. Annual % Change, ‘09/10 - ‘14/15
Avg. Annual % Change, ‘04/05 - ‘14/15
% Change, ‘13/14 - ‘14/15
Avg. Annual % Change, ‘09/10 - ‘14/15
Avg. Annual % Change, ‘04/05 - ‘14/15
Total 3.5% 4.4% 5.3% 4.5% 4.7% 4.2% 2.6% 4.3% 6.4%
Arts & Humanities 2.2% 2.5% 2.7% -0.2% 3.5% 2.7% 3.4% 1.7% 2.7%
Bio. & Agric. Sci. 2.0% 0.9% 4.6% 0.7% 2.2% 2.8% 3.1% -0.2% 6.6%
Business 6.2% 6.4% 5.0% 1.6% 4.3% 4.7% 13.8% 9.1% 5.6%
Education 0.1% 3.2% 2.8% 3.9% 3.2% 1.9% -1.8% 3.3% 3.4%
Engineering 3.3% 6.4% 5.2% 2.4% 6.2% 4.7% 7.1% 7.3% 7.4%
Health Sciences 5.6% 10.5% 16.0% 10.2% 12.8% 11.3% 3.7% 9.5% 18.7%
Math & Comp. Sci. -3.5% 5.5% 5.7% -2.3% 4.2% 5.6% -7.5% 9.1% 5.4%
Physical & Earth Sci. 1.1% 2.8% 3.7% 0.4% 2.3% 2.5% 3.1% 4.2% 6.4%
Public Admin. & Svcs. 0.0% 2.4% 2.6% -5.3% 0.4% 4.0% 4.1% 4.5% 2.4%
Social & Behav. Sci. 0.5% 1.6% 1.5% 2.8% 1.5% 1.3% -0.7% 2.0% 1.7%
Other Fields 13.7% 8.1% 2.6% 15.3% 9.6% 2.6% 13.0% 7.0% 2.9%
Note: See Appendix B for the survey taxonomy. Source: CGS/GRE Survey of Graduate Enrollment and Degrees

68 Council of Graduate Schools

Graduate Enrollment and Degrees: 2005 to 2015 69
ARTS AND HUMANITIESArts – History, Theory, and Criticism Art History, Criticism, and
ConservationEthnomusicologyMusic History, Literature, and
TheoryMusicologyTheatre Literature, History and
CiticismArts – History, Theory, and
Criticism, Other
Arts – Performance and Studio Arts, Entertainment, and Media
Management Crafts/Craft DesignDance Design and Applied ArtsDrama/Theatre Arts Film/Video and Photographic
ArtsFine and Studio Arts Music Arts – Performance and Studio,
Other
English Language and LiteratureAmerican Literature English Language and LiteratureEnglish Literature Rhetoric and Composition/
Writing Studies English Language and
Literatures, Other
Foreign Languages and Literatures African Languages and
LiteraturesAmerican Sign LanguageAsiatic Languages and
LiteraturesCeltic Languages and
LiteraturesClassics and Classical Languages
and LiteraturesGermanic Languages and
LiteraturesIranian/Persian Languages and
LiteraturesModern Greek Language and
LiteratureRomance Languages and
LiteraturesSlavic, Baltic, and Albanian
Languages and LiteraturesForeign Languages and
Literatures, Other
History American History European History History and Philosophy of
Science and TechnologyHistory, GeneralHistory, Other
Philosophy EthicsLogicPhilosophy Philosophy, Other
Arts and Humanities, OtherLinguistic, Comparative, and
Related Language Studies and Services
Humanities/Humanistic StudiesLiberal Arts and Sciences/
Liberal ArtsArts and Humanities, Other
BIOLOGICAL AND AGRICULTURAL SCIENCESAgriculture, Natural Resources, and Conservation Agricultural and Domestic
Animal ServicesAgricultural and Food Products
ProcessingAgricultural Business and
ManagementAgricultural Economics Agricultural MechanizationAgricultural ProductionAgricultural Public ServicesAgriculture, GeneralAgronomyAnimal SciencesApplied HorticultureFishing and Fisheries Sciences
and ManagementFood Science and TechnologyForestryHorticultural Business ServicesInternational AgricultureNatural Resources and
ConservationNatural Resources Management
and PolicyParks, Recreation, and Leisure
Facilities ManagementParks, Recreation, and Leisure
StudiesPlant Sciences
APPENDIX DTaxonomy of Fields of Study

70 Council of Graduate Schools
Soil SciencesWildlife and Wildlands Science
and ManagementAgriculture, Natural Resources,
and Conservation, Other
Biological and Biomedical SciencesAnatomical SciencesAnimal BiologyBacteriologyBiochemistryBioinformaticsBiology, GeneralBiomathematicsBiometryBiophysicsBiotechnologyBotany/Plant BiologyCell/Cellular BiologyComputational BiologyDevelopmental BiologyEcologyEntomologyEpidemiologyEvolutionGeneticsImmunologyMicrobiological SciencesMolecular BiologyMolecular MedicineNeurosciencesParasitology PathologyPharmacologyPhysiologyPopulation BiologySystematicsToxicologyZoologyBiological and Biomedical
Sciences, Other
BUSINESSAccountingAccounting Auditing Taxation
Banking and FinanceBanking and Financial Support
ServicesCredit ManagementFinancial Planning and ServicesInternational FinanceInvestments and Securities Public Finance
Business Administration and ManagementBusiness Administration and
ManagementBusiness OperationsBusiness/Commerce, GeneralConstruction ManagementE-Commerce Entrepreneurship Hospitality Administration/
Management Human Resources Development Human Resources ManagementLabor and Industrial Relations Logistics and Supply Chain
Management Operations Management Organizational Leadership Organizational ManagementProject ManagementSmall Business OperationsSport and Fitness
Administration/ManagementTelecommunications
ManagementBusiness Administration and
Management, Other
Business, OtherBusiness StatisticsBusiness/Corporate
CommunicationsBusiness/Managerial EconomicsInsurance International Business Management Information
Systems Management Science MarketingMarketing ManagementMerchandisingReal Estate
SalesBusiness Fields, Other
EDUCATION Education AdministrationEducational Administration Educational Leadership Educational Supervision
Curriculum and InstructionCurriculum and Instruction
Early Childhood EducationEarly Childhood Education and
TeachingKindergarten/Preschool
Education and Teaching
Elementary EducationElementary Education and
TeachingElementary-Level Teaching
Fields
Educational Assessment, Evaluation, and ResearchEducational Assessment,
Testing, and Measurement Educational Evaluation and
ResearchEducational Psychology Educational Statistics and
Research MethodsLearning SciencesSchool Psychology
Higher EducationHigher Education Higher Education
Administration
Secondary EducationSecondary Education and
TeachingSecondary-Level Teaching Fields

Graduate Enrollment and Degrees: 2005 to 2015 71
Special EducationEducation/Teaching of Students
w/ Specific DisabilitiesEducation/Teaching of Students
w/ Specific Learning Disabilities
Education/Teaching of the Gifted and Talented
Special Education and TeachingOther Special Education Fields
Student Counseling and Personnel ServicesCollege Student Counseling and
Personnel Services Counselor EducationSchool Counseling and Guidance
ServicesStudent Counseling and
Personnel Services, Other
Education, OtherAdult and Continuing Education Bilingual, Multilingual, and
Multicultural EducationEducation, GeneralEducational/Instructional Media
DesignHealth and Physical EducationInternational and Comparative
EducationJunior High/Middle School
Education and Teaching Outdoor EducationSocial and Philosophical
Foundations of EducationTeaching English as a Second or
Foreign Language Other Education Fields
ENGINEERINGChemical EngineeringChemical and Biomolecular
EngineeringChemical Engineering
Civil EngineeringArchitectural Engineering Civil Engineering Construction Engineering
Environmental/Environmental Health Engineering
Geotechnical and Geoenvironmental Engineering
Structural EngineeringSurveying Engineering Transportation and Highway
EngineeringWater Resources Engineering
Computer, Electrical, and Electronics EngineeringComputer Engineering Computer Hardware
EngineeringComputer Software EngineeringElectrical Engineering Electronics EngineeringLaser and Optical Engineering Telecommunications
Engineering
Industrial EngineeringIndustrial Engineering Manufacturing EngineeringOperations Research
Materials EngineeringCeramic Sciences and
Engineering Materials EngineeringMaterials Science Metallurgical Engineering Polymer/Plastics Engineering
Mechanical EngineeringEngineering Mechanics Mechanical Engineering
Engineering, OtherAeronautical Engineering Aerospace Engineering Agricultural Engineering Biochemical EngineeringBiomedical/Medical Engineering Electromechanical EngineeringEngineering ChemistryEngineering Physics Engineering Science Forest EngineeringGeological/Geophysical
Engineering Mining and Mineral Engineering Naval Architecture and Marine
Engineering Nuclear EngineeringOcean EngineeringPaper Science and EngineeringPetroleum Engineering Systems Engineering Textile Sciences and Engineering Engineering, Other
HEALTH AND MEDICAL SCIENCESAllied HealthAlternative and Complementary
MedicineAudiology Bioethics/Medical EthicsChiropractic (excluding D.C. and
D.C.M.)Clinical/Medical Laboratory
Science/ResearchCommunication Disorders
Sciences and ServicesDentistry and Oral Sciences
(excluding D.D.S. and D.M.D.) Dietetics and Clinical Nutrition
ServicesEnvironmental Health Exercise ScienceHealth and Medical
Administrative ServicesHealth SciencesHealth/Medical Preparatory
ProgramsKinesiologyMedical Sciences (excluding M.D.)Mental and Social Health
ServicesNursing Nutrition SciencesOccupational TherapyOptometry (excluding O.D.)Osteopathic Medicine (excluding
D.O.)Pharmaceutical Sciences
(excluding Pharm.D.)Physical TherapyPhysician AssistantPodiatry (excluding D.P.M., D.P.
and Pod.D.)

72 Council of Graduate Schools
Public Health Rehabilitation and TherapySpeech-Language Pathology Veterinary Biomedical and
Clinical Science Veterinary Medicine (excluding
D.V.M.)Health and Medical Sciences,
Other
MATHEMATICS AND COMPUTER SCIENCES Mathematical SciencesActuarial Science Applied Mathematics Mathematics ProbabilityStatistics Mathematical Sciences, Other
Computer and Information SciencesComputer and Information
Sciences, GeneralComputer Programming Computer ScienceComputer Software and Media
ApplicationsComputer Systems AnalysisComputer Systems Networking
and TelecommunicationsComputer/Information
Technology Administration and Management
Data Processing Information Sciences/StudiesMicrocomputer Applications Computer and Information
Sciences, Other
PHYSICAL AND EARTH SCIENCES ChemistryAnalytical Chemistry Chemical PlasticsChemistry, General Environmental ChemistryForensic ChemistryInorganic ChemistryMedicinal and Pharmaceutical
Chemistry
Organic Chemistry Physical Chemistry Polymer Chemistry Theoretical ChemistryChemistry, Other
Earth, Atmospheric, and Marine SciencesAquatic Biology/LimnologyAtmospheric SciencesBiological OceanographyEarth SciencesGeochemistryGeological SciencesGeophysics and SeismologyGeosciencesHydrologyMarine BiologyMarine SciencesMeteorology Oceanography Paleontology Earth, Atmospheric, and Marine
Sciences, Other
Physics and AstronomyAcousticsAstronomy Astrophysics Atomic/Molecular Physics Condensed Matter and Materials
PhysicsElementary Particle Physics Nuclear Physics Optics/Optical Sciences Physics Planetary Astronomy and
Science Plasma and High-Temperature
PhysicsSolid State PhysicsTheoretical and Mathematical
Physics Physics and Astronomy, Other
Natural Sciences, OtherNatural Sciences, GeneralPhysical Sciences, GeneralScience TechnologiesNatural Sciences, Other
PUBLIC ADMINISTRATION AND SERVICESPublic AdministrationCommunity Organization and
AdvocacyPublic Administration
Social WorkSocial WorkYouth Services/AdministrationSocial Work, Other
SOCIAL AND BEHAVIORAL SCIENCES Anthropology and ArchaeologyAnthropology Archaeology
EconomicsApplied EconomicsEconometrics Economics International Economics
Political Science International Relations Political Science and
Government Public Policy Analysis
PsychologyApplied PsychologyClinical Psychology Cognitive Psychology Community Psychology Comparative Psychology Counseling Psychology Developmental and Child
Psychology Experimental PsychologyForensic PsychologyIndustrial and Organizational
PsychologyPersonality Psychology Physiological Psychology Psycholinguistics Psychology, GeneralPsychometricsPsychopharmacology

Graduate Enrollment and Degrees: 2005 to 2015 73
Quantitative PsychologyResearch and Experimental
Psychology Social Psychology Psychology, Other
SociologyDemography Rural SociologySociology
Social Sciences, OtherAdult Development and AgingArea, Ethnic, Cultural, Gender,
and Group Studies Criminal Justice/Criminology Geography and CartographyGerontology Social Sciences, GeneralUrban Studies/AffairsSocial Sciences, Other
OTHER FIELDS Architecture and Environmental DesignArchitectural History and
CriticismArchitectural Sciences and
TechnologyArchitecture City/Urban, Community and
Regional Planning Environmental Design Interior ArchitectureLandscape Architecture Real Estate DevelopmentArchitecture and Environmental
Design, Other
Communications and JournalismAdvertising Communication and Media
StudiesCommunications TechnologiesJournalismMass Communication Public Relations PublishingRadio, Television, and Digital
Communication
Speech Communication Communications and
Journalism, Other
Family and Consumer SciencesApparel and TextilesFamily and Consumer
EconomicsFamily and Consumer SciencesFamily StudiesFoods, Nutrition, and Wellness
StudiesHousing and Human
EnvironmentsHuman DevelopmentHuman SciencesWork and Family StudiesFamily and Consumer Sciences,
Other
Library and Archival SciencesArchives/Archival
AdministrationLibrary and Information ScienceLibrary and Archival Sciences,
Other
Religion and TheologyPhilosophy and Religious
Studies, GeneralReligion/Religious StudiesTheology and Religious
Vocations (excluding M.Div., M.H.L., B.D., and Ordination)
Religion and Theology, Other
Other FieldsFire ProtectionHomeland SecurityInterdisciplinary StudiesLegal Research and Professional
Studies (excluding L.L.B. and J.D.)
Military TechnologiesMultidisciplinary StudiesOther Fields Not Previously
Classified

74 Council of Graduate Schools
APPENDIX ESurvey Instrument

Graduate Enrollment and Degrees: 2005 to 2015 75

76 Council of Graduate Schools

Council of Graduate SchoolsOne Dupont Circle, NW, Suite 230Washington, DC 20036-1173(202) 223-3791 (main)
www.cgsnet.org